


Numerical Analysis of Ventilation Efficiency of a Korean Venlo-Type Greenhouse with Continuous Roof Vents

 ,
,  , ,
, ,
Abstract
:1. Introduction
2. Materials and Methods
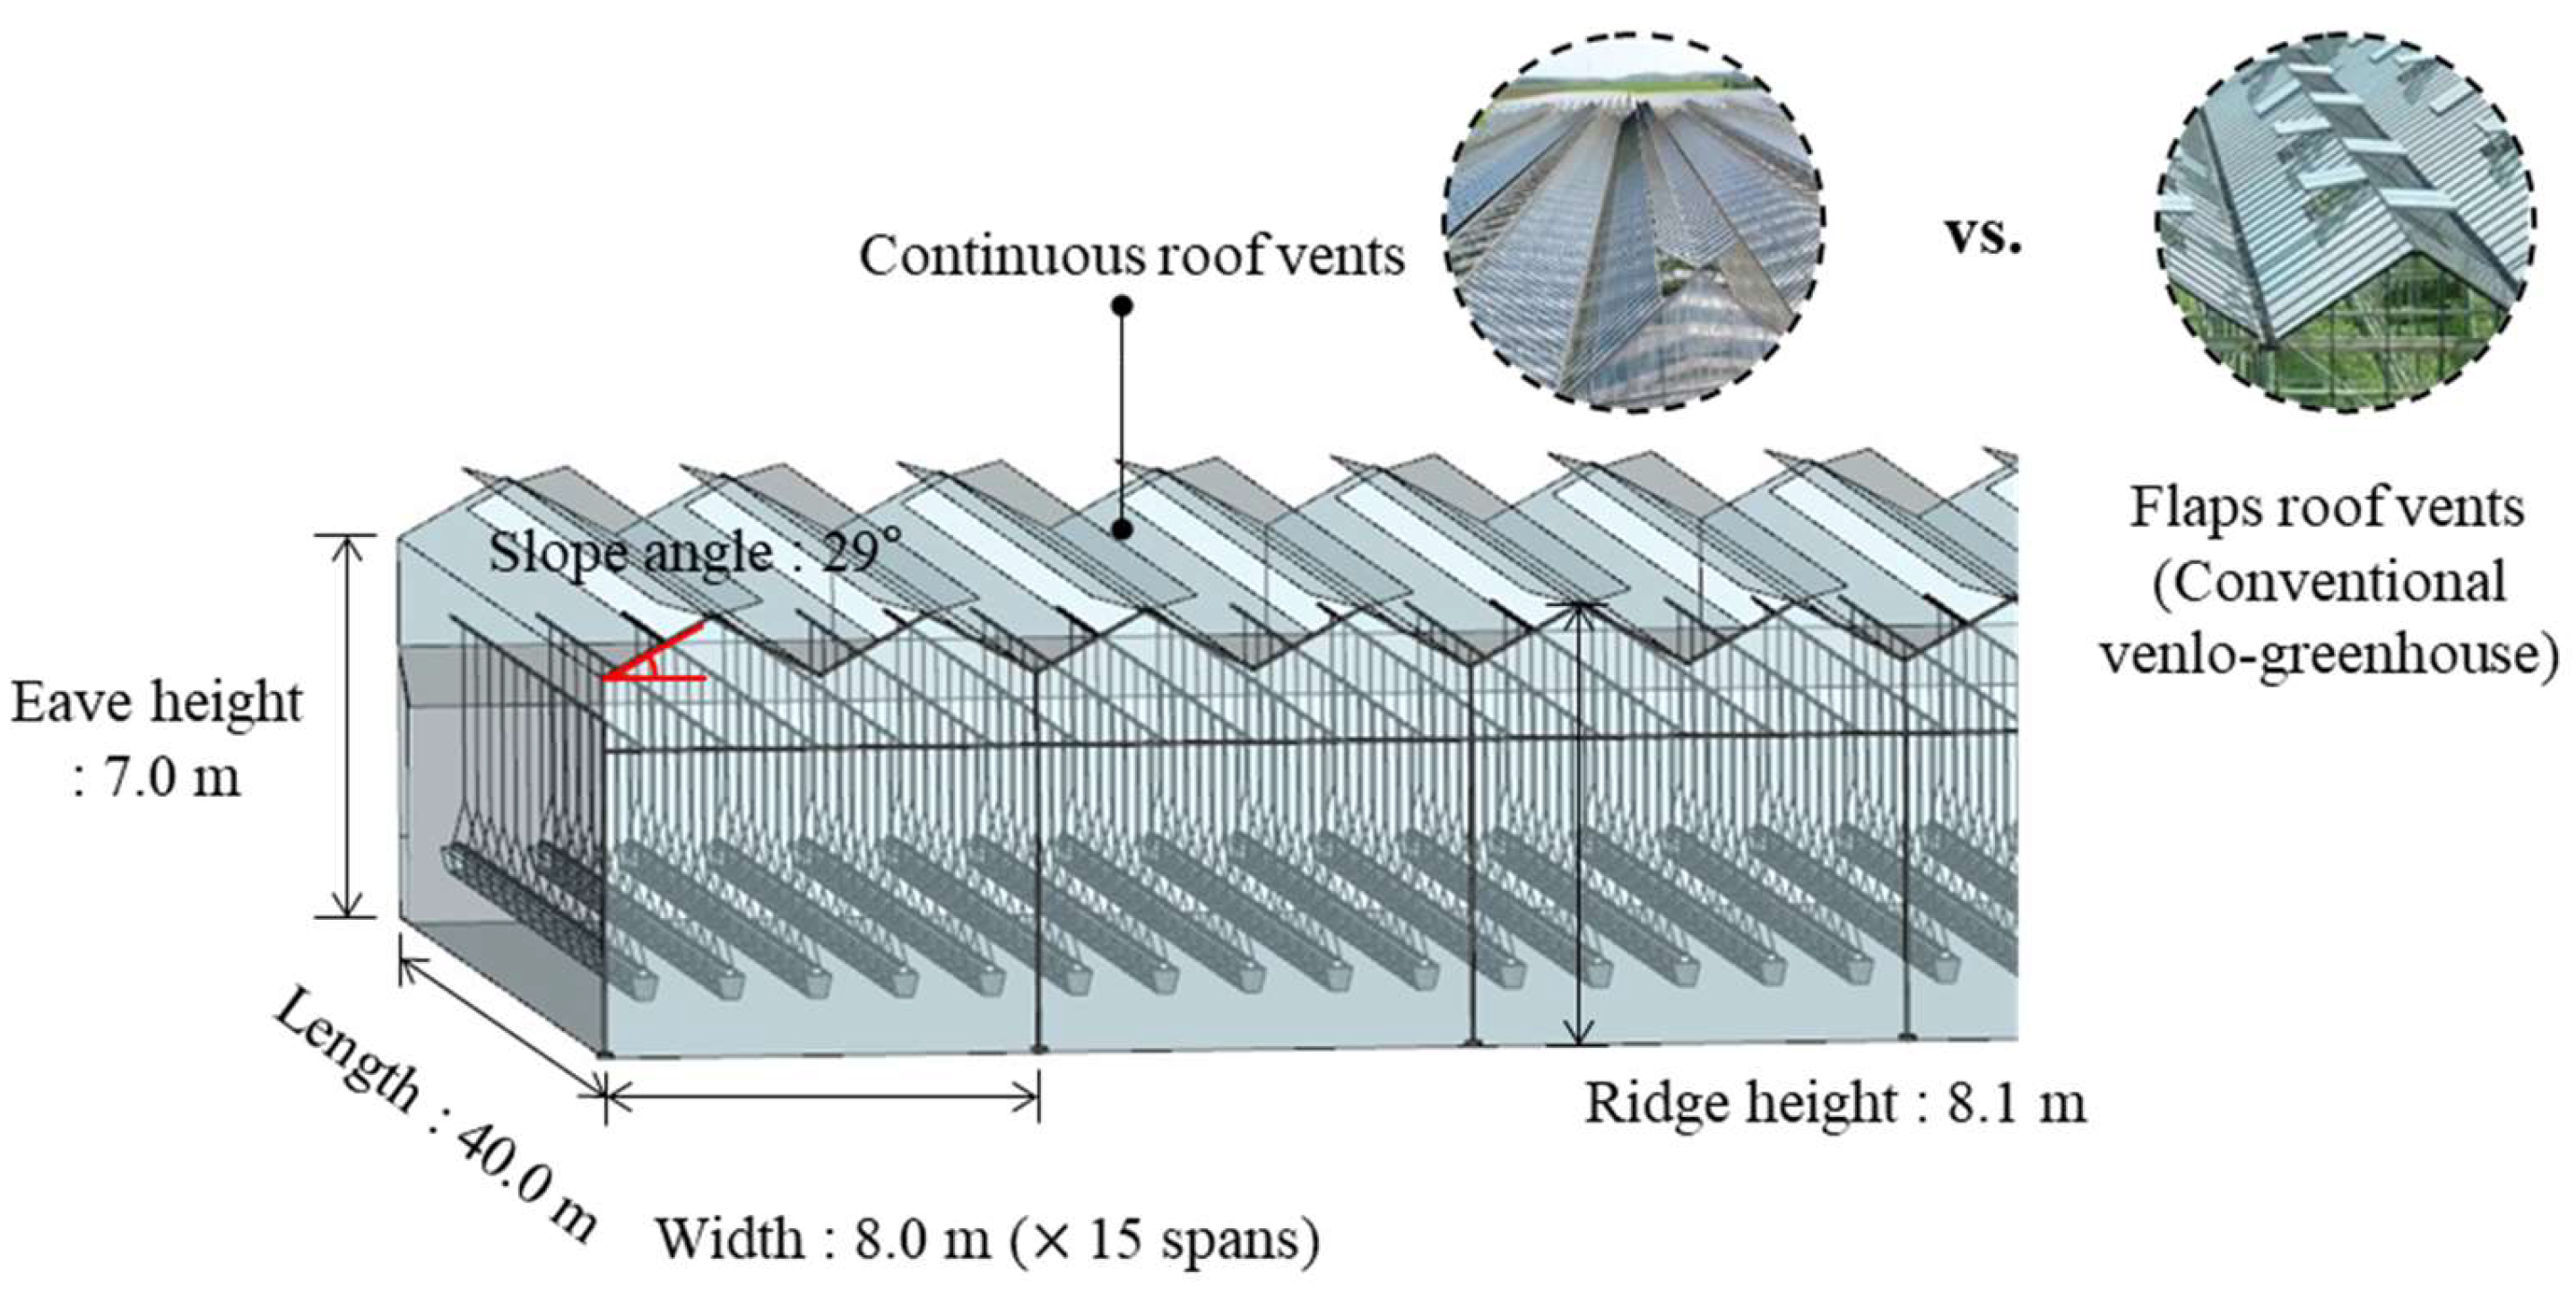
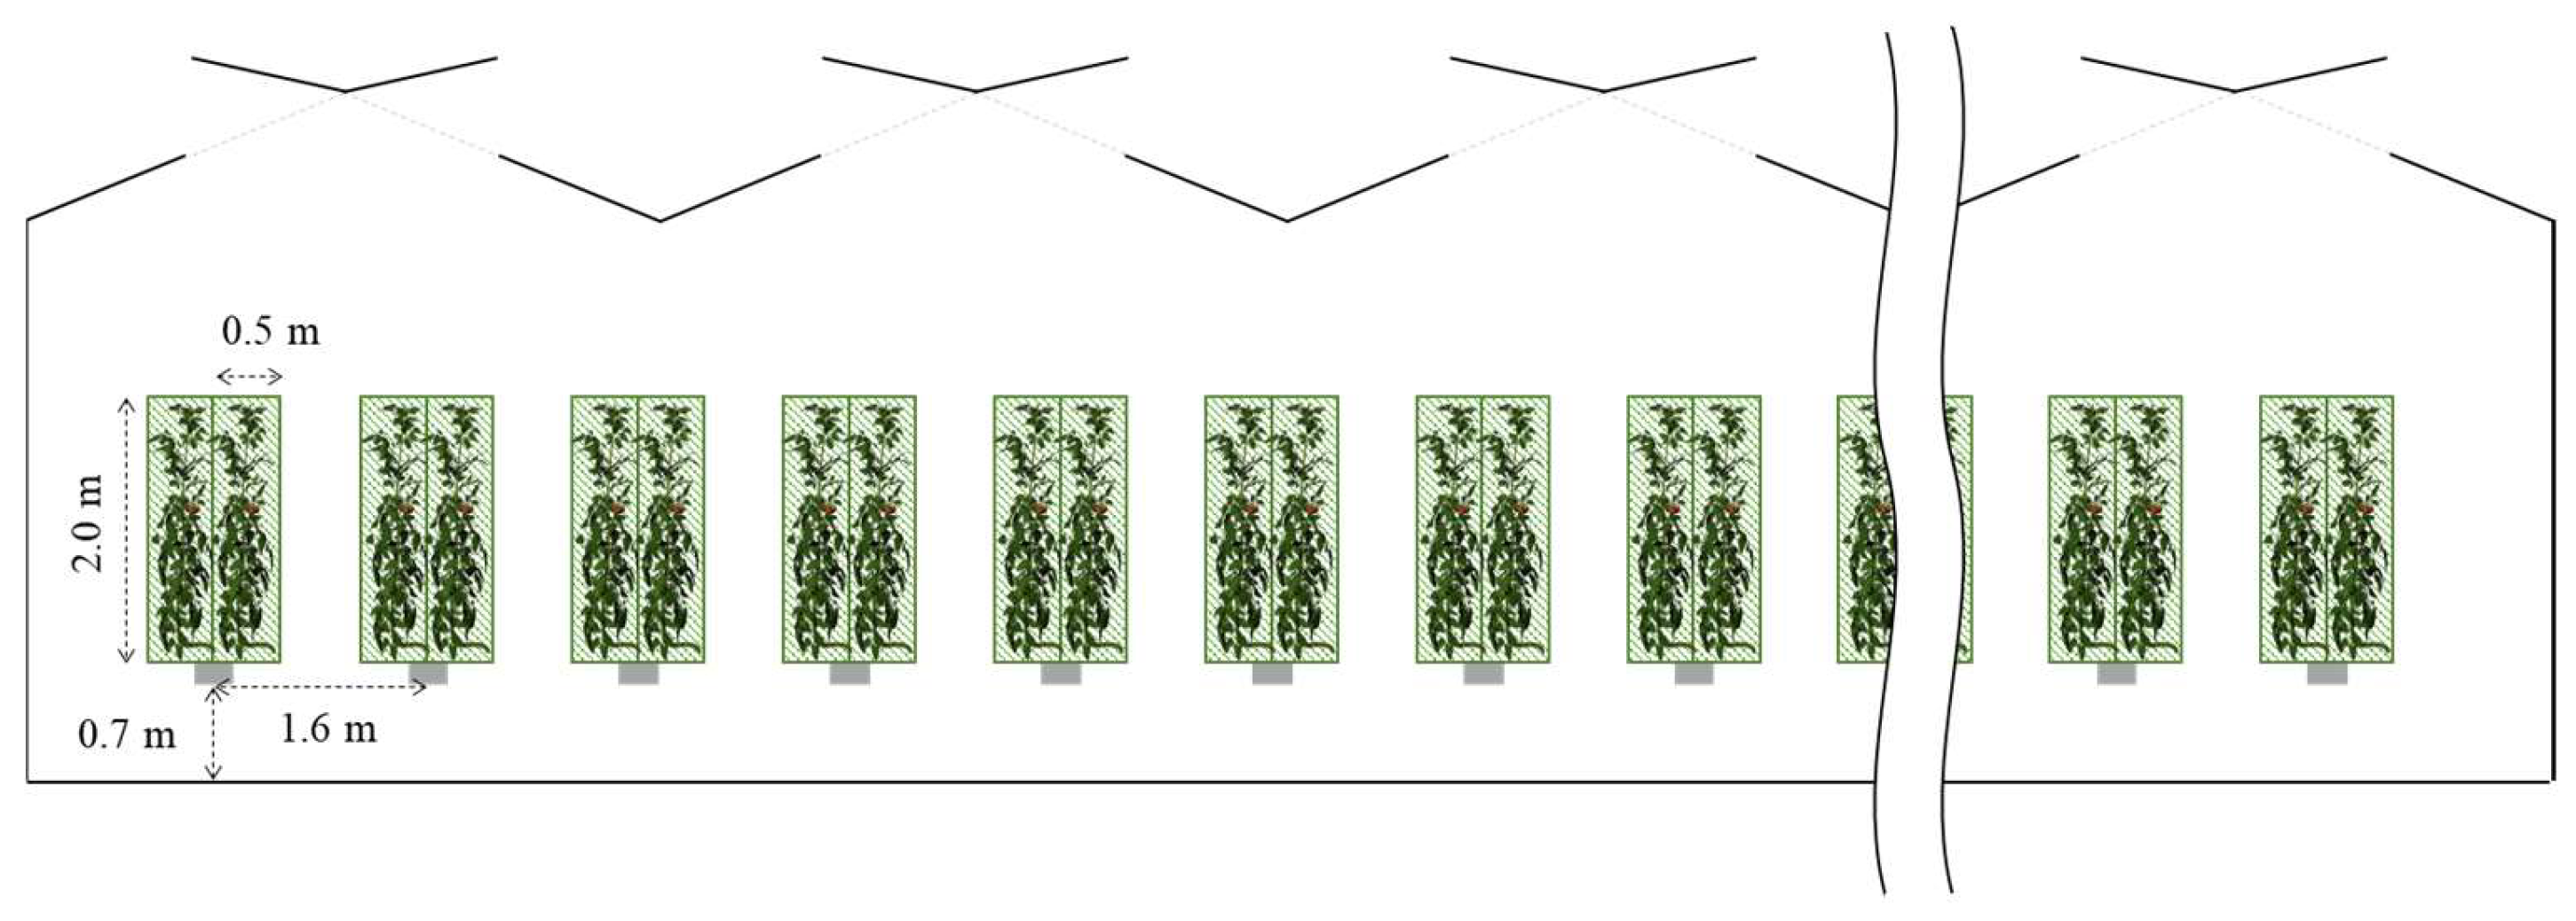
2.1. Target Greenhouse
2.2. Computational Fluid Dynamics (CFD)
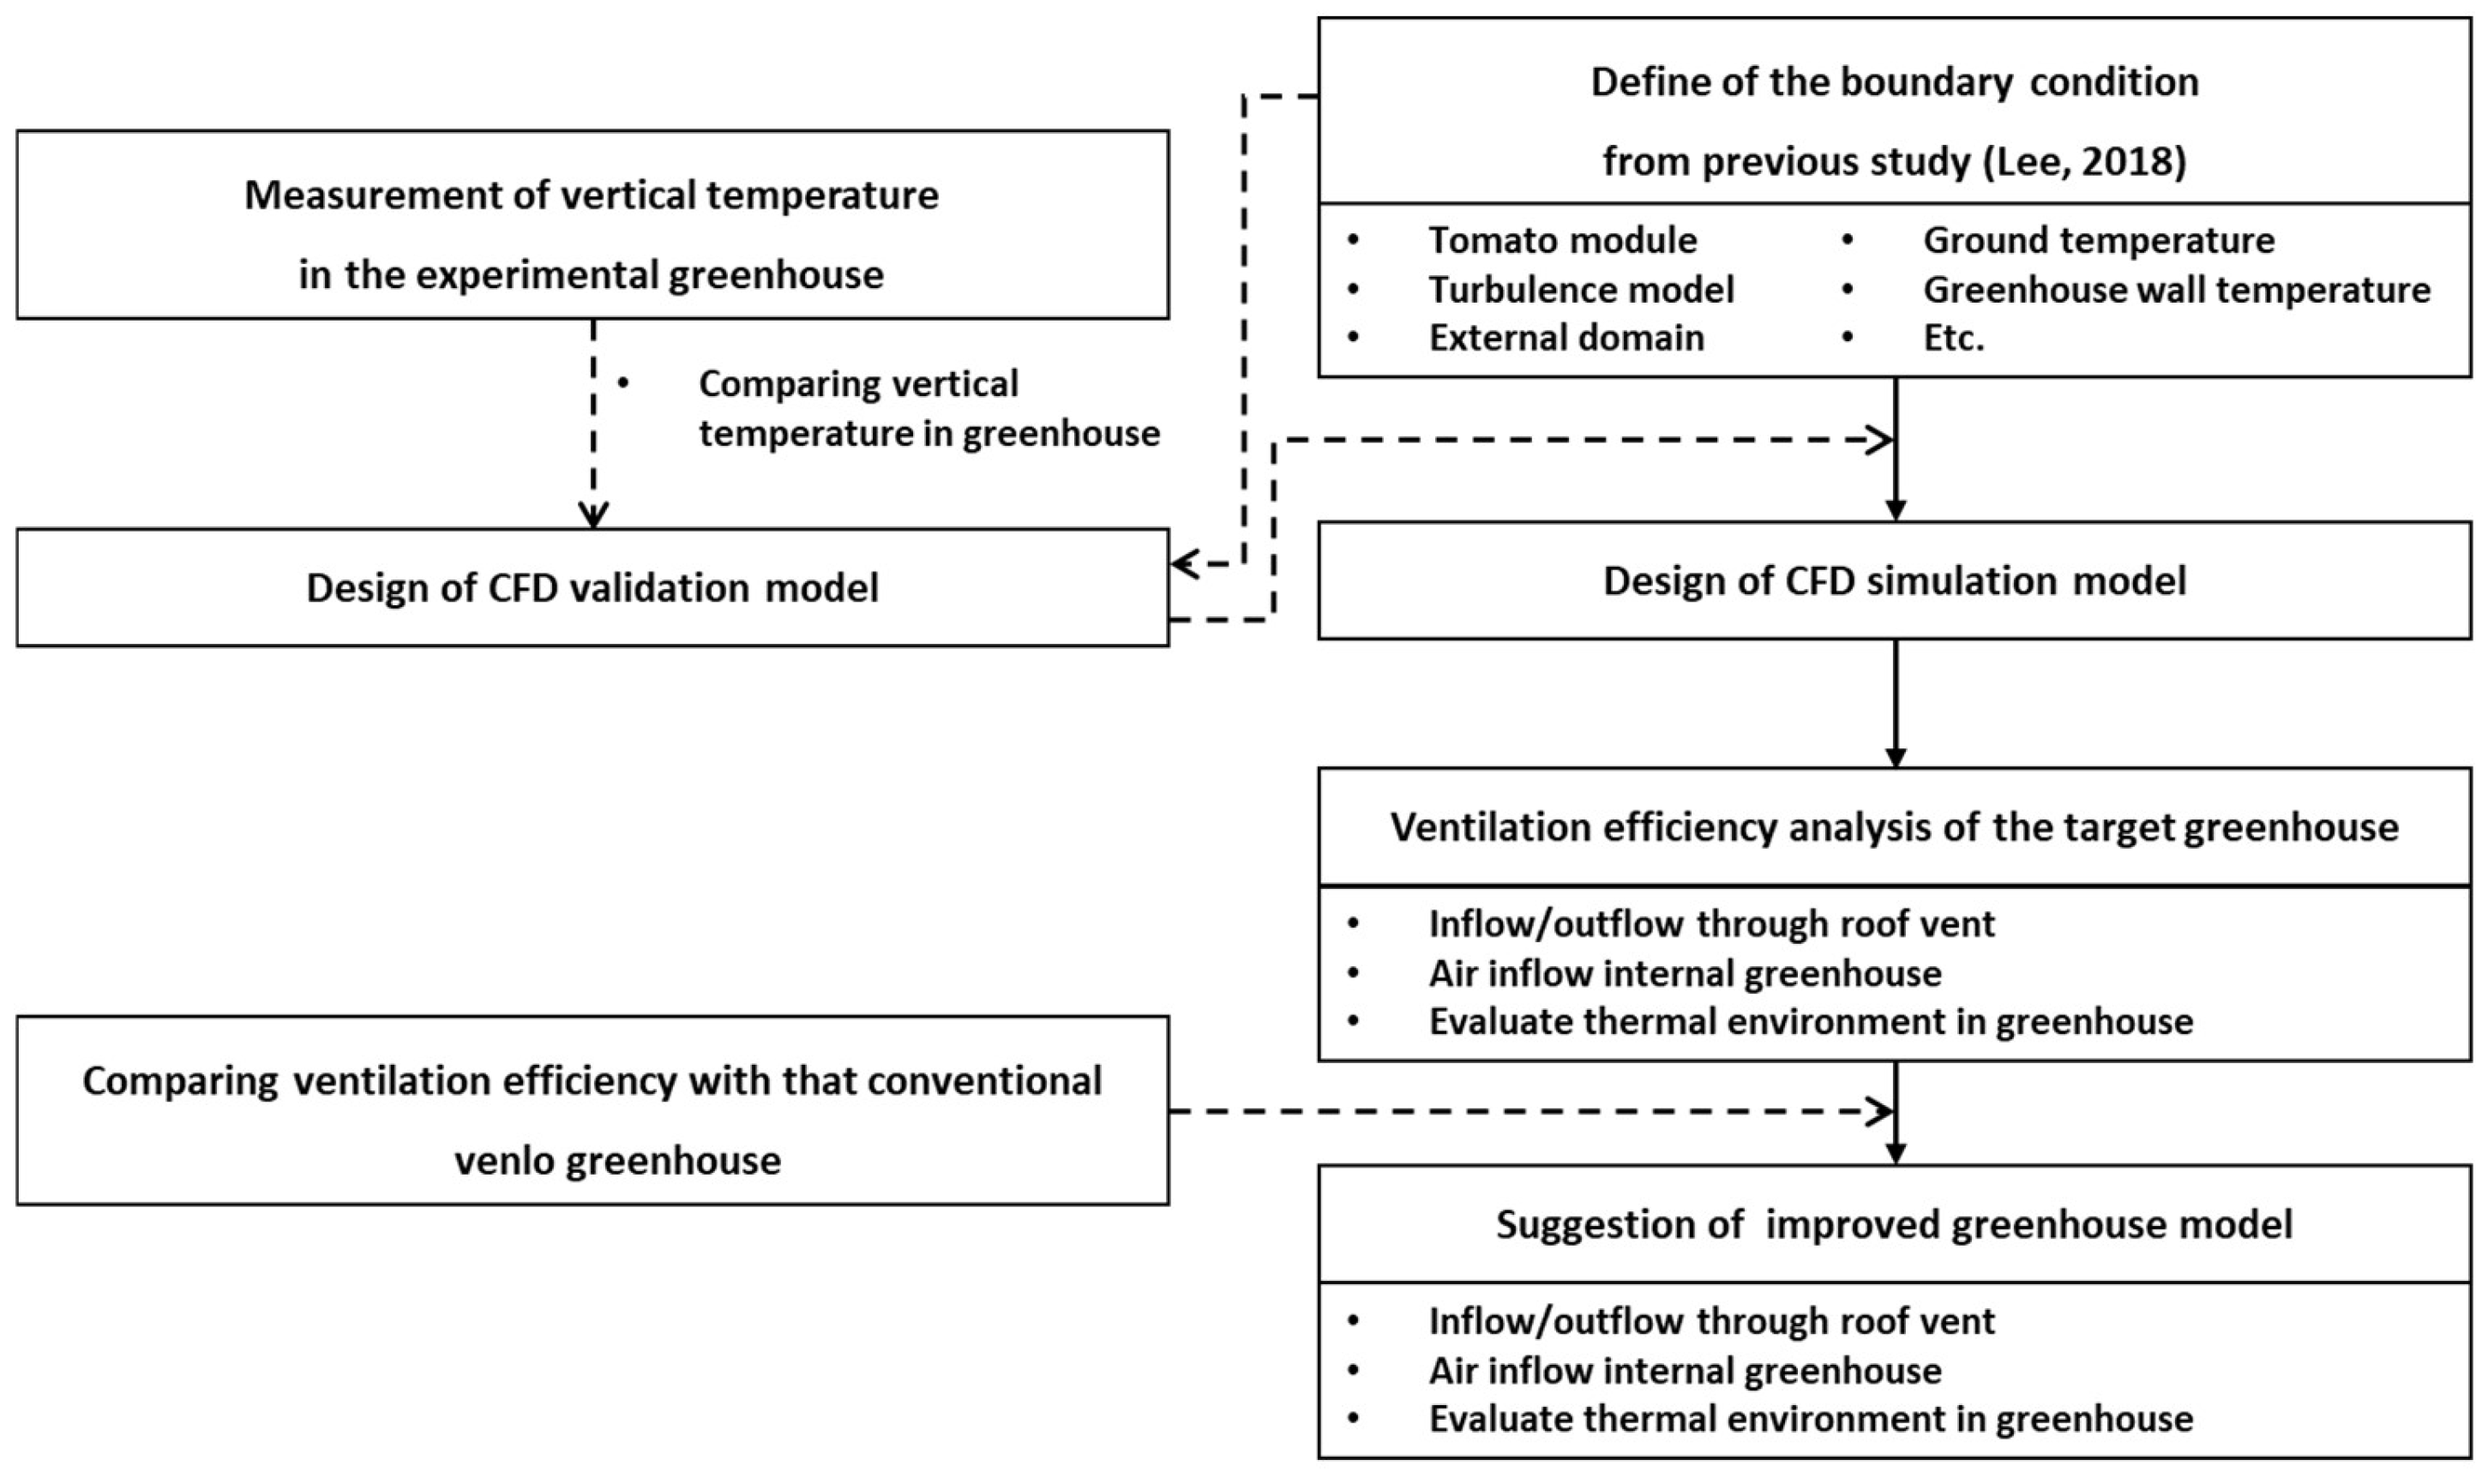
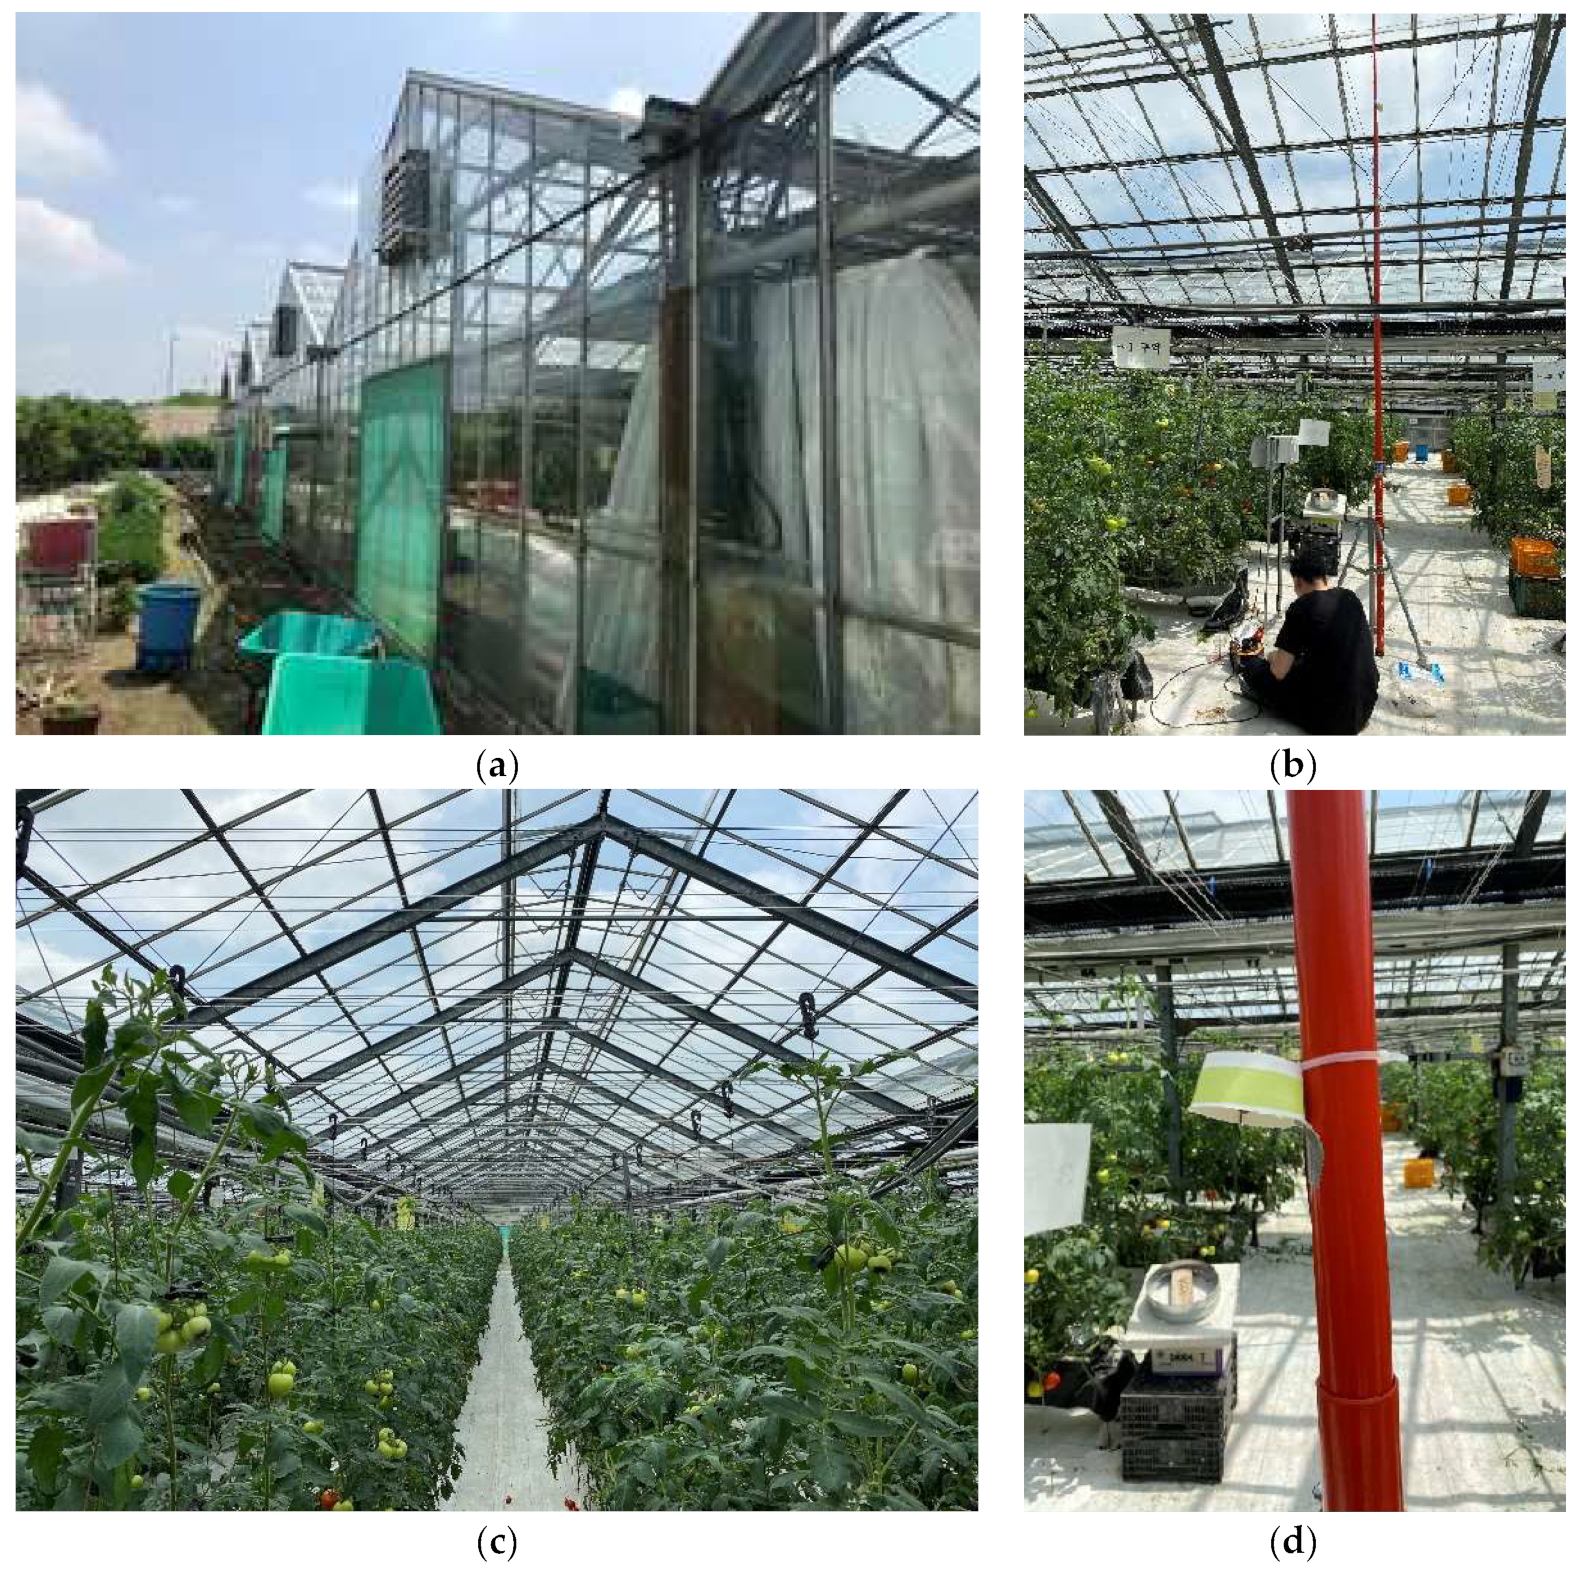
2.3. Experimental Procedure
2.3.1. Field Experiment and Modelling for Validation of the CFD Simulation Model
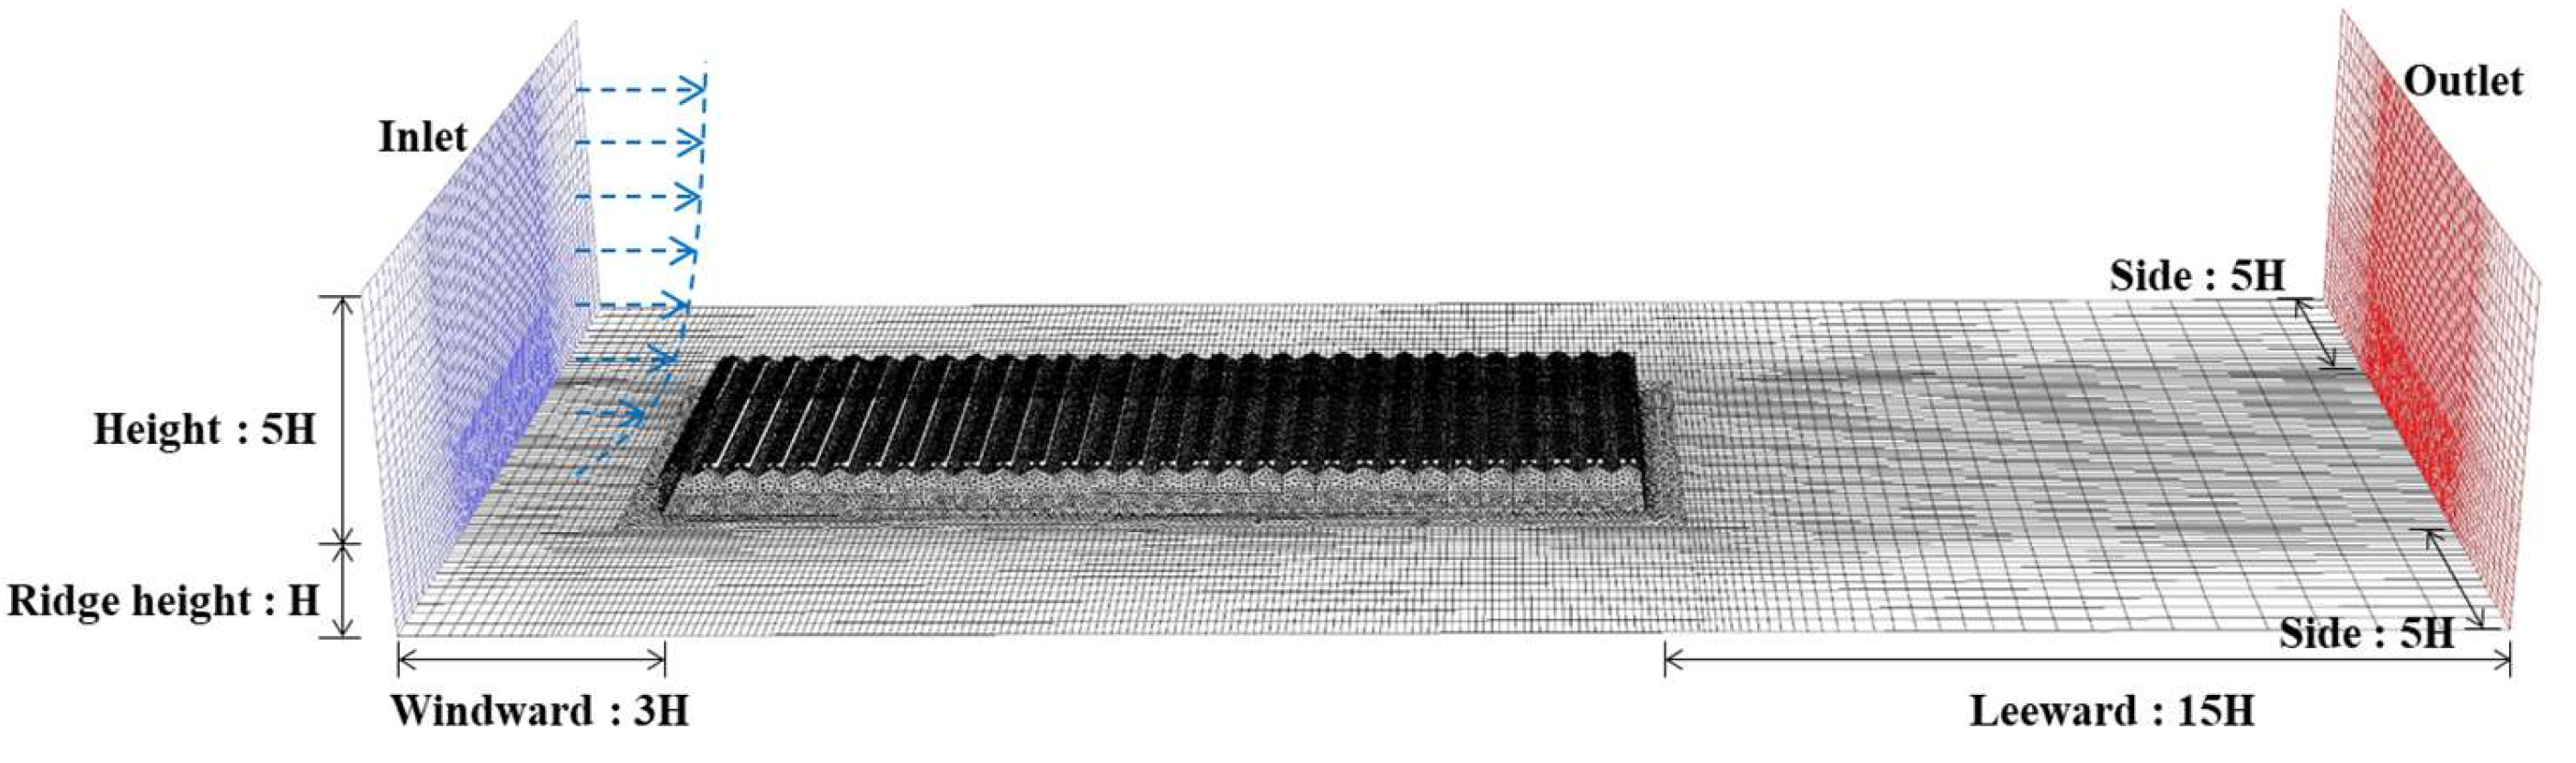
2.3.2. Design of External Domain and Wind Environment of the CFD Simulation Model
2.3.3. Boundary Conditions of the CFD Simulation Model
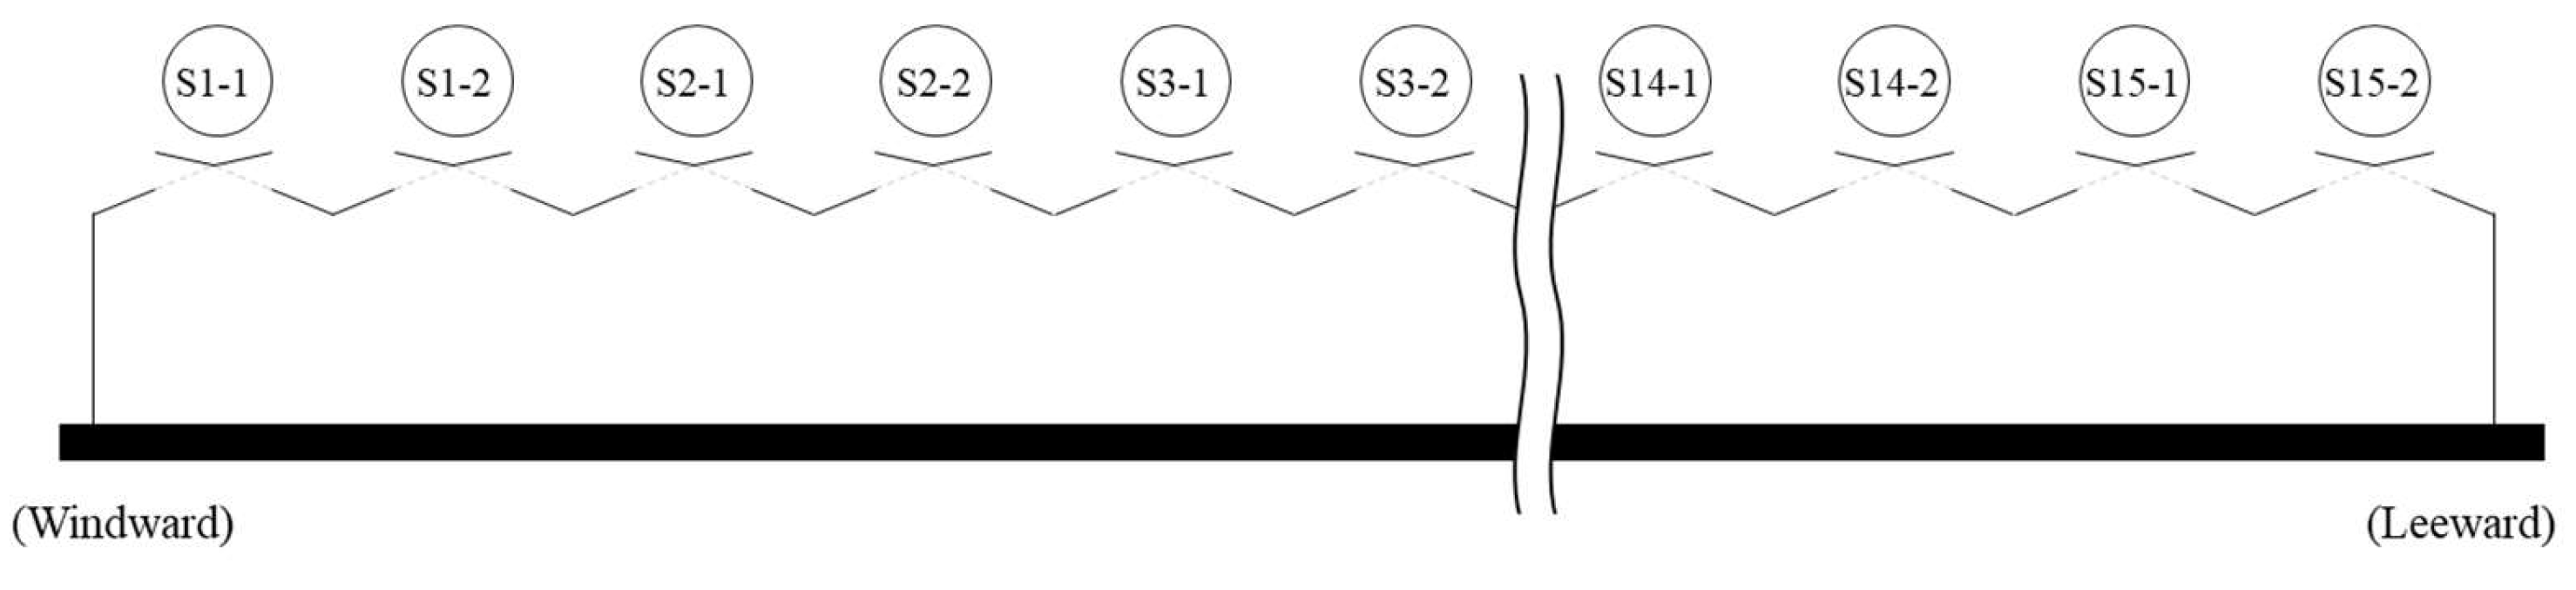
2.3.4. Analytical Conditions for Evaluation of Ventilation Efficiency
2.3.5. Evaluation of Ventilation Efficiency and Thermal Environment
3. Results
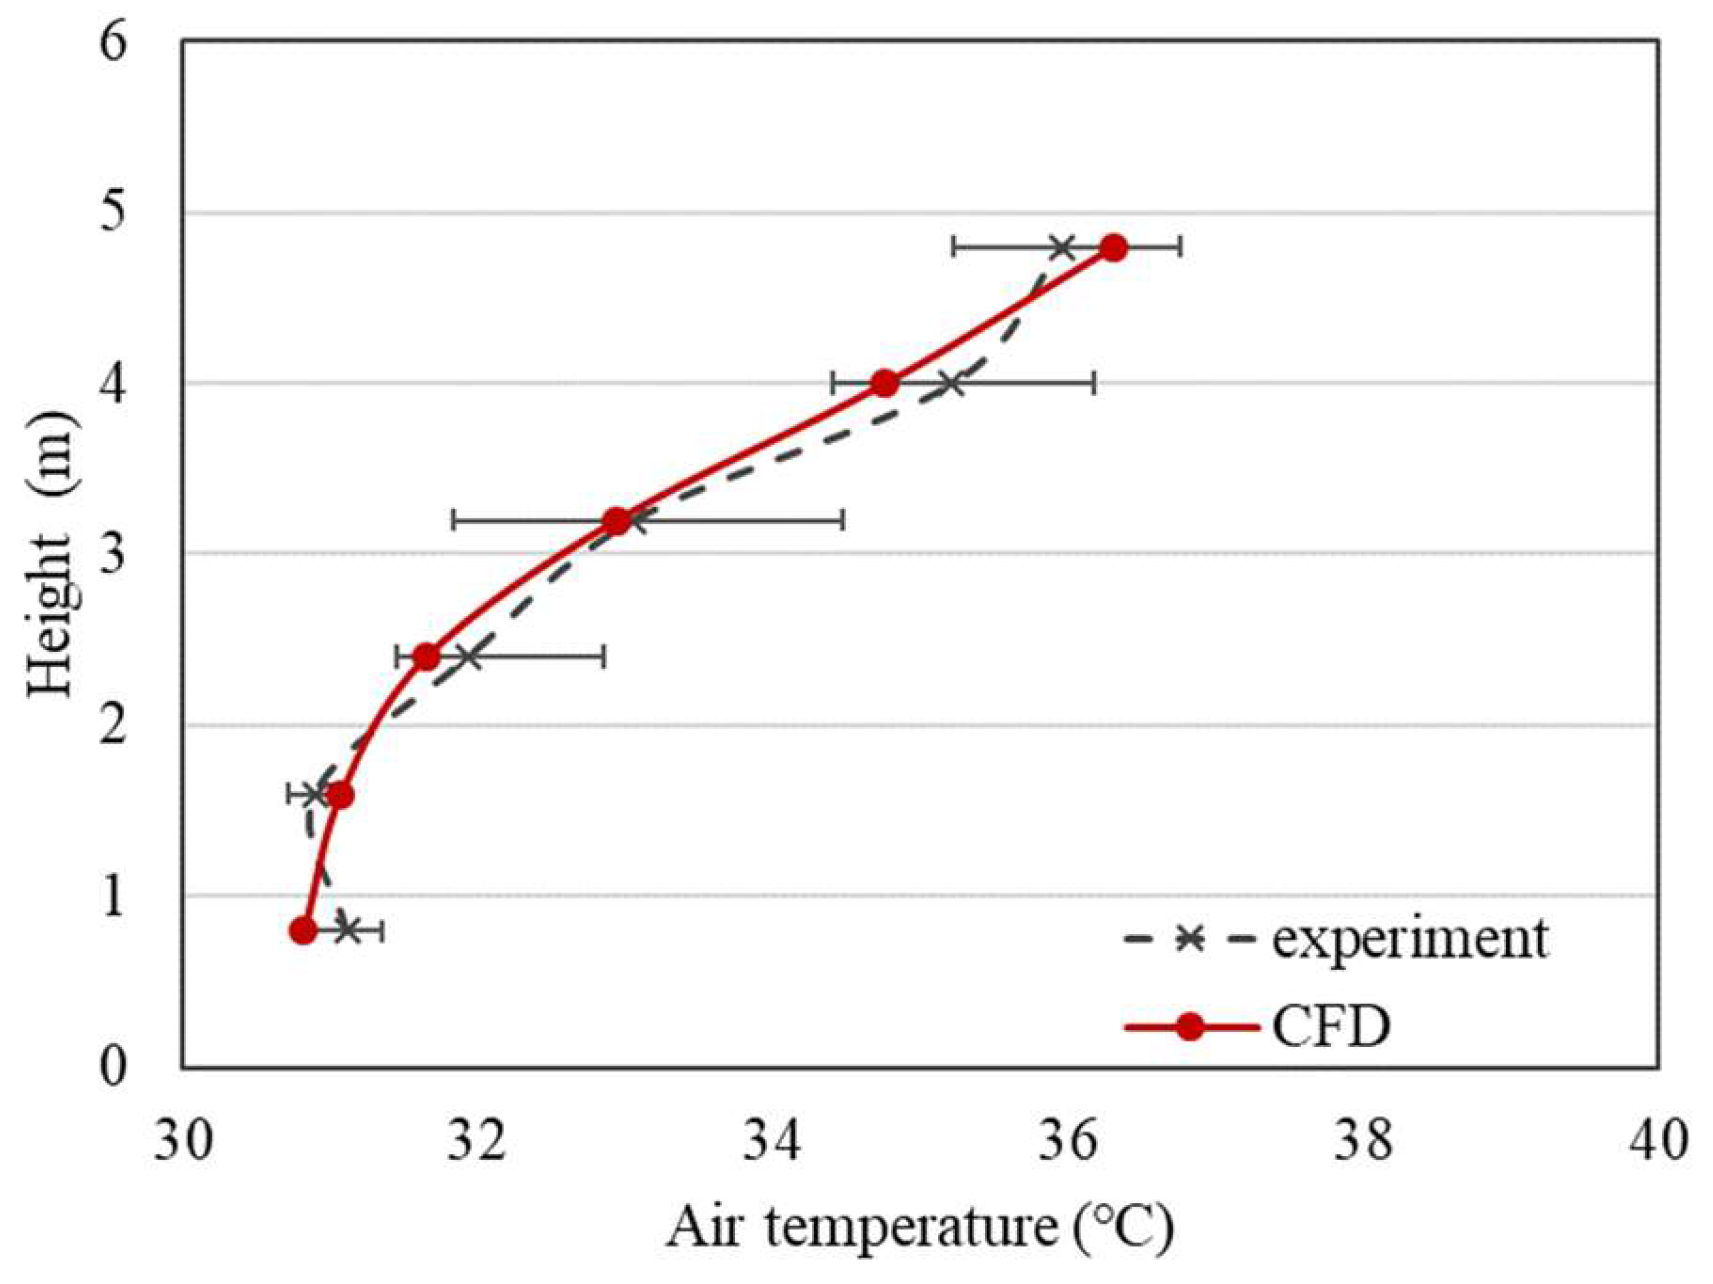
3.1. Validation of the CFD Simulation Model
3.2. Evaluation of Air Inflow and Outflow Rate through Roof Vent According to Wind Speed
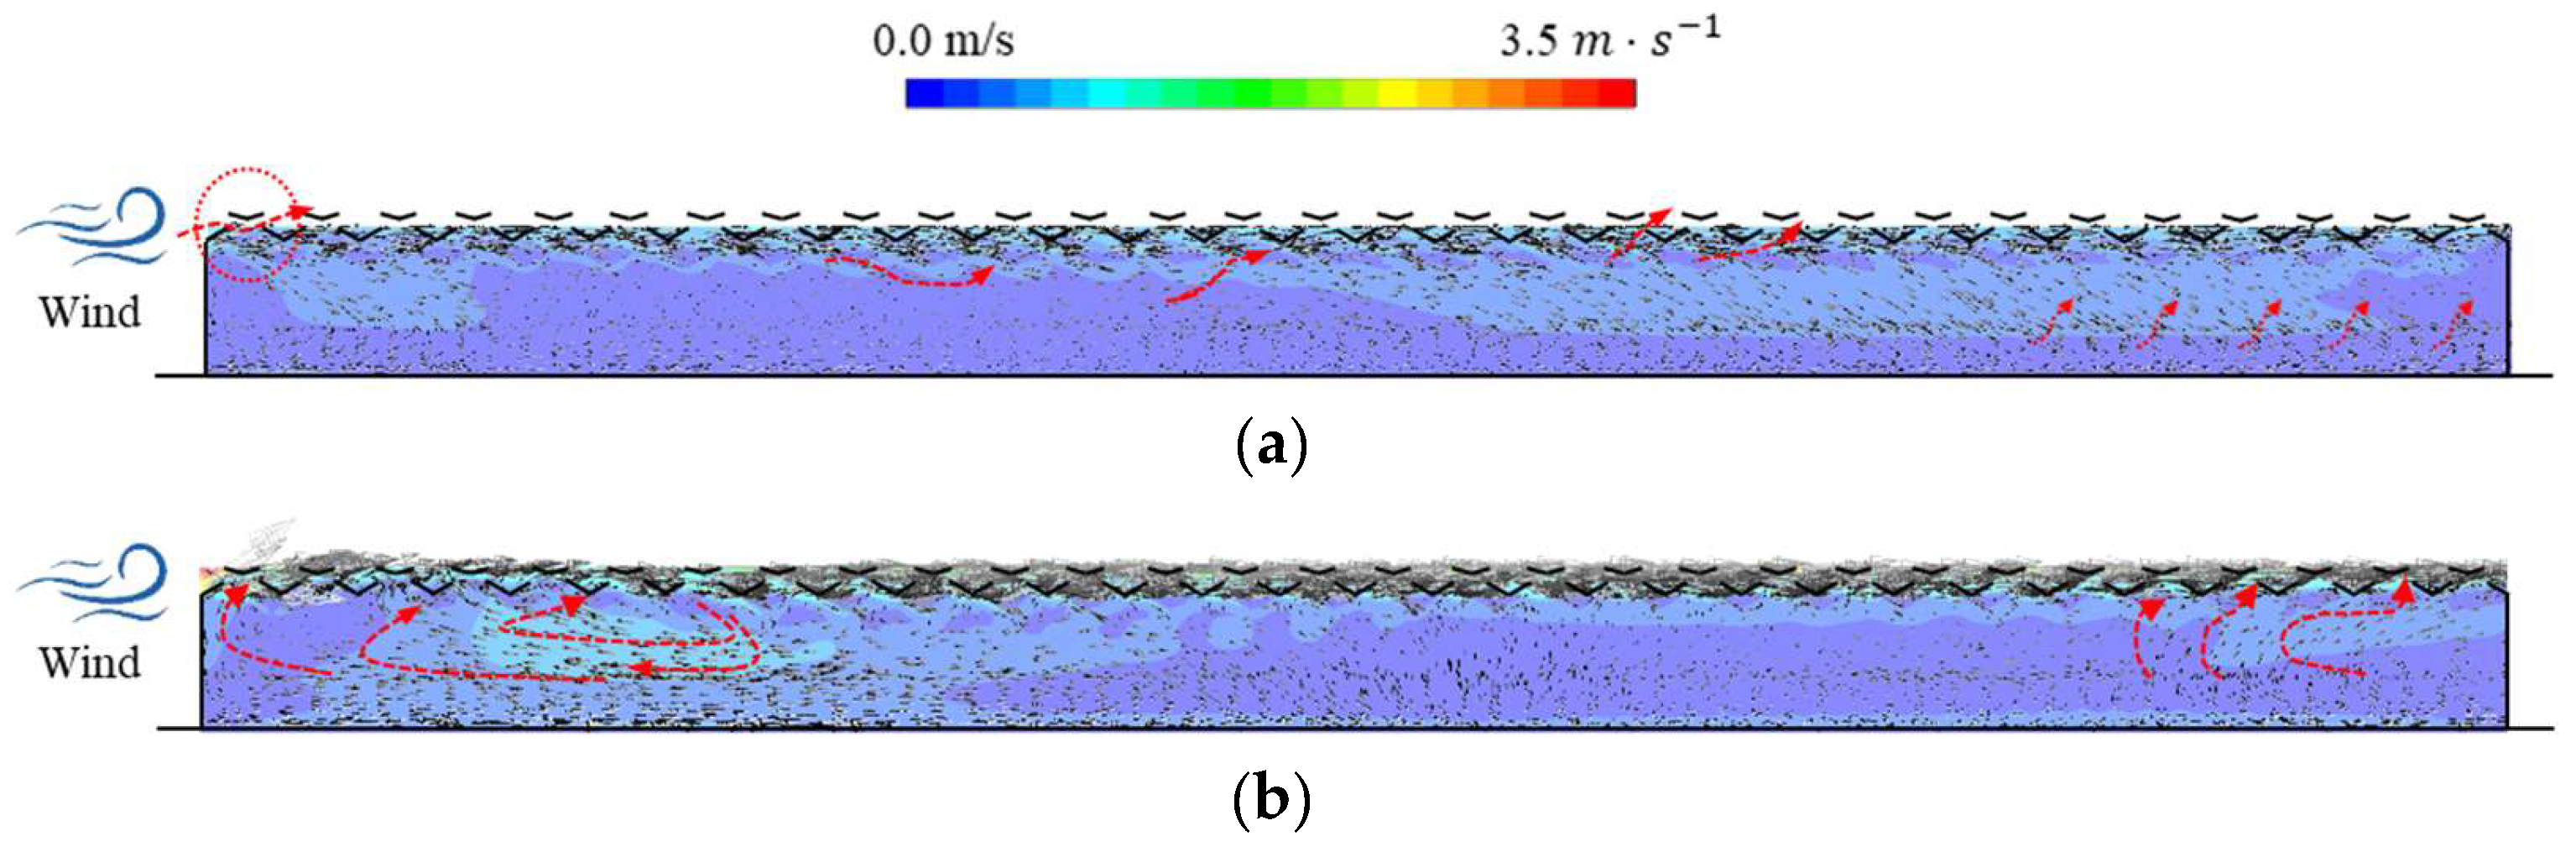
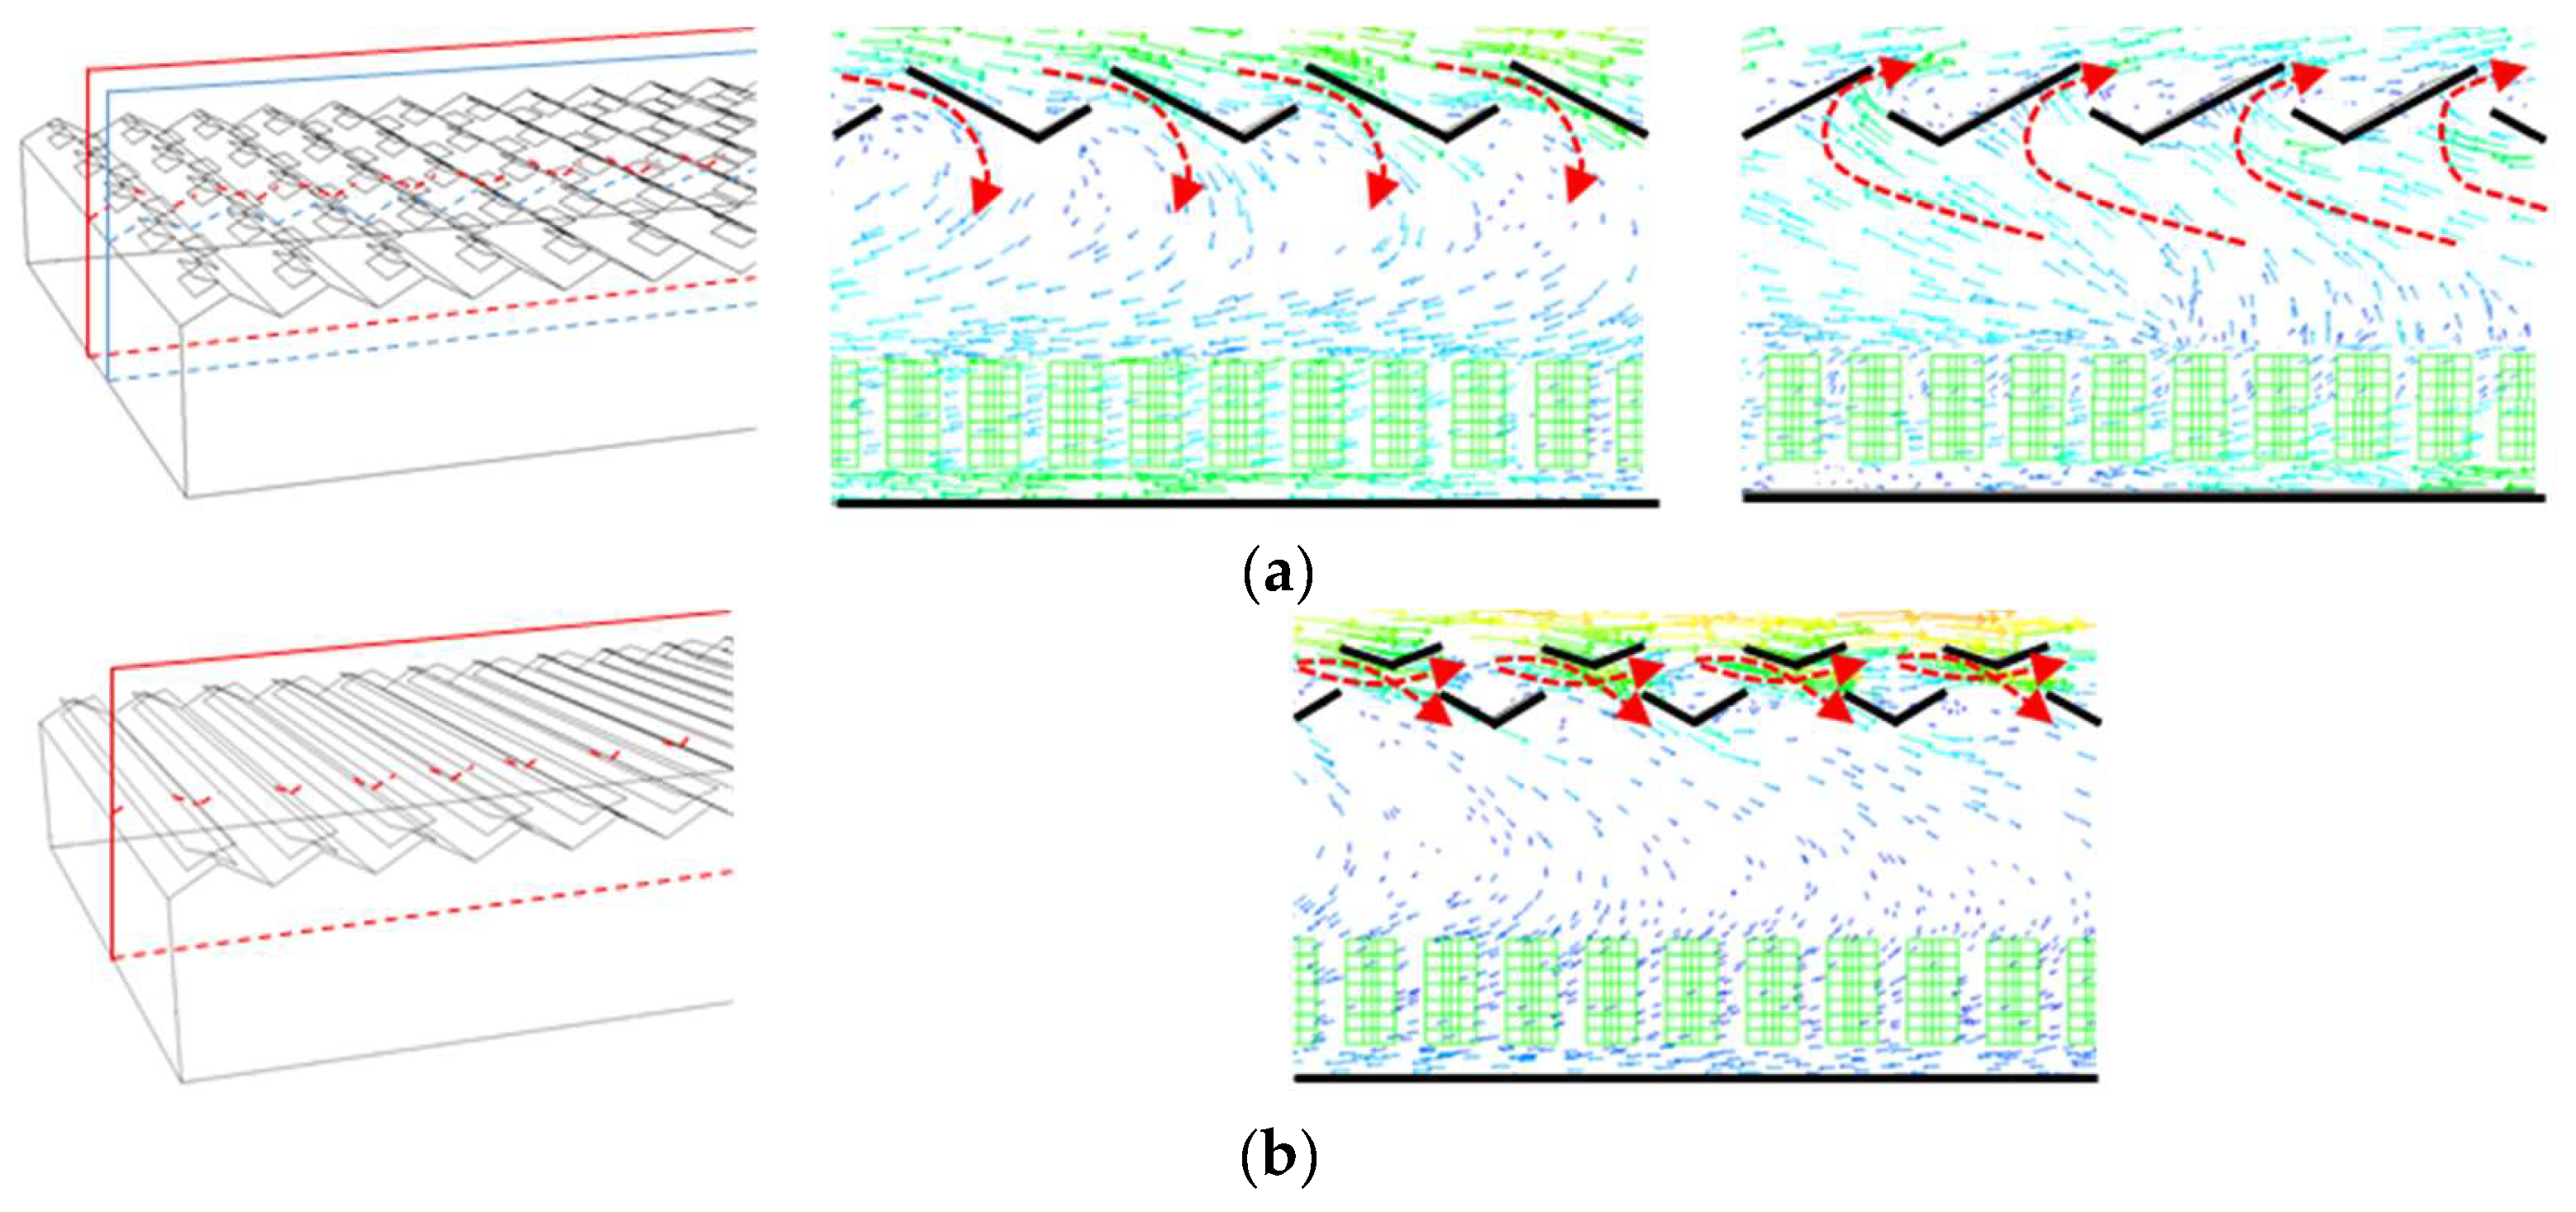
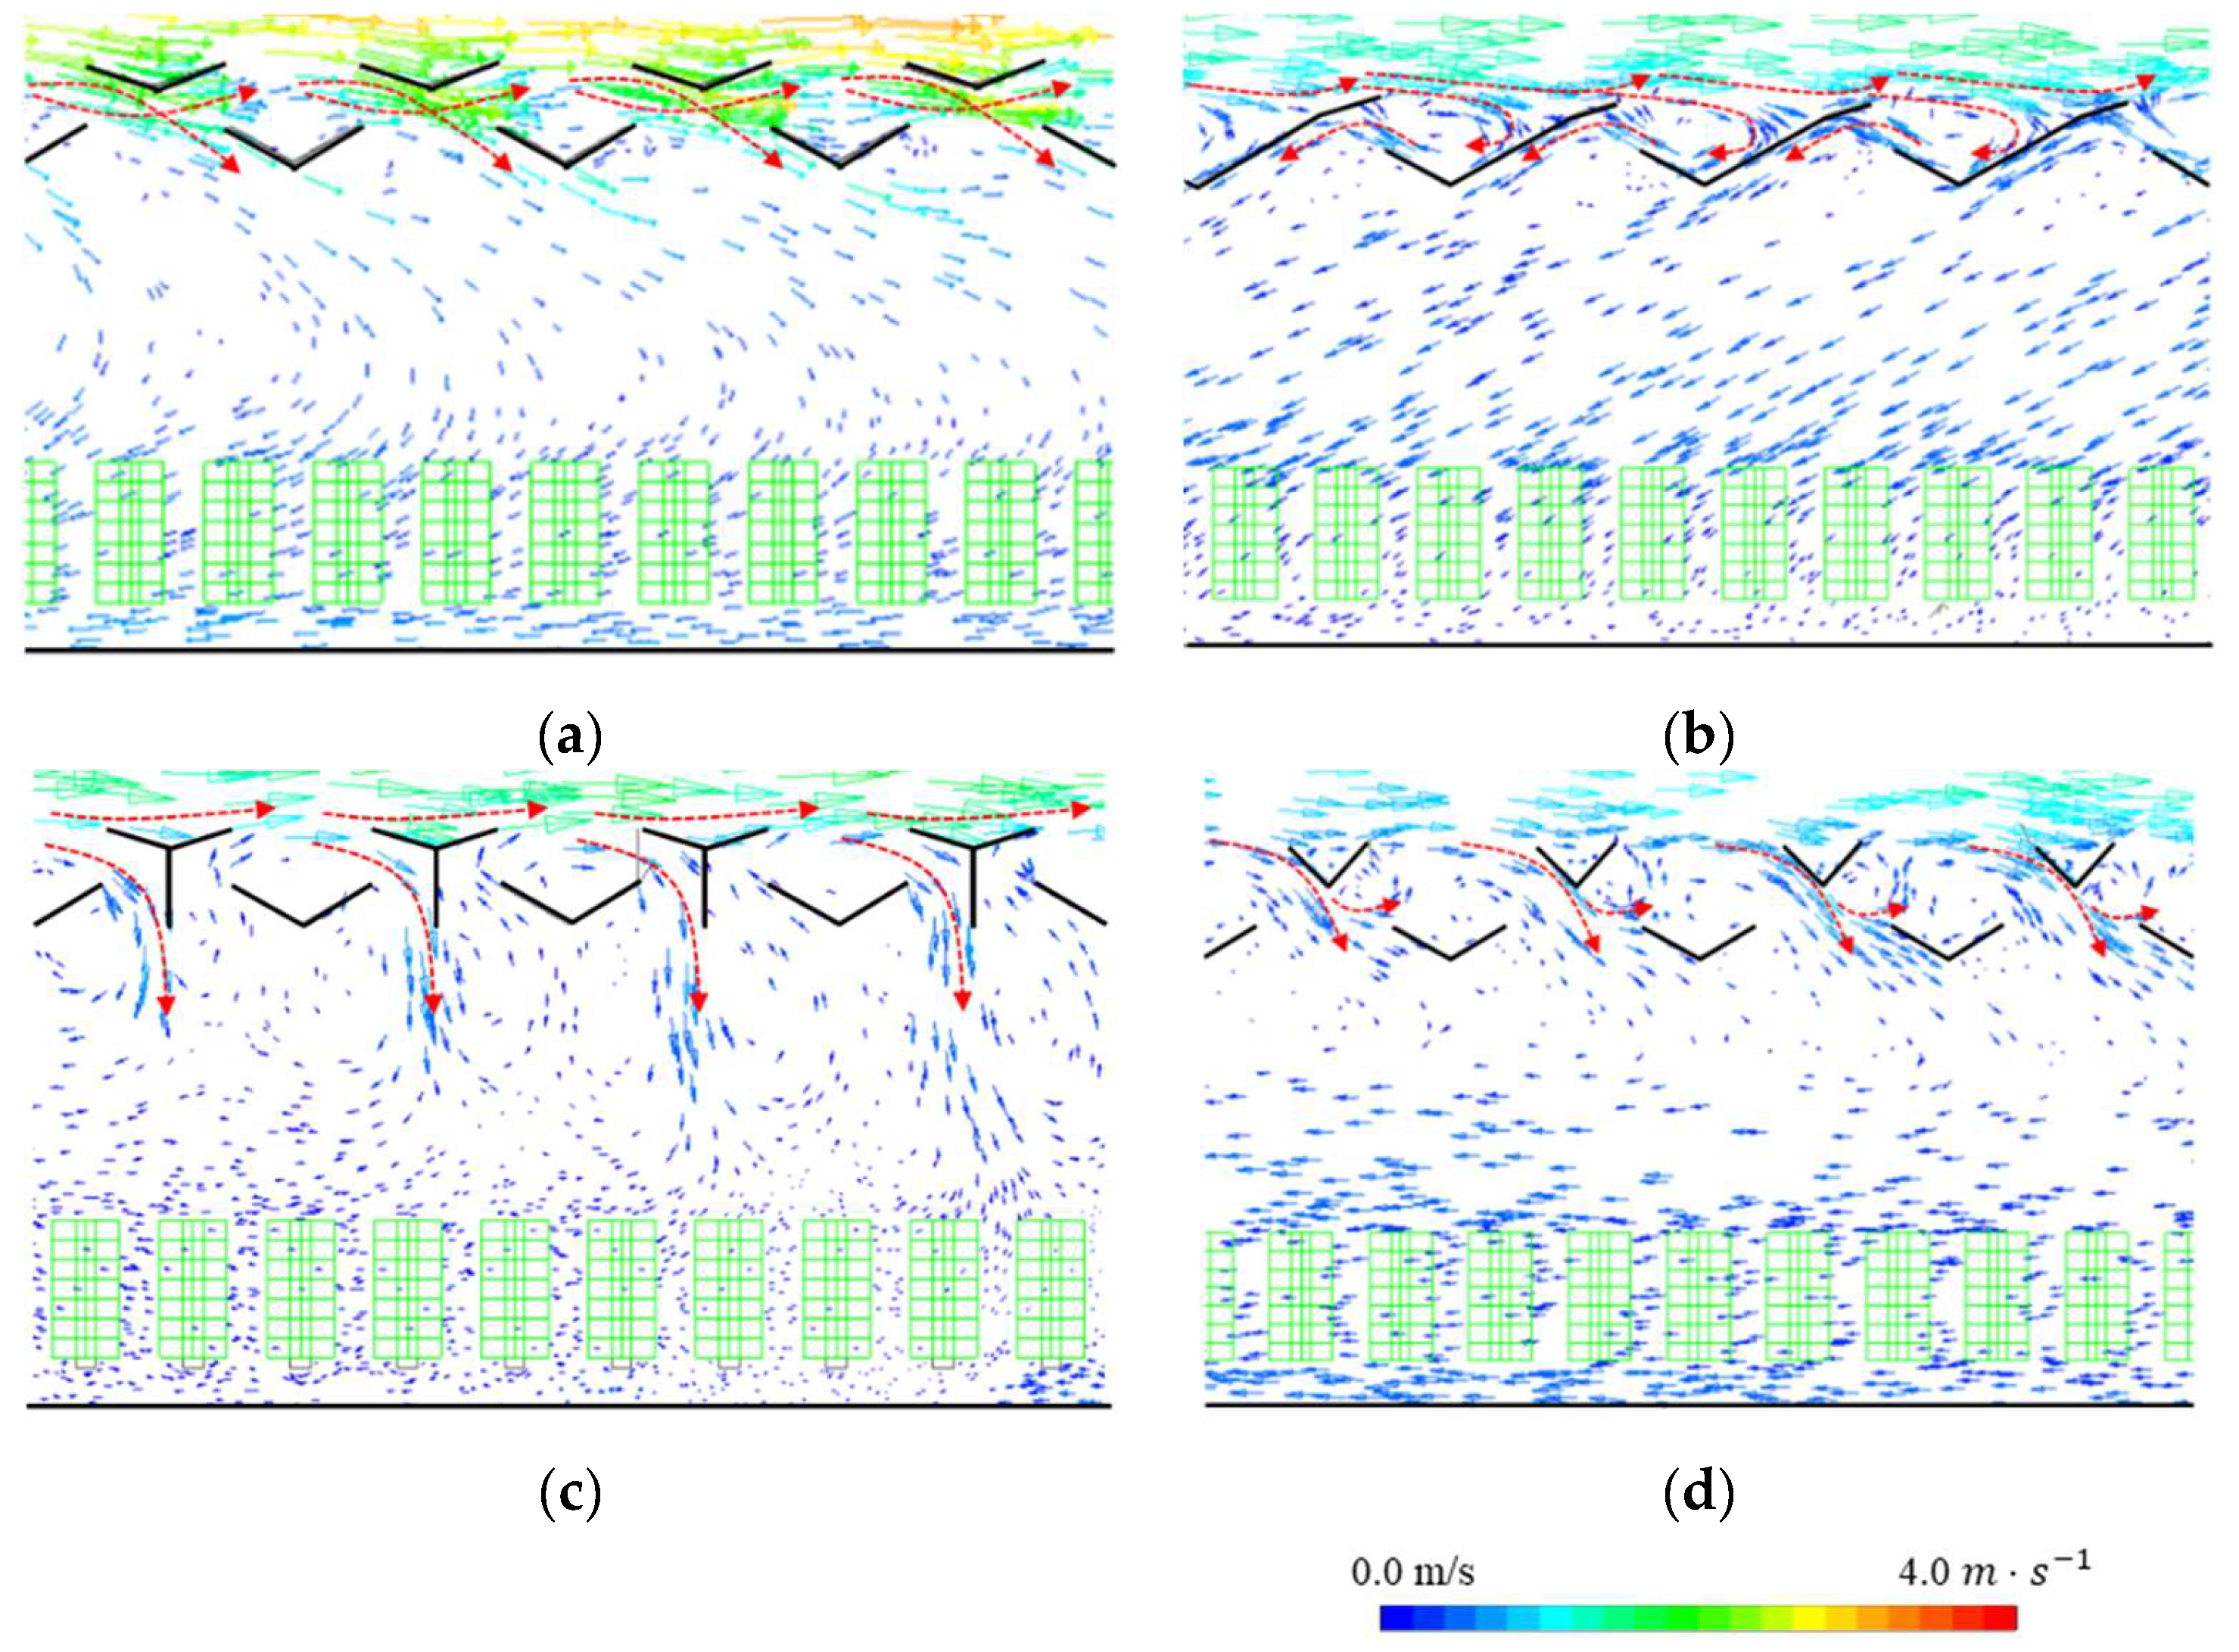
3.2.1. Analysis of Airflow Pattern According to Wind Speed
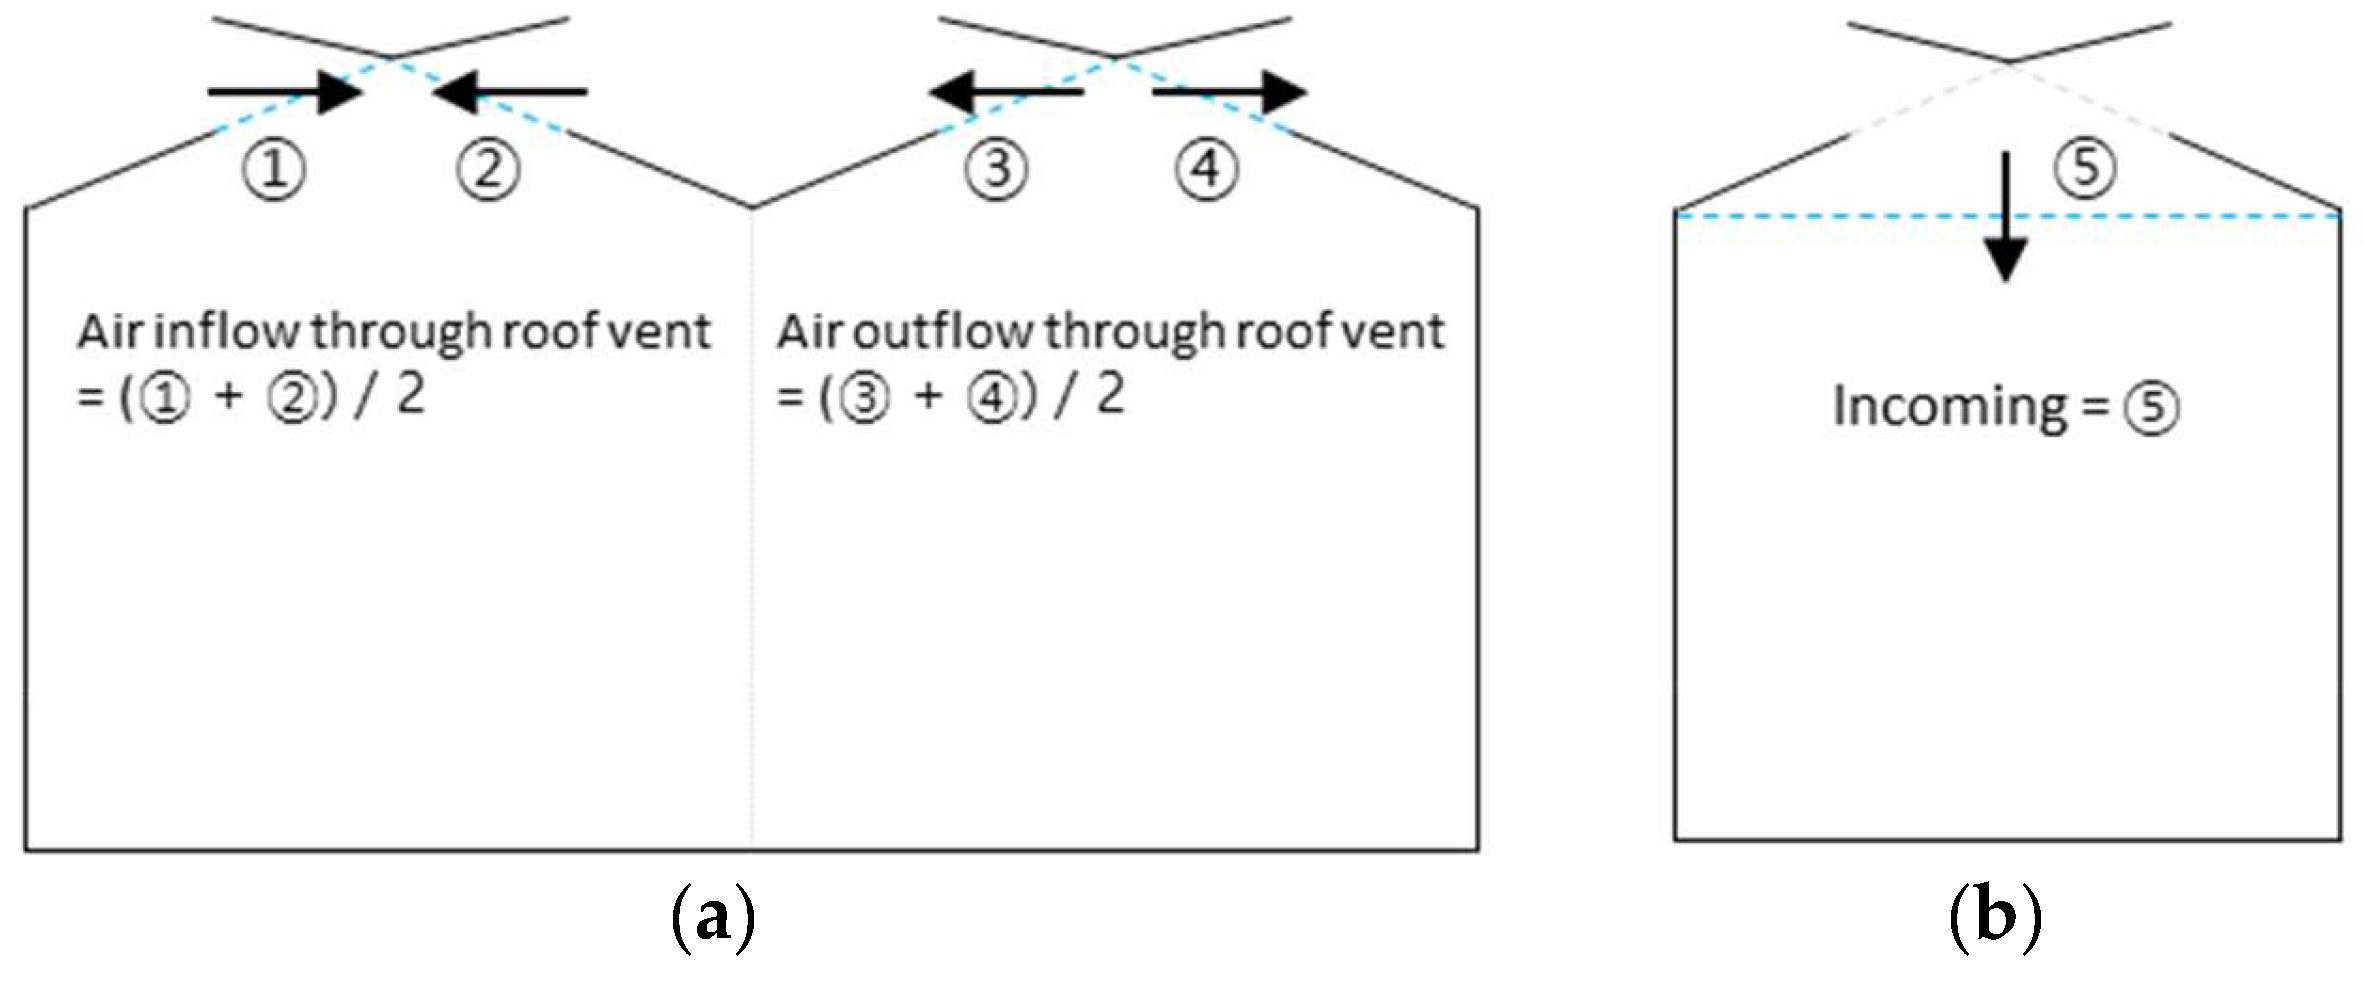
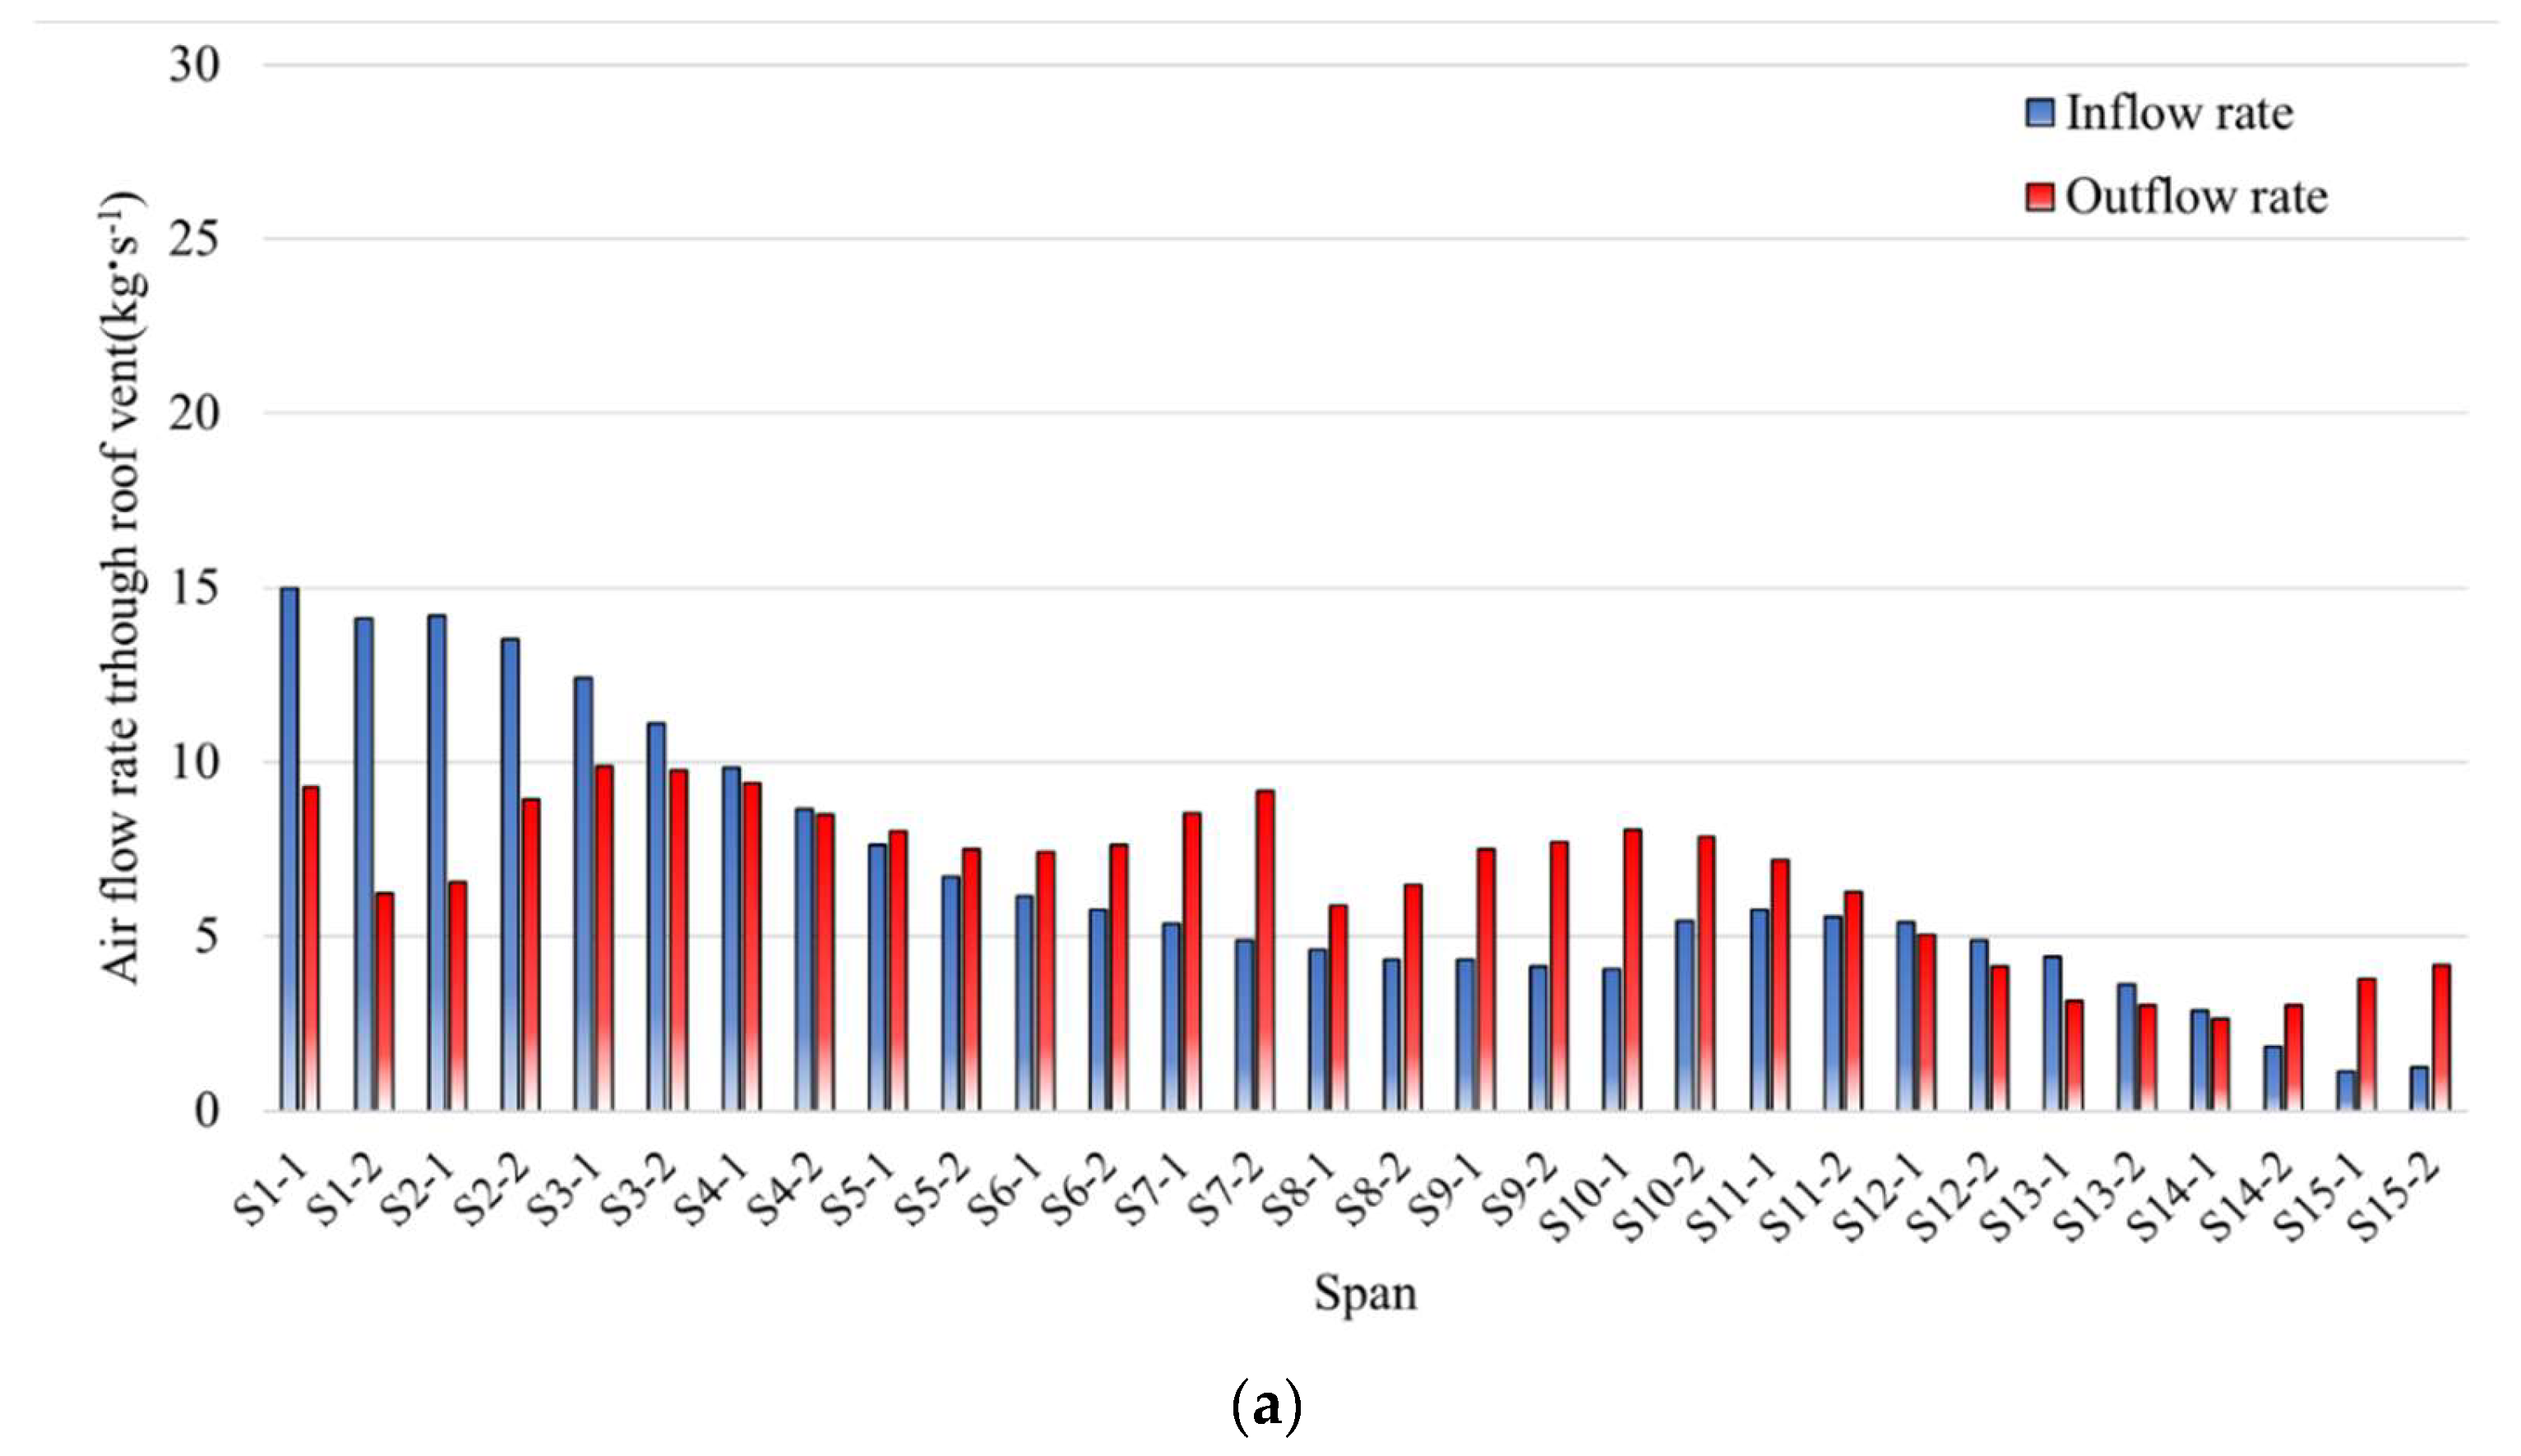
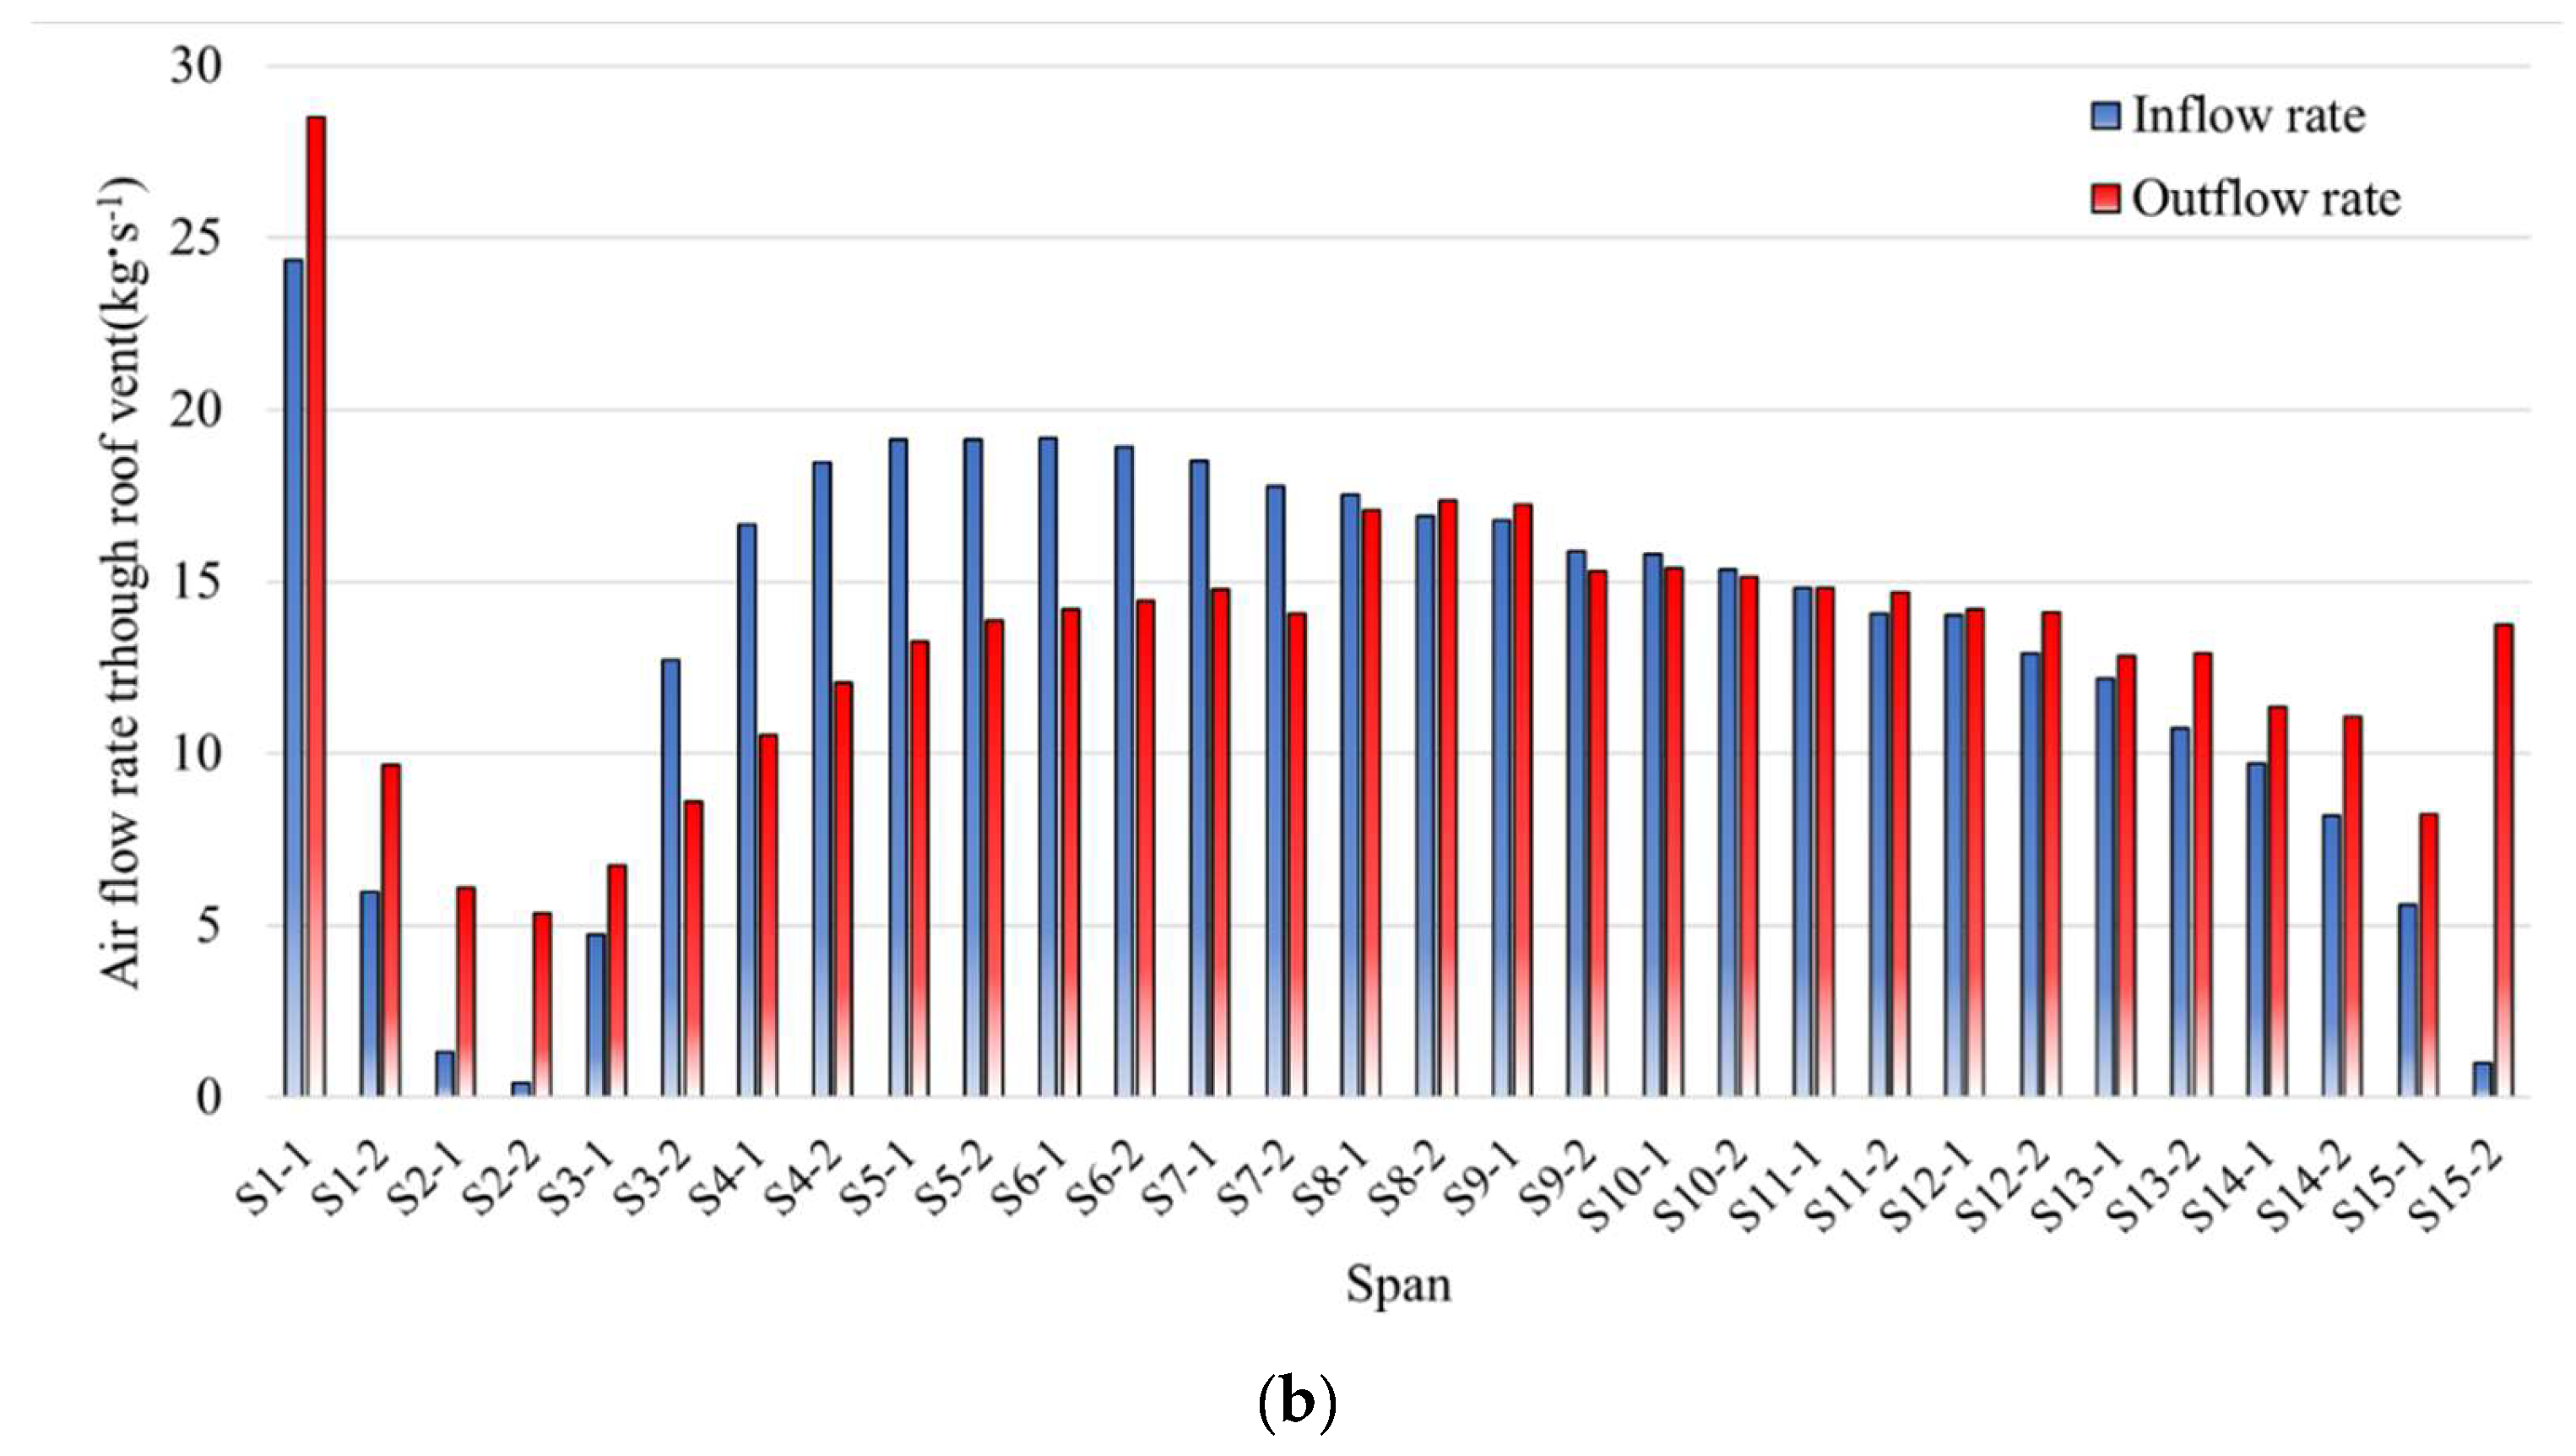
3.2.2. Estimation of Inflow/Outflow Rate at Roof Vent
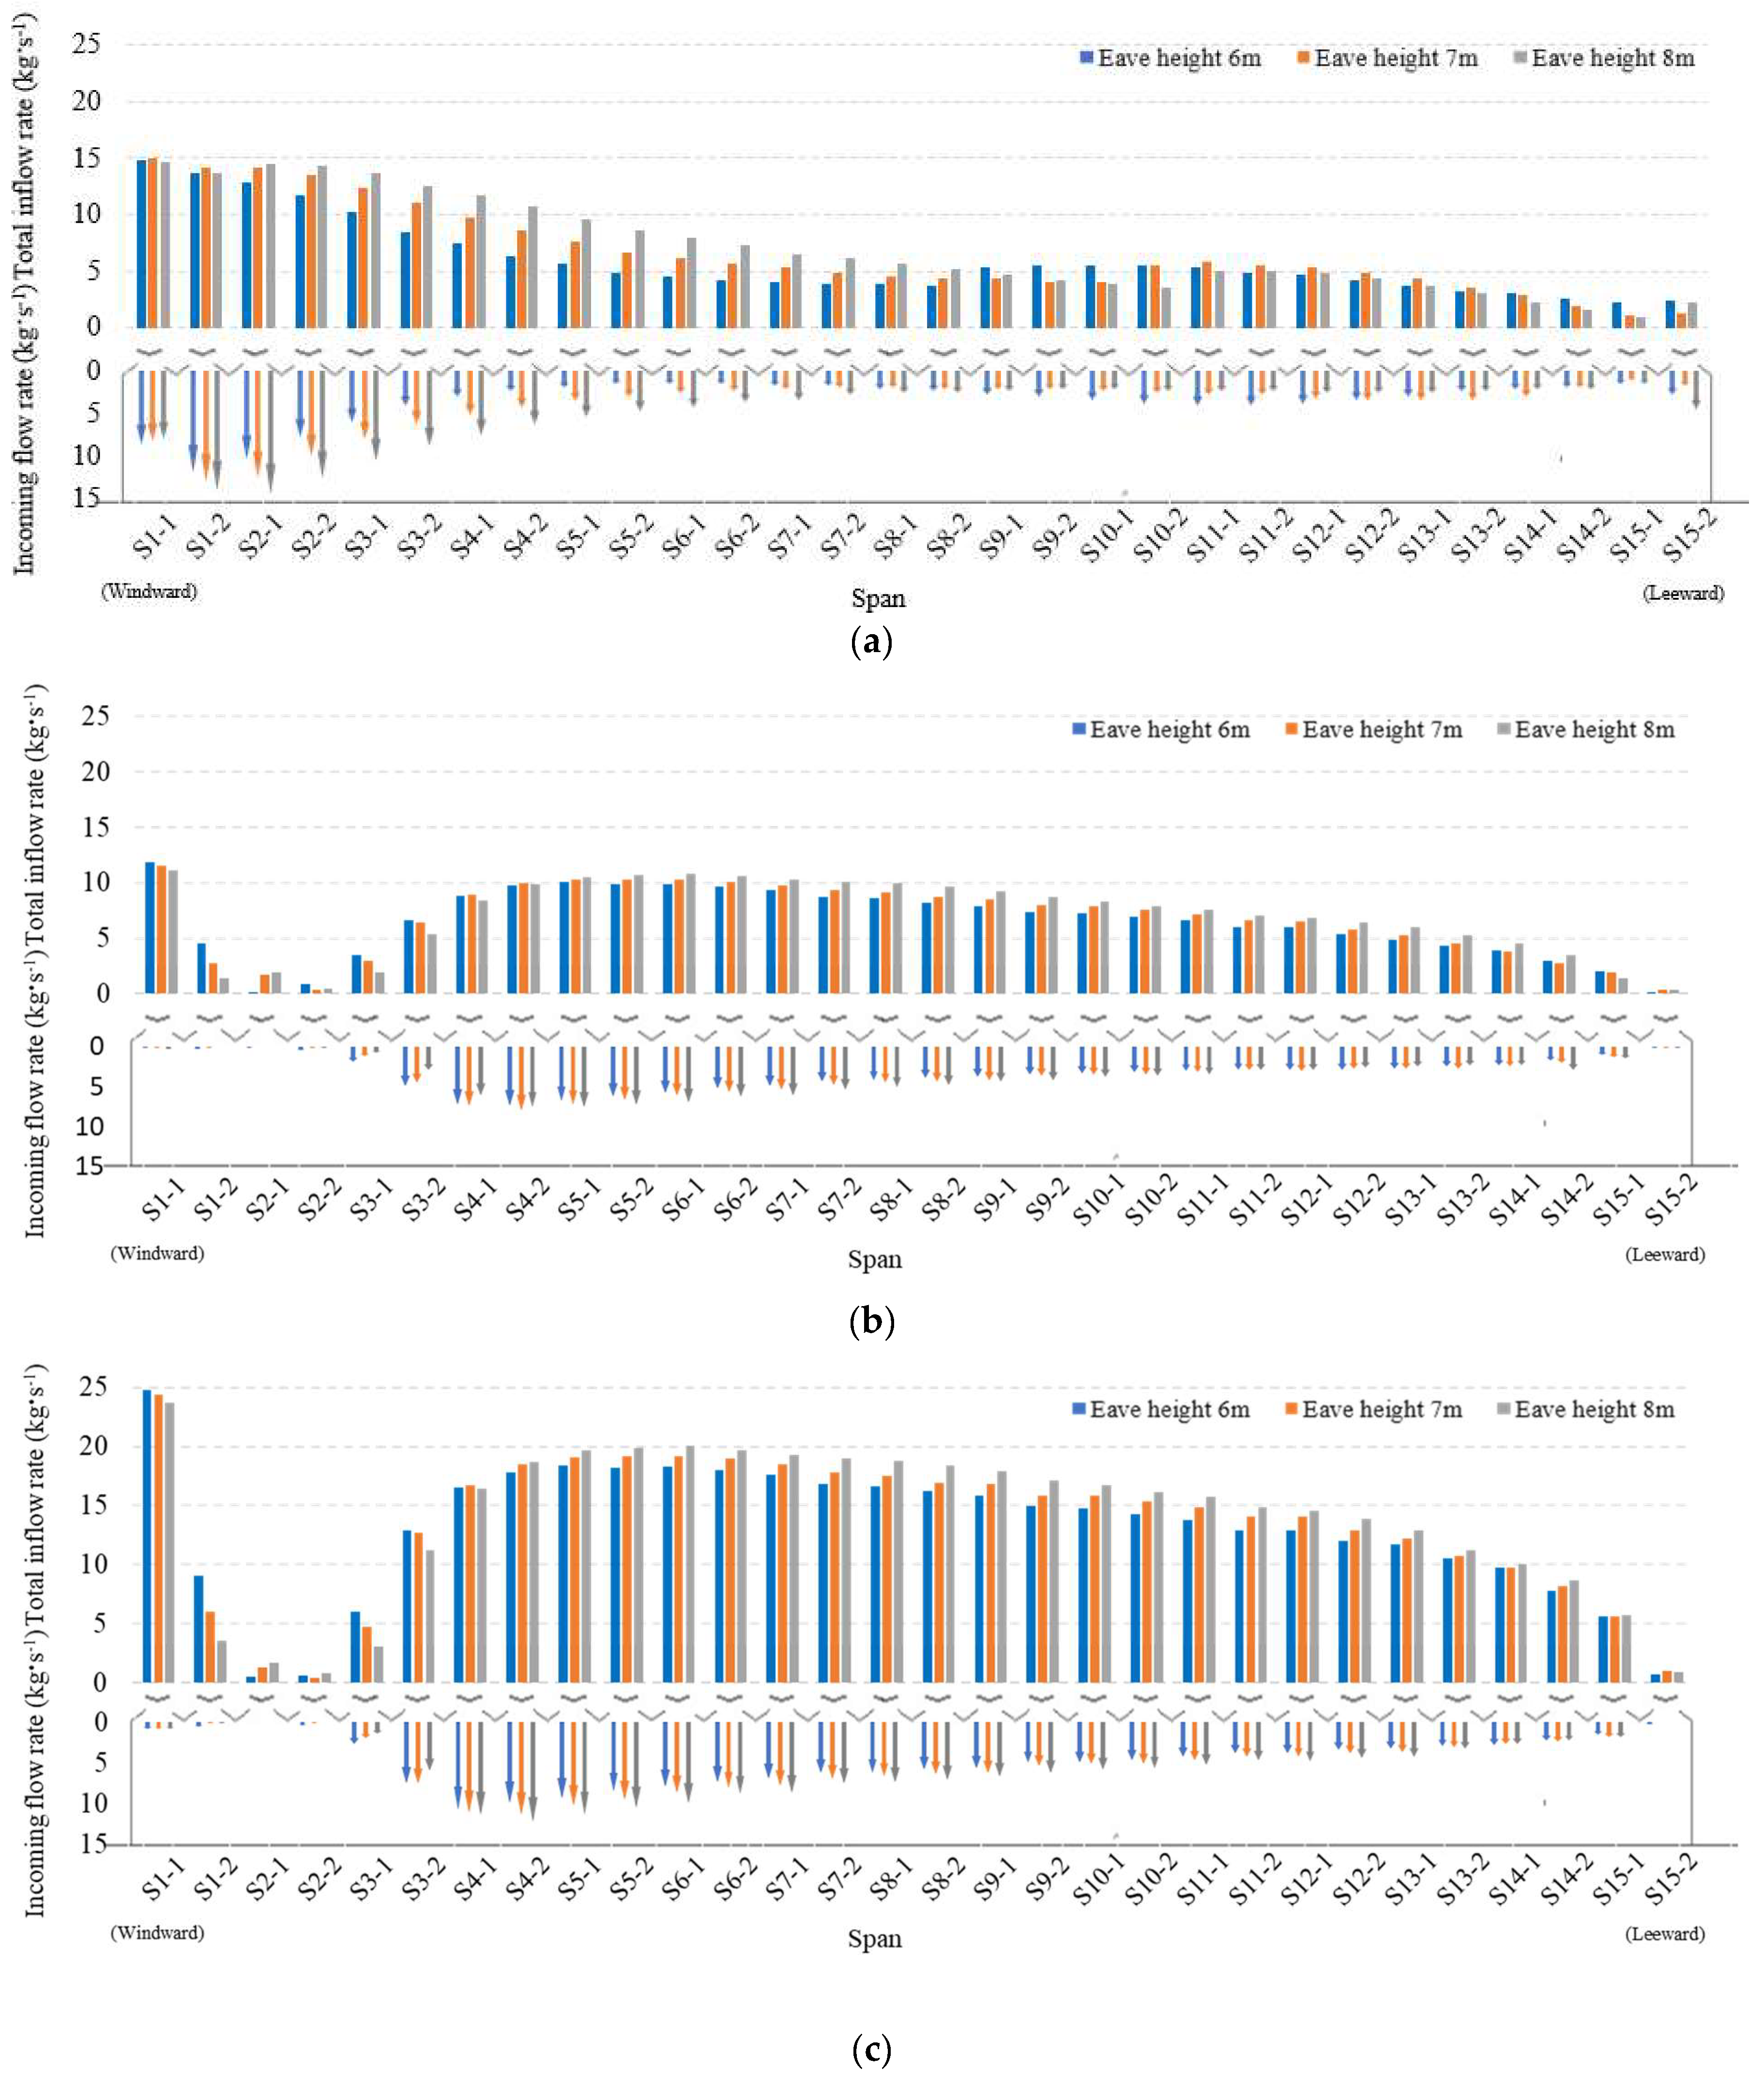
3.2.3. Estimation of Incoming Flow Rate
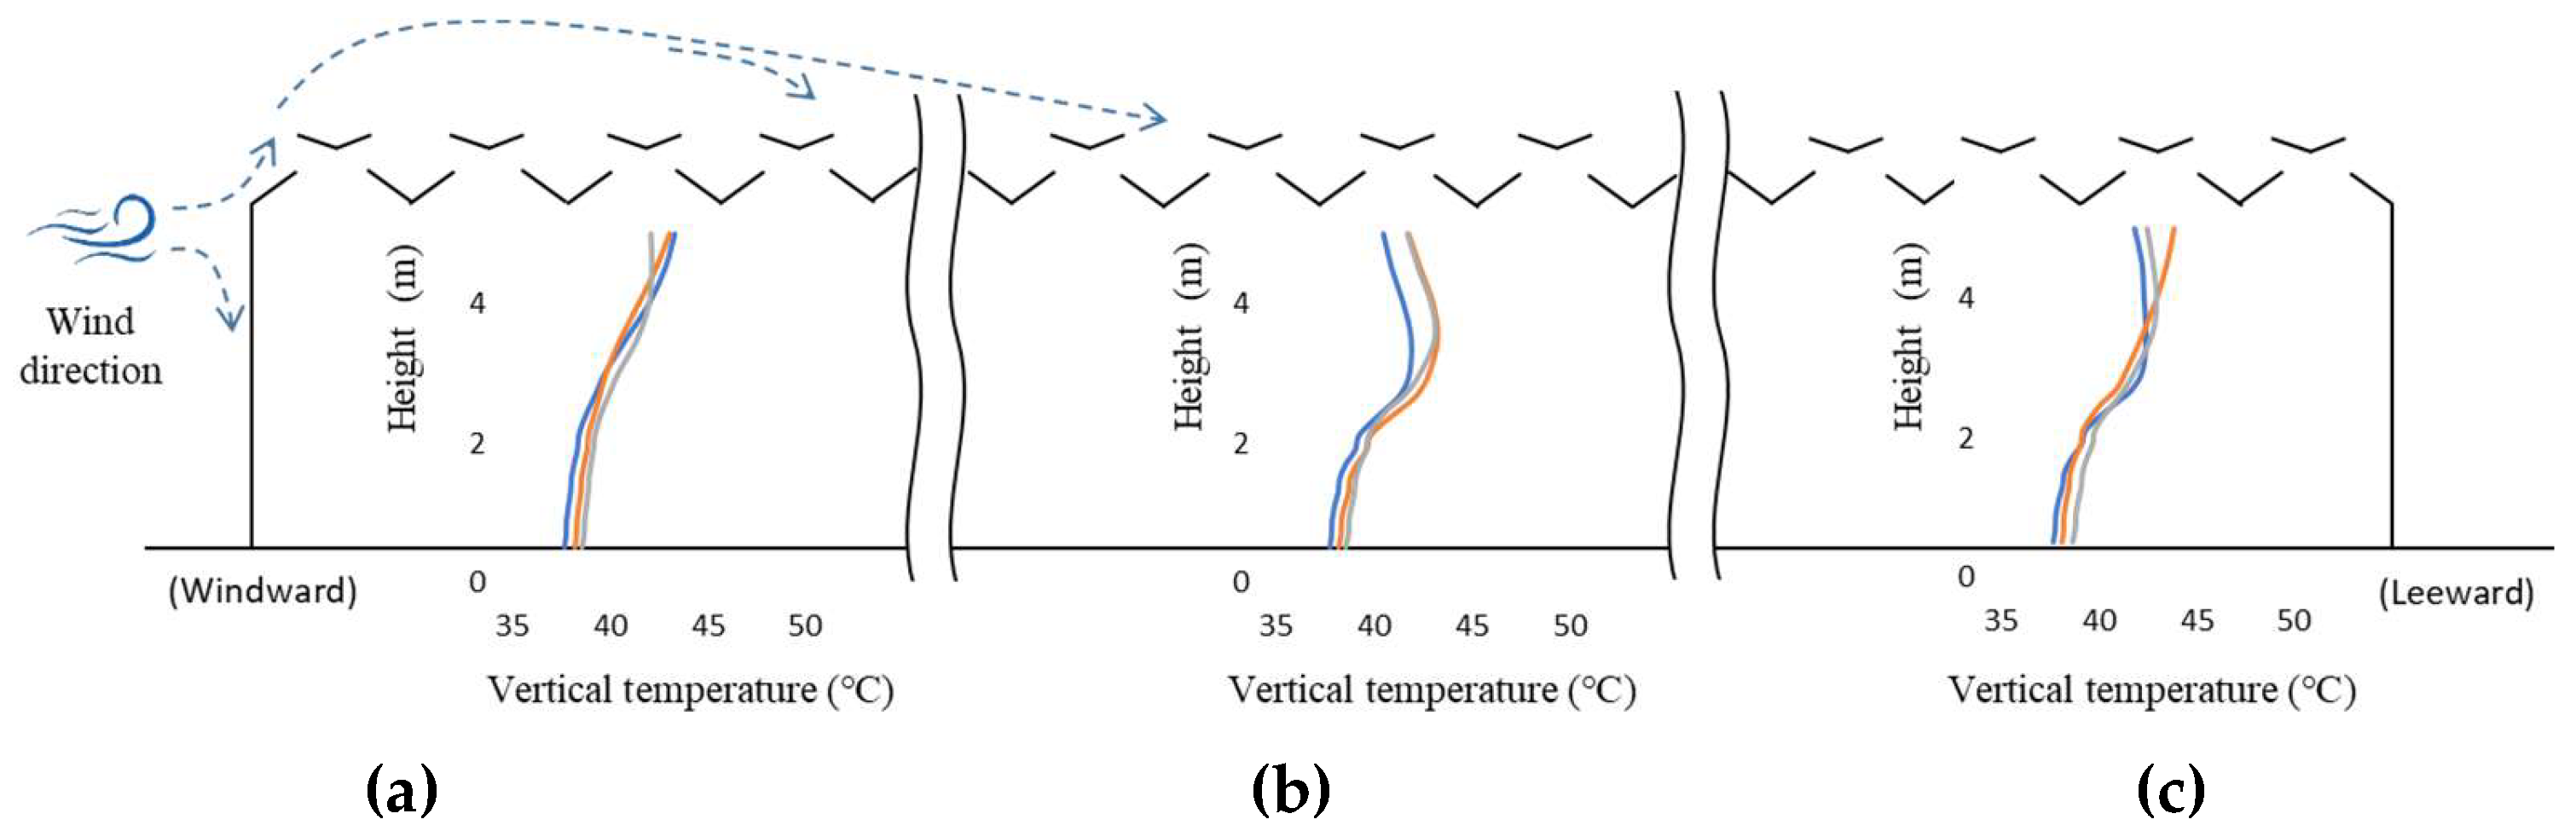
3.3. Evaluation of the Thermal Environment of the Greenhouse According to the Height of the Eave
3.4. Evaluation of the Ventilation Efficiency of the Improved Korean Venlo-Type Greenhouse with Continuous Roof Vents
4. Conclusions
Author Contributions
Funding
Institutional Review Board Statement
Informed Consent Statement
Data Availability Statement
Conflicts of Interest
References
- Ministry of Agriculture Food and Rural Affairs. 2020. Available online: https://www.mafra.go.kr (accessed on 10 June 2022).
- Flores-Velazquez, J.; Montero, J.I.; Baeza, E.J.; Lopez, J.C. Mechanical and natural ventilation systems in a greenhouse designed using computational fluid dynamics. Int. J. Agric. Biol. Eng. 2014, 7, 1. [Google Scholar]
- Fatnassi, H.; Boulard, T.; Benamara, H.; Roy, J.C.; Suay, R.; Poncet, C. Increasing the height and multiplying the number of spans of greenhouse: How far can we go? In Proceedings of the International Symposium on New Technologies and Management for Greenhouses, Evora, Portugal, 19–23 July 2015; pp. 19–23. [Google Scholar]
- Boulard, T.; Meneses, J.F.; Mermier, M.; Papadakis, G. The mechanisms involved in the natural ventilation of greenhouses. Agric. Forest Meteorol. 1996, 79, 61–77. [Google Scholar] [CrossRef]
- Okushima, L.; Sase, S.; Lee, I.-B.; Bailey, B.J. Thermal environment and stress of workers in naturally ventilated greenhouses under mild climate. Acta Hortic. 2001, 559, 793–798. [Google Scholar] [CrossRef]
- Bartzanas, T.; Boulard, T.; Kittas, C. Effect of vent arrangement on windward ventilation of a tunnel greenhouse. Biosyst. Eng. 2004, 88, 479–490. [Google Scholar] [CrossRef]
- Kacira, M.; Sase, S.; Okushima, L. Effects of side vents and span numbers on wind-induced natural ventilation of a gothic multi-span greenhouse. Jpn. Agric. Res. Q. 2004, 38, 227–233. [Google Scholar] [CrossRef]
- Baeza, E.J.; Pérez-Parra, J.J.; Montero, J.I.; Bailey, B.J.L.; Gázquez, J.C. Analysis of the role of sidewall vents on buoyancy-driven natural ventilation in parral-type greenhouses with and without insect screens using computational fluid dynamics. Biosyst. Eng. 2009, 104, 86–96. [Google Scholar] [CrossRef]
- Fidaros, D.K.; Baxevanou, C.A.; Bartzanas, T.; Kittas, C. Numerical simulation of thermal behavior of a ventilated arc greenhouse during a solar day. Renew. Energy 2010, 35, 1380–1386. [Google Scholar] [CrossRef]
- Ishii, M.; Okushima, L.; Moriyama, H.; Sase, S.; Fukuchi, N.; Both, A.J. Experimental study of natural ventilation in an open-roof greenhouse during the summer. In ISHS Acta Horticulturae 1107: XXIX International Horticultural Congress on Horticulture: Sustaining Lives, Livelihoods and Landscapes (IHC2014): International Symposium on Innovation and New Technologies in Protected Cropping; ISNS: Leuven, Belgium, 2014; pp. 67–74. [Google Scholar]
- Ha, J. Evaluation of Natural Ventilation Efficiency of Protected Cultivation System in Reclaimed Land Using Aerodynamic Simulation. Master’s Thesis, Seoul National University, Seoul, Korea, 2015. [Google Scholar]
- Benni, S.; Tassinari, P.; Bonora, F.; Barbaresi, A.; Torreggiani, D. Efficacy of greenhouse natural ventilation: Environmental monitoring and cfd simulations of a study case. Energy Build. 2016, 125, 276–286. [Google Scholar] [CrossRef]
- Boulard, T.; Roy, J.; Pouillard, J.; Fatnassi, H.; Grisey, A. Modelling of micrometeorology, canopy transpiration and photosynthesis in a closed greenhouse using computational fluid dynamics. Biosyst. Eng. 2017, 158, 110–133. [Google Scholar] [CrossRef]
- Lee, S.Y.; Lee, I.B.; Kim, R.W. Evaluation of wind-driven natural ventilation of single-span greenhouses built on reclaimed coastal land. Biosyst. Eng. 2018, 171, 120–142. [Google Scholar] [CrossRef]
- Zhao, Y.; Teitel, M.; Barak, M. Vertical temperature and humidity gradients in a naturally ventilated greenhouse. J. Agric. Eng. Res. 2001, 78, 431–436. [Google Scholar] [CrossRef]
- Jung, D.H.; Kim, H.J.; Kim, J.Y.; Lee, T.S.; Park, S.H. Model predictive control via output feedback neural network for improved multi-window greenhouse ventilation control. Sensors 2020, 20, 1756. [Google Scholar] [CrossRef]
- Chauhan, K.K.; Lunagaria, M.M. Interpolation of Microclimatic Parameters over Capsicum under Open Ventilated Greenhouse. Int. J. Econ. Plants 2022, 9, 95–100. [Google Scholar] [CrossRef]
- Yeo, U.H.; Lee, S.Y.; Park, S.J.; Kim, J.G.; Choi, Y.B.; Kim, R.W.; Lee, I.B. Rooftop Greenhouse:(1) Design and Validation of a BES Model for a Plastic-Covered Greenhouse Considering the Tomato Crop Model and Natural Ventilation Characteristics. Agriculture 2022, 12, 903. [Google Scholar] [CrossRef]
- Chung, S.J.; Seo, B.S.; Kang, J.K.; Kim, H.G. Development of hydroponic technique of fruit vegetables using perlite and mixtures with perlite as a substrate: 1. Effects of containers and substrates on the growth and fruit quality of hydroponically grown cucumber. J. Bio-Environ. Control. 1995, 4, 159–166. [Google Scholar]
- Kim, R.W.; Lee, I.B.; Yeo, U.H.; Lee, S.Y. Evaluation of various national greenhouse design standards for wind loading. Biosyst. Eng. 2019, 188, 136–154. [Google Scholar] [CrossRef]
- Norton, T.; Grant, J.; Fallon, R.; Sun, D.-W. Improving the representation of thermal boundary conditions of livestock during CFD modelling of the indoor environment. Comput. Electron. 2010, 73, 17–36. [Google Scholar] [CrossRef]
- Seo, I.-H.; Lee, I.-B.; Moon, O.-K.; Hong, S.-W.; Hwang, H.-S.; Bitog, J.P.; Kwon, K.; Ye, Z.; Lee, J. Modelling of internal environmental conditions in a full-scale commercial pig house containing animals. Biosyst. Eng. 2012, 111, 91–106. [Google Scholar] [CrossRef]
- Wu, W.; Zhai, J.; Zhang, G.; Nielsen, P.V. Evaluation of methods for determining air exchange rate in a naturally ventilated dairy cattle building with large openings using computational fluid dynamics (CFD). Atmos. Environ. 2012, 63, 179–188. [Google Scholar] [CrossRef]
- Yeo, U.H.; Lee, I.B.; Kim, R.W.; Lee, S.Y.; Kim, J.G. Computational fluid dynamics evaluation of pig house ventilation systems for improving the internal rearing environment. Biosyst. Eng. 2019, 186, 259–278. [Google Scholar] [CrossRef]
- Lee, M.H. Analysis of Aerodynamic Improvements about Major Environmental Problems in Highrise Multi-Span Greenhouse. Master’s Thesis, Seoul National University, Seoul, Korea, 2019. [Google Scholar]
- Richards, P. Computational Modelling of Wind Flow Around Low-Rise Buildings Using PHOENICS; AFRC Institute of Engineering Research: Silsoe, UK, 1989. [Google Scholar]
- Bartzanas, T.; Kittas, C.; Sapounas, A.; Nikita-Martzopoulou, C. Analysis of airflow through experimental rural buildings: Sensitivity to turbulence models. Biosyst. Eng. 2007, 97, 229–239. [Google Scholar] [CrossRef]
- Bournet, P.E.; Ould Khaoua, S.A.; Boulard, T. Numerical prediction of the effect of vent arrangements on the ventilation and energy transfer in a multi-span glasshouse using a bi-band radiation model. Biosyst. Eng. 2007, 98, 224–234. [Google Scholar] [CrossRef]
- Bournet, P.-E.; Boulard, T. Effect of ventilator configuration on the distributed climate of greenhouses: A review of experimental and CFD studies. Comput. Electron. Agric. 2010, 74, 195–217. [Google Scholar] [CrossRef]
- Tominaga, Y.; Mochida, A.; Murakami, S.; Sawaki, S. Comparison of various revised Ke 3 models and les applied to flow around a high-rise building model with 1:1:2 shape placed within the surface boundary layer. J. Wind Eng. Ind. Aerodyn. 2008, 96, 389–411. [Google Scholar] [CrossRef]
- Kim, R.W.; Lee, I.B.; Kwon, K.S. Evaluation of wind pressure acting on multi-span greenhouses using CFD technique, part 1: Development of the CFD model. Biosyst. Eng. 2017, 164, 235–256. [Google Scholar] [CrossRef]
- Papadakis, G.; Mermier, M.; Meneses, J.F.; Boulard, T. Measurement and analysis of air exchange rates in a greenhouse with continuous roof and side openings. J. Agric. Eng. Res. 1996, 63, 219–227. [Google Scholar] [CrossRef]


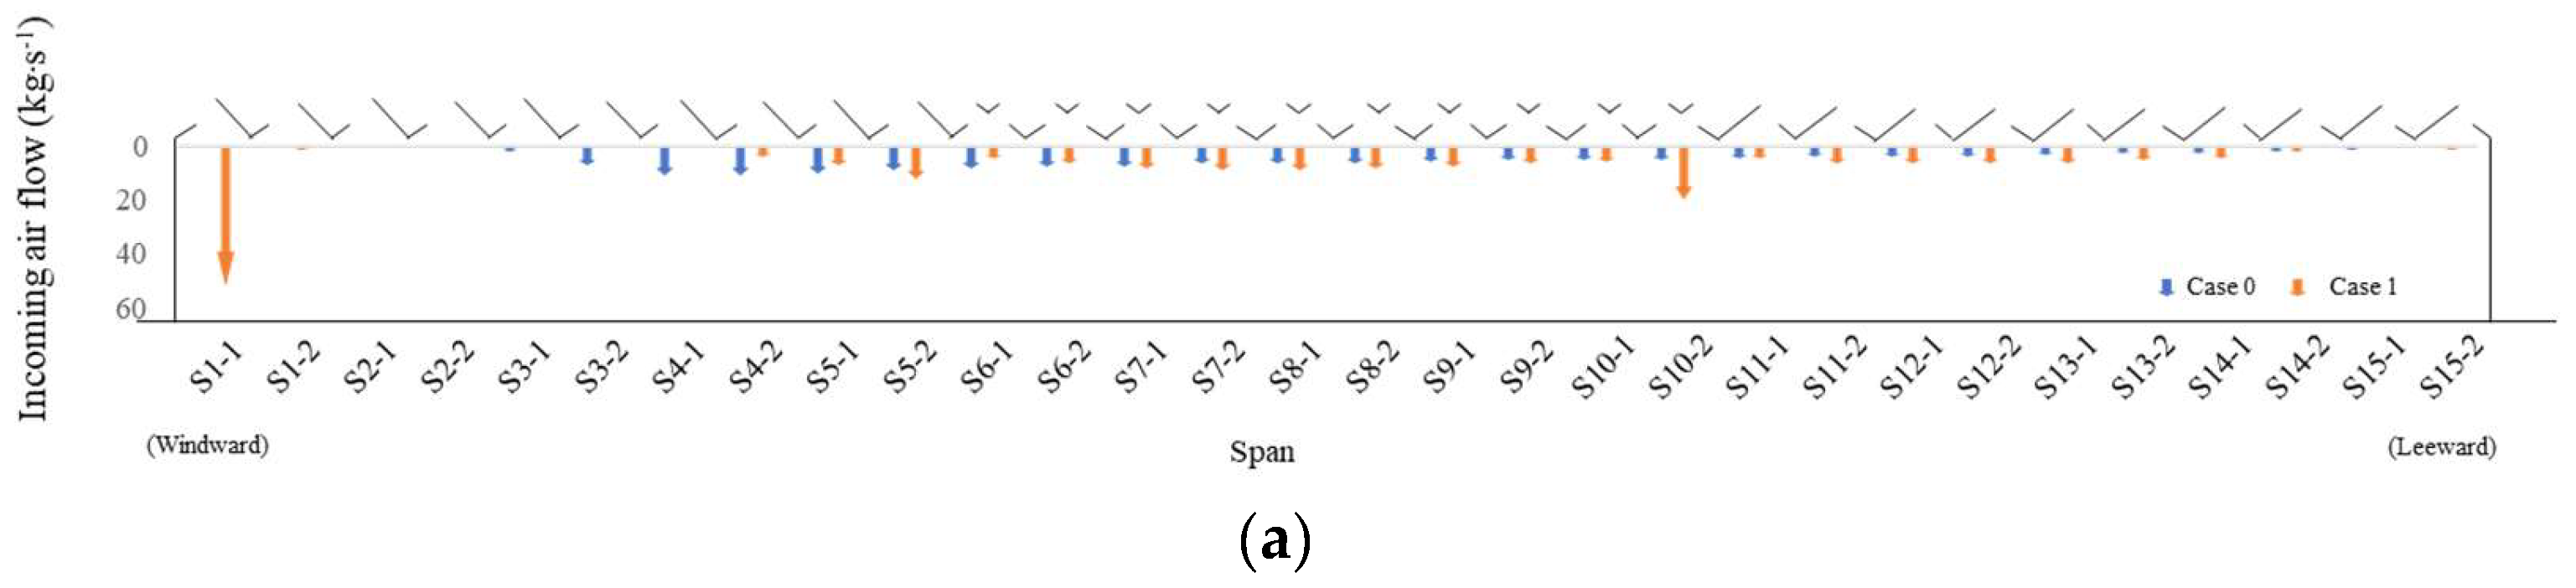
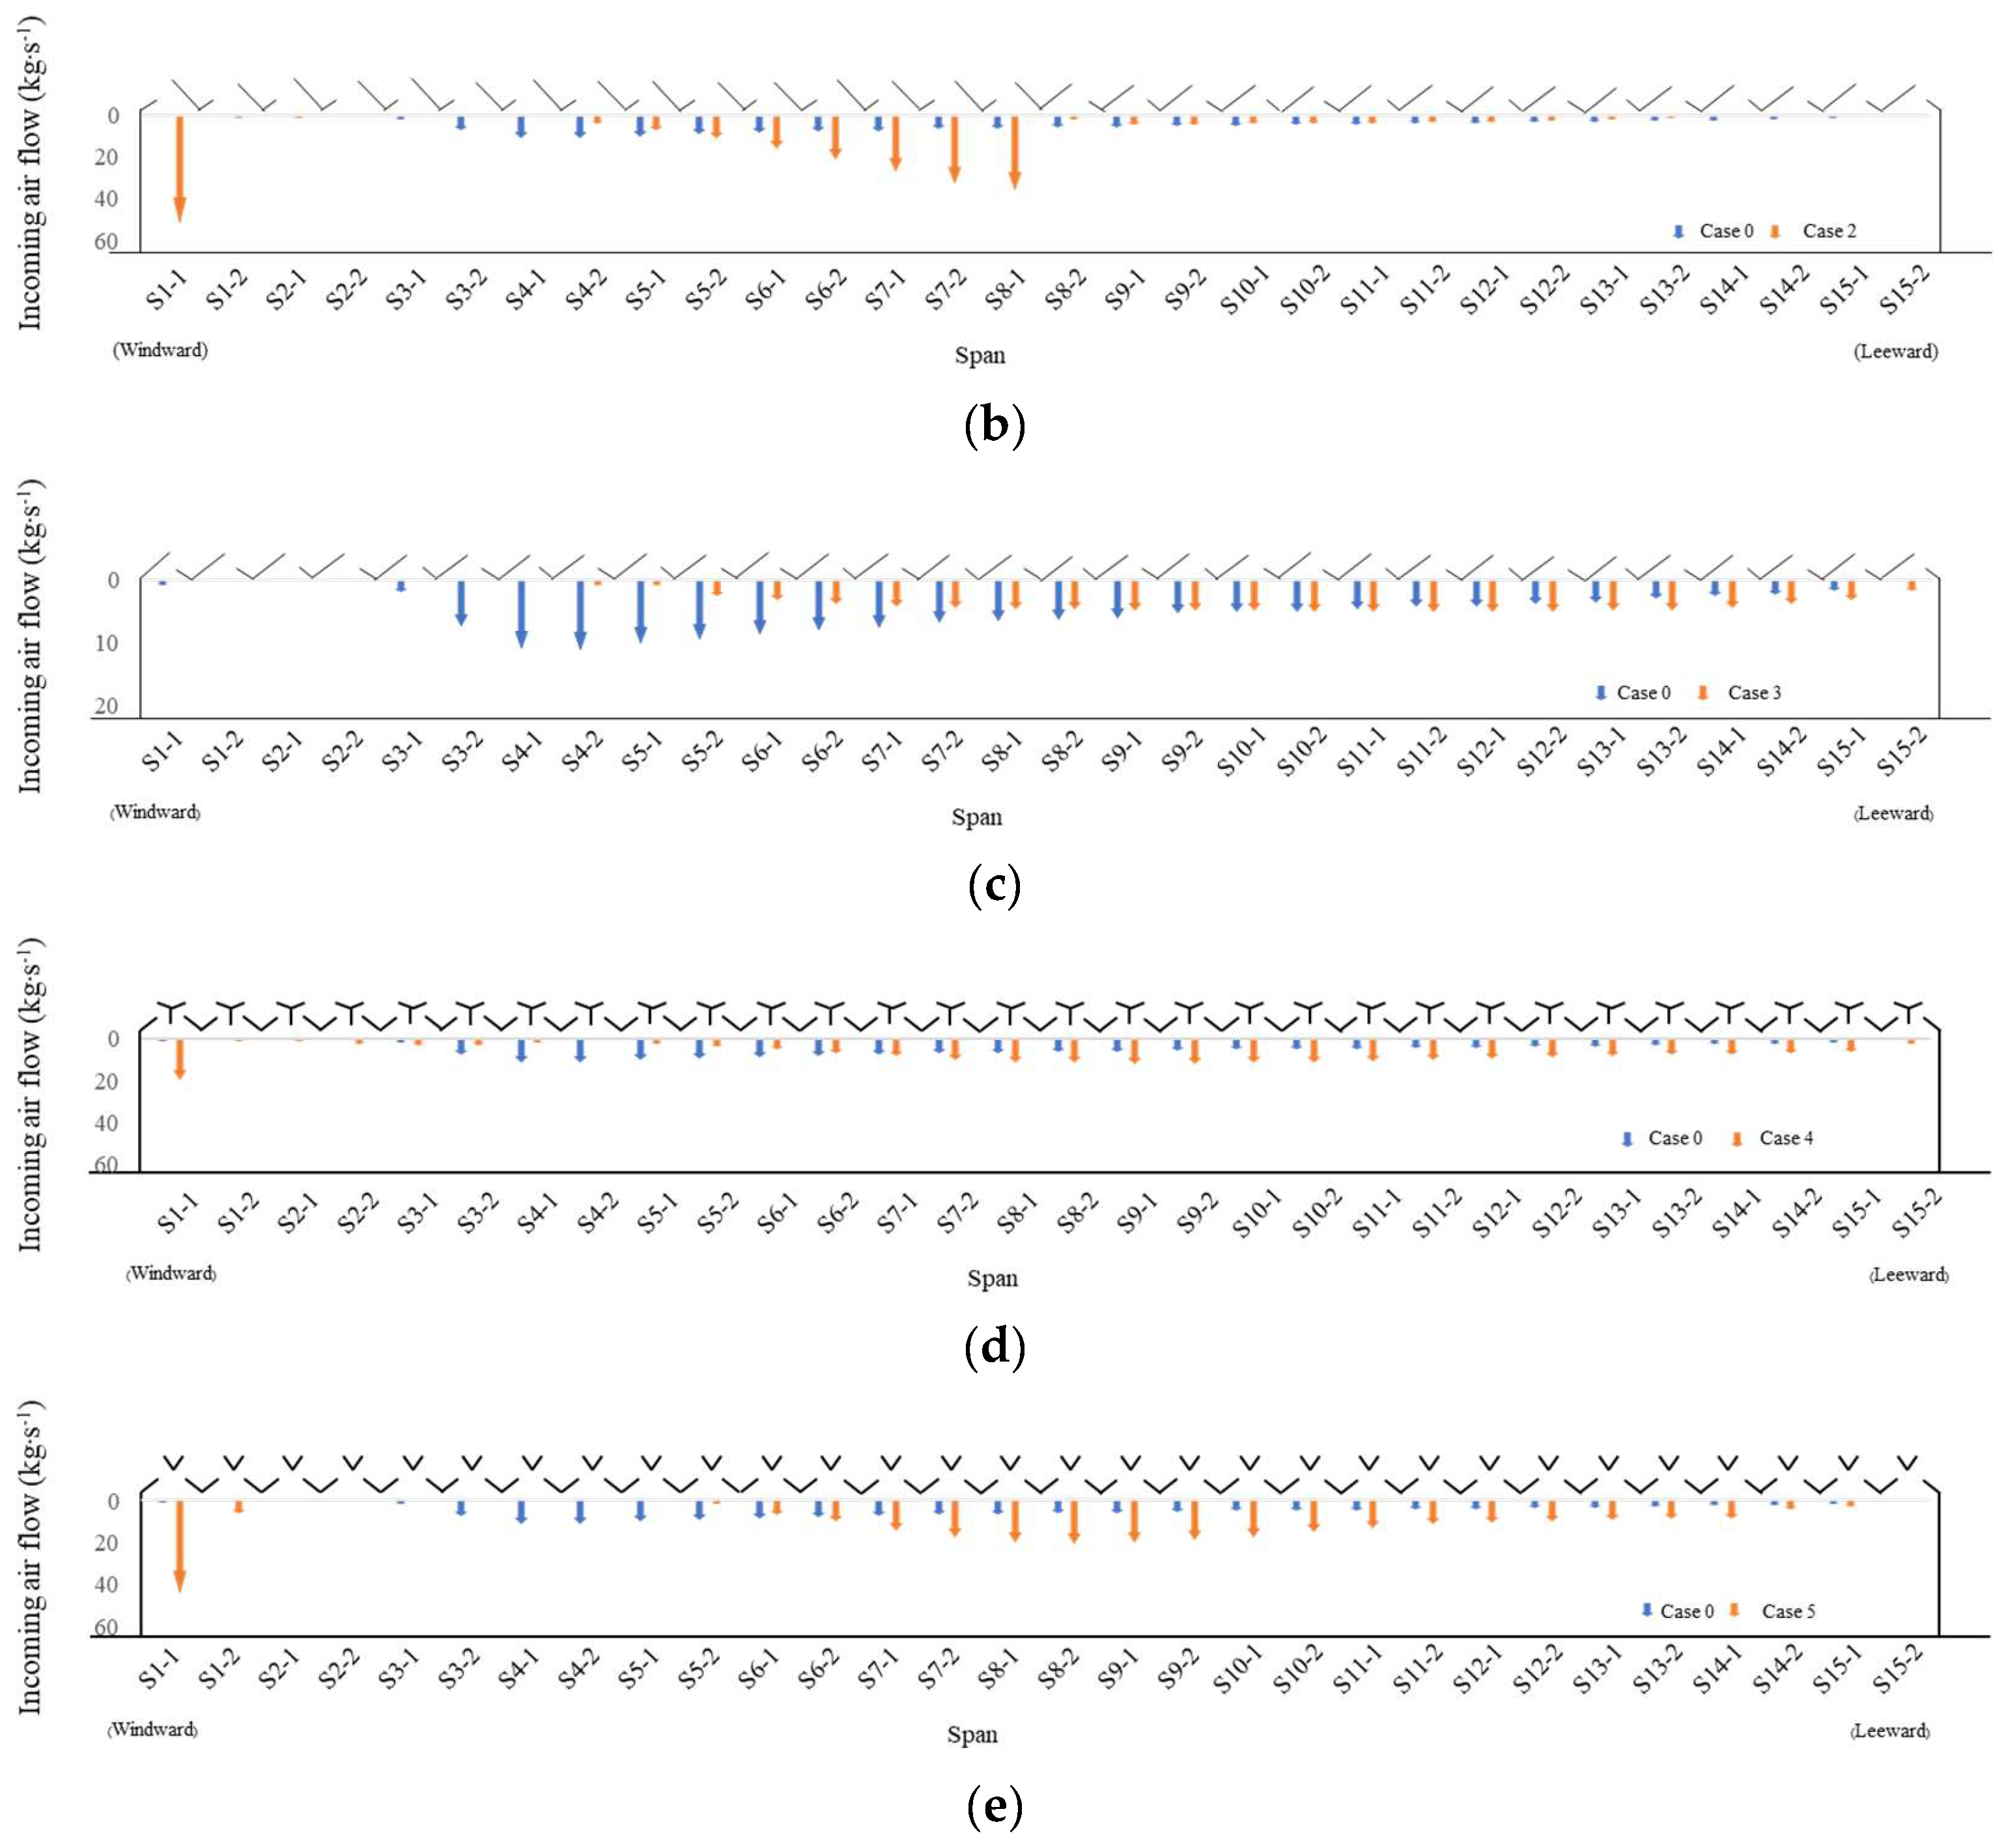
 0.5 m·s−1
  1.5 m·s−1
  3.0 m·s−1). (a) 1~5 span, (b) 6~10 span, (c) 11~15 span.
0.5 m·s−1 1.5 m·s−1 3.0 m·s−1). (a) 1~5 span, (b) 6~10 span, (c) 11~15 span.
3.0 m·s−1). (a) 1~5 span, (b) 6~10 span, (c) 11~15 span.
0.5 m·s−1 1.5 m·s−1 3.0 m·s−1). (a) 1~5 span, (b) 6~10 span, (c) 11~15 span.
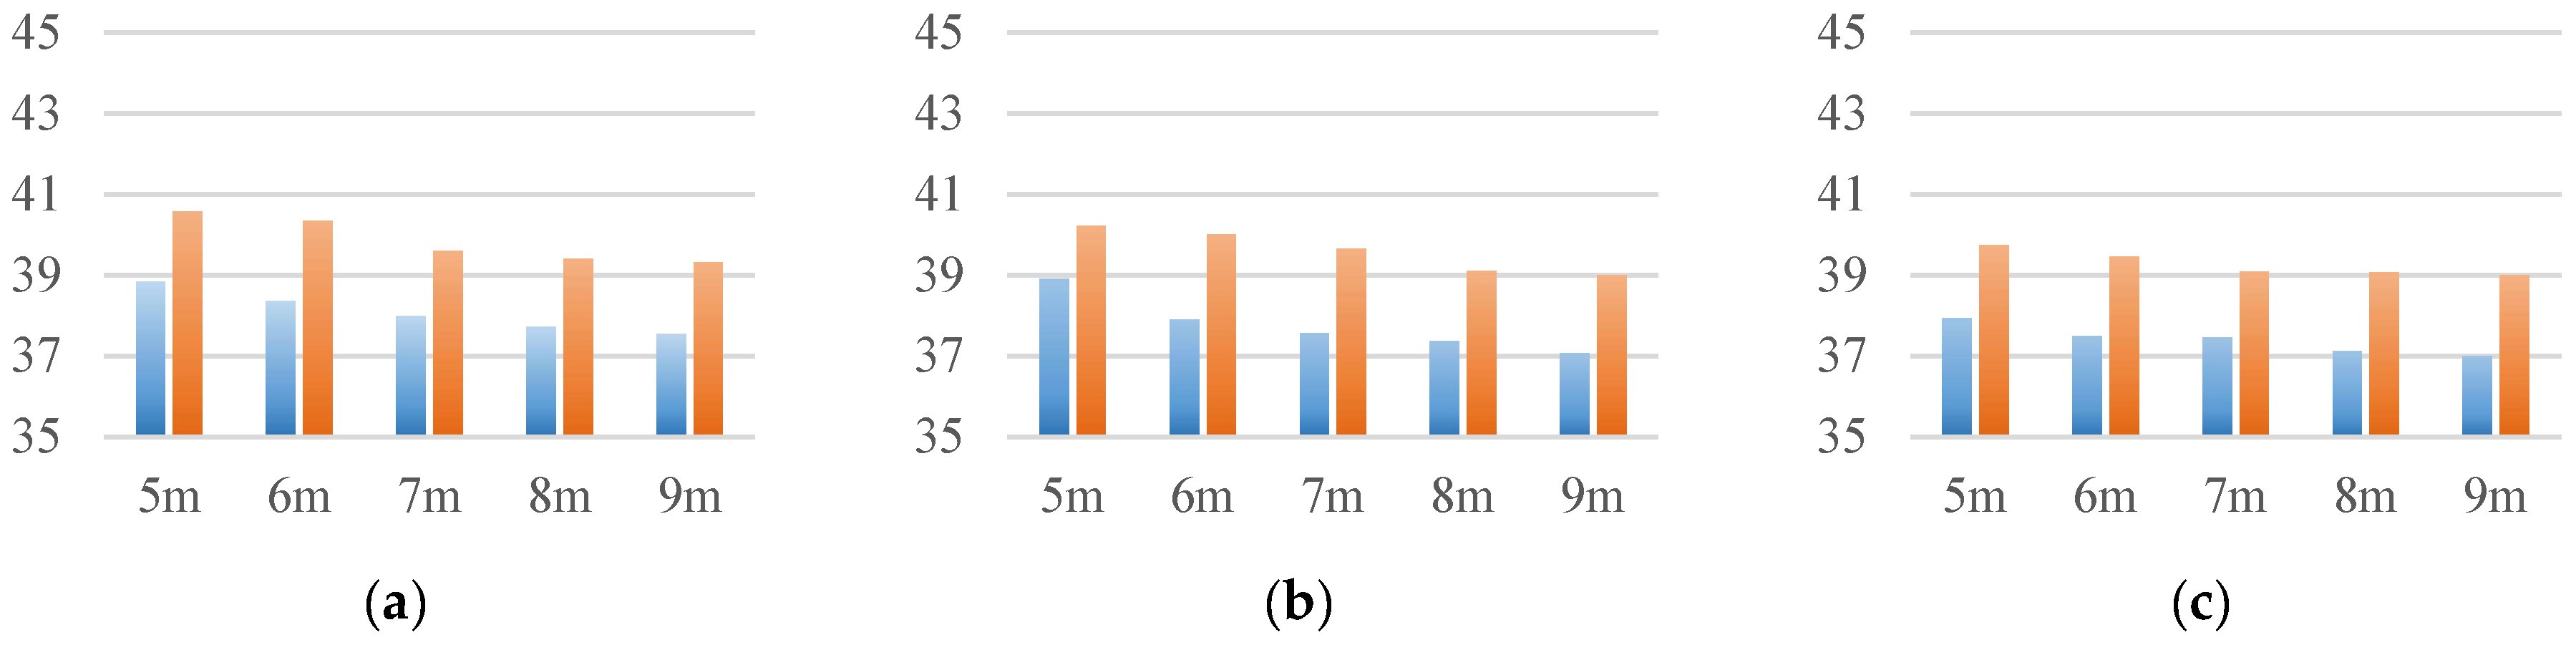
 Air temperature of the crop zone,
  Average air temperature of the greenhouse). (a) External wind speed 0.5 , (b) External wind speed 1.5 , (c) External wind speed 3.0 .
Air temperature of the crop zone, Average air temperature of the greenhouse). (a) External wind speed 0.5 , (b) External wind speed 1.5 , (c) External wind speed 3.0 .
Average air temperature of the greenhouse). (a) External wind speed 0.5 , (b) External wind speed 1.5 , (c) External wind speed 3.0 .
Air temperature of the crop zone, Average air temperature of the greenhouse). (a) External wind speed 0.5 , (b) External wind speed 1.5 , (c) External wind speed 3.0 .


| Boundary Condition | Input Values | Reference | |
|---|---|---|---|
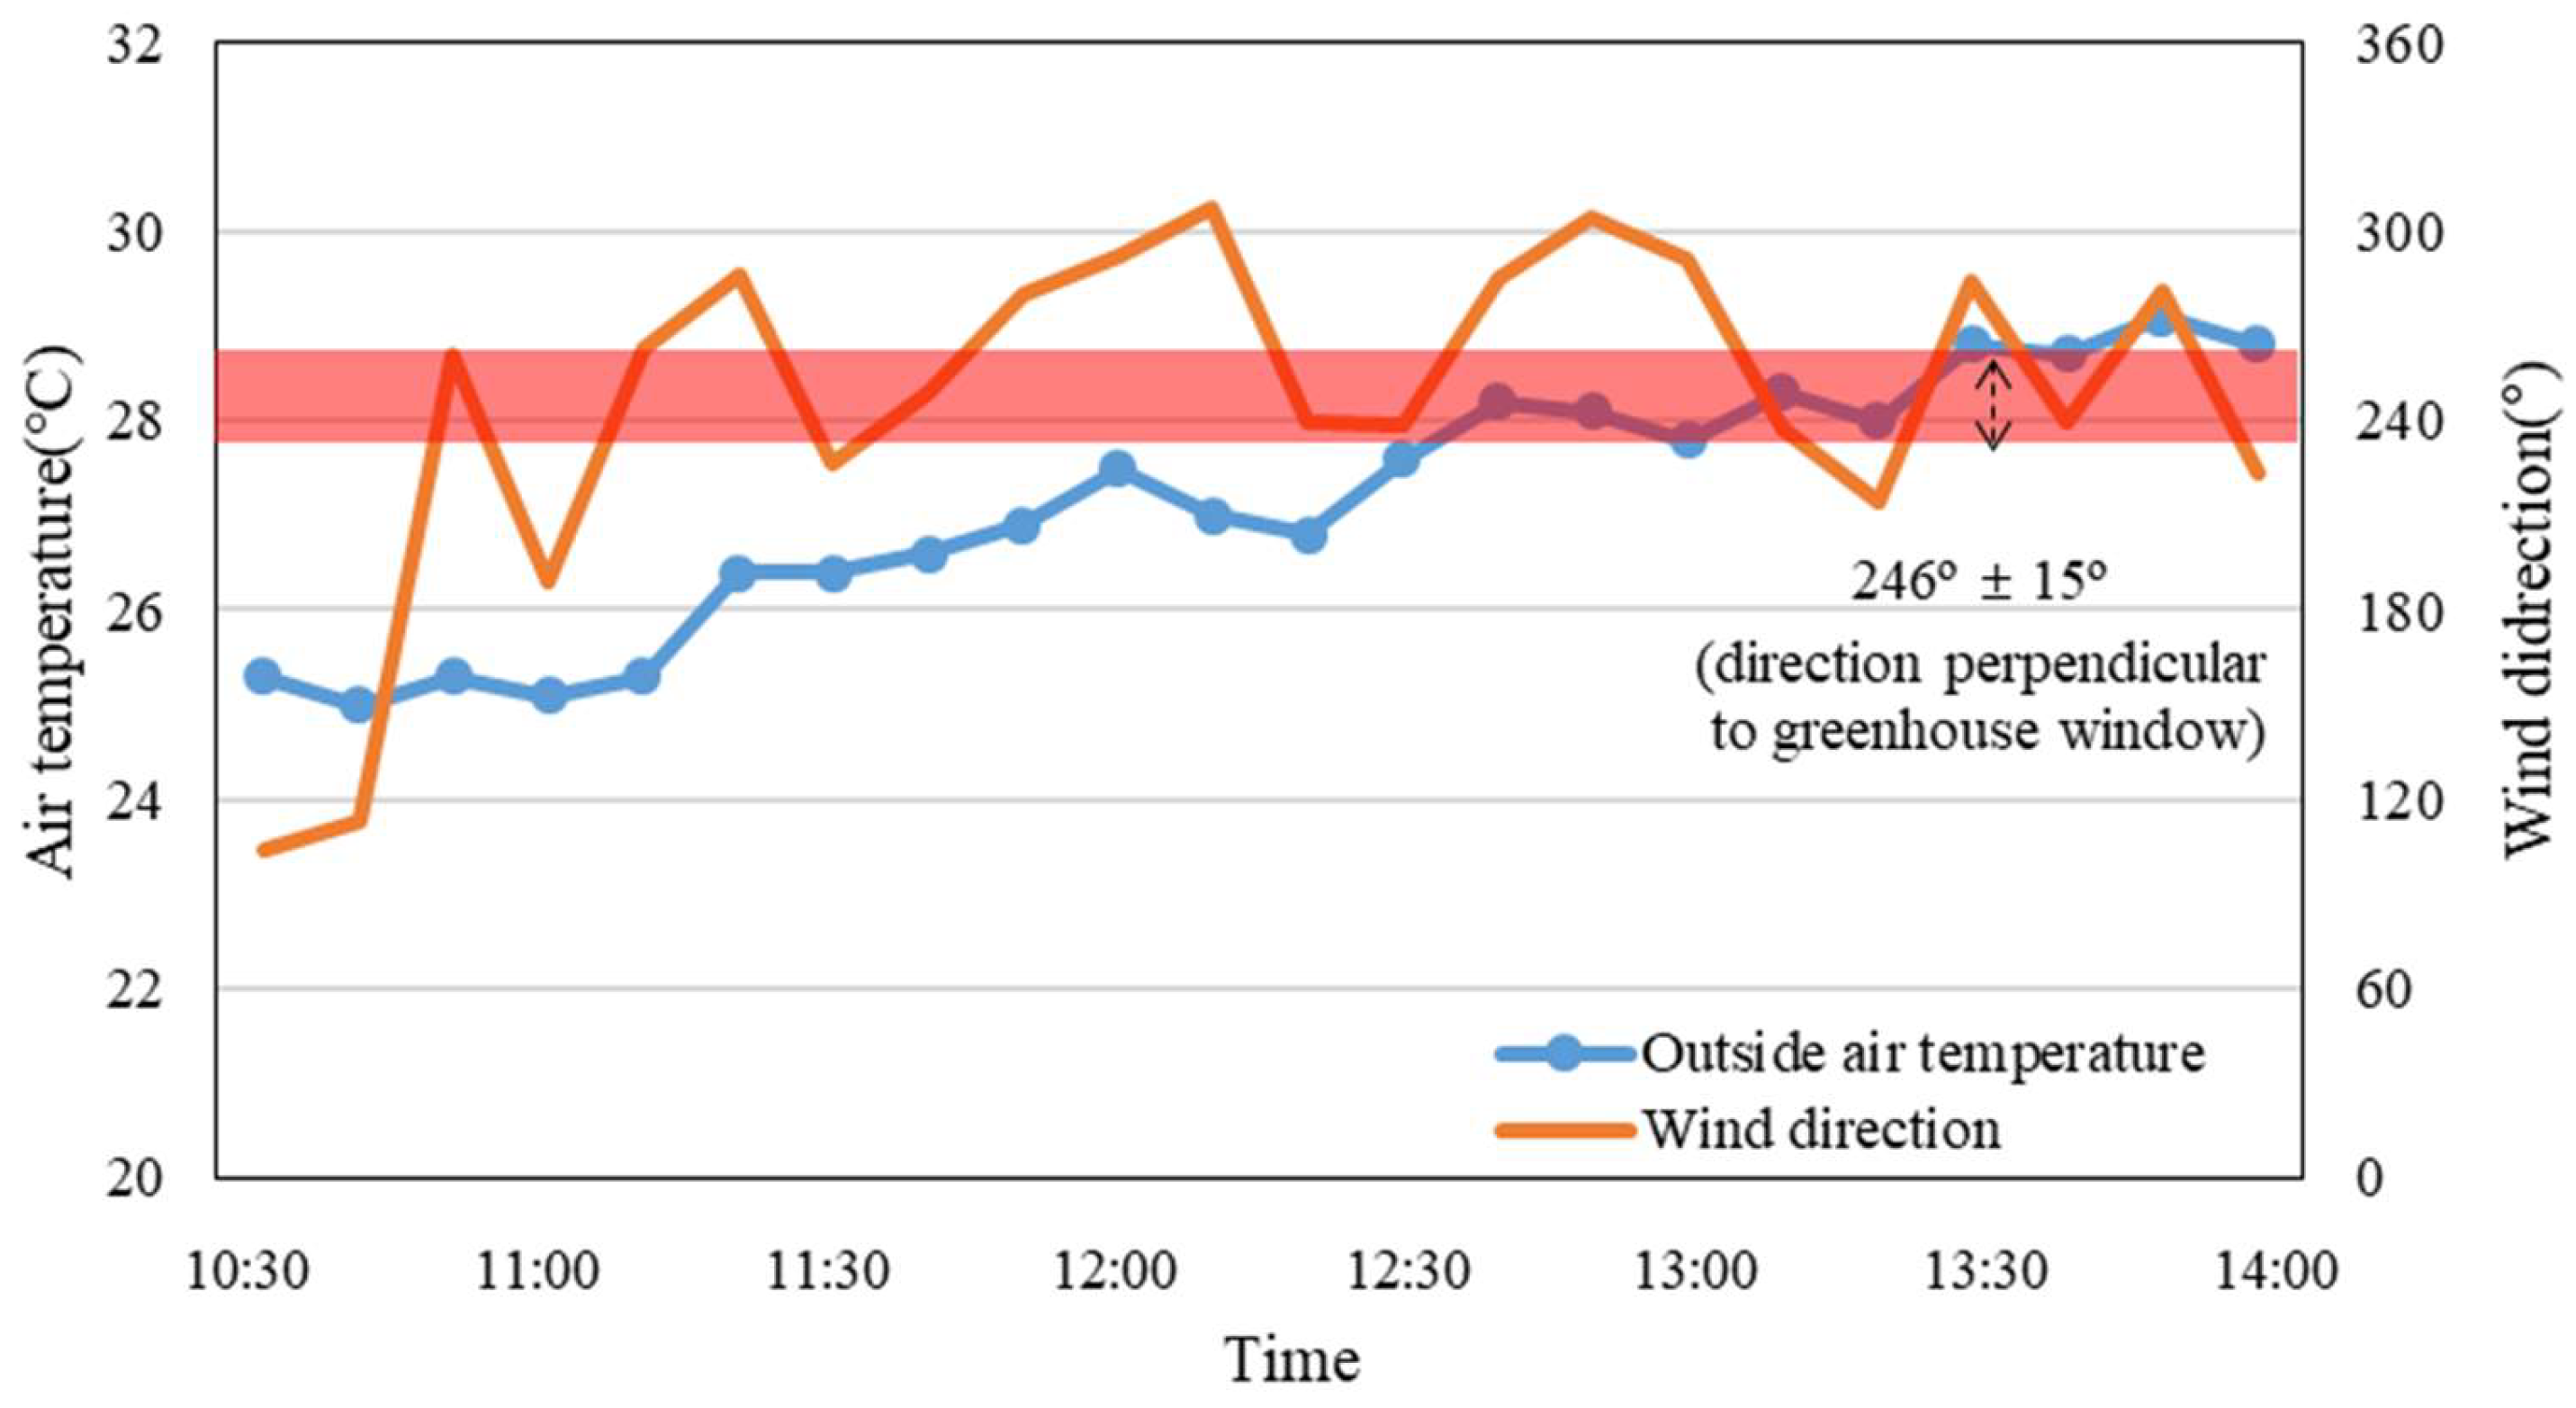
| Outside air temperature (°C) | 27.4 | Field experiment and Ochang weather station (Average value during field experiment period) | |
| Wind speed () | 1.40 | ||
| Wind direction (°) | 90 | ||
| Greenhouse wall | Temperature (°C) | 27.4 | |
| Thickness (m) | 0.0001 | ||
| Tomato | Latent energy sources () | −30.0 | Lee [25] |
| Viscous resistance () | 2.53 | ||
| Inertial resistance () | 1.92 | ||
| Turbulence model | Realizable k- | ||
| Boundary Condition | Input Values | Reference | |
|---|---|---|---|
| Outside air temperature (°C) | 35.0 | Weather station data (1990-2020) and | |
| Greenhouse wall | Temperature (°C) | 35.0 | |
| Thickness (m) | 0.0001 | MAFRA (2019) | |
| Ground temperature inside the greenhouse (°C) | 45.0 | Lee [25] | |
| Ground temperature outside the greenhouse (°C) | 44.16 | ||
| Tomato | Latent energy sources () | −30.0 | |
| Viscous resistance () | 2.53 | ||
| Inertial resistance () | 1.92 | ||
| Turbulence model | Realizable k- | ||
| Analysis Cases | Conditions |
|---|---|
| Wind direction (°) | 90 |
| Wind speed () | 0.5, 1.5, 3.0 (at the roof height of the greenhouse model) |
| Rigid height of the greenhouse | 5, 6, 7, 8, 9 |
| Total | 15 cases |
| Model | Installation of Wind Break in the Roof | Opening Condition of Roof Vents | Opening Angle of Roof Vents (°) |
|---|---|---|---|
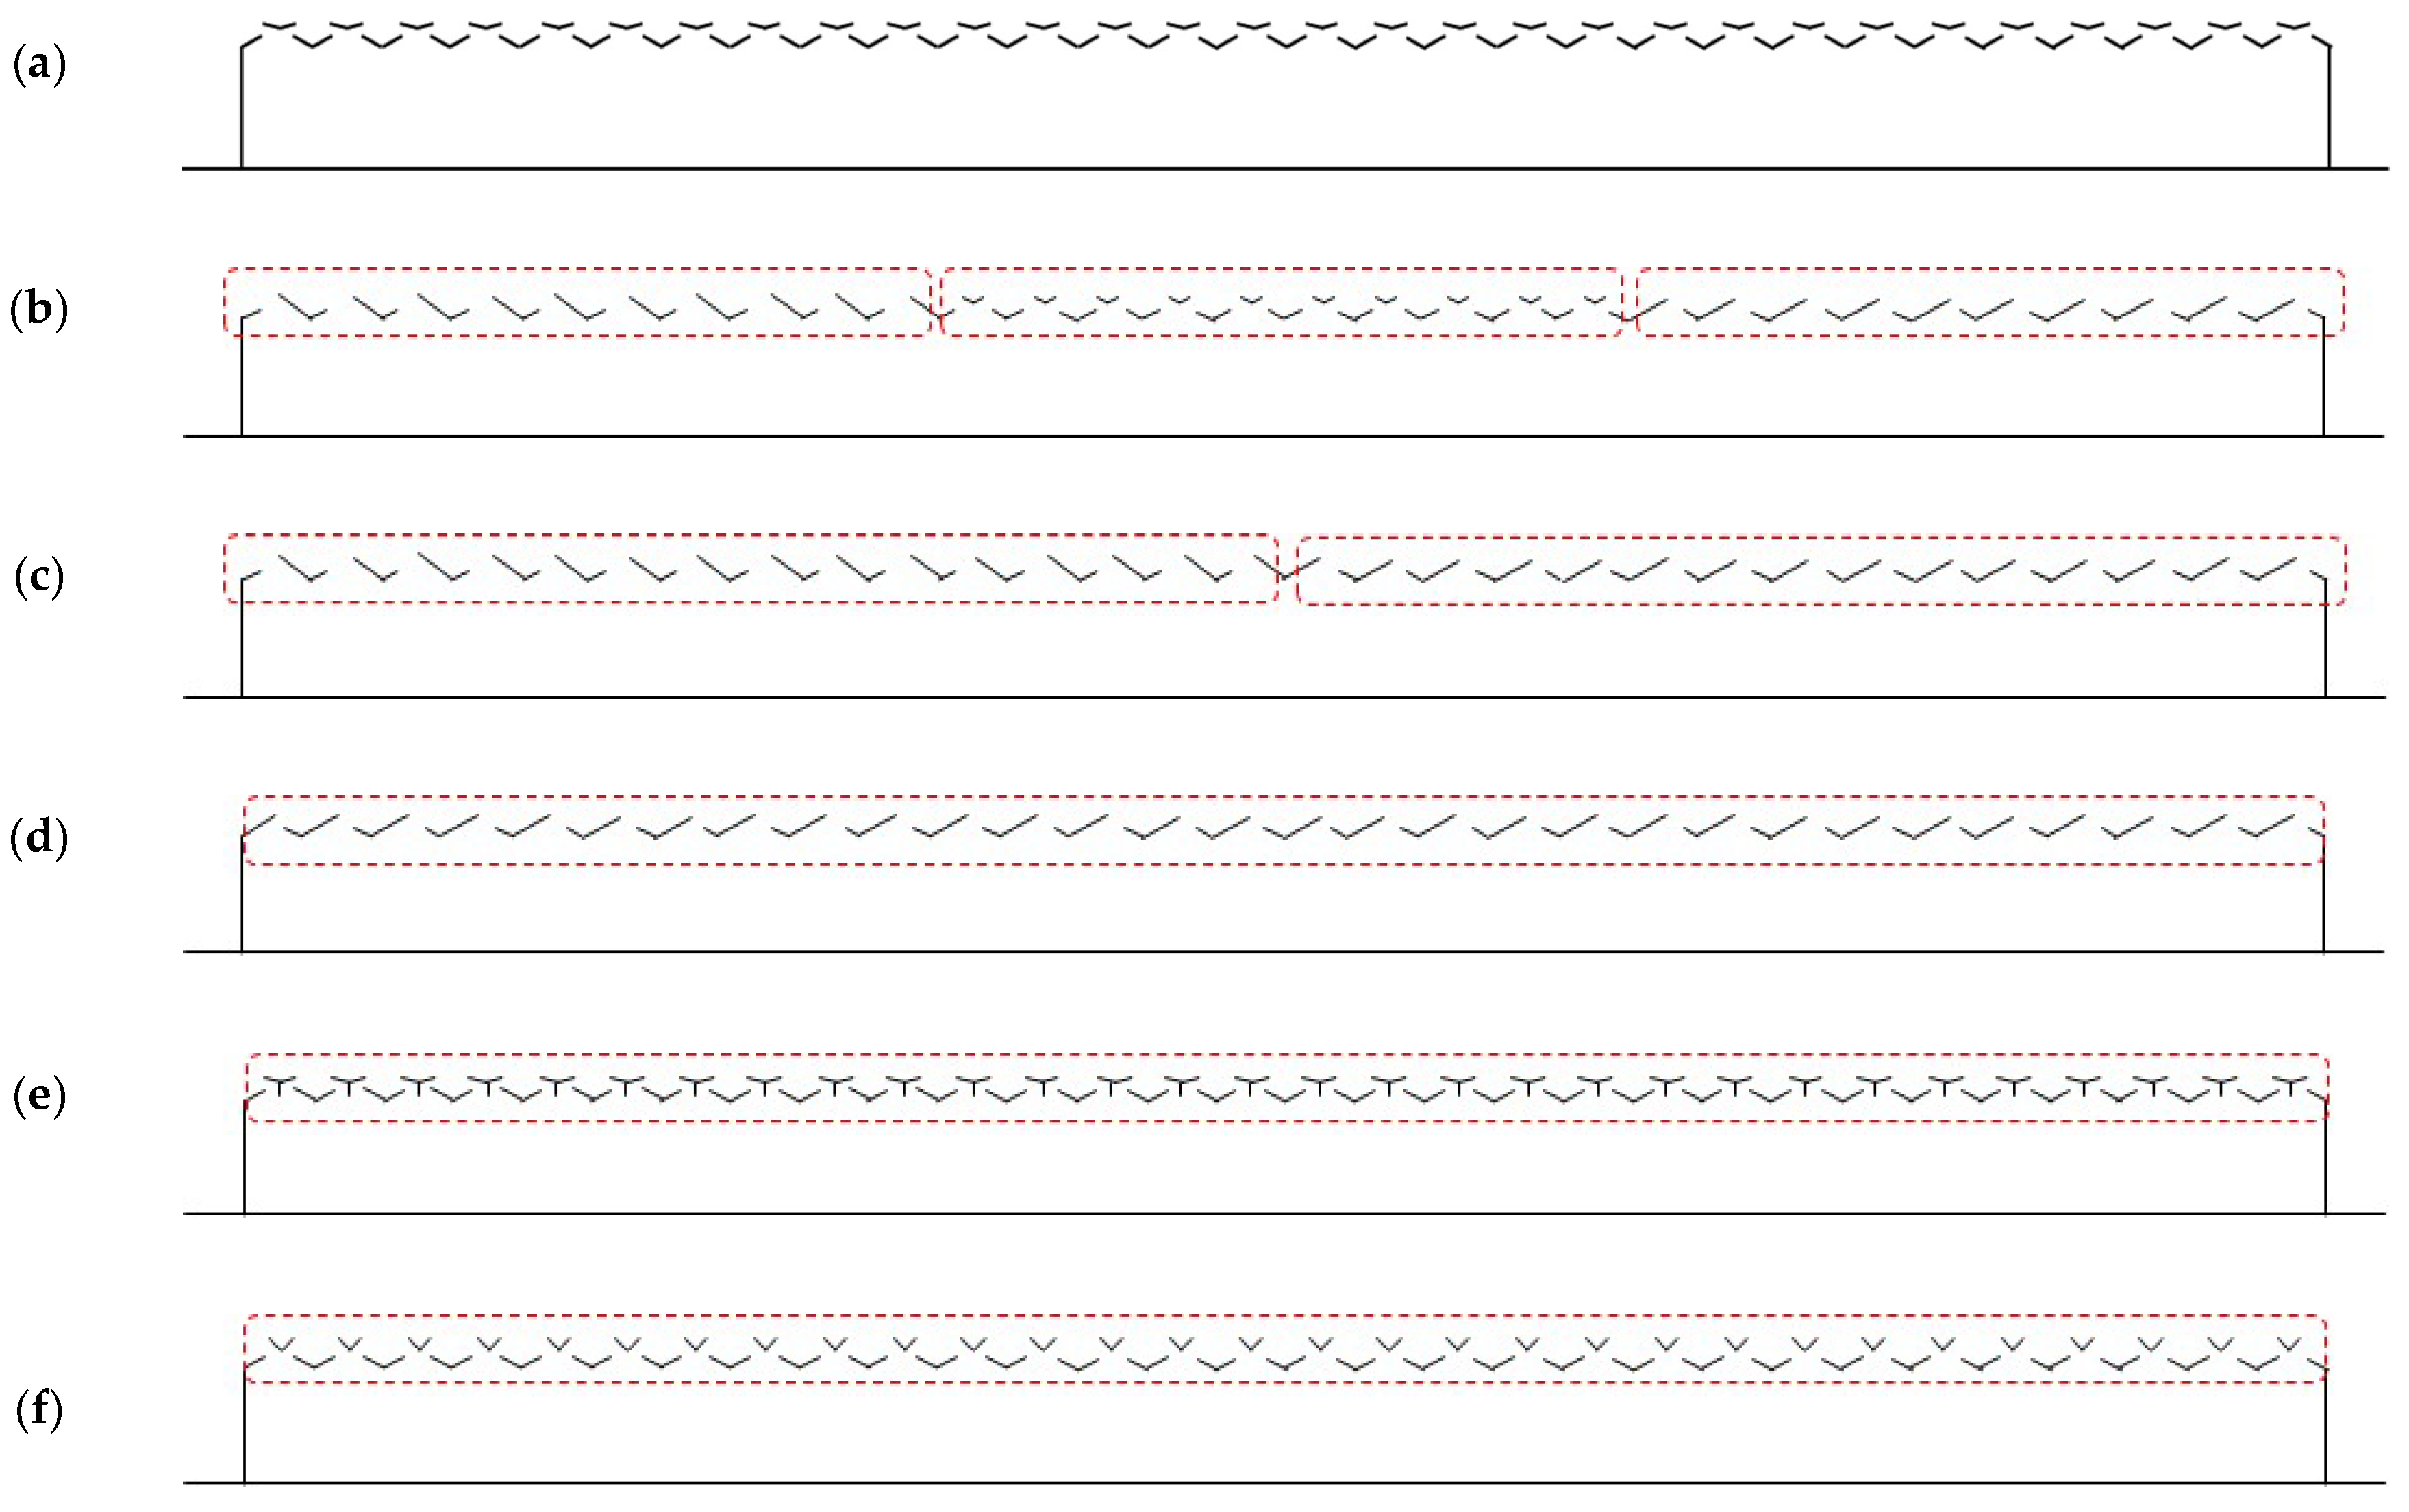
| Case 0 | X | All spans: Open on both windward and leeward sides | 45 |
| Case 1 | X | 1–5 spans: Open on the windward side 6–10 spans: Open on both windward and leeward sides 11–15 spans: Open on leeward side | 45 |
| Case 2 | X | 1–7.5 spans: Open on windward side 7.5–15 spans: Open on leeward side | 45 |
| Case 3 | X | All spans: Open on leeward side | 45 |
| Case 4 | O | All spans: Open on both windward and leeward sides | 45 |
| Case 5 | X | All spans: Open on both windward and leeward sides | 75 |
| External Wind Speed (m·s−1) | Air Exchange Rate Per Minute (AER min−1) | |
|---|---|---|
| Venlo-Type Greenhouse with Continuous Roof Vent Open | Conventional Venlo-Type Greenhouse | |
| 0.5 | 0.17 | 0.10 |
| 3.0 | 0.28 | 0.49 |
Publisher’s Note: MDPI stays neutral with regard to jurisdictional claims in published maps and institutional affiliations. |
© 2022 by the authors. Licensee MDPI, Basel, Switzerland. This article is an open access article distributed under the terms and conditions of the Creative Commons Attribution (CC BY) license (https://creativecommons.org/licenses/by/4.0/).
Share and Cite
Park, S.-J.; Lee, I.-B.; Lee, S.-Y.; Kim, J.-G.; Choi, Y.-B.; Decano-Valentin, C.; Cho, J.-H.; Jeong, H.-H.; Yeo, U.-H. Numerical Analysis of Ventilation Efficiency of a Korean Venlo-Type Greenhouse with Continuous Roof Vents. Agriculture 2022, 12, 1349. https://doi.org/10.3390/agriculture12091349
Park S-J, Lee I-B, Lee S-Y, Kim J-G, Choi Y-B, Decano-Valentin C, Cho J-H, Jeong H-H, Yeo U-H. Numerical Analysis of Ventilation Efficiency of a Korean Venlo-Type Greenhouse with Continuous Roof Vents. Agriculture. 2022; 12(9):1349. https://doi.org/10.3390/agriculture12091349
Chicago/Turabian StylePark, Se-Jun, In-Bok Lee, Sang-Yeon Lee, Jun-Gyu Kim, Young-Bae Choi, Cristina Decano-Valentin, Jeong-Hwa Cho, Hyo-Hyeog Jeong, and Uk-Hyeon Yeo. 2022. "Numerical Analysis of Ventilation Efficiency of a Korean Venlo-Type Greenhouse with Continuous Roof Vents" Agriculture 12, no. 9: 1349. https://doi.org/10.3390/agriculture12091349