Article

Spatiotemporal Patterns and Key Driving Factors of Soil Salinity in Dry and Wet Years in an Arid Agricultural Area with Shallow Groundwater Table

1
Institute of Soil and Water Conservation, Northwest A&F University, Yangling 712100, China
2
Key Laboratory of Water Resources and Hydropower Engineering Science, Wuhan University, Wuhan 430072, China
3
College of Water Conservancy and Civil Engineering, Inner Mongolia Agricultural University, Hohhot 010018, China
*
Author to whom correspondence should be addressed.
Agriculture 2022, 12(8), 1243; https://doi.org/10.3390/agriculture12081243
Submission received: 13 July 2022 / Revised: 13 August 2022 / Accepted: 15 August 2022 / Published: 17 August 2022

Abstract

:
Soil salinization is a major eco-environmental problem in irrigated agro-ecosystems. Understanding regional soil salinity spatial patterns and seasonal dynamics and their driving factors under changing environments is beneficial to managing soil salinity to maintain agricultural production in arid agricultural areas. To better investigate this topic, soil salinity was measured, ranging from topsoil to the depth of 1.8 m in an irrigation district with 68 sampling sites before and after the crop growing seasons of the dry year of 2017 and wet year of 2018. Soil texture, groundwater table depth, groundwater salinity, and crop type were monitored. The results indicated that an increase in soil salinity in the root zone (0–0.6 m) was accompanied by a decrease in soil salinity in the deep soil (0.6–1.8 m) through the crop growing season due to water movement from the deep layer to shallow layer, whereas the opposite trend was observed during the fallow seasons. During the dry year, the area with soil desalted was measured to be 19.89%, 14.42%, and 2.78% lower at depths of 0–0.6 m, 0.6–1.2 m, and 1.2–1.8 m than that during the wet year. The groundwater table depth in the crop growing season had the least impact on the change in root zone soil salinity (p > 0.05). Interactions between crop types and groundwater table depth had a significant effect on the change of soil salinity in the root zone during the growing season of the dry year, but were insignificant during the wet year. Crop types, groundwater table depth, and climate conditions determined the contribution of shallow groundwater to crop water consumption and, to a greater extent, soil salinity. Regression tree analysis showed that groundwater salinity and soil texture had a greater influence on soil salinity than groundwater table depth and land elevation. The effect of groundwater on soil salinity is strongly related to soil texture, and the salinity of fine-textured soil was 36–54% greater than that of coarse-textured soil due to large capillary action. Therefore, we suggest strengthening groundwater management in areas with fine-textured soil to relieve soil salinization, particularly during dry years.

1. Introduction

Salt-affected soils cover 10% of terrestrial ecosystems [1] and are found in more than 100 countries with an annual growth rate of more than 2 Mha [2,3]. Soil salinization reduces soil and water quality, decreases biodiversity, and restricts agricultural productivity [4], which has been a serious eco-environmental problem in irrigated agro-ecosystems. Maintaining agricultural production in arid and semi-arid regions presents a great challenge due to increasing changes in climatic conditions [5,6]. Utilizing salt-affected lands in changing environments is important to feed the burgeoning global population [7]. Therefore, understanding the spatiotemporal dynamics of soil salinity and its impact factors during dry and wet years is critical for the effective management of soil salinity.
In arid irrigated agricultural regions, the spatial variation in soil salinity is driven by land-use types, groundwater table depth, groundwater salinity, the elevation of landform, land cultivation time, distance to drainage, etc. [8,9,10,11,12,13]. In recent decades, studies have focused on the relationships between the spatial distribution of soil salinity and environmental factors [9,14,15]. A salinity hazard map was developed by Searle and Baillie [16] based on topographic indices, soils, geology, climate, and vegetation. Evans and Caccetta [17] predicted areas at risk from dryland salinity using remote sensing data and landform data. Wang et al. [12] found that soil salinity significantly migrated from upstream to downstream in an inland river watershed. All the above-mentioned studies were conducted on natural broad-scale areas, including various land-use types. Spatial variations of environmental factors were strong in these studies, which was beneficial to model variations in soil salinity by environmental factors with or without a very slight impact of human activities [14]. However, regular irrigation results in lower soil salinity through leaching in croplands [11], making it unclear whether environmental factors alone could be used to predict soil salinity. In addition, studies on the seasonal dynamics of soil salinity have generally been conducted in lysimeters or experimental plots in the root zone, and only single crop types with a single factor or dual factors have been considered [18,19,20,21,22,23]. The interaction effects of multiple factors (e.g., meteorological conditions, groundwater table depths, crop types, and initial soil salinity conditions) on soil salinity dynamics were ignored because of the difficulty of the experimental design [24]. To the best of our knowledge, few studies have systematically reported the spatial pattern and temporal dynamics of regional soil salinity and its impact factors using multi-time monitoring data in dry and wet years. At the regional scale, continuous monitoring of soil salinity at multiple soil sampling sites across different seasons makes it possible to understand spatiotemporal patterns in salinity, their impact factors, and multi-factor effects on the seasonal dynamics of soil salinity, thereby providing support for regional salt management in irrigated croplands [25].
The Hetao Irrigation District, located in the upper reaches of the Yellow River basin, China, was selected as the case study area. The district is an arid agricultural region with a shallow water table, and more than 50% of the total irrigated cropland (5.7 × 10⁹ m2) is saline-cultivated land [26]. The soil salinity of Hetao is serious and complicated due to extensive irrigation, poor drainage, special climate conditions, and flexible soil characteristics [11,27]. Numerous efforts have been made to better manage soil salinity in the Hetao Irrigation District. The spatial distribution and temporal dynamics of soil salinity have been monitored and evaluated, and driving factors and management strategies have also been proposed [4,28,29]. However, most previous studies have focused on the spatial distribution of regional soil salinity or the temporal dynamics of soil salinity at the field scale [4,25]. The impact of single factors such as groundwater table depth, groundwater salinity, crop type, and land type on soil salinity is well understood, while multi-factor interactions on soil salinity spatiotemporal dynamics are unclear.
Therefore, the objectives of this study were to: (1) analyze the spatiotemporal patterns of soil salinity in dry and wet years, (2) reveal the effects of environmental factors and their interactions on soil salinity spatial pattern variation and seasonal changes, and (3) propose regional soil salinity management strategies in irrigated agro-ecosystems. In order to implement these objectives, soil salinity observations in an irrigation district of Hetao with 68 sampling sites were conducted at the beginning and end of the crop growing season during the dry year of 2017 and the wet year of 2018. Groundwater table depth, groundwater salinity, crop types, and soil textures were monitored or surveyed at each sampling.

2. Materials and Methods
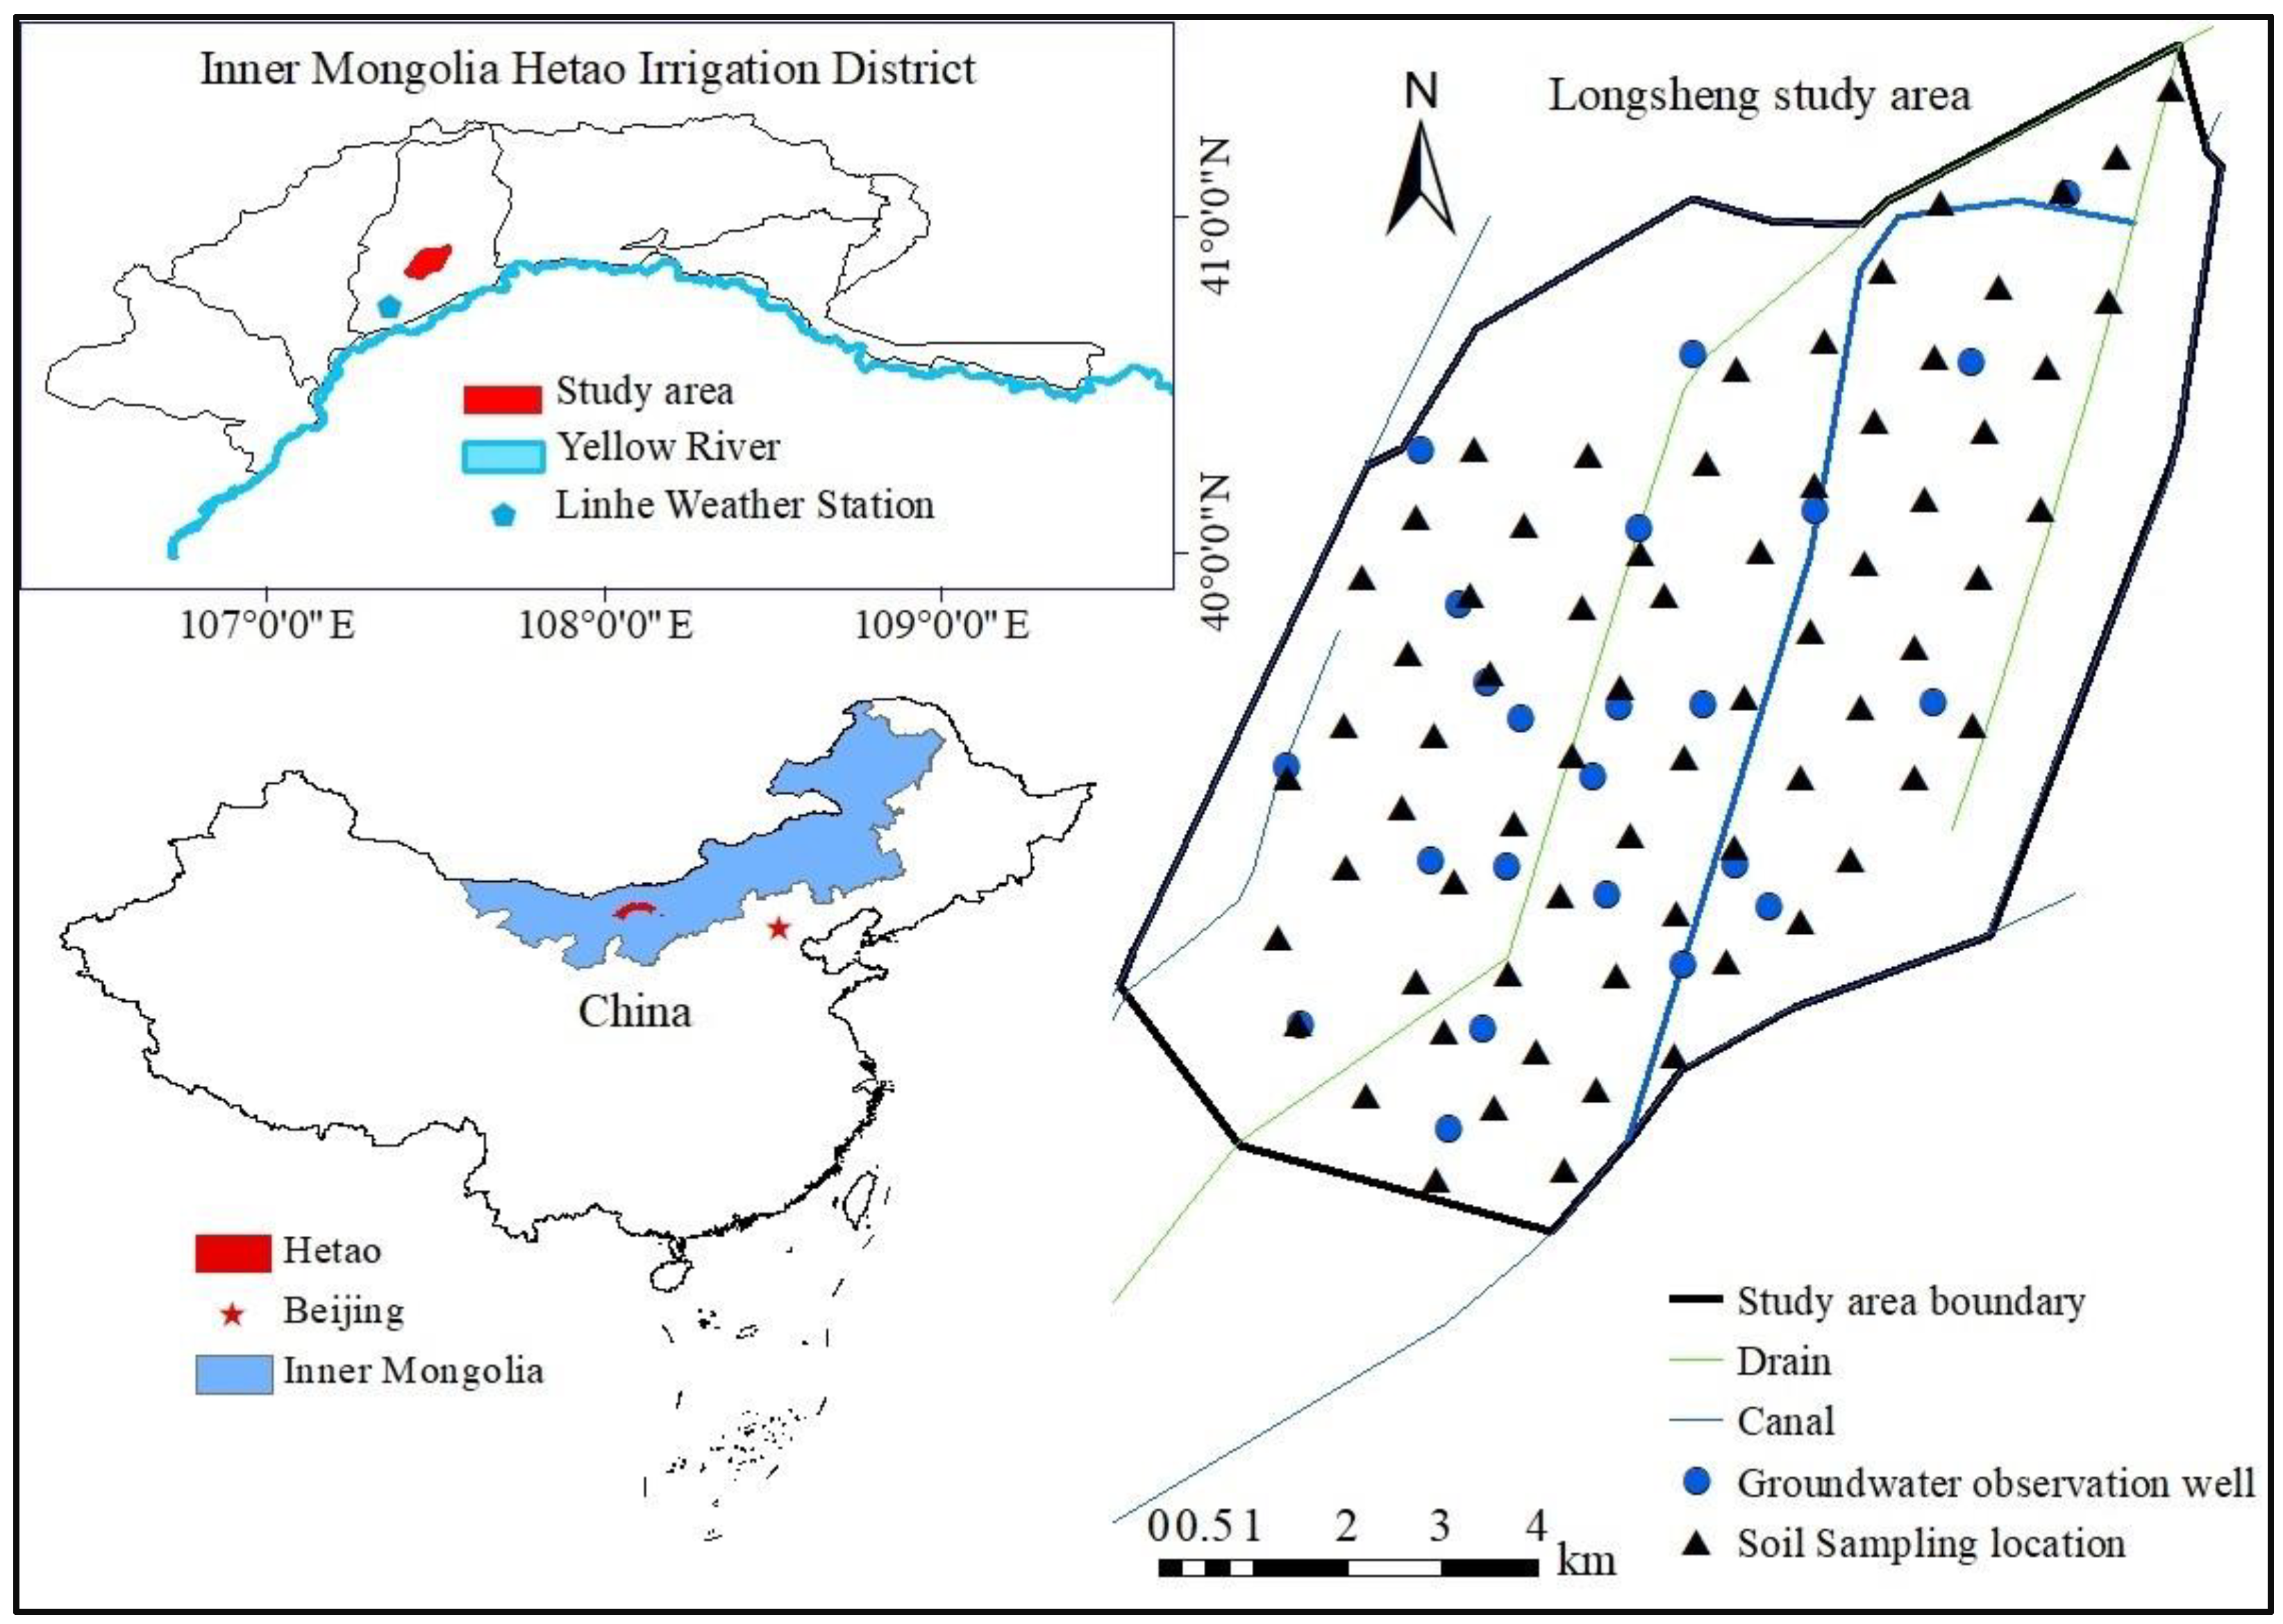
2.1. Study Area

The study area, Longsheng Irrigation District, is in the central region of the Hetao Irrigation District in the western region of Inner Mongolia, China (Figure 1). The region comprises 82 km2, with dimensions of 15.5 × 8.0 km2, with an arid, continental climate. The average annual precipitation at the Linhe Weather Station adjacent to the study area was 148.8 mm. The climate exhibits a strong seasonal trend, with 85% of the rain occurring from May to September. Based on the weather data obtained from the Linhe Weather Station, the cumulative precipitation was 100.5 mm in 2017 and 176.2 mm in 2018. During the crop growing season from May to September, the cumulative precipitation was 53.1 mm in 2017 and 156.6 mm in 2018. These two years were selected to represent the dry and wet years, respectively, according to hydrological frequency analysis. As shown in Figure 2, the groundwater table in this area is shallow, varying from 0.0 to 3.0 m during the year. According to field surveys, there exists loamy sand, sandy loam, silty clay, silt loam, and silt. Soil texture varies greatly in vertical layers. In recent years, maize, sunflower, spring wheat, and some other vegetables (e.g., processing tomato, seed melon, and pepper) were the main crops. The averaged irrigation water volume of maize, sunflower, and spring wheat were 441 mm, 348 mm, and 388 mm, respectively [30]. The salt concentration of the irrigation water was 0.54 g/L [11]. The salt mass balance analysis showed that the salt accumulation in the aquifer of the study area is 47.41 g/m2, accounting for 93.30% of the total salt accumulation at present [25].

2.2. Groundwater Observations and Soil Samplings

In the Longsheng study area, groundwater table depth, groundwater salinity, and soil salinity were monitored in 2017 and 2018. Groundwater table depth was measured at 23 groundwater observation wells (Figure 1) either every 4 h using automatic water level loggers (HOBO-U20, USA) or every 10 days manually. Measurements of soil salinity and groundwater salinity were conducted four times at 68 sampling sites from early May to late September of 2017 and 2018 (Figure 1), and these measurement times were denoted as Y1705, Y1709, Y1805, and Y1809. For each observation, the measurements of soil salinity were replicated twice at each sampling site. Soil samples were collected from the topsoil to a depth of 1.8 m, or until the groundwater table depth if it was shallower than 1.8 m, with an interval of 0.2 m. A total of 4582 soil samples were collected to measure soil salinity and soil water content. Soil salinity was determined by measuring the electrical conductivity of the soil-water solution mixed in a 1:5 (soil:water) ratio using an electrical conductivity meter (DDSJ-308F, China) [31]. The crop type at each soil sampling location was surveyed. The soil texture of each layer was also examined. The elevation of the landform was drawn from a digital elevation model (DEM) (https://earthexplorer.usgs.gov/?tdsourcetag=s_pctim_aiomsg accessed on 15 December 2021).

2.3. Statistical Analyses

The spatial distribution of mean soil salinity at the depths of 0–0.6 m, 0.6–1.2 m, 1.2–1.8 m, and 0–1.8 m was estimated using the ordinary kriging method [32]. Spherical and Gaussian models were employed to fit the empirical semivariograms, and models with the highest coefficient of determination (R2) and lowest residual sums of squares (RSS) were taken as the fitted models [33]. The same method was used for the spatial distribution of groundwater table depth (GWD), groundwater salinity (GWS), and soil water content (SWC).
A regression tree approach [34] was used to evaluate the relative importance of environmental factors on soil salinity, including GWD, GWS, SWC, and DEM. The mathematical expression of the regression tree model is as follows:
f ( x ) = m = 1 M C m I ( x R m )
where f(x) is the mean of the subset sample data; M is the number of regression tree model subsets; Cm is the response mean of the m-th subset data sample; Rm is the m-th subset; and I(xRm) is an indicator function, where if xRm, I is taken as one, otherwise, it is taken as zero. Trees were created using the ANOVA method [35].
The impact factors on the seasonal dynamics of soil salinity were statistically analyzed using a multi-way analysis of variance. Multiple comparisons were determined using the least significant difference test with p < 0.05.

3. Results

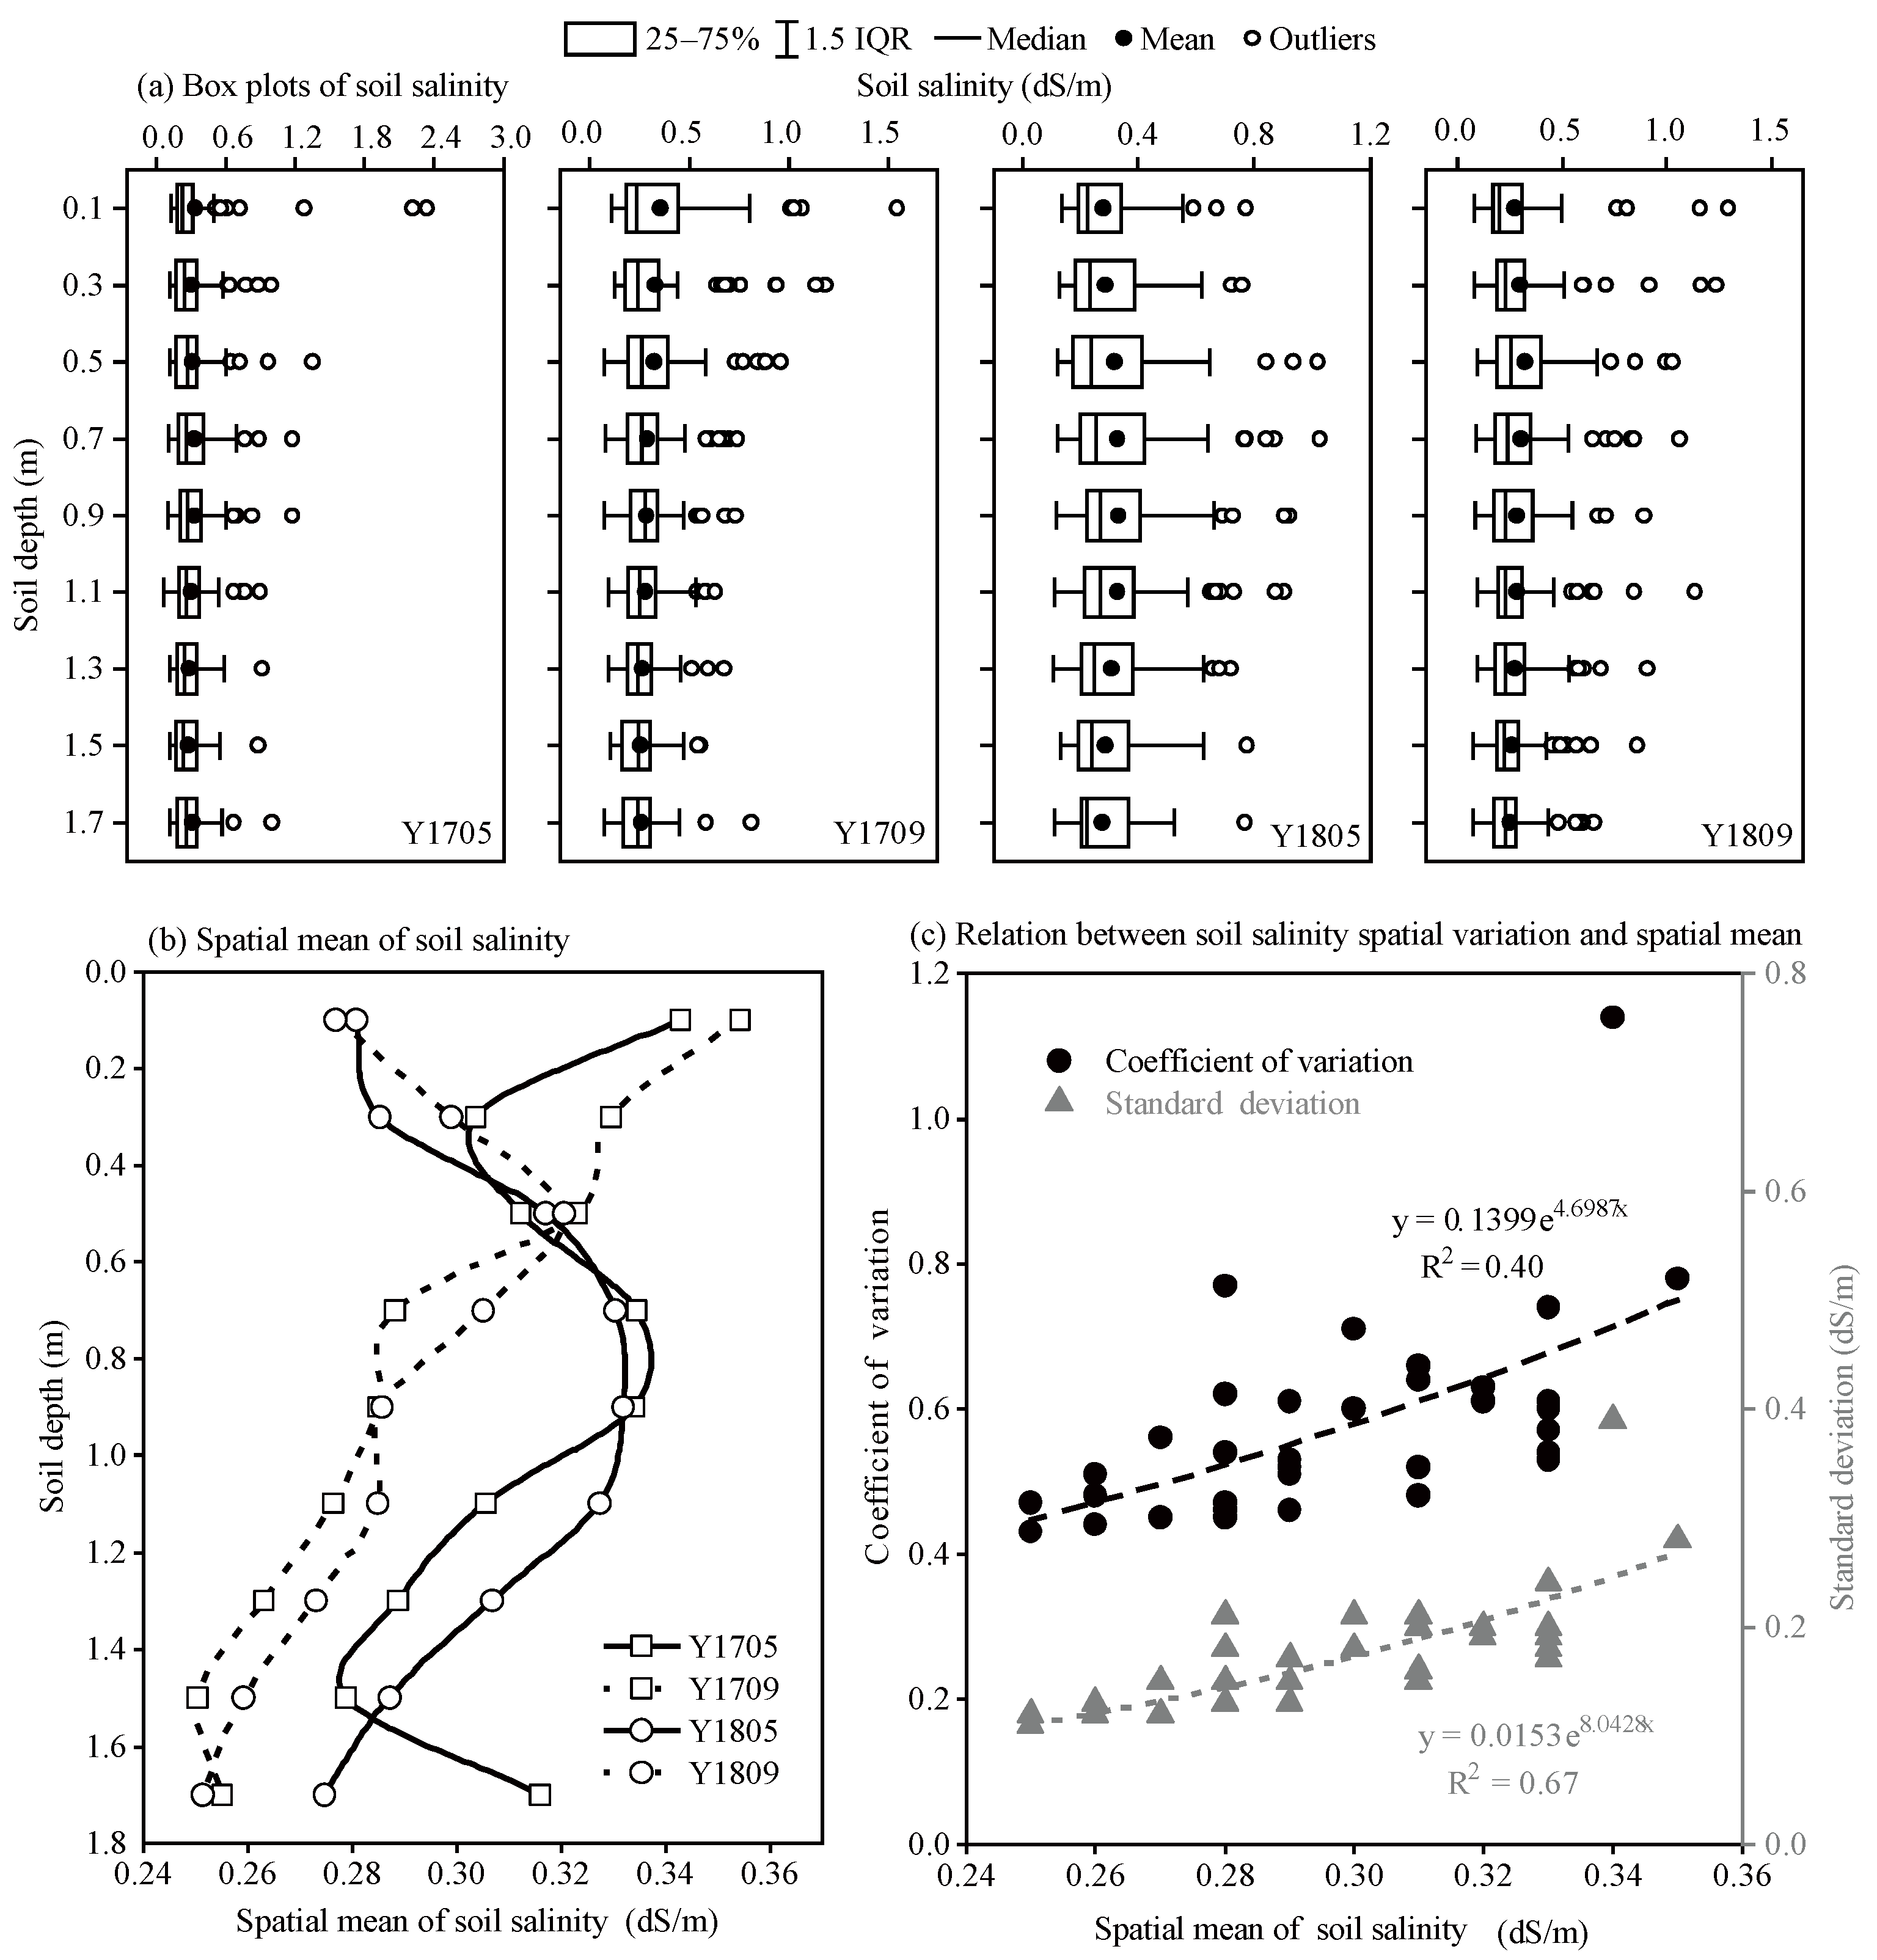
3.1. Soil Salinity Statistical Characteristics

The soil salinity at different depths for the four sampling times is plotted in Figure 3. In all box plots shown in Figure 3a, soil salinity in most soil layers for the four sampling times ranged from 0.1 dS/m to 1.2 dS/m, with most being 0.1 dS/m to 0.4 dS/m. Outliers were concentrated on the side with greater soil salinity, and the medians were closer to the lower quartile than to the upper quartile. The spatial means of soil salinity were much larger than the median for all four sampling times. As shown in Figure 3b, the mean soil salinity exhibited obvious seasonal variation characteristics. In early May (Y1705 and Y1805), soil salinity in the whole profile was approximately an inverted “C” type, in which soil salinity within the depth of 0.6–1.0 m exceeded those within 0–0.6 m and 1.0–1.8 m. Soil salinity within the depth of 0–0.4 m in Y1809 was less than that in Y1709, which is caused by the heavy precipitation during the crop growing season in 2018. Neglecting smaller soil salinity in 0–0.4 m in Y1809, soil salinity decreased from the topsoil to the depth of 1.8 m in late September (Y1709 and Y1809). The relationship between the spatial variability and the mean value of soil salinity in the study area is shown in Figure 3c. Both the standard deviation and variation coefficient of soil salinity increased exponentially with mean soil salinity, which differed from that of soil water content.

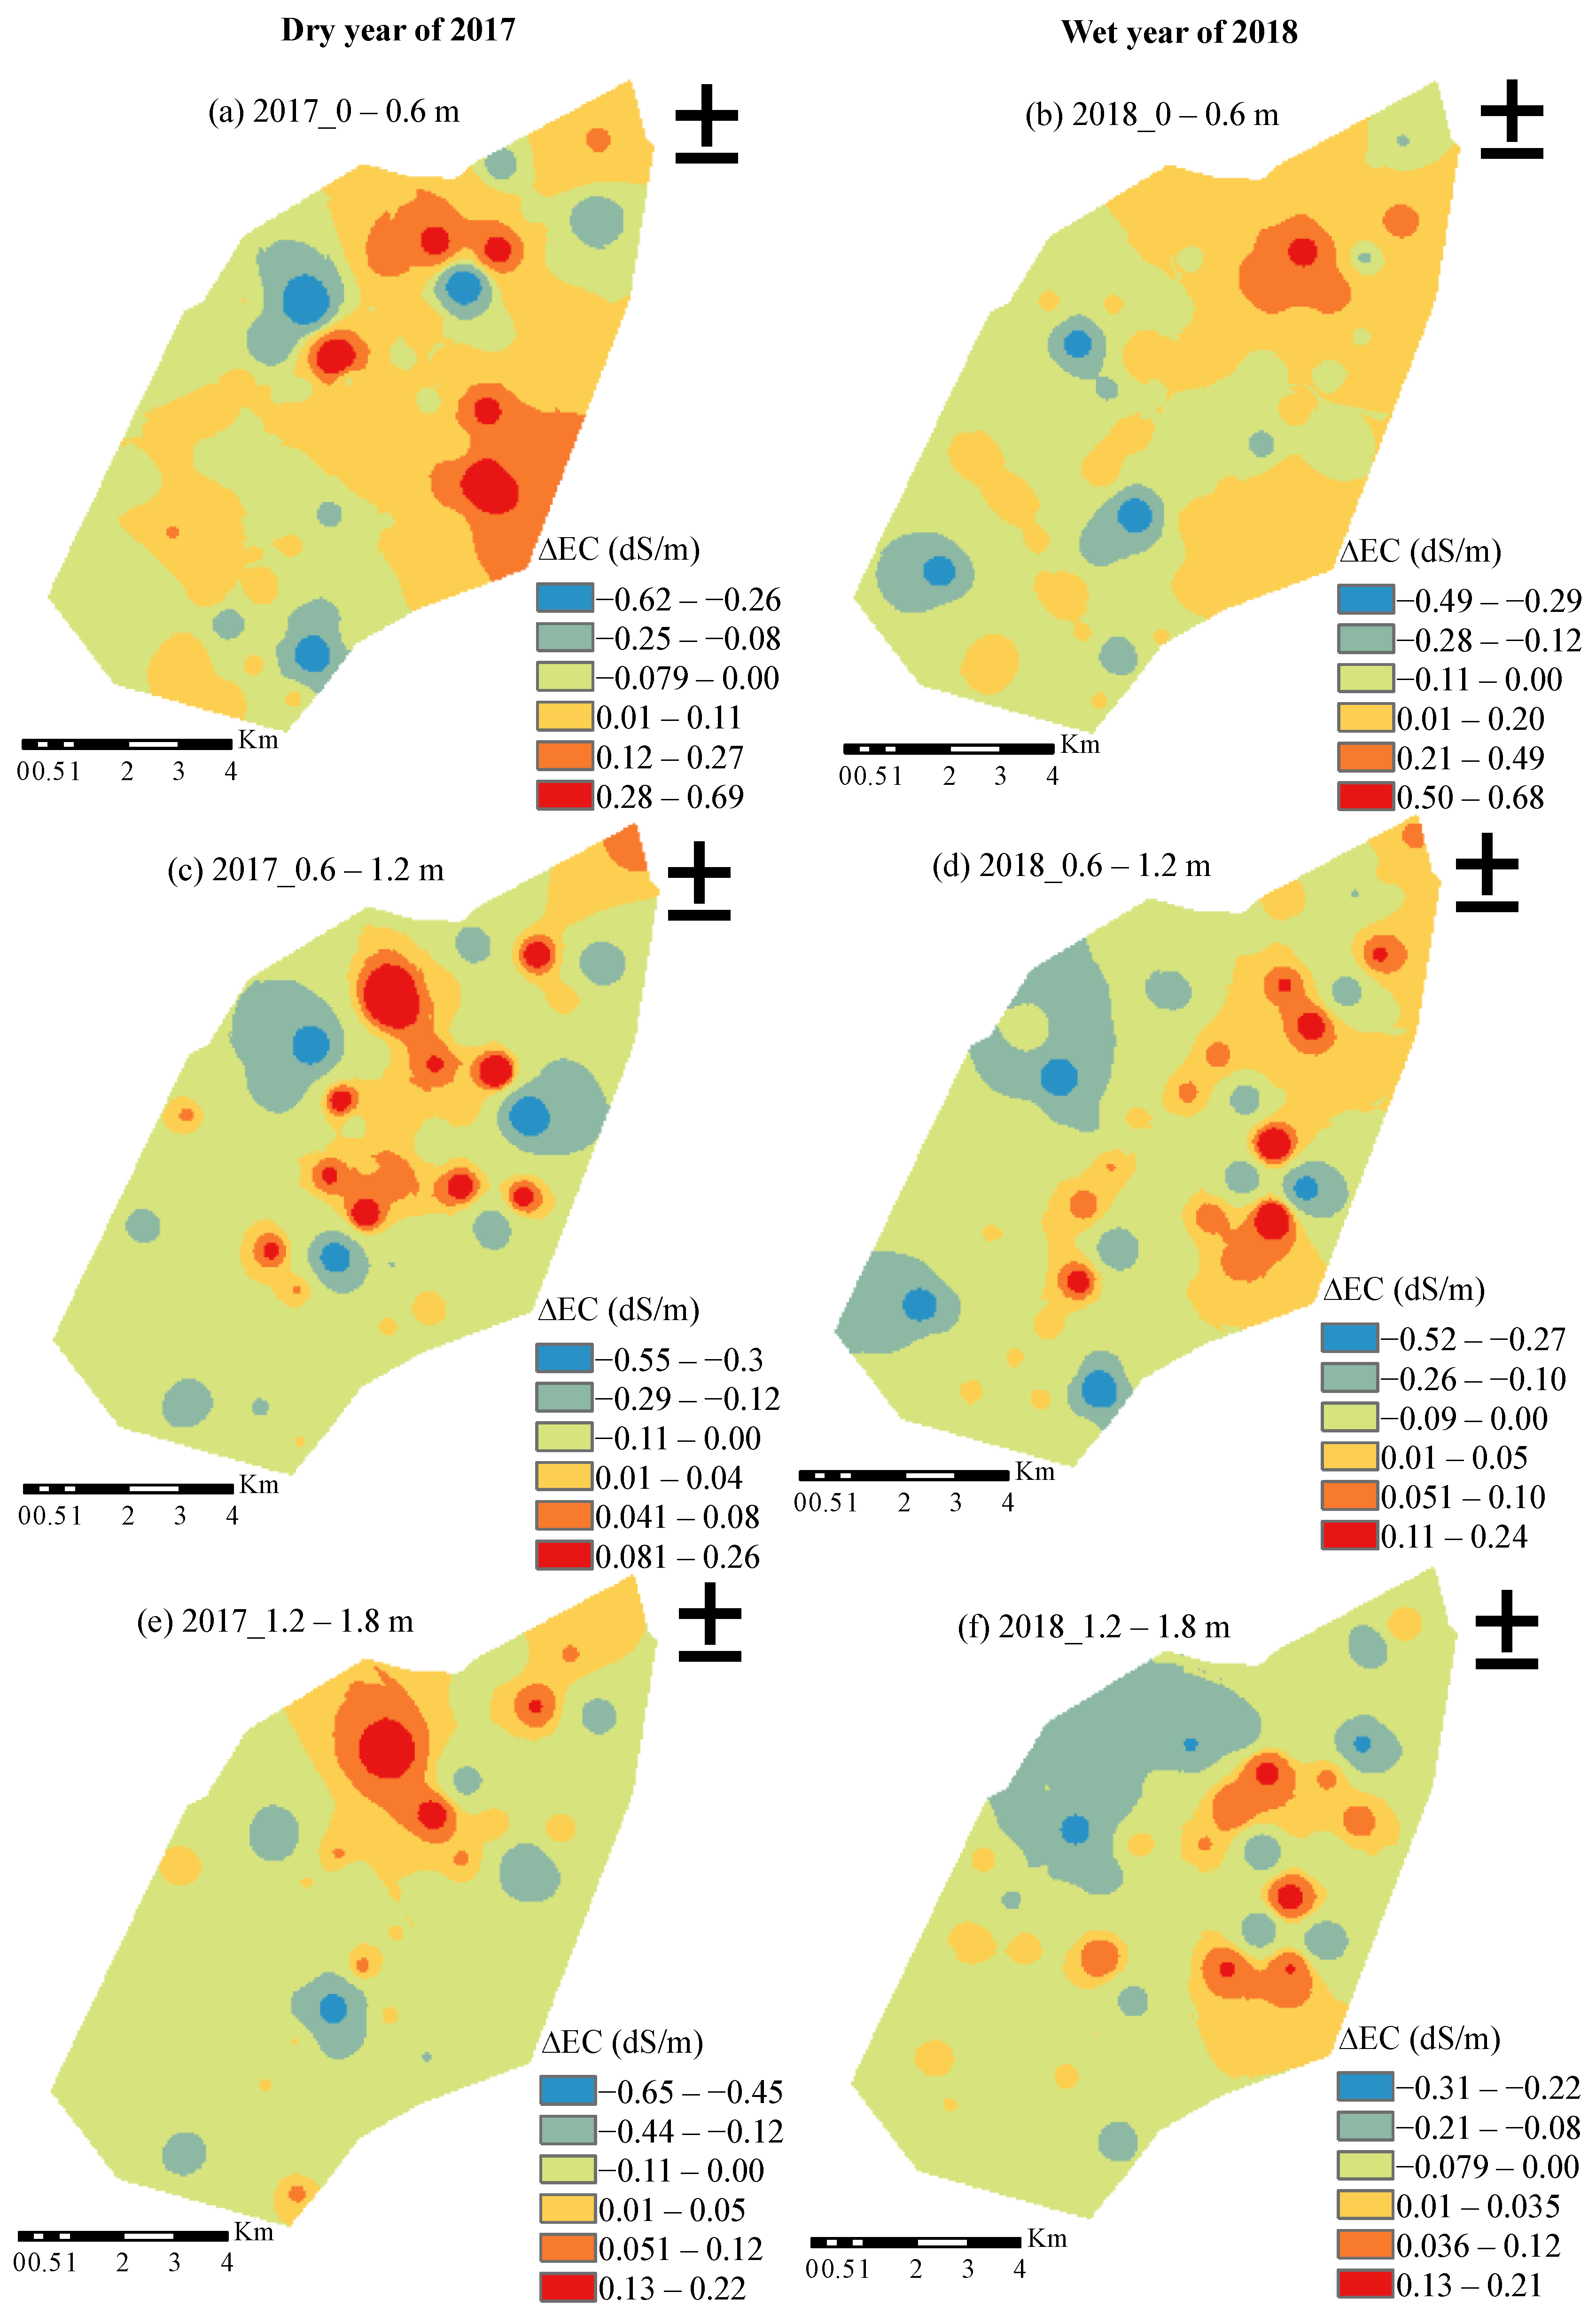
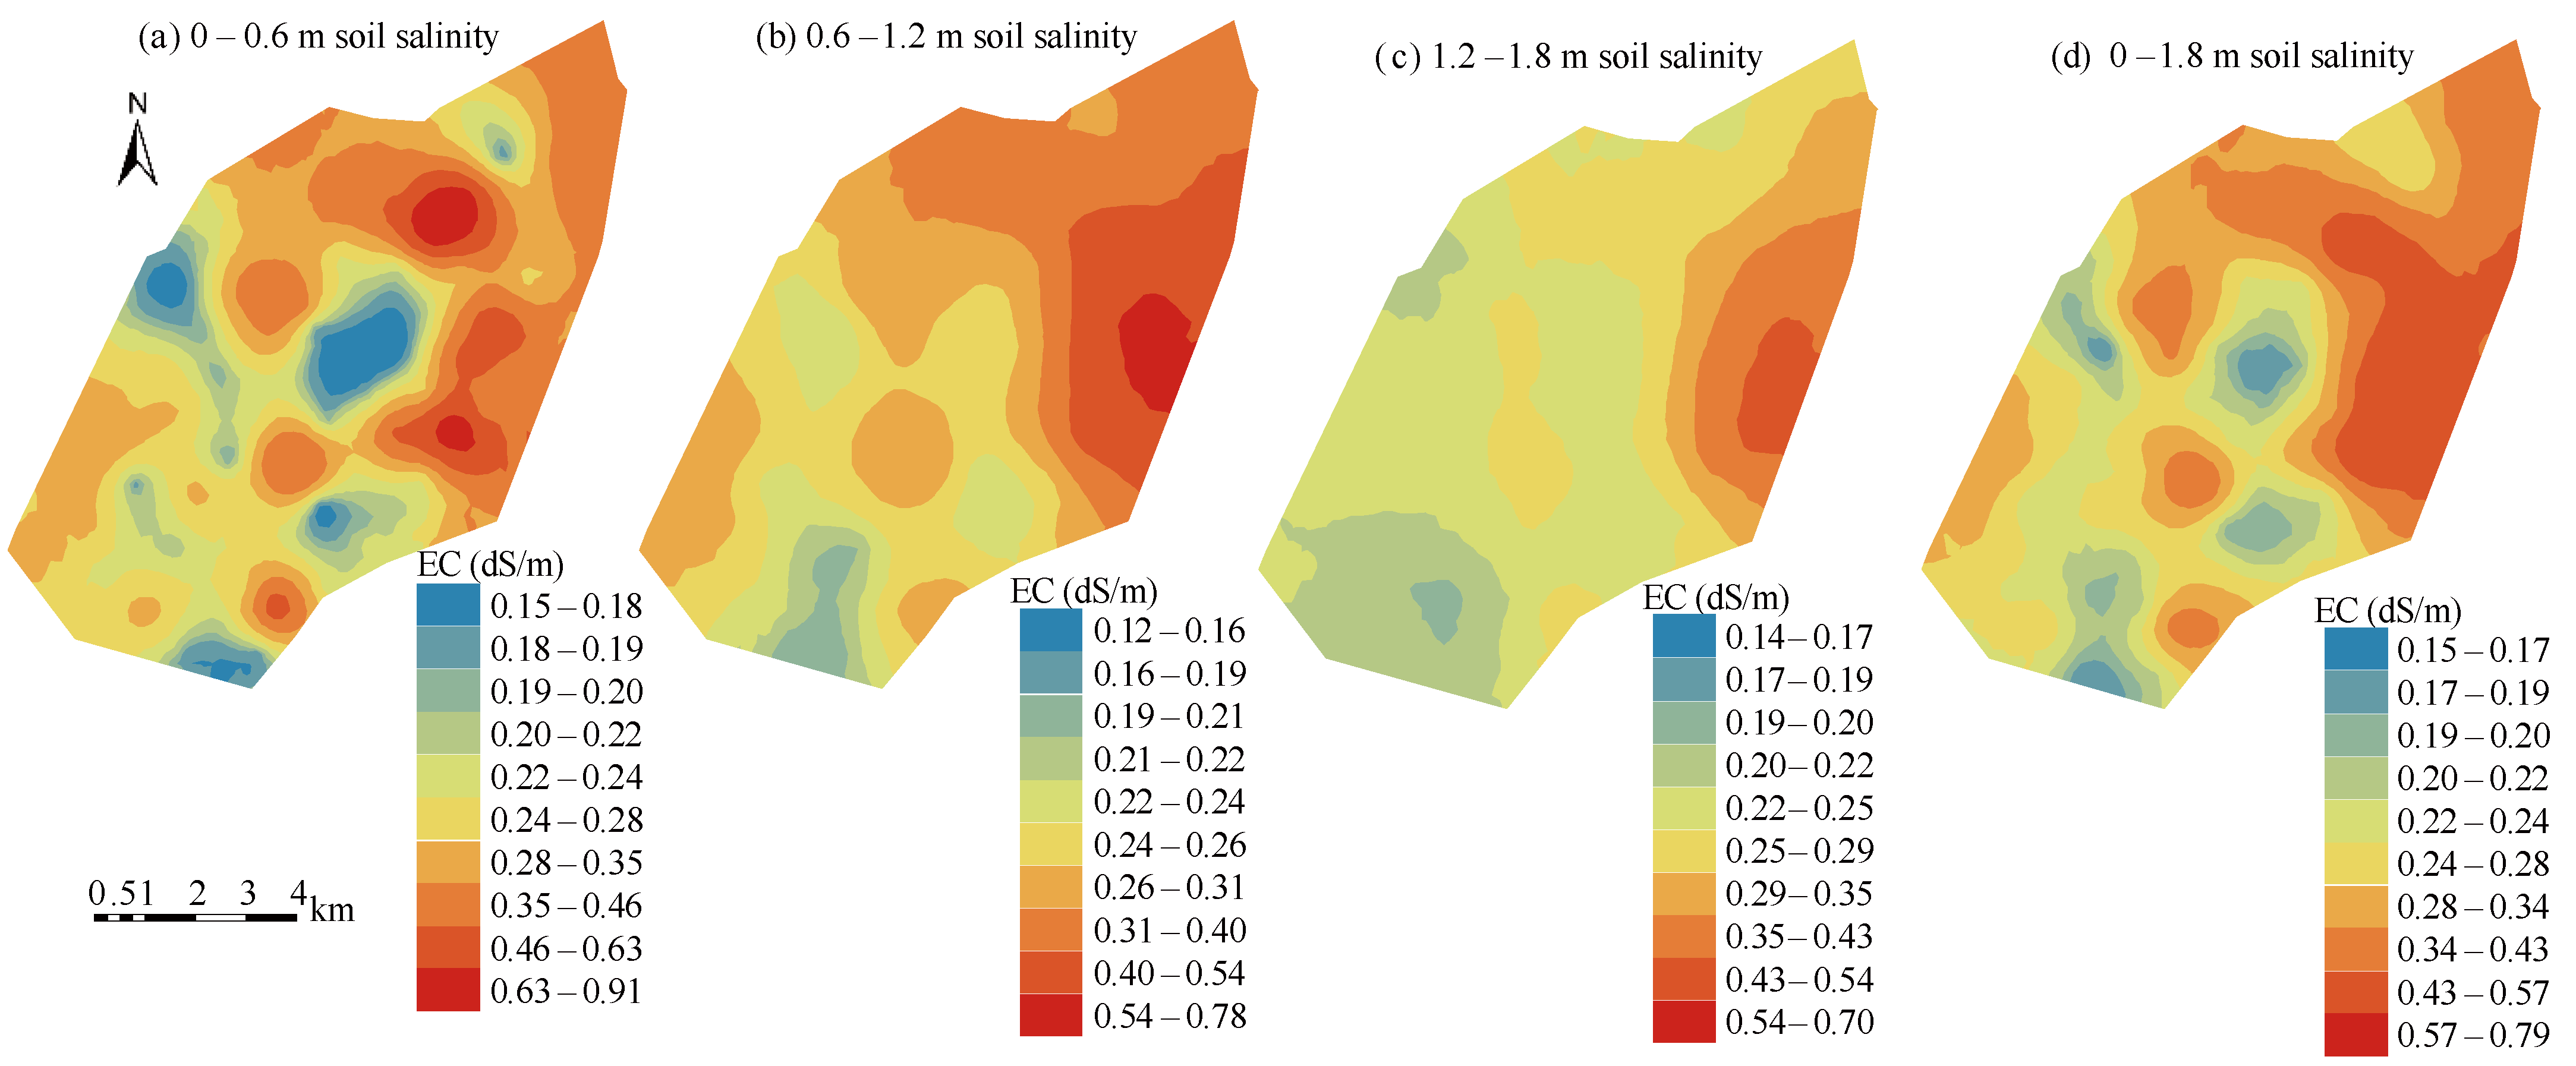
3.2. Spatiotemporal Patterns of Soil Salinity

The root zone (within the depth of 0–0.6 m) soil salinity was 0.32, 0.34, 0.29, and 0.30 dS/m in Y1705, Y1709, Y1805, and Y1809, respectively. The root zone soil salinity in late September of 2017 and 2018 increased by 0.02 dS/m and 0.01 dS/m compared to that in early May, showing that soil salt was accumulated in the crop growing season. Soil salinity in the root zone decreased by 14.7% from Y1709 to Y1805. This is consistent with the results reported by Sun et al. [23], where soil salinity decreased by 10.86 to 26.14% from late September to early May with 180 mm autumn irrigation in field plots. In Y1705, Y1709, Y1805, and Y1809, soil salinity from 0.6–1.2 m was 0.33, 0.28, 0.33, and 0.29 dS/m, respectively, where, during the crop growing season of the dry and wet year, the salinity decreased by 0.05 and 0.04 dS/m. The changes in soil salinity within the depth of 0–0.6 m and 0.6–1.2 m indicate that the heavy precipitation in wet years can help to leach more salt from the root zone to the soil layer of 0.6–1.2 m, and salt accumulation in the root zone is less during the wet year than that in the dry year. Soil salinity was measured to be 0.29, 0.26, 0.29, and 0.26 dS/m at a depth of 1.2–1.8 m, respectively. Soil salinity at a depth of 0.6–1.2 m and 1.2–1.8 m in early May was evidently larger than that in late September, and soil salinity in deep soil (within the depth of 0.6–1.8 m) was desalted in the crop growing season and accumulated in the fallow season. Overall, the changes in soil salinity in the root zone and deep soil showed opposing trends, which means increasing amounts of salt in the root zone are concurrent with decreasing amounts in the deep soil and vice-versa. The dry year accelerates soil salinity accumulation in the root zone, and heavy precipitation in wet years can leach more salt from the root zone to the subsoil.
The spatial distribution of soil salinity increments during the crop growing season in the dry year of 2017 and wet year of 2018 are plotted in Figure 4. The root zone soil salinity in the central and eastern parts of the study area increased in the dry year, while locations that experienced increasing salinity were concentrated in the northeast region during the wet year. The total land area with increasing root zone soil salinity during the crop growing season was measured as 45.34 km2 in the dry year of 2017, which was 25.25% larger than that of the wet year of 2018. The total land area with soil salinity decreasing at a depth of 0.6–1.2 m was 50.50 km2 in 2017 and 59.01 km2 in 2018, which accounted for 61.45% and 71.80% of the whole study area, respectively. Similarly, 80% of the study area was desalted within a depth of 1.2–1.8 m during the study timeline. The area with soil desalted at the depths of 0–0.6 m, 0.6–1.2 m, and 1.2–1.8 m during the dry year of 2017 were 19.89%, 14.42%, and 2.78% lower than that in the wet year of 2017, which indicates that heavy precipitation accelerated soil salinity desalting, but the effects of precipitation on soil salinity are weakened with increasing depth.

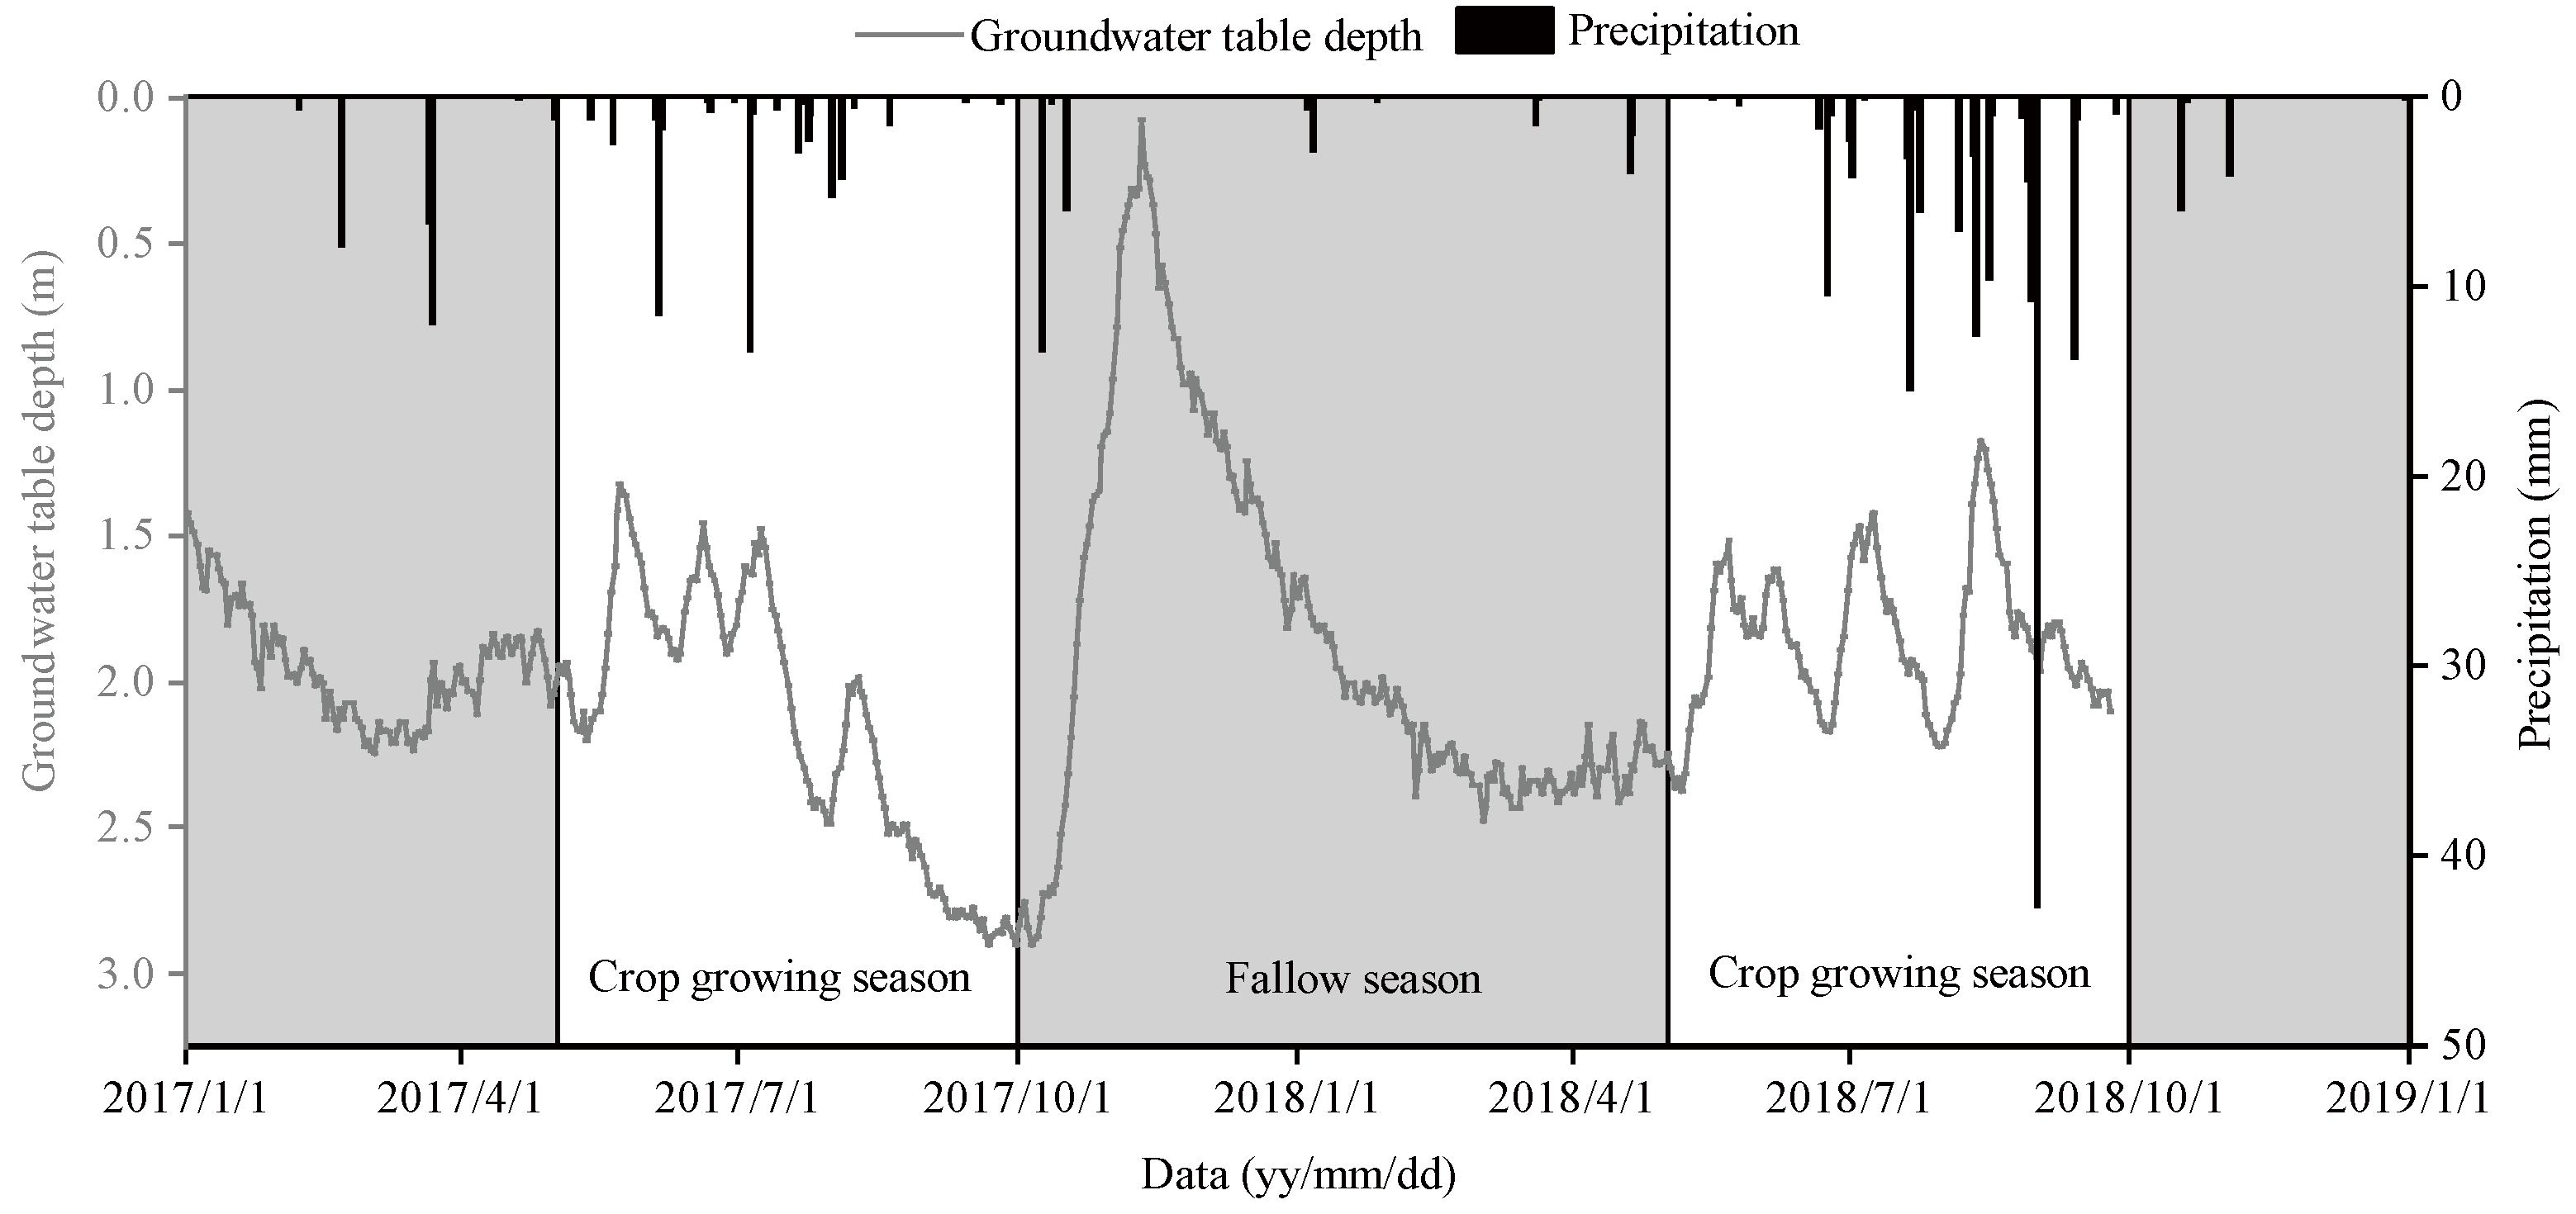
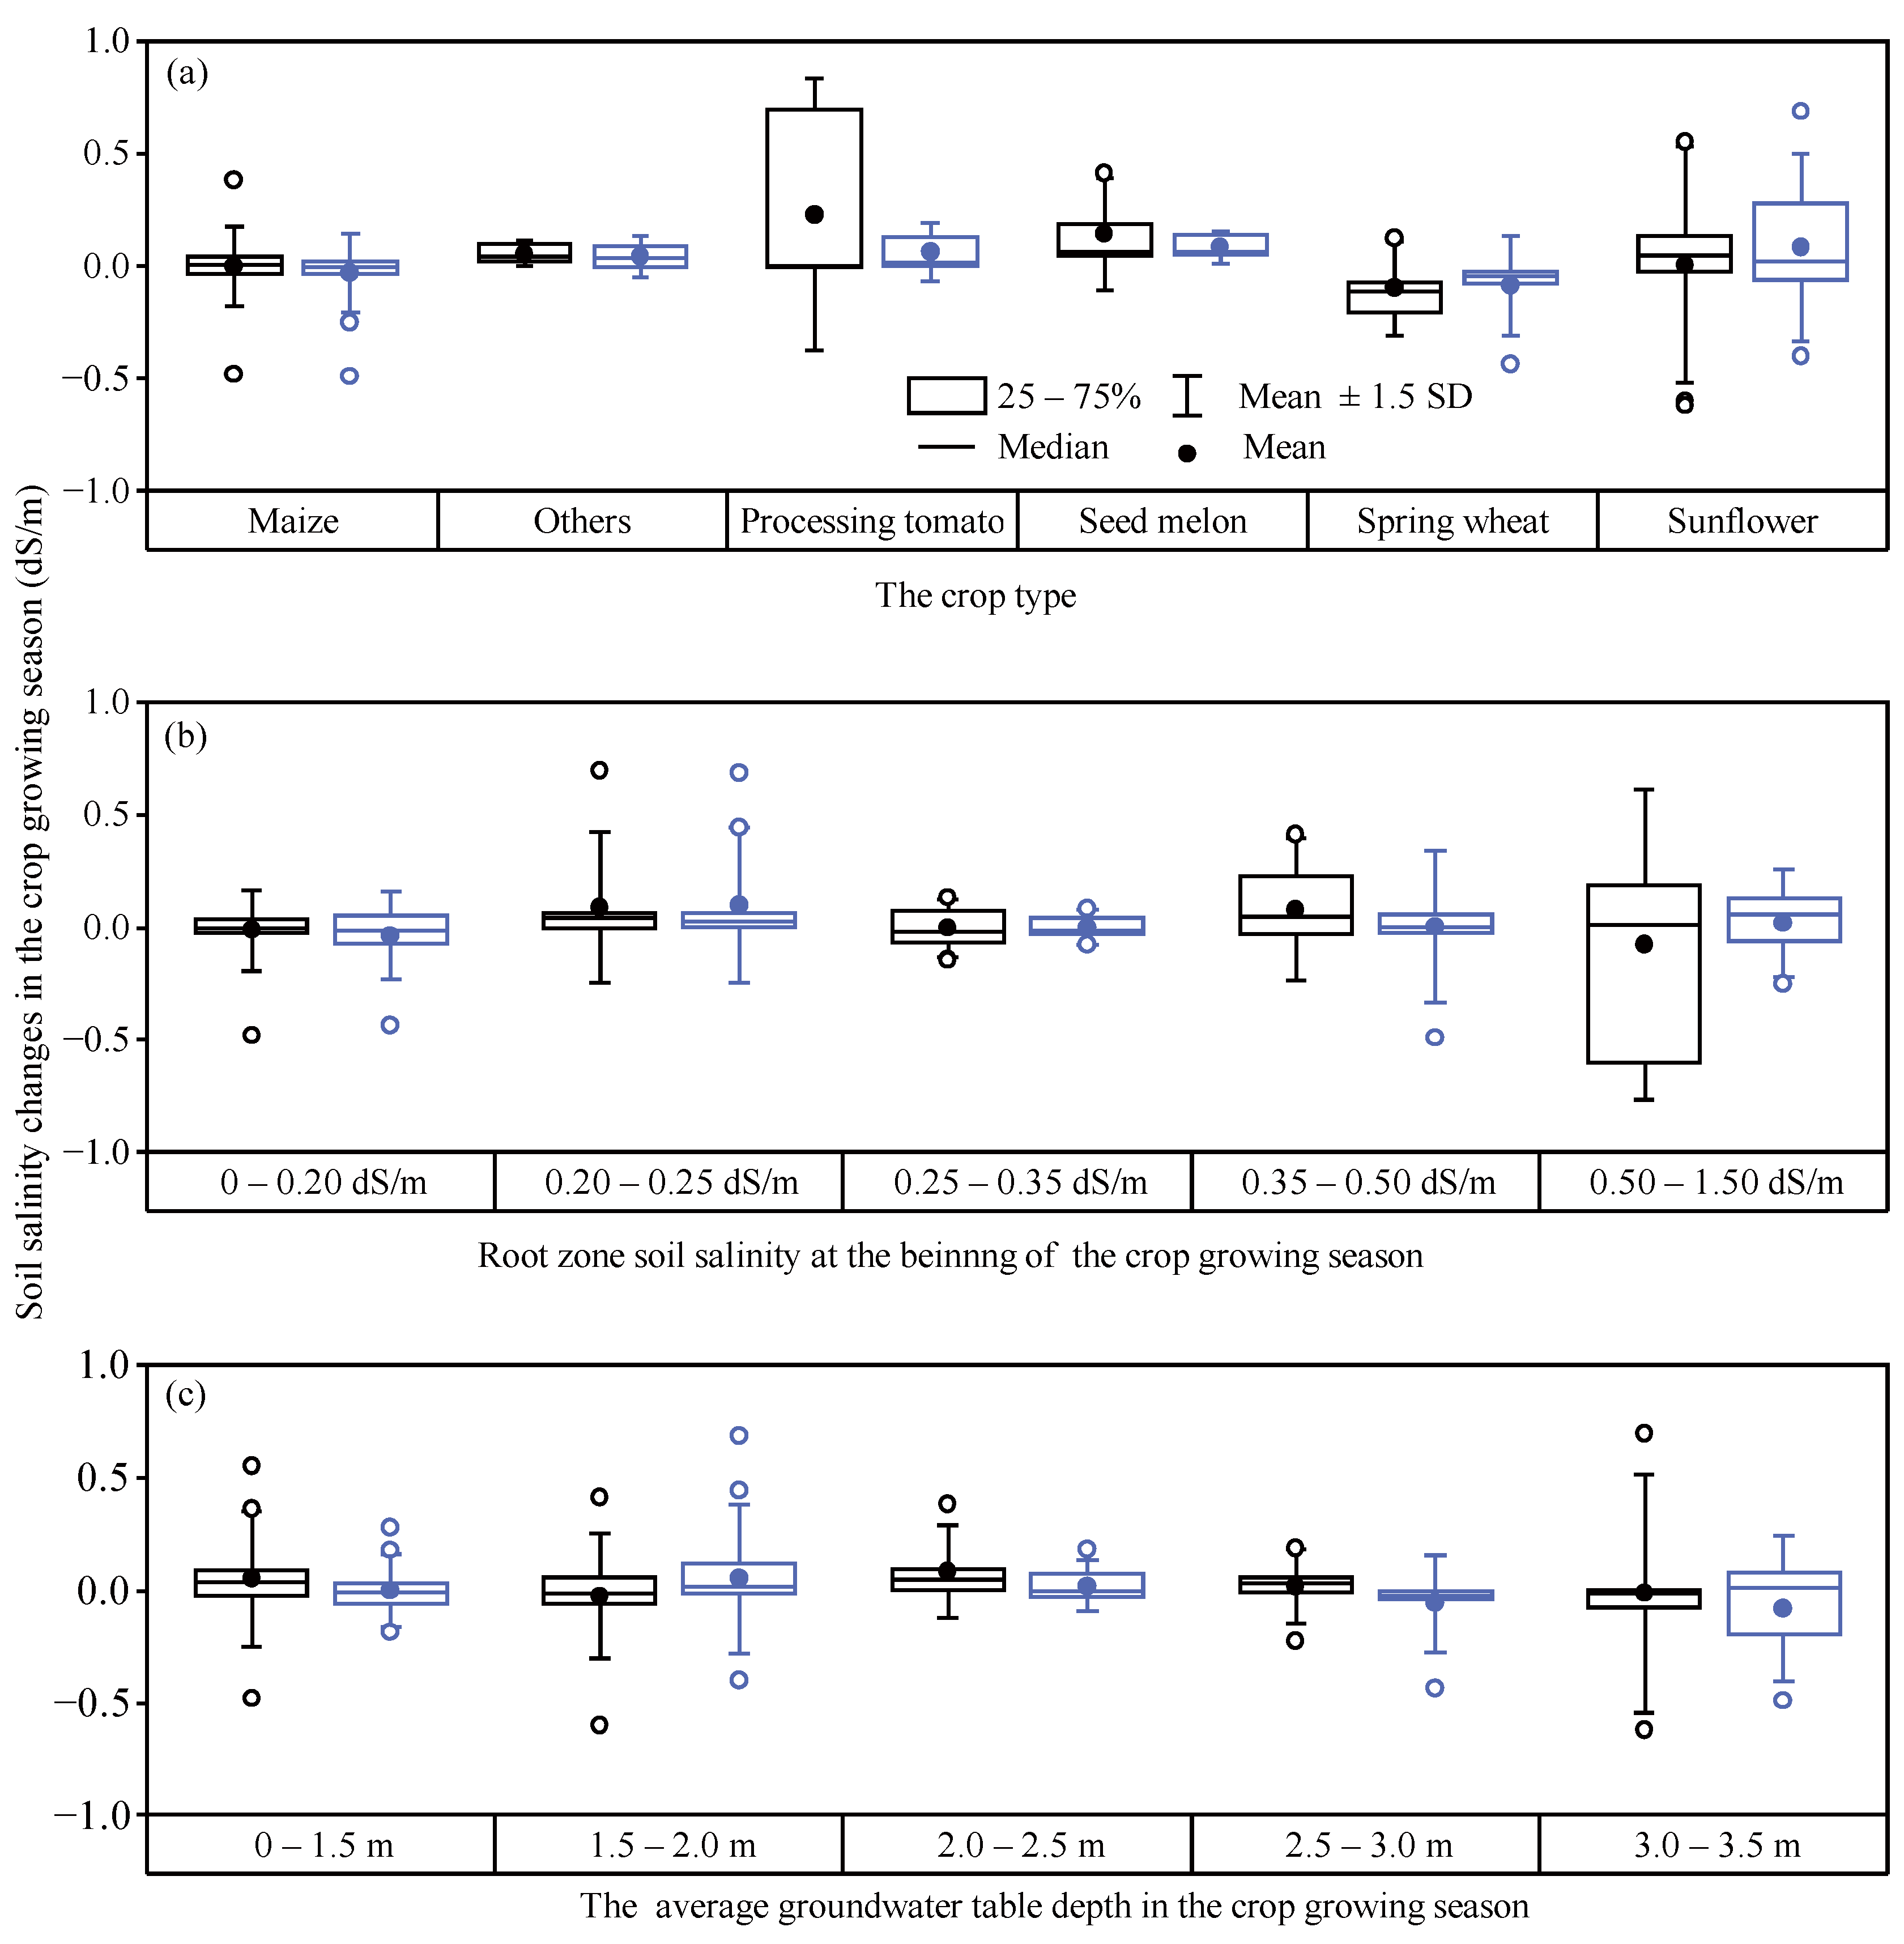
3.3. Impact Factors of Seasonal Dynamics for Soil Salinity in the Dry and Wet Year

Soil salinity in the root zone is a critical factor in determining agricultural productivity. Three factors, including crop type, root zone soil salinity at the beginning of the crop growing season, and an average groundwater table depth in the crop growing season, were analyzed for root zone soil salinity changes. The impacts of the three factors on changes in the root zone soil salinity are shown in Figure 5 and Table 1. The root zone soil salinity decreased after the crop growing season in the maize and spring wheat fields, whereas it increased in the fields of sunflower, processing tomato, seed melon, and other economic crops (Figure 5a). The change in the root zone soil salinity during the crop growing season was significantly influenced by crop type in the dry year of 2017 (p < 0.05), while it was not significant in the wet year of 2018 (p > 0.05), as listed in Table 1. The larger change ranges of soil salinity can be found at locations with larger root zone soil salinity at the beginning of the crop growing season, as shown in Figure 5b. The change in root zone soil salinity during the crop growing season showed a significant (p < 0.05) response to root zone soil salinity at the beginning of the crop growing season in both years, which indicates that the change in soil salinity is closely related to its value. The influence of the average groundwater table depth in the crop growing season on the changes in root zone soil salinity is shown in Figure 5c. The groundwater table depth in the crop growing season had the least impact on the change in root zone soil salinity (p > 0.05).
Crop types and groundwater table depth were observed to interact significantly with root zone soil salinity (p < 0.001 and p < 0.05, respectively) during the growing season of the dry year of 2017, as listed in Table 1. There was no significance in the interaction between root zone soil salinity at the beginning of the crop growing season and the groundwater table depth. In the wet year of 2018, only the interaction of crop type and root zone soil salinity at the beginning of the crop growing season had a significant effect on the change in root zone soil salinity. The impact of the interaction of all three factors was significantly different in the dry year of 2017 (p < 0.05) and not significant in the wet year of 2018 (p > 0.05). In general, the change in root zone soil salinity during the crop growing season is caused by the combined action of the root zone soil salinity at the beginning of the crop growing season, crop type, groundwater table depth, and climate conditions.

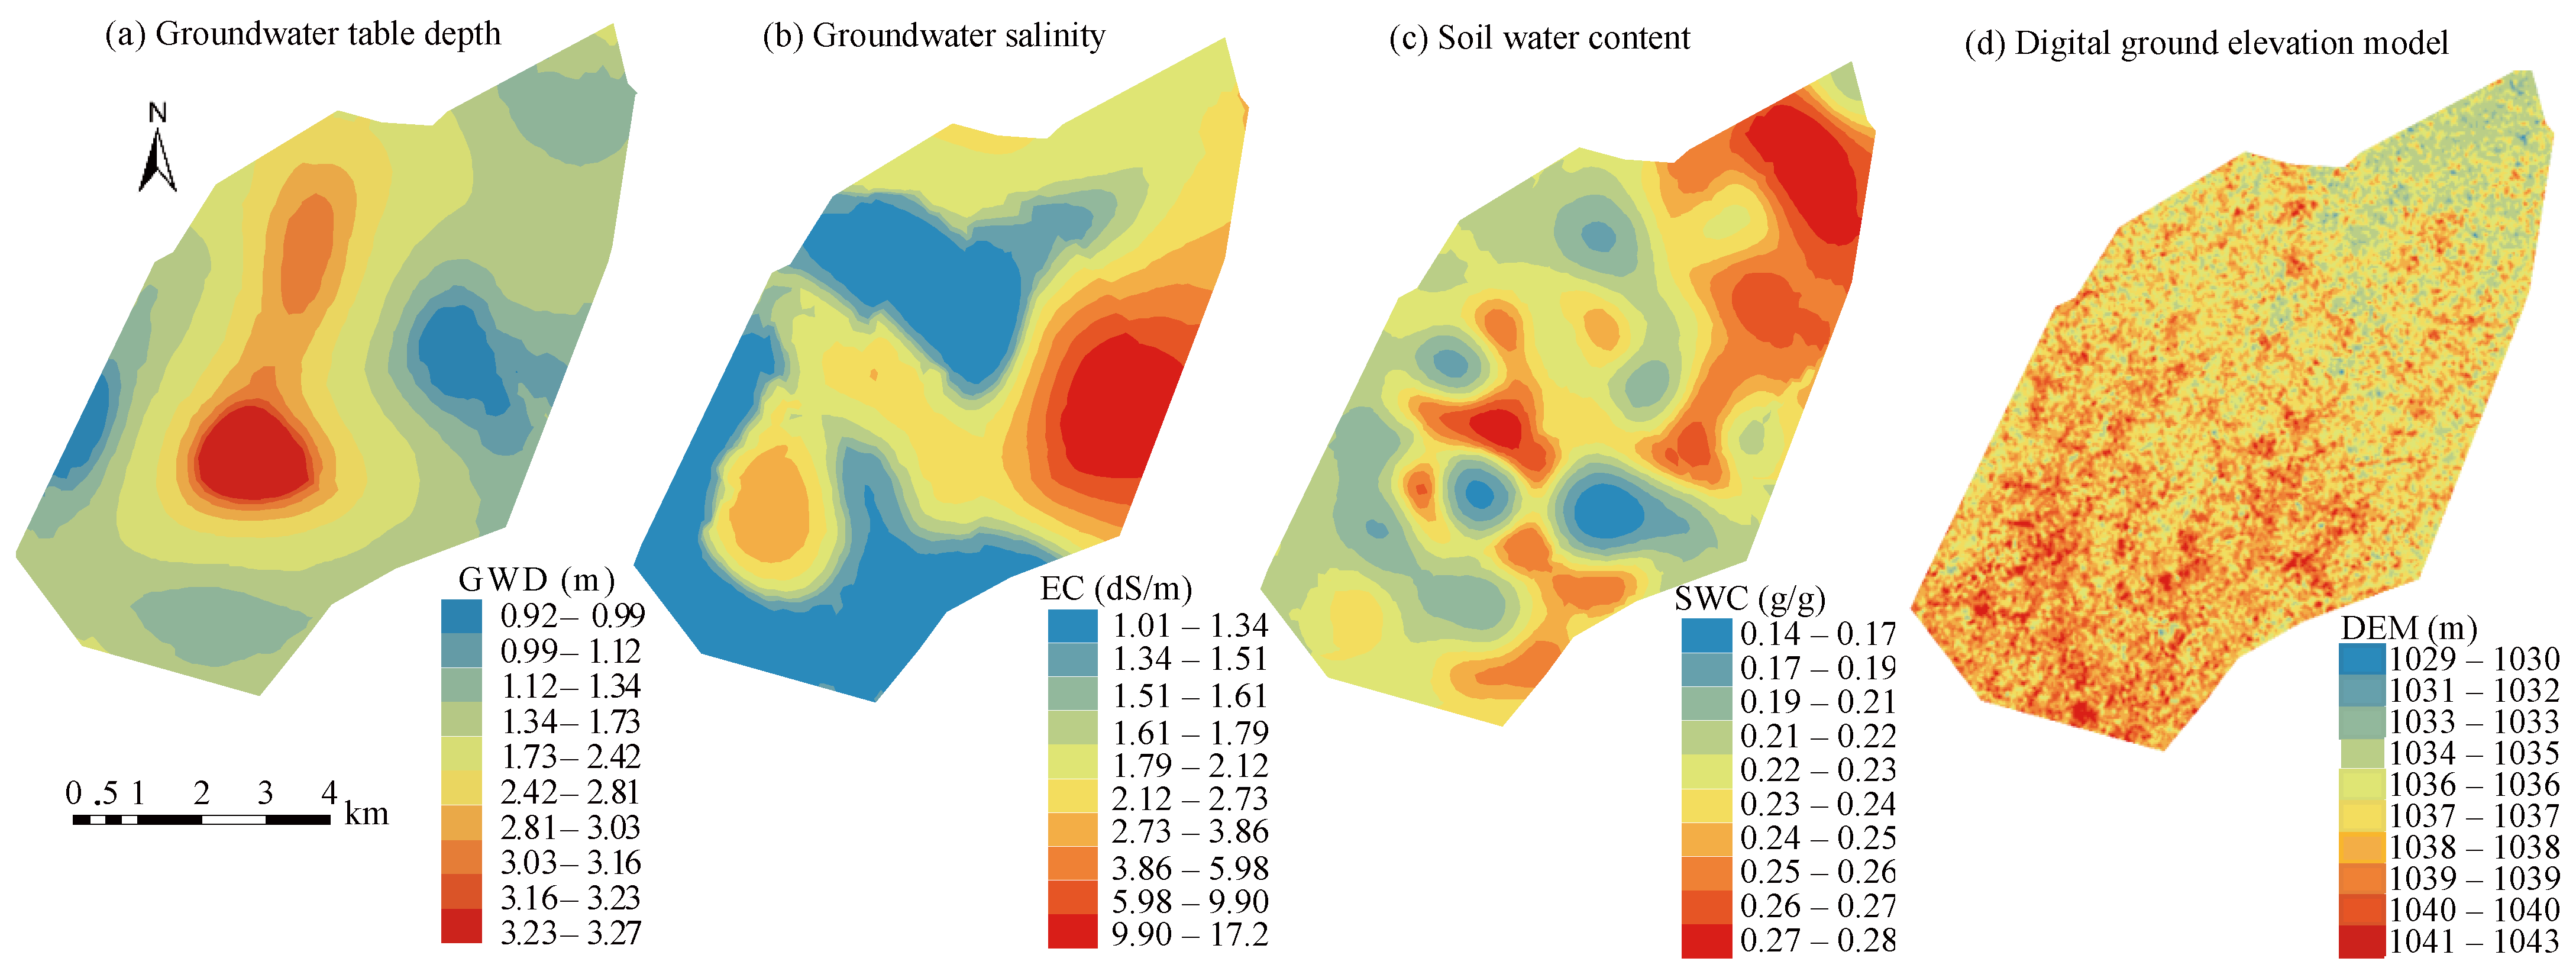
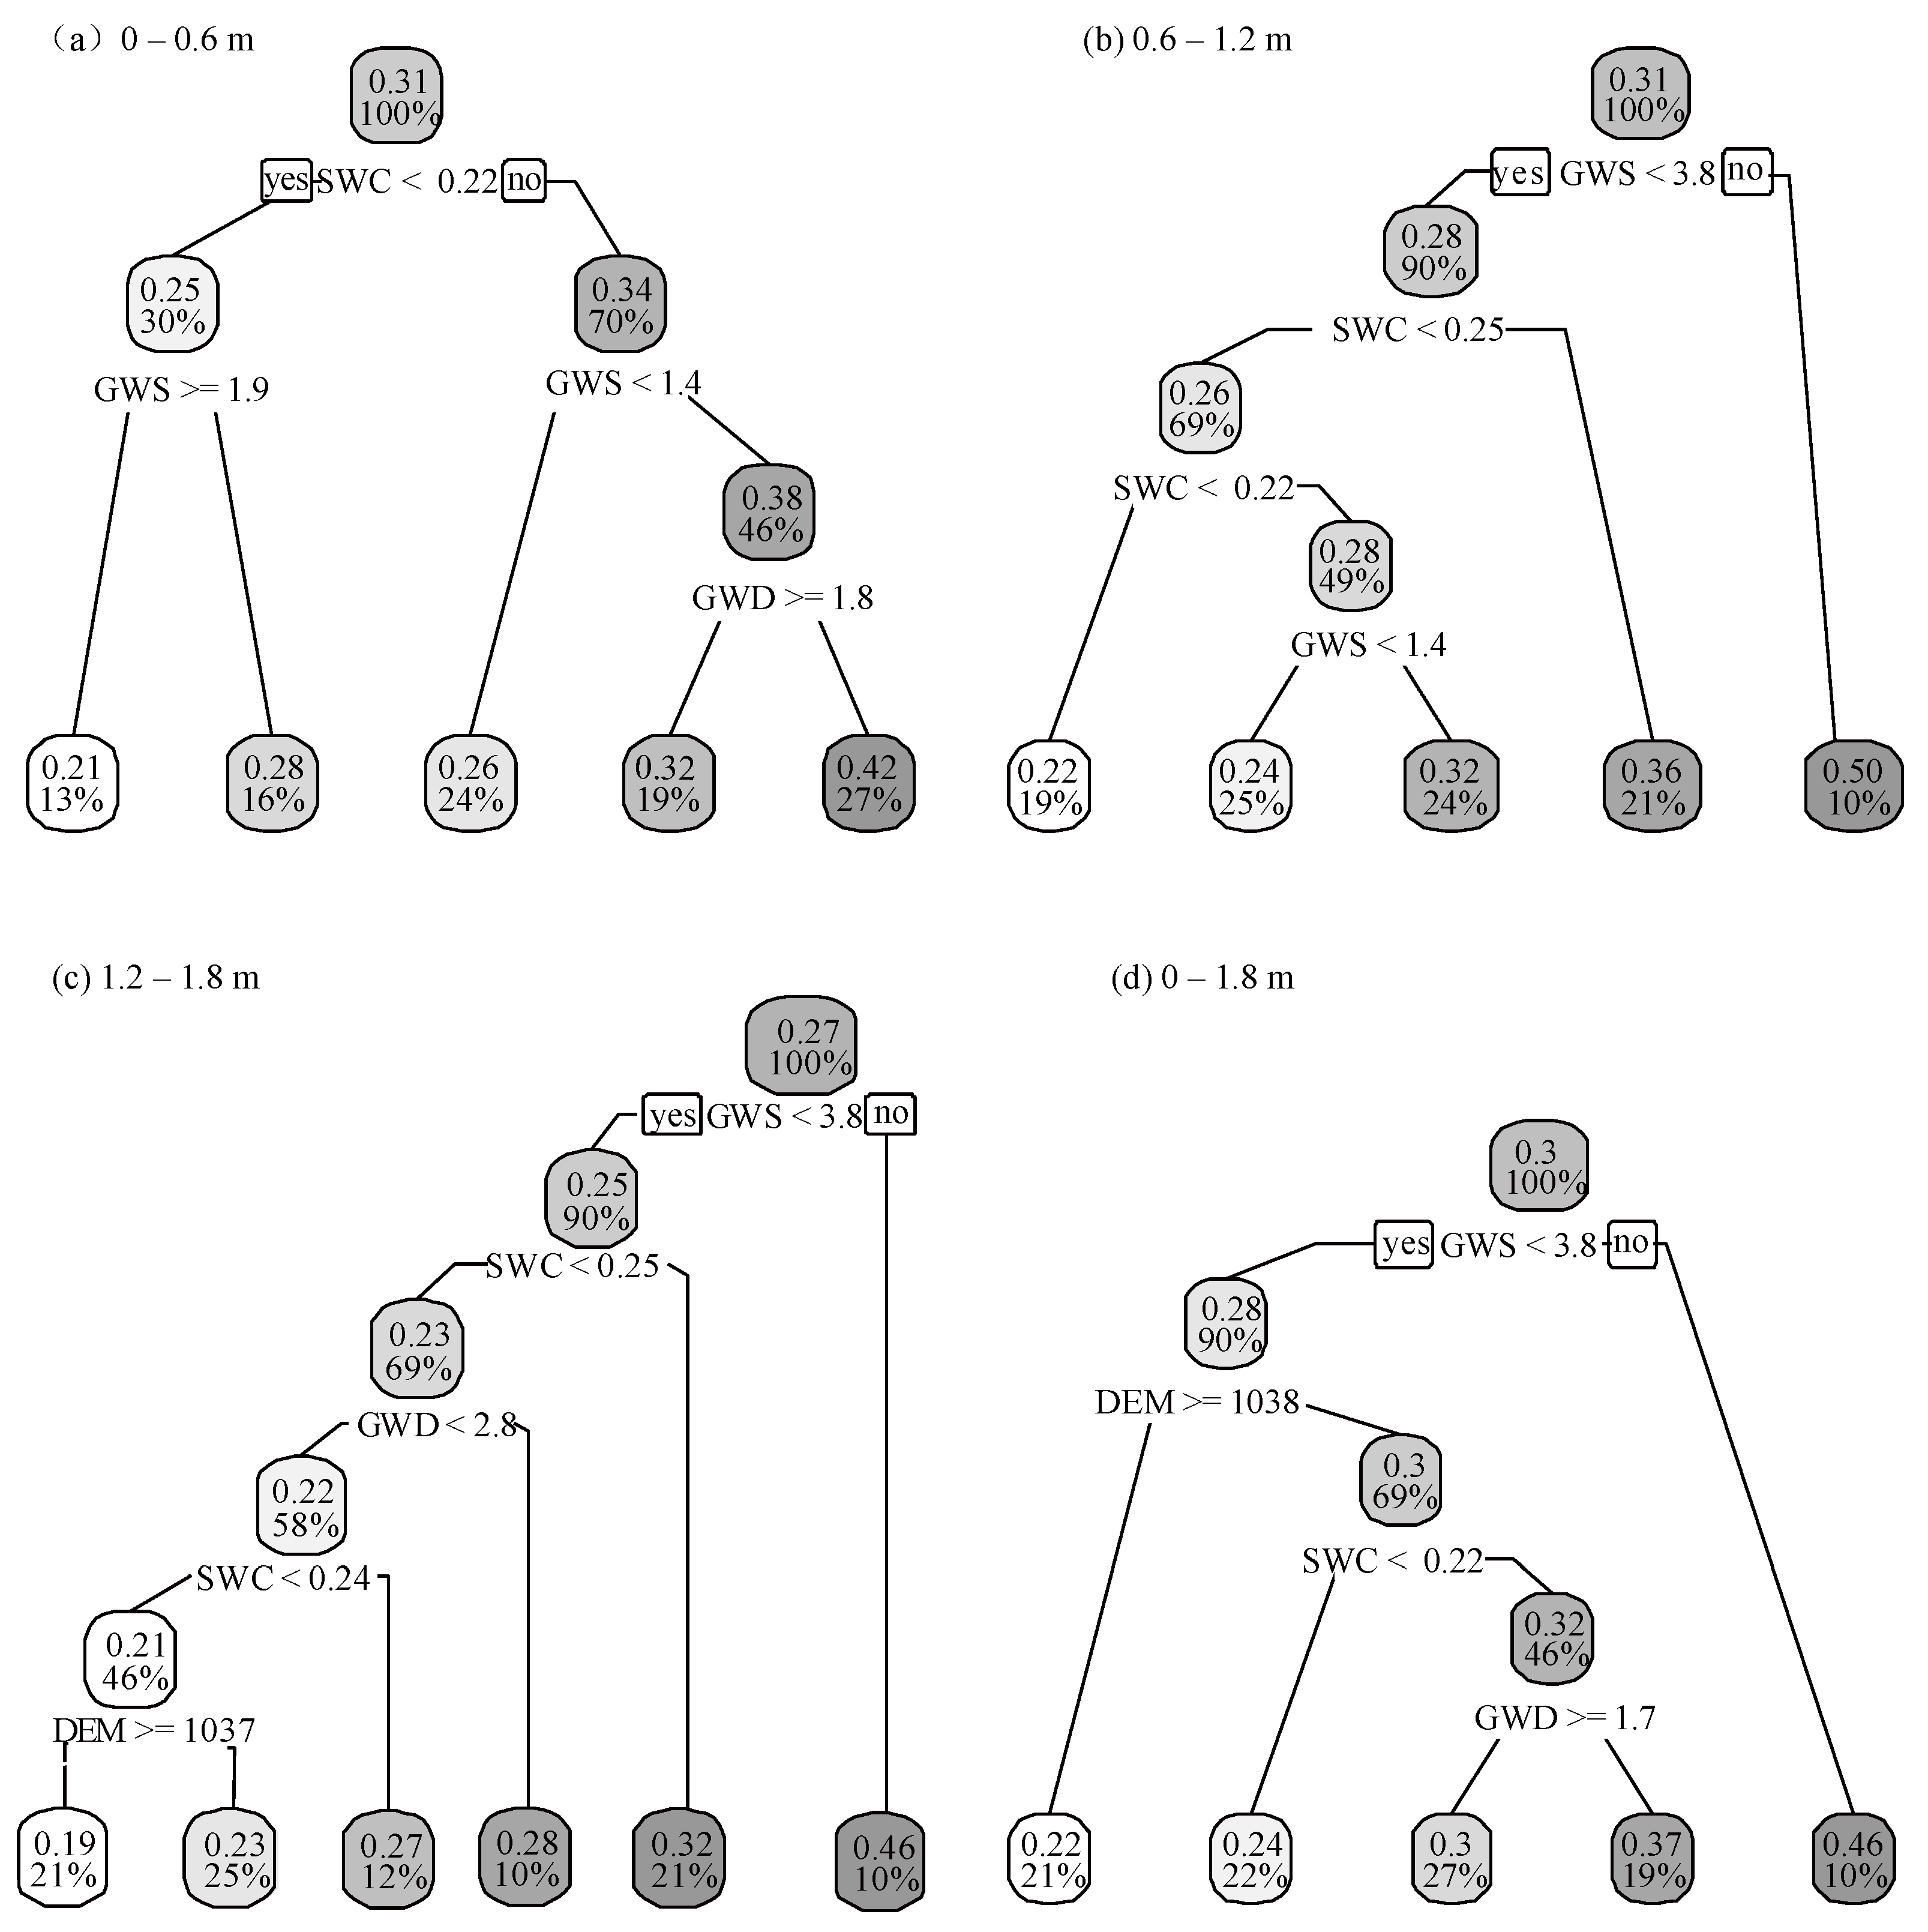
3.4. Effect of Environmental Factors on Regional Soil Salinity Spatial Pattern

The spatial pattern of soil salinity in an area is the result of a long-term balance between water and salt [11,17,36,37], which is relatively stable over time [33]. In this study, the influence of GWD, GWS, SWC, and DEM on the spatial pattern of soil salinity within the depths of 0–0.6 m, 0.6–1.2 m, 1.2–1.8 m, and 0–1.8 m was investigated. The spatial pattern of soil salinity and environmental factors, including GWD, GWS, and SWC were analyzed by the semivariogram models, which are listed in Table 2. The spatial distribution of soil salinity for the average values of the four sampling times is shown in Figure 6. It can be found that the soil salinity in the east, northeast, and southwest of the study area was higher than that in the middle and south. The spatial distributions of GWD, GWS, SWC, and DEM are shown in Figure 7. The annual averaged groundwater table depth in the east, northeast, southwest, and south of the study area was less than 1.5 m, and the groundwater table depth in the central area was deeper than 3.0 m. Most GWS values were less than 3.0 dS/m, and higher GWS values were found in the eastern portion of the study area. The averaged SWC in the whole profile over the four sampling times ranged from 0.14 g/g to 0.28 g/g, and the highest SWC values were obtained in the northeast of the study area. In this study, SWC was used to represent soil texture [38,39], and a high SWC indicates a high percentage of silt and clay particle size. The DEM values were between 1033 and 1039 m, and gradually decreased from the southwest to the northeast. Table 3 reports the correlation coefficients between soil salinity and the four environmental factors. The values of the correlation coefficient were high (maximum = 0.63 and minimum = 0.29) and statistically significant between soil salinity and GWS in all soil layers. The correlation between soil salinity and SWC was significant within the depth of 0.6–1.2 m, 1.2–1.8 m, and 0–1.8 m, while it was not significant within the depth of 0–0.6 m. There was no significant linear correlation between soil salinity and GWD or soil salinity and DEM. These results indicate that the effects of GWS and soil texture on soil salinity are dominant and significant, and outweigh the effects of GWD and DEM.
The regression tree exploratory tool was used to better understand the effect of GWD, GWS, SWC, and DEM, as well as their interactions on soil salinity. Figure 8 presents the regression trees for the soil salinity at the depths of 0–0.6 m, 0.6–1.2 m, 1.2–1.8 m, and 0–1.8 m, respectively. The regression tree demonstrated the thresholds for identifying various impact mechanisms of GWD, GWS, SWC, and DEM on total soil salinity variation. For example, when the SWC was less than 0.22 g/g, soil salinity variations within the depth of 0–0.6 m were explained by GWS. Otherwise, when the SWC was greater than 0.22 g/g, soil salinity was determined by GWS and GWD. The first splitting environmental variable controlling the soil salinity within the depth of 0–0.6 m was SWC, which indicates that soil texture has an important effect on the root zone soil salinity, followed by GWS and GWD. For the soil salinity within the depths of 0.6–1.2 m, 1.2–1.8 m, and 0–1.8 m, GWS was at the first level of the regression trees, and all the thresholds were 3.8 dS/m. The percentage of GWS values larger than 3.8 dS/m in the study was 10%, and the soil salinity means were the largest in all boxes, with values being 0.50, 0.46, and 0.46 dS/m for the depths of 0.6–1.2 m, 1.2–1.8 m, and 0–1.8 m, respectively (Figure 8b–d). This implies that higher soil salinity may be induced by the higher GWS in the study area. When GWS was less than 3.8 dS/m, the primary environmental factors affecting 0.6–1.2 m soil salinity were SWC and GWS, while SWC, GWD, and DEM affected the soil salinity at a depth of 1.2–1.8 m; DEM, SWC, and GWD determined the soil salinity for 0–1.8 m. Regression tree analysis clearly shows that the environmental factors have important effects on the spatial pattern of soil salinity, and that the environmental factors directly controlling soil salinity were GWS and soil texture in this study area.

4. Discussion

4.1. Differences in the Relation between Variability and Spatial Mean of Soil Water and Salinity

The relationship between standard deviation, variation coefficient, and mean value of soil salinity was obviously different from that of soil water content. The standard deviation of soil water content increased first and then decreased with the mean value, which was approximately a convex bell shape, and the variation coefficient of soil water showed an exponentially decreasing relationship with the mean value [40,41,42,43]. The inconsistency of the migration mechanism and impact factors between soil water content and soil salinity may determine the differences in the relationship between soil moisture, soil salinity, and their variability. The spatial variability of soil water content depends on the soil texture when the soil water content is large or close to the field capacity. However, when the soil water content decreases gradually due to leakage, evaporation, and transpiration, the heterogeneity of spatial location and vegetation distribution aggravates the variation in soil water content [44]. With the soil water content further reduced to the wilting coefficient, the variability was again determined by soil texture. When the soil salinity was uniformly washed to a small value by sufficient irrigation or rainfall in the entire region, the spatial homogeneity of the soil salinity was enhanced. The process of soil salt accumulation was not only affected by soil properties but also by other factors, such as groundwater conditions and crop types. The spatial variability of impact factors intensified soil salinity changes, resulting in enhanced heterogeneity of soil salinity. This study found that the spatial variation coefficient of soil salinity increased with the spatial mean at the regional scale, implying that soil salinity variation at the regional scale results from soil properties and other environmental factors.

4.2. Soil Salinity Balance Mechanism in a Whole Agricultural Year

The farmland soil salinity was dynamically balanced between the root zone and deep layer during the year. This soil salinity seasonal balance mechanism in different soil layers was also found by Walter et al. [45] in the topsoil and subsoil of peatlands, and by Lu et al. [28] for the entire agricultural year. The soil salinity balance is influenced by salt entering the soil from irrigation, precipitation, capillary rise, and the salt discharged from the soil, including leaching of irrigation and precipitation [11]. The groundwater table in most of this study area is shallow, and a large amount of salt migrates to the root zone owing to capillary action during the crop growing season, resulting in soil salinity accumulation in the root zone [11,46]. The contribution of groundwater to crops determines the root zone soil salinity conditions in shallow water table areas [11], which are affected by groundwater table depth, groundwater quality, irrigation frequency, and application depth, and crop types [47]. We found that the interaction between crop types and groundwater table depth had a significant effect on the change in root zone soil salinity in the dry year of 2017 but was not significant in the wet year of 2018 (Table 1). In addition, the increase in root zone soil salinity for each crop in the dry year of 2017 was larger than that in the wet year of 2018, as shown in Table 4. This implies that the contribution of shallow groundwater to crops is enhanced in dry years [48,49,50], resulting in increased salt accumulation in the root zone. Therefore, the root zone soil salinity in the dry year should be given more attention.
Autumn irrigation after harvest from October to November is a traditional irrigation custom to leach salt, which consumes more than 30% of the total irrigation water of the entire agricultural year [11], causing very shallow groundwater table depth. The seasonal changes in root zone soil salinity that accumulated salt in the crop growing season and desalted in the fallow season are determined by special irrigation practices in this study area. However, soil salinity in the deep soil layers (within the depth of 0.6–1.8 m) was increased in the fallow season, which indicates that excessive autumn irrigation cannot efficiently leach deep soil salt. This is because the leaching water cannot be discharged in time due to poor drainage management practices and a very flat topography with a 0.2‰ slope [51], which results in soil salinity accumulating in the deep soil. In addition, soil freezing and thawing after autumn irrigation in the fallow season can have a complex impact on soil salinity, the mechanism of which is not well understood. Overall, the seasonal changes in soil salinity are the result of the combined action of irrigation and drainage practices, hydrogeological conditions, and climate conditions. The soil salinity in the study area is basically stable, i.e., the salt in the unsaturated zone of the farmland has been in equilibrium for many years [11]. Salts introduced by irrigation first enter the aquifer through irrigation leaching and then redistribute through drainage and dry drainage [29].

4.3. The Driving Factors of Soil Salinity Spatial Variation

Both natural environments and human activities influence soil salinity variation, and the main driving factors may be different at various spatiotemporal scales [36,52,53]. Climate and topography affect soil salt accumulation on a global scale [54]. At a large regional scale, soil salinization is dependent on agro-hydrological processes, which are mainly related to geomorphology, hydrological geology, and landscape characteristics [37,52]. At the field scale, soil salinity variation is mainly determined by human activities and microtopography [4,9,55]. In this study, we found that cropland soil salinity was directly controlled by groundwater salinity and soil texture. Soil salinity values increased with GWS, which was consistent with the results of Zhou et al. [55] and Akramkhanov et al. [9]. The thresholds of SWC appearing at the first three levels of the regression trees were 0.22 and 0.25 g/g (Figure 8). The soil textures with SWC less than 0.22 g/g are mainly loamy sand or sandy loam, or have evidence of sand layers in the soil profile. The soil texture with SWC between 0.22 and 0.25 g/g is mainly silt loam, and SWC more than 0.25 g/g is silty clay and silt. Soil salinity value was 0.34 dS/m and 0.32 dS/m at a depth of 0–0.6 m and 0–1.8 m when SWC was more than 0.22 g/g, which was 36.00% and 54.17% higher than that of SWC less than 0.22 g/g, as shown in Figure 8a,d. Soil salinity values with SWC exceeding 0.25 g/g at a depth of 0.6–1.2 m and 1.2–1.8 m was 38.46% and 39.13% higher than that with SWC less than 0.25 g/g, respectively (Figure 8b,c). As shown in Figure 6 and Figure 7c, soil salinity of fine-textured with high SWC (e.g., silty clay, silt or soil with clay-interlayer) was higher in the northeastern part of the study area. This indicates that soil texture has an important influence on soil salinity and that the salinity of soil with coarse texture is lower than that of the finer ones. This can be explained by the fact that the capillary action of finer textured soil is greater than that of coarse-textured soil [9,50]. Alternately, fine soil texture can retain more water and salt than coarse-textured soil [44]. As shown in Figure 9, soil salinity in the profile with sand was lower, while soil salinity in the layer with clay or silt was obviously higher than that in other layers. The clay interlayer had the effect of reducing seepage and inhibiting evaporation, and the amount of water and salt stored on the interlayer, resulting in salt accumulation on the interlayer. The impact of heterogeneity of soil texture and structure on soil salinity is complex and is not only related to the location and thickness of the interlayer but is also affected by various factors such as evaporation intensity and groundwater table depth [56].
The reversed correlation between groundwater table depth and soil salinity implies that soil salinity would be higher when the groundwater table was shallower. However, GWD did not appear at the first or second levels of the regression trees, as anticipated. When SWC was more than 0.22 g/g, soil salinity was affected by groundwater (GWS and GWD), as shown in Figure 8a,b,d. This implies that the effect of groundwater on soil salinity is closely related to soil texture. For a given groundwater table depth, the hydraulic properties of the soil, which are related to soil texture, determine the capillary rise from the shallow groundwater table and affect soil salinity [11,47,50].
Environmental factors greatly impact regional soil salinity, and long-term soil salinity and impact factors, including precipitation, evapotranspiration, groundwater table depth, and groundwater salinity, need to be monitored in a changing environment. In addition, soil salinization is controlled by water supply, control systems, cropping practices, and field management [14]. Under the current irrigation and management conditions, local farmers have maintained salt balance in croplands in Hetao through their long-term practice and experience [4]. The effects of water management may have been dominant in cropland soil salinity and tended to outweigh the effects of environmental factors [9,53]. Therefore, long-term human activities, such as irrigation practices, field management, and cropping practices, should also be monitored to understand the effects of natural and human activities and their interactions on soil salinity spatiotemporal dynamics in croplands.

5. Conclusions

In this study, soil salinity observations at 68 sampling sites in the Longsheng study area, located in the Hetao Irrigation District of northern China, were carried out to study the spatiotemporal characteristics and corresponding impact factors of soil salinity in dry and wet years. The major conclusions drawn are as follows.
(1) The spatial variability of regional soil salinity increased with the mean value of soil salinity. The relationship between the standard deviation, variation coefficient, and mean value of soil salinity was obviously different from that of the soil water content, which was determined by the inconsistency in the migration mechanism and impact factors between soil water content and soil salinity.
(2) The increase in soil salinity in the root zone (0–0.6 m) was accompanied by a decrease in soil salinity in the deep soil (0.6–1.8 m) in the crop growing season, and the opposite trend was observed in the fallow season. Heavy precipitation accelerates soil desalting, but the effect of precipitation on soil salinity weakens with increasing depth.
(3) The change in root zone soil salinity during the crop growing season is influenced by the combined action of the root zone soil salinity at the beginning of the crop growing season, crop type, groundwater table depth, and climate conditions. In addition, more salt accumulated in the root zone during the crop growing season in the dry year owing to the consumption of shallow groundwater by crops.
(4) Variation in regional soil salinity is mainly controlled by soil texture, groundwater properties (including groundwater table depth and salinity), and their interactions. Groundwater table depth plays a crucial role in the spatial variation and seasonal dynamics of soil salinity, thus, strengthening groundwater management in areas with fine-textured soil (e.g., silty clay, silt, or soil with clay-interlayer) to relieve salt accumulation in the root zone is suggested.

Author Contributions

Conceptualization, G.S., Y.Z., J.Y. and Z.Q.; methodology, G.S., W.M. and Z.G.; software, G.S.; formal analysis, G.S.; investigation, G.S., Y.Z., Z.G. and J.Y.; resources, Y.Z. and Z.Q.; data curation, Y.Z. and J.Y.; writing—original draft preparation, G.S. and Z.G.; writing—review and editing, J.W.; visualization, G.S. and W.M.; supervision, Y.Z.; project administration, Y.Z.; funding acquisition, G.S., Y.Z., Z.Q. and J.Y. All authors have read and agreed to the published version of the manuscript.

Funding

This study was partially supported by the Natural Science Foundation of China through Grants (51790533, 52179041, 51779117) and the Chinese Universities Scientific Fund (2452021081) and the project of Water Conservancy Science and Technology Plan in the Inner Mongolia Autonomous Region (Grant No. 213-03-99-303002-NSK2017-M1).

Institutional Review Board Statement

Not applicable.

Informed Consent Statement

Not applicable.

Data Availability Statement

All data are presented in this article in the form of figures and tables.

Conflicts of Interest

The authors declare no conflict of interest.

References

  1. Ondrasek, G.; Rengel, Z. Environmental salinization processes: Detection, implications & solutions. Sci. Total Environ. 2021, 754, 142432. [Google Scholar] [PubMed]
  2. Abbas, A.; Khan, S.; Hussain, N.; Hanjra, M.A.; Akbar, S. Characterizing soil salinity in irrigated agriculture using a remote sensing approach. Phys. Chem. Earth Parts A/B/C 2013, 55–57, 43–52. [Google Scholar] [CrossRef]
  3. Rengasamy, P. World salinization with emphasis on Australia. J. Exp. Bot. 2006, 57, 1017–1023. [Google Scholar] [CrossRef] [PubMed]
  4. Ren, D.; Wei, B.; Xu, X.; Engel, B.; Li, G.; Huang, Q.; Xiong, Y.; Huang, G. Analyzing spatiotemporal characteristics of soil salinity in arid irrigated agro-ecosystems using integrated approaches. Geoderma 2019, 356, 113935. [Google Scholar] [CrossRef]
  5. Singh, A. Soil salinization management for sustainable development: A review. J. Environ. Manag. 2021, 277, 111383. [Google Scholar] [CrossRef] [PubMed]
  6. Wichelns, D.; Oster, J.D. Sustainable irrigation is necessary and achievable, but direct costs and environmental impacts can be substantial. Agric. Water Manag. 2006, 86, 114–127. [Google Scholar] [CrossRef]
  7. Tilman, D.; Balzer, C.; Hill, J.; Befort, B.L. Global food demand and the sustainable intensification of agriculture. Proc. Natl. Acad. Sci. USA 2011, 108, 20260–20264. [Google Scholar] [CrossRef]
  8. Abliz, A.; Tiyip, T.; Ghulam, A.; Halik, Ü.; Ding, J.; Sawut, M.; Zhang, F.; Nurmemet, I.; Abliz, A. Effects of shallow groundwater table and salinity on soil salt dynamics in the Keriya Oasis, Northwestern China. Environ. Earth Sci. 2016, 75, 260. [Google Scholar] [CrossRef]
  9. Akramkhanov, A.; Martius, C.; Park, S.J.; Hendrickx, J.M.H. Environmental factors of spatial distribution of soil salinity on flat irrigated terrain. Geoderma 2011, 163, 55–62. [Google Scholar] [CrossRef]
  10. Ibrakhimov, M.; Martius, C.; Lamers, J.P.A.; Tischbein, B. The dynamics of groundwater table and salinity over 17 years in Khorezm. Agric. Water Manag. 2011, 101, 52–61. [Google Scholar] [CrossRef]
  11. Sun, G.; Zhu, Y.; Ye, M.; Yang, J.; Qu, Z.; Mao, W.; Wu, J. Development and application of long-term root zone salt balance model for predicting soil salinity in arid shallow water table area. Agric. Water Manag. 2019, 213, 486–498. [Google Scholar] [CrossRef]
  12. Wang, Y.; Deng, C.; Liu, Y.; Niu, Z.; Li, Y. Identifying change in spatial accumulation of soil salinity in an inland river watershed, China. Sci. Total Environ. 2018, 621, 177–185. [Google Scholar] [CrossRef]
  13. Wichelns, D.; Qadir, M. Achieving sustainable irrigation requires effective management of salts, soil salinity, and shallow groundwater. Agric. Water Manag. 2015, 157, 31–38. [Google Scholar] [CrossRef]
  14. Ma, L.; Ma, F.; Li, J.; Gu, Q.; Yang, S.; Wu, D.; Feng, J.; Ding, J. Characterizing and modeling regional-scale variations in soil salinity in the arid oasis of Tarim Basin, China. Geoderma 2017, 305, 1–11. [Google Scholar] [CrossRef]
  15. Odeh IO, A.; Todd, A.J.; Triantafilis, J.; McBratney, A.B. Status and trends of soil salinity at different scales: The case for the irrigated cotton growing region of eastern Australia. Nutr. Cycl. Agroecosys 1998, 50, 99–107. [Google Scholar] [CrossRef]
  16. Searle, R.; Baillie, J. Prediction of Landscape Salinity Hazard Using a Geographic Information System; Department of Natural Resources: Brisbane, Australia, 1997.
  17. Evans, F.H.; Caccetta, P.A. Broad-scale spatial prediction of areas at risk from dryland salinity. Cartography 2000, 29, 33–40. [Google Scholar] [CrossRef]
  18. Bezborodov, G.A.; Shadmanov, D.K.; Mirhashimov, R.T.; Yuldashev, T.; Qureshi, A.S.; Noble, A.D.; Qadir, M. Mulching and water quality effects on soil salinity and sodicity dynamics and cotton productivity in Central Asia. Agric. Ecosyst. Environ. 2010, 138, 95–102. [Google Scholar] [CrossRef]
  19. Choudhary, O.P.; Ghuman, B.S.; Bijay-Singh, S.; Thuy, N.; Buresh, R.J. Effects of long-term use of sodic water irrigation, amendments and crop residues on soil properties and crop yields in rice–wheat cropping system in a calcareous soil. Field Crops Res. 2011, 121, 363–372. [Google Scholar] [CrossRef]
  20. Forkutsa, I.; Sommer, R.; Shirokova, Y.I.; Lamers, J.P.A.; Kienzler, K.; Tischbein, B.; Martius, C.; Vlek PL, G. Modeling irrigated cotton with shallow groundwater in the Aral Sea Basin of Uzbekistan: II. Soil salinity dynamics. Irrig. Sci. 2009, 27, 319–330. [Google Scholar] [CrossRef]
  21. Ghamarnia, H.; Gholamian, M. The effect of saline shallow ground and surface water under deficit irrigation on (Carthamus tinctorius L.) in semi-arid condition. Agric. Water Manag. 2013, 118, 29–37. [Google Scholar] [CrossRef]
  22. Ghamarnia, H.; Jalili, Z. Shallow saline groundwater use by Black cumin (Nigella sativa L.) in the presence of surface water in a semi-arid region. Agric. Water Manag. 2014, 132, 89–100. [Google Scholar] [CrossRef]
  23. Sun, G.; Qu, Z.; Du, B.; Ren, Z.; Liu, A. Water-heat-salt effects of mulched drip irrigation maize with different irrigation scheduling in Hetao Irrigation District. Trans. CSAE 2017, 33, 144–152. (In Chinese) [Google Scholar]
  24. Yu, S.; Yang, J.; Liu, G. Effect of clay intrelayers on soil water and salt movement in easily-salinized regions. Adv. Water Sci. 2011, 22, 495–501. (In Chinese) [Google Scholar]
  25. Sun, G. Study on Soil Salinity Dynamics at Multiple Scales and Long-term Solute Balance Models in Arid Area. In Dissertation of Doctor Degree; Wuhan University: Wuhan, China, 2020. (In Chinese) [Google Scholar]
  26. Feng, Z.; Wang, X.; Feng, Z. Soil N and salinity leaching after the autumn irrigation and its impact on groundwater in Hetao Irrigation District, China. Agric. Water Manag. 2005, 71, 131–143. [Google Scholar] [CrossRef]
  27. Yu, R.; Liu, T.; Xu, Y.; Zhu, C.; Zhang, Q.; Qu, Z.; Liu, X.; Li, C. Analysis of salinization dynamics by remote sensing in Hetao Irrigation District of North China. Agric. Water Manag. 2010, 97, 1952–1960. [Google Scholar] [CrossRef]
  28. Lu, X.; Li, R.; Shi, H.; Liang, J.; Miao, Q.; Fan, L. Successive simulations of soil water-heat-salt transport in one whole year of agriculture after different mulching treatments and autumn irrigation. Geoderma 2019, 344, 99–107. [Google Scholar] [CrossRef]
  29. Wu, J.; Vincent, B.; Yang, J.; Bouarfa, S.; Vidal, A. Remote sensing monitoring of changes in soil salinity: A case study in Inner Mongolia, China. Sensors 2008, 8, 7035–7049. [Google Scholar] [CrossRef]
  30. Sun, G. Study on Water-heat-salt Effect of Different Irrigation Patterns and Water-salt Variation in Well-canal Combined Irrigation Area of Hetao Irrigation District. In Dissertation of Master Degree; Inner Mongolia Agricultural University: Huhhot, China, 2016. (In Chinese) [Google Scholar]
  31. Visconti, F.; de Paz, J.M.; Rubio, J.L. What information does the electrical conductivity of soil water extracts of 1 to 5 ratio (w/v) provide for soil salinity assessment of agricultural irrigated lands? Geoderma 2010, 154, 387–397. [Google Scholar] [CrossRef]
  32. Zhang, R.D. Theory and Application of Spatial Variability; Science Press: Beijing, China, 2005. (In Chinese) [Google Scholar]
  33. Sun, G.; Zhu, Y.; Ye, M.; Yang, Y.; Yang, J.; Mao, W.; Wu, J. Regional soil salinity spatiotemporal dynamics and improved temporal stability analysis in arid agricultural areas. J. Soil Sediment 2022, 22, 272–292. [Google Scholar] [CrossRef]
  34. Breiman, L.; Friedman, J.H.; Olshen, R.A.; Stone, C.J. Classification and Regression Trees, 1st ed.; Chapman & Hall/CRC, Routledge: New York, NY, USA, 1984. [Google Scholar]
  35. Therneau, T.M.; Atkinson, E.J. An Introduction to Recursive Partitioning Using the RPART Routines. 2019. Available online: https://cran.r-project.org/web/packages/rpart/vignettes/longintro.pdf (accessed on 14 July 2019).
  36. Daliakopoulos, I.N.; Tsanis, I.K.; Koutroulis, A.; Kourgialas, N.N.; Varouchakis, A.E.; Karatzas, G.P.; Ritsema, C.J. The threat of soil salinity: A European scale review. Sci. Total Environ. 2016, 573, 727–739. [Google Scholar] [CrossRef]
  37. Schoups, G.; Hopmans, J.W.; Young, C.A.; Vrugt, J.A.; Wallender, W.W.; Tanji, K.K.; Panday, S. Sustainability of irrigated agriculture in the San Joaquin Valley, California. Proc. Natl. Acad. Sci. USA 2005, 102, 15352–15356. [Google Scholar] [CrossRef]
  38. Biswas, A.; Si, B. Identifying scale specific controls of soil water storage in a hummocky landscape using wavelet coherency. Geoderma 2011, 165, 50–59. [Google Scholar] [CrossRef]
  39. Jacobs, J.M.; Mohanty, B.P.; Hsu, E.C.; Miller, D. SMEX02: Field scale variability, time stability and similarity of soil moisture. Remote Sens. Environ. 2004, 92, 436–446. [Google Scholar] [CrossRef]
  40. Brocca, L.; Melone, F.; Moramarco, T.; Morbidelli, R. Spatial-temporal variability of soil moisture and its estimation across scales. Water Resour. Res. 2010, 46, 1–14. [Google Scholar] [CrossRef]
  41. Brocca, L.; Tullo, T.; Melone, F.; Moramarco, T.; Morbidelli, R. Catchment scale soil moisture spatial–temporal variability. J. Hydrol. 2012, 422–423, 63–75. [Google Scholar] [CrossRef]
  42. Famiglietti, J.S.; Ryu, D.; Berg, A.A.; Rodell, M.; Jackson, T.J. Field observations of soil moisture variability across scales. Water Resour. Res. 2008, 44, 1–16. [Google Scholar] [CrossRef]
  43. Jacobs, J.M.; Hsu, E.C.; Choi, M. Time stability and variability of Electronically Scanned Thinned Array Radiometer soil moisture during Southern Great Plains hydrology experiments. Hydrol. Process 2010, 24, 2807–2819. [Google Scholar] [CrossRef]
  44. Fry, J.E.; Guber, A.K. Temporal stability of field-scale patterns in soil water content across topographically diverse agricultural landscapes. J. Hydrol. 2020, 580, 124260. [Google Scholar] [CrossRef]
  45. Walter, J.; Lück, E.; Bauriegel, A.; Facklam, M.; Zeitz, J. Seasonal dynamics of soil salinity in peatlands: A geophysical approach. Geoderma 2018, 310, 1–11. [Google Scholar] [CrossRef]
  46. Ren, D.; Xu, X.; Hao, Y.; Huang, G. Modeling and assessing field irrigation water use in a canal system of Hetao, upper Yellow River basin: Application to maize, sunflower and watermelon. J. Hydrol. 2016, 532, 122–139. [Google Scholar] [CrossRef]
  47. Ayars, J.E.; Christen, E.W.; Soppe, R.W.; Meyer, W.S. The resource potential of in-situ shallow ground water use in irrigated agriculture: A review. Irrig. Sci. 2006, 24, 147–160. [Google Scholar] [CrossRef]
  48. Gao, X.; Bai, Y.; Huo, Z.; Xu, X.; Huang, G.; Xia, Y.; Steenhuis, T.S. Deficit irrigation enhances contribution of shallow groundwater to crop water consumption in arid area. Agric. Water Manag. 2017, 185, 116–125. [Google Scholar] [CrossRef]
  49. Meixner, T.; Manning, A.H.; Stonestrom, D.A.; Allen, D.M.; Ajami, H.; Blasch, K.W.; Brookfield, A.E.; Castro, C.L.; Clark, J.F.; Gochis, D.J.; et al. Implications of projected climate change for groundwater recharge in the western United States. J. Hydrol. 2016, 534, 124–138. [Google Scholar] [CrossRef]
  50. Zipper, S.C.; Soylu, M.E.; Booth, E.G.; Loheide, I.I. SP Untangling the effects of shallow groundwater and soil texture as drivers of subfield-scale yield variability. Water Resour. Res. 2015, 51, 6338–6358. [Google Scholar] [CrossRef]
  51. Xu, X.; Huang, G.; Qu, Z.; Pereira, L.S. Assessing the groundwater dynamics and impacts of water saving in the Hetao Irrigation District, Yellow River basin. Agric. Water Manag. 2010, 98, 301–313. [Google Scholar] [CrossRef]
  52. Urdanoz, V.; Aragüés, R. Pre- and post-irrigation mapping of soil salinity with electromagnetic induction techniques and relationships with drainage water salinity. Soil Sci. Soc. Am. J. 2011, 75, 207–215. [Google Scholar] [CrossRef]
  53. Zhang, W.; Wu, H.; Gu, H.; Feng, G.; Wang, Z.; Sheng, J. Variability of soil salinity at multiple spatio-temporal scales and the related driving factors in the Oasis Areas of Xinjiang, China. Pedosphere 2014, 24, 753–762. [Google Scholar] [CrossRef]
  54. Schofield, R.V.; Kirkby, M.J. Application of salinization indicators and initial development of potential global soil salinization scenario under climatic change. Glob. Biogeochem. Cycles 2003, 17, 1–11. [Google Scholar] [CrossRef]
  55. Zhou, H.; Chen, Y.; Li, W. Soil properties and their spatial pattern in an oasis on the lower reaches of the Tarim River, northwest China. Agric. Water Manag. 2010, 97, 1915–1922. [Google Scholar] [CrossRef]
  56. Li, X.; Chang, S.X.; Salifu, K.F. Soil texture and layering effects on water and salt dynamics in the presence of a water table: A review. Environ. Rev. 2014, 22, 41–50. [Google Scholar] [CrossRef]
Figure 1. Location of Longsheng Irrigation District, groundwater observation wells, and soil salt sampling locations in the study area.
Agriculture 12 01243 g001
Figure 2. Precipitation and groundwater table depth in the study area during 2017 and 2018.
Agriculture 12 01243 g002
Figure 3. Soil salinity and its spatial variation at different depths for the four sampling times. (a) Box plots of soil salinity. The boxes indicate the 25th and 75th percentile (25–75%), and the whiskers indicate 1.5 times the interquartile range (IQR). The horizontal line within the box marks the median, and the solid black circle is the spatial mean. Outliers marked as rings are defined as data points more than 1.5 times the interquartile range away from the upper or lower quartile. (b) The spatial mean of soil salinity. (c) Relationship between the standard deviation, the variation coefficient, and the spatial mean of soil salinity.
Agriculture 12 01243 g003
Figure 4. Spatial distribution of soil salinity increment at depths of 0–0.6 m, 0.6–1.2 m, and 1.2–1.8 m in the crop growing season during the dry year of 2017 and wet year of 2018.
Agriculture 12 01243 g004
Figure 5. Relationship between the changes in root zone soil salinity in the crop growing season in the dry year of 2017 (Black boxplot) and wet year of 2018 (Blue boxplot) with (a) crop type, (b) root zone soil salinity at the beginning of the crop growing season, and (c) average groundwater table depth in the crop growing season.
Agriculture 12 01243 g005
Figure 6. Spatial distribution of mean soil salinity over the four sampling times.
Agriculture 12 01243 g006
Figure 7. Spatial distribution of environmental factors including (a) groundwater table depth (GWD), (b) groundwater salinity (GWS), (c) soil texture represented by soil water content (SWC), and (d) digital ground elevation model (DEM).
Agriculture 12 01243 g007
Figure 8. Regression trees for soil salinity at depths of (a) 0–0.6 m, (b) 0.6–1.2 m, (c) 1.2–1.8 m, and (d) 0–1.8 m. The top number in the boxes is the mean soil salinity, and the bottom number denotes the percentage of soil salinity samples belonging to subsets in the total numbers. The environmental factors were groundwater table depth (GWD), groundwater salinity (GWS), soil texture represented by soil water content (SWC), and digital elevation model (DEM).
Agriculture 12 01243 g008
Figure 9. Soil salinity of typical soil profile.
Agriculture 12 01243 g009
Table 1. Multi-factor effects on the change of root zone soil salinity in the crop growing season by variance analysis.
FactorDry Year of 2017Wet Year of 2018
ABCABC
Single factor 3.14 *20.86 ***2.141.955.11 *1.44
Dual-factorA 2.63 *5.49 *** 2.45 *0.44
B 3.26 1.42
Multi-factorA, B 3.19 * 0.63
Note: A is the crop type, B is the root zone soil salinity at the beginning of the crop growing season, and C is the groundwater table depth in the crop growing season. The items in the table are the F value, and *, and *** are significant differences at the level of 0.05, and 0.001, respectively.
Table 2. The semivariogram models of soil salinity and environmental factors.
ModelC0C0 + C1R (m)RSSR2
Soil salinity0–0.6 mSpherical0.0000.18921100.0040.74
0.6–1.2 mSpherical0.0570.20284500.0020.92
1.2–1.8 mSpherical0.0740.15065000.0010.80
0–1.8 mSpherical0.0120.14730700.0030.74
Environmental factorsGWDGaussian0.0010.55628410.1020.82
GWSGaussian0.0010.47743300.0290.91
SWCGaussian0.0000.00115590.0040.81
Note: C0 is nugget variance; C1 is structured variance; and R is the range.
Table 3. Pearson’s correlation matrix between soil salinity and environmental variables.
Soil SalinityGWDGWSSWCDEM
SS1−0.080.29 *0.21−0.19
SS2−0.230.56 **0.42 **−0.14
SS3−0.160.63 **0.39 **−0.08
SS4−0.160.51 **0.35 **−0.16
Note: * and ** denote that correlation was significant at the 0.05 level and 0.01 level, respectively. The environmental variables were groundwater table depth (GWD), groundwater salinity (GWS), soil texture represented by soil water content (SWC), and the digital elevation model (DEM). SS1, SS2, SS3, and SS4 were soil salinity at the depths of 0–0.6 m, 0.6–1.2 m, 1.2–1.8 m, and 0–1.8 m.
Table 4. Root zone soil salinity under different crop types in early May and its change in the crop growing season (dS/m).
Crop TypesDry Year of 2017Wet Year of 2018
n *Soil SalinitySoil Salinity ChangesnSoil SalinitySoil Salinity Changes
Maize360.273 ± 0.167 b−0.002 ± 0.118 c320.291 ± 0.140 b−0.031 ± 0.116 a
Sunflower110.467 ± 0.327 a0.005 ± 0.350 bc140.388 ± 0.176 a0.083 ± 0.279 a
Spring wheat50.468 ± 0.367 a−0.099 ± 0.138 c80.271 ± 0.151 b−0.087 ± 0.146 a
Processing tomato30.208 ± 0.036 b0.229 ± 0.404 a50.187 ± 0.030 b0.063 ± 0.086 a
Seed melon50.331 ± 0.331 b0.142 ± 0.166 ab30.224 ± 0.043 b0.084 ± 0.046 a
Others50.240 ± 0.240 b0.054 ± 0.039 abc50.241 ± 0.056 b0.040 ± 0.062 a
* It should be noted that n is the number of soil sample. The different letters after the numbers in the same column, i.e., a, b and c, indicate that soil salinity and its changes under different crop types are significantly different at the level of 0.05.
Publisher’s Note: MDPI stays neutral with regard to jurisdictional claims in published maps and institutional affiliations.

