Article

Combination of Sentinel-2 Satellite Images and Meteorological Data for Crop Water Requirements Estimation in Intensive Agriculture

by
Jaouad El Hachimi
1,*,
Abderrazak El Harti
1,
Rachid Lhissou
2,
Jamal-Eddine Ouzemou
1,
Mohcine Chakouri
1 and
Amine Jellouli
1
1
Team of Remote Sensing and GIS Applied to the Geosciences and the Environment, Faculty of Sciences and Techniques, Beni Mellal 23000, Morocco
2
INRS—Centre Eau Terre Environnement, 490, de la Couronne, Québec City, QC G1K 9A9, Canada
*
Author to whom correspondence should be addressed.
Agriculture 2022, 12(8), 1168; https://doi.org/10.3390/agriculture12081168
Submission received: 29 June 2022 / Revised: 27 July 2022 / Accepted: 3 August 2022 / Published: 5 August 2022
(This article belongs to the Special Issue Recent Advances in Agro-Geoinformatics)

Abstract

:
In arid and semi-arid regions, agriculture is an important element of the national economy, but this sector is a large consumer of water. In a context of high pressure on water resources, appropriate management is required. In semi-arid, intensive agricultural systems, such as the Tadla irrigated perimeter in central Morocco, a large amount of water is lost by evapotranspiration (ET), and farmers need an effective decision support system for good irrigation management. The main objective of this study was to combine a high spatial resolution Sentinel-2 satellite and meteorological data for estimating crop water requirements in the irrigated perimeter of Tadla and qualifying its irrigation strategy. The dual approach of the FAO-56 (Food and Agriculture Organization) model, based on the modulation of evaporative demand, was used for the estimation of crop water requirements. Sentinel-2A temporal images were used for crop type mapping and deriving the basal crop coefficient (Kcb) based on NDVI data. Meteorological data were also used in crop water requirement simulation, using SAMIR (satellite monitoring of irrigation) software. The results allowed for the spatialization of crop water requirements on a large area of irrigated crops during the 2016–2017 agricultural season. In general, the crops’ requirement for water is at its maximum during the months of March and April, and the critical period starts from February for most crops. Maps of water requirements were developed. They showed the variability over time of crop development and their estimated water requirements. The results obtained constitute an important indicator of how water should be distributed over the area in order to improve the efficiency of the irrigation scheduling strategy.

1. Introduction

The problem of the development and management of sustainable water resources affects most countries of the world, especially those located in arid and semi-arid regions. These countries have to face limited water resources and a constantly increasing demand due to various factors: a high population growth, the expansion of irrigated agriculture, and urban, industrial, and tourism development. Irrigation is the major water consumer in the Mediterranean region (around 81% of mobilized water is used in agriculture), although it concerns only 20% of the useful agricultural area [1]. With the aim of reducing water consumption through rational management and ensuring the sustainability of agriculture, precision agriculture has been a major focus of scientific research over the past decade, using new technologies, such as satellite data, as well as new drone technologies [2].
Moroccan agriculture is characterized by equivalent statistics, with around 83% of the water used for irrigation, while it only covers 13% of arable land. In addition, almost half of the arable land is located in semi-arid areas (with precipitation between 200 and 400 mm/year), while in these areas, the evaporative demand is about 1500 mm/year. A rational and rigorous water management system in this area is essential. In this context, studies on the rationing of water use for the agricultural sector, through irrigation management, occupy an important place among scientific communities and basin agencies. After water is supplied to the plant (by irrigation or precipitation), only a small amount is used by the plant for its organic matter composition. The major part is evacuated by the stomata in the form of water vapor. On a field scale, evaporation from the soil also contributes to water loss.
Research carried out for several decades up to the present day on the determination of crop water requirements has mainly focused on experimental approaches, in particular: lysimetric methods [3], the sap flow technique [4,5,6,7,8], micrometeorological methods [9,10], and scintillometry [11]. These methods require very sophisticated and expensive equipment. This research has also focused on approaches based on models called indirect methods [12]. Among indirect methods, FAO-56 is the most frequently used approach for estimating crop water requirements [13]. This simple and robust approach can be used to quantify water requirements and assist decision makers in managing and planning irrigation at the field scale [14,15,16]. However, one of the major problems encountered when managing irrigation on a regional scale is the spatial variability of the parameters of the model. Hence the interest of spatial remote sensing, which makes it possible to extrapolate local information to a spatial scale [17,18,19,20,21,22]. The development of remote sensing capabilities (temporal, spatial, and spectral resolution) offers a better opportunity for hydro-agricultural management [17,23,24].
Several works have used space-based remote sensing, such as Sentinel-2 [20,25,26], for irrigation water planning and management [15,27,28,29,30,31,32]. These works are based on the relationship between surface temperature and transpiration; a plant under water stress limits its transpiration by closing its stomata, which leads to high leaf temperatures. Spatial remote sensing also provides continuous information on the state of vegetation through vegetation indices [33,34,35]. The most commonly used vegetation index is the NDVI (normalized difference vegetation index). It is defined as the difference between the surface reflectance in the near-infrared range and the red on the sum of the plants [36,37]. The similarity between the evolution of the vegetation index (NDVI) during the crop development cycle and that of the crop coefficient has encouraged scientists to study the relationship between these two parameters in order to estimate crop water requirements on a regional scale [17,32]. In this context, this work was a new application of SAMIR software (satellite monitoring of irrigation), employing 10 m high-resolution NDVI time series data for estimating the actual basal crop coefficient and vegetation fraction for running the FAO56 dual crop coefficient water balance model in a highly fragmented and intensive agricultural system. In fact, this work combined a 10 m Sentinel-2 based crop type map and NDVI time series with meteorological data in order to estimate crop water requirements in the Tadla irrigated perimeter and qualify the irrigation strategy in this highly fragmented and intensive agricultural system. The maps produced make it possible to determine the water needs of each crop in the irrigated perimeter at a daily, monthly, or seasonal time step and with a resolution of 10 m2.

2. Materials and Methods

2.1. Study Area and Data Used

The study area was located in Morocco (32°00′ N and 5°00′ W), a country bordered to the west by the Atlantic Ocean, to the east by Algeria, to the south by Mauritania, and to the north by the Mediterranean. Morocco is therefore located in the extreme northwest of Africa, just across from Europe, from which it is separated only by the 17 km of the Strait of Gibraltar. Morocco is one of the Maghreb states and is the westernmost country. The variety of Moroccan landscapes is rich. It changes from summits to plains, and from the greenest vegetation to the most complete aridity.
The agricultural plain of Tadla is located in the Oum Er Rbia basin in central Morocco, on an area of 320,000 ha. The study area was located in the irrigated perimeter of Tadla, which is part of the agricultural plain (Figure 1). With an average altitude of 400 m, the perimeter has an arid to semi-arid climate, with temperatures ranging from −6 °C in January to 46 °C in August [38] and an average annual rainfall of 280 mm [39]. The perimeter is supplied with irrigation water by the Bin El Ouidane and Ahmed El Hansali dams; it is also characterized by a diversity of crops, including citrus fruits, olives, pomegranates, cereals (wheat and barley), alfalfa, and sugar beets, due to the availability of ground and surface waters [33].

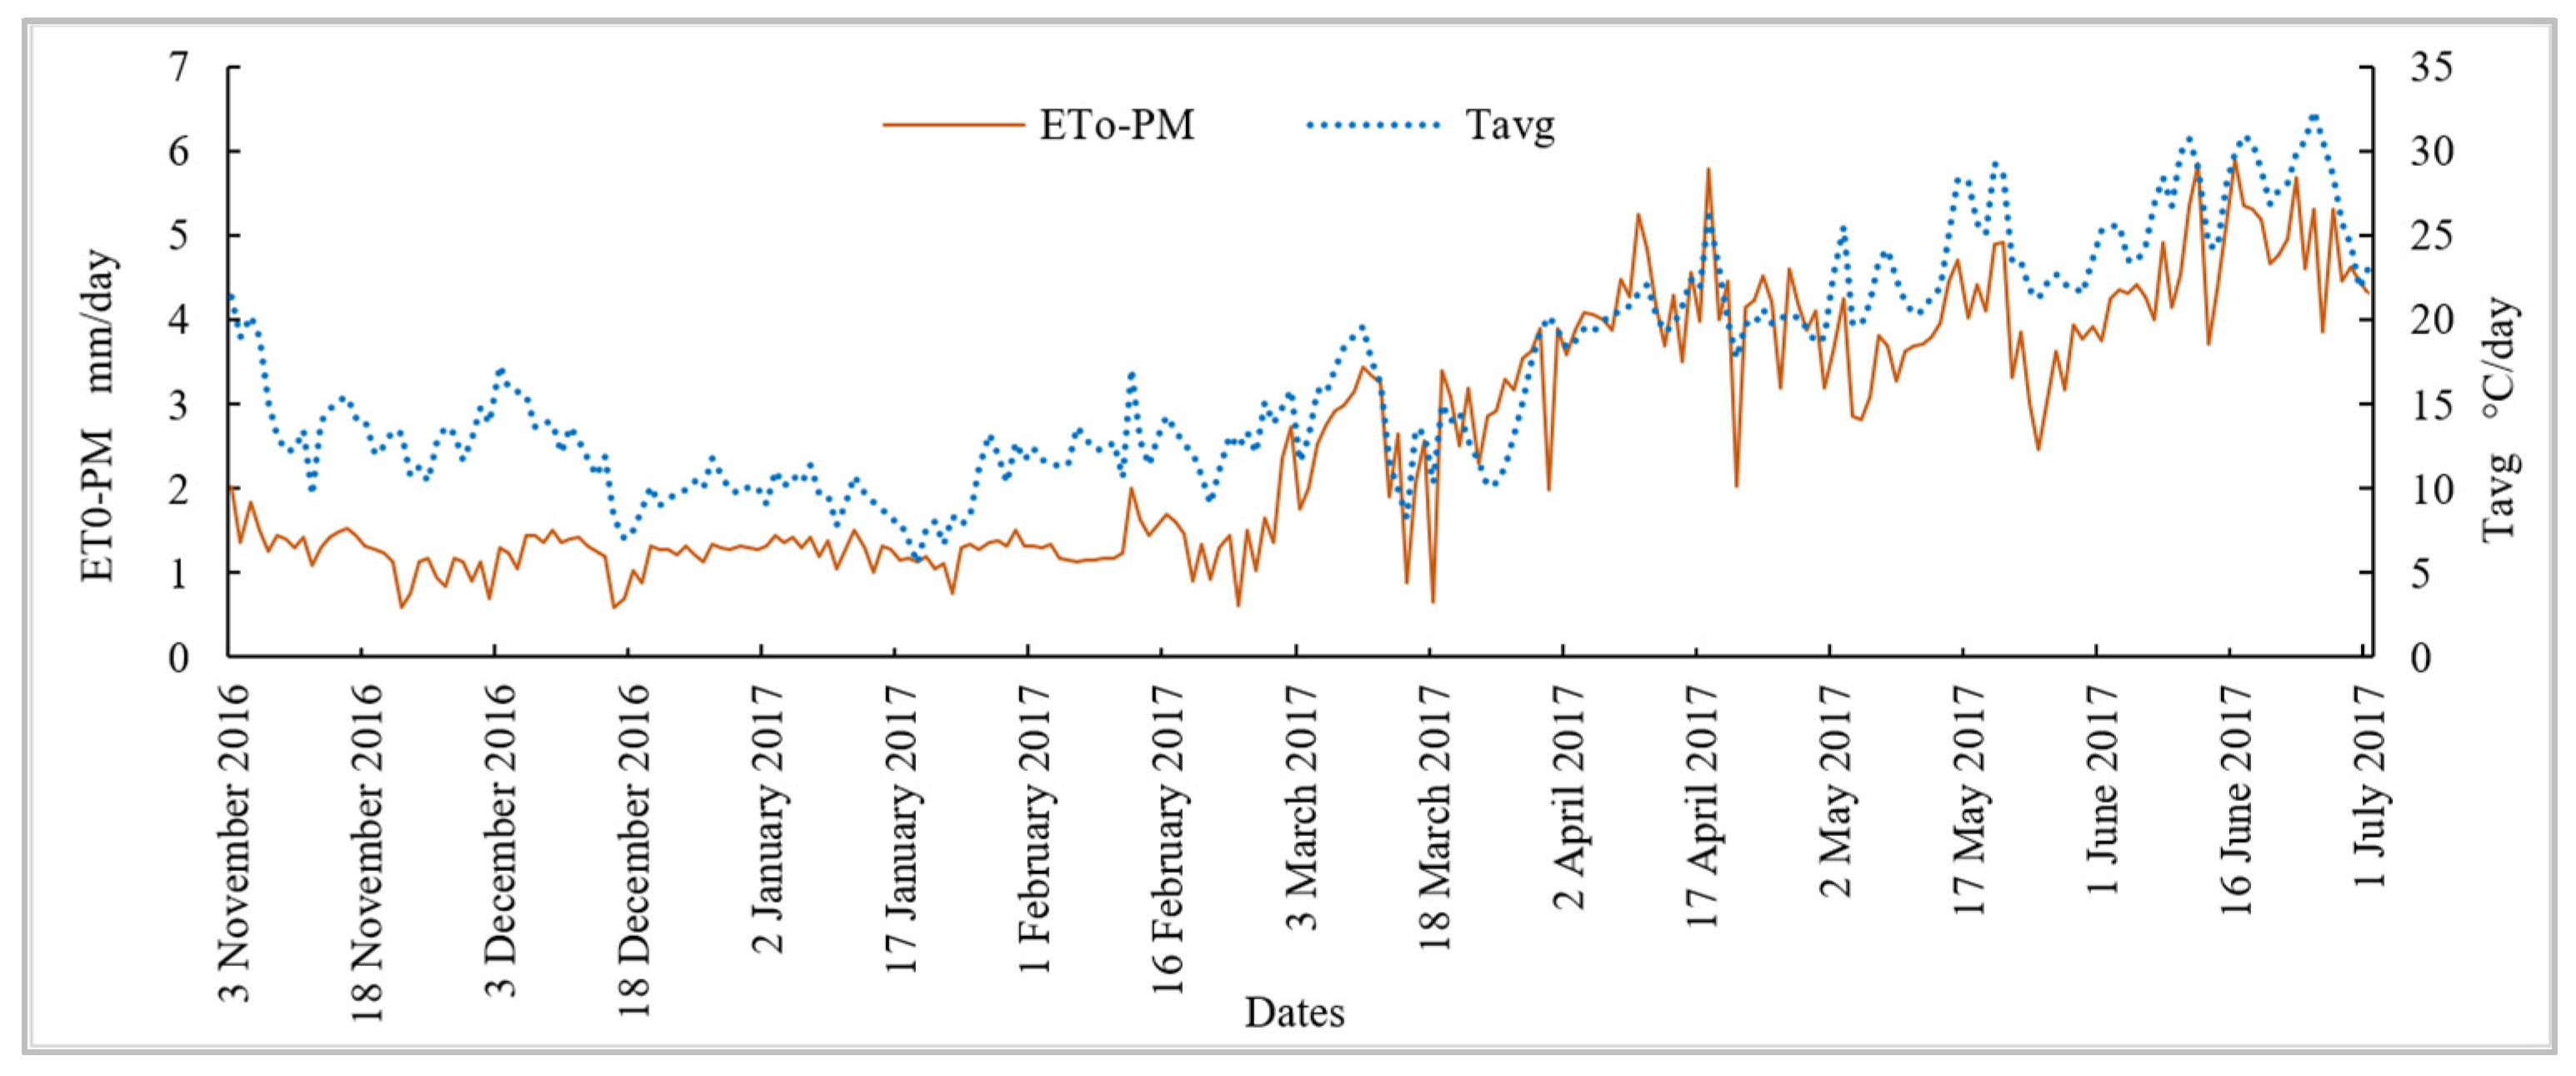
2.1.1. Meteorological Data

The meteorological data used were recorded by the meteorological station Oulad Slimane, located in proximity to the study area (Figure 1). This station measures solar radiation, wind speed, temperature, air humidity, and precipitation. Following the standards of the FAO-56 Penman–Monteith model [12], daily averages of climate data were calculated to determine the reference evapotranspiration (ET0) in mm/day. The variation of ET0 and average daily temperature measured during the 2016/2017 agricultural season is presented in Figure 2. The reference evapotranspiration records show moderate values in autumn (1 to 2 mm/day) and high values in summer (2 to 6 mm/day), which characterizes a semi-arid climate.

2.1.2. Satellite Data and Pre-Processing

In order to estimate evapotranspiration and determine crop water requirements in the study area, a time series of NDVI vegetation indices was used from Sentinel-2A multispectral satellite images (Table 1). Ten images covering the study area were acquired during the 2016/2017 agricultural season. This allowed us to have at least one image per month over the study area. The images were radiometrically and atmospherically corrected using the sen2cor algorithm at 10 m spatial resolution (Figure 3).

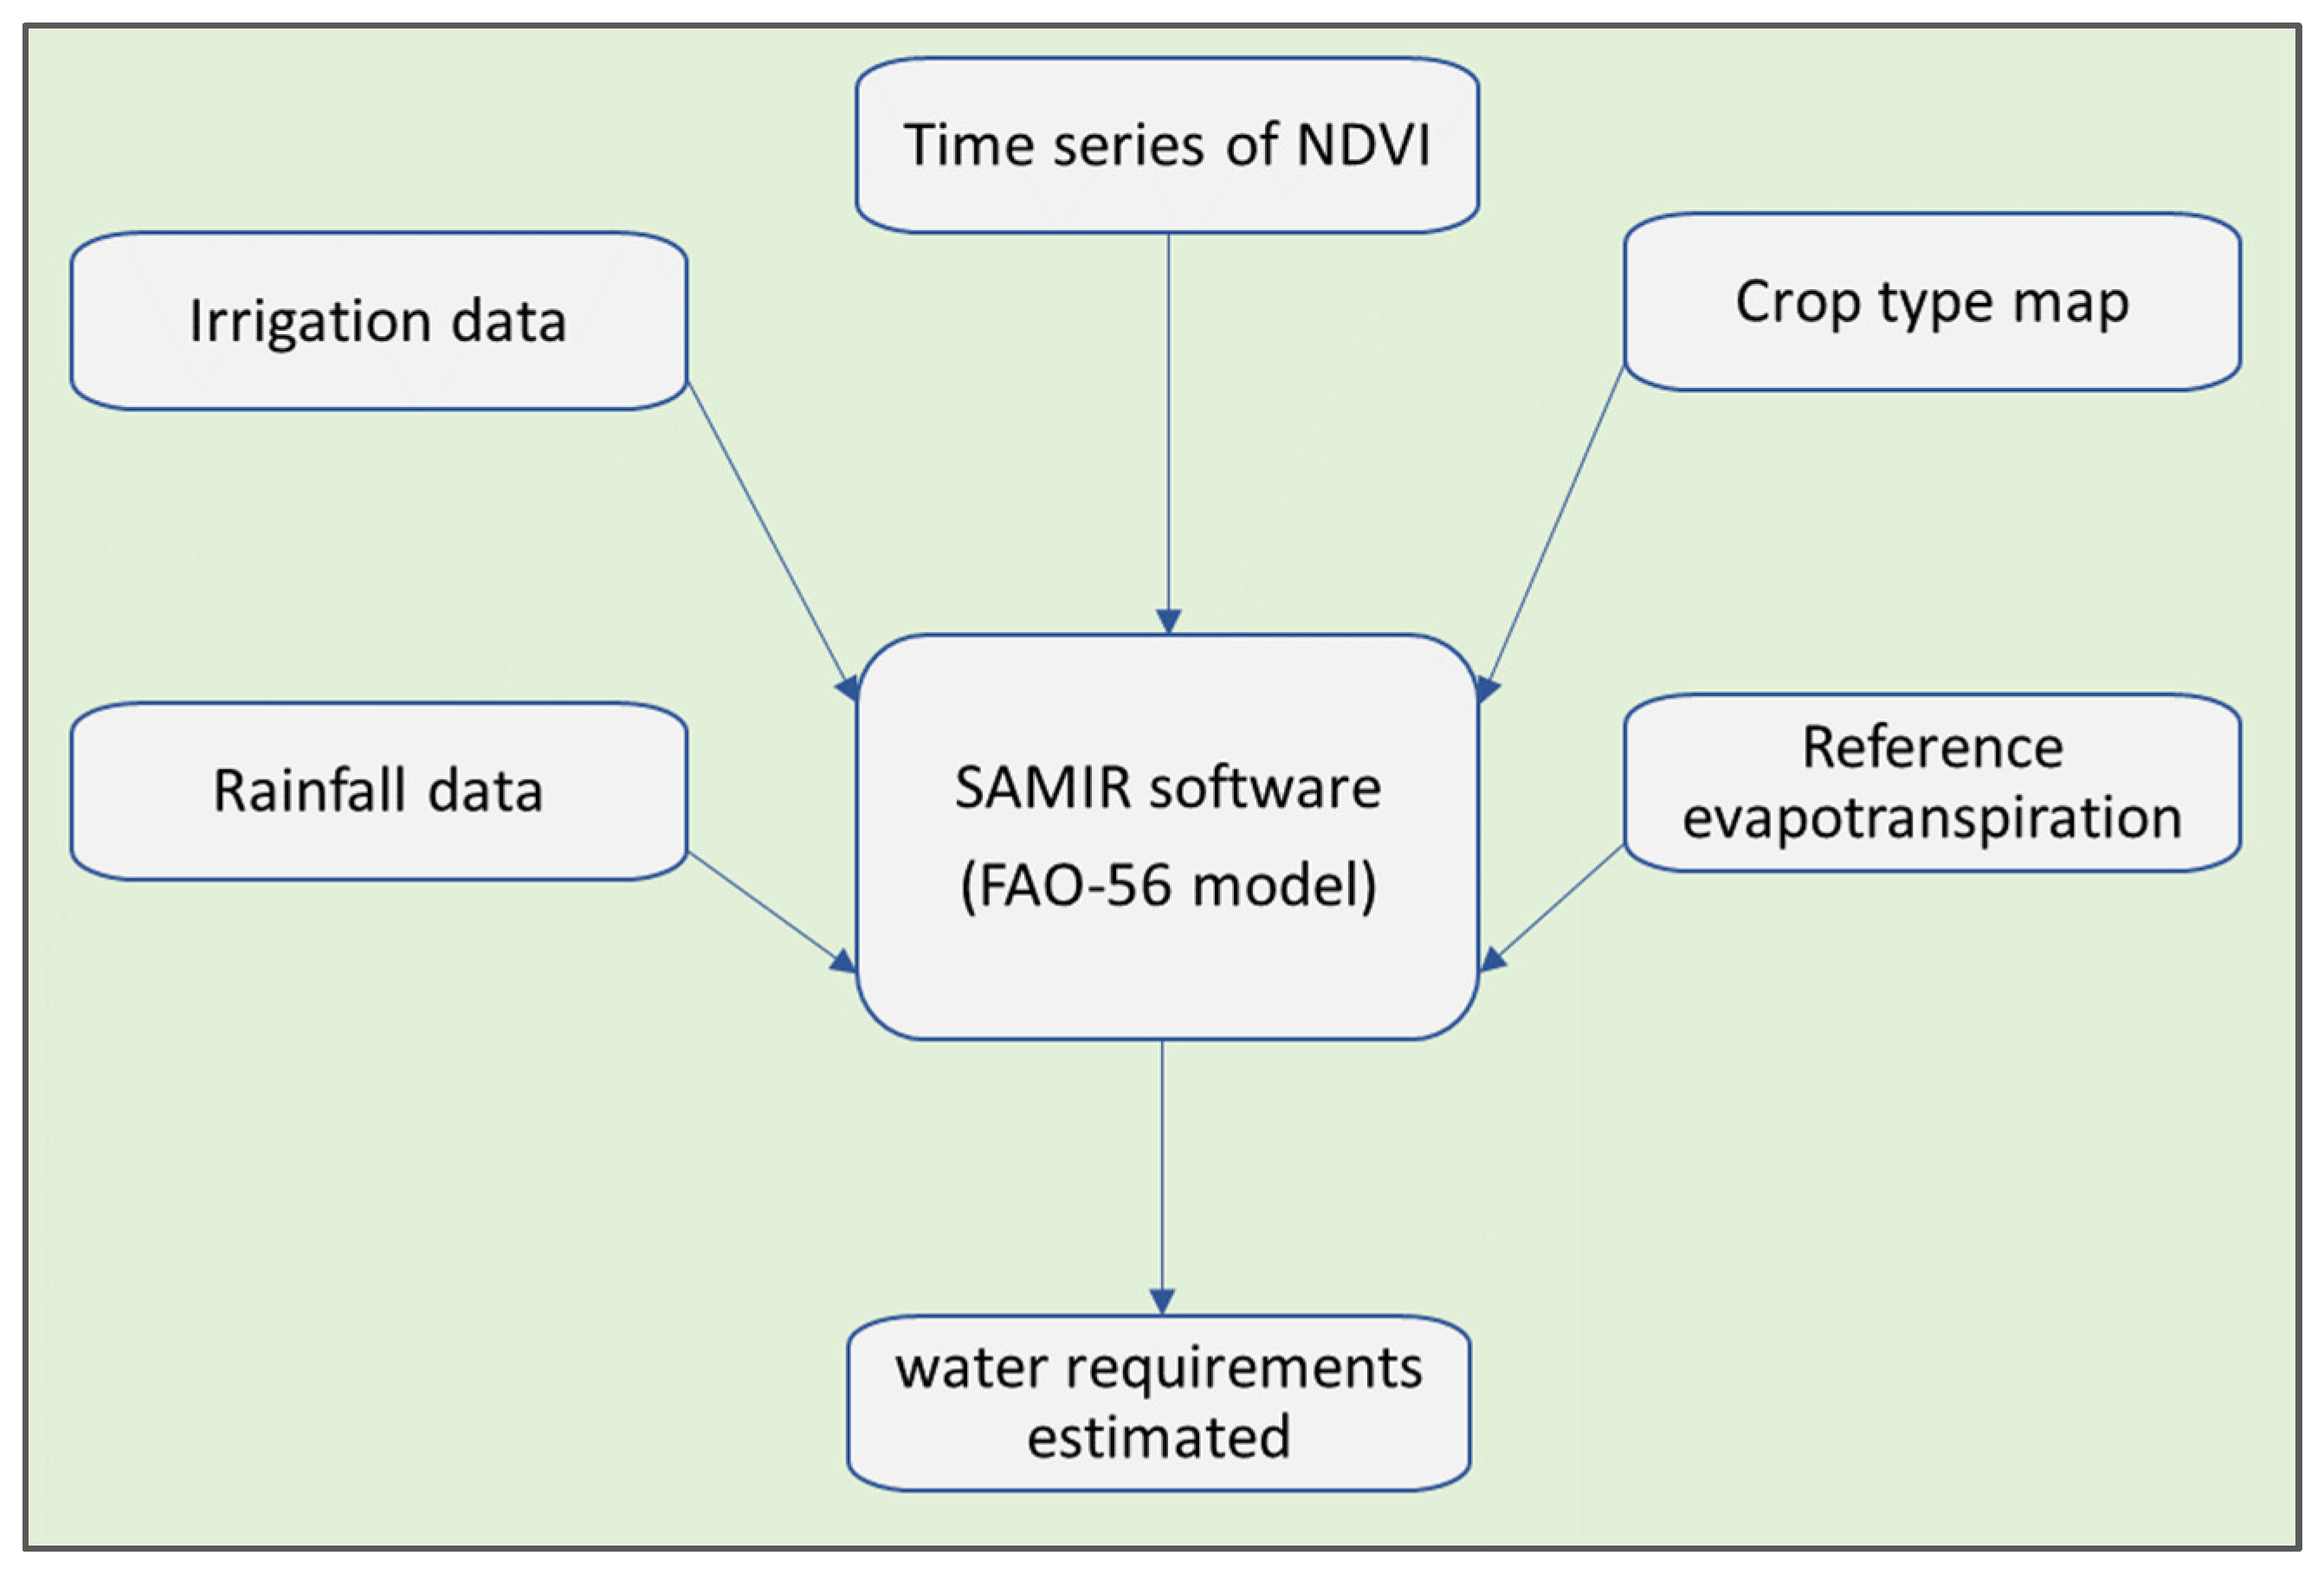
2.2. Description of the Plant Water Requirement Model

The FAO-56 model was used to estimate water requirements [40]. This model is based on the modulation of the evaporative demand by the crop coefficient. The latter is deduced from the seasonal cycle of the normalized vegetation index (NDVI) by using the water balance in the soil. The FAO-56 method is the simplest level of description of exchanges between three components: soil, plants, and atmosphere [12,14,40]. It is operationally used by most agricultural water managers, and it weighs a reference evapotranspiration (that of a well-irrigated lawn subjected to current climatic conditions) by the crop coefficient and that of water stress. There are three types of evapotranspiration (reference evapotranspiration, evapotranspiration under standard conditions, and evapotranspiration under non-standard conditions).
The reference evapotranspiration, ET0, is defined as the total water loss by evaporation and transpiration from a large area of well-irrigated grass, in full growth period, completely covering the soil, and with an assumed crop height of 0.12 m. ET0 can be calculated from meteorological data using the FAO-56 Penman–Monteith method, which is considered as the most recommended method for calculating the reference evapotranspiration [12].
The evapotranspiration under standard conditions, ETc, also called maximum evapotranspiration, is defined at different stages of development of a given crop under optimal agronomic conditions, without diseases and without stress (hydric or nutritional). ETc is related to ET0 through a coefficient called the cultural coefficient, Kc, which considers the physical and physiological differences between the reference area and the given crop:
ETc = Kc × ET0
The evapotranspiration under non-standard conditions, also called real evapotranspiration (ETr), is the quantity of water evaporated by the soil and vegetation at a given stage of development as well as the presence of a real sanitary state (the presence of diseases and insects, water stress, etc.). ETr is also related to ETc by a coefficient, Ks, called the water stress coefficient:
ETr = Ks × Kc × ET0
The methods developed by FAO-56, based on the concept of reference evapotranspiration and crop coefficients, have been used as an operational and standard tool for irrigation programming. The algorithm used in this study was based on the FAO-56 model, with a dual crop coefficient approach developed by [5,12]. It is recommended that this approach be followed when better estimates of Kc are needed, such as for scheduling the irrigation of individual fields on a daily scale. This approach consists of dividing the crop coefficient, Kc, into two coefficients: the coefficient for transpiration, Kcb, called the basal crop coefficient, and another for soil evaporation, Ke, called the evaporation coefficient:
ETc = (Kcb + Ke) × ET0
The basal crop coefficient (Kcb) is based on the development of the crop. Thus, Ke is the coefficient that controls evaporation from the bare soil fraction as a function of surface moisture. In this work, a linear relationship between the basal crop coefficient, Kcb, and the normalized vegetation index, NDVI, was used for sugar beet, citrus, alfalfa, and cereal crops. This allowed us to determine the maximum and actual evapotranspiration at the field scale in the study area. Saadi et al. [41] used the SAMIR tool to simulate the ETc and irrigation volumes of several irrigated perimeters in the Kairouan plain in Tunisia. This tool is based on the FAO approach and used the NDVI from satellite images to estimate the Kcb via a linear relationship (Figure 4).
The evapotranspiration was estimated using satellite monitoring of irrigation (SAMIR) software, which allows the spatialization of evapotranspiration (ET) and water balance of irrigated crops over large areas [22,42]. The architecture of this program is based on the FAO-56 model. It calculates the reference evapotranspiration, ET0, from climatic data. In addition to that, the basal crop coefficient, Kcb, was determined by a time series of daily NDVIs after the interpolation between the dates of acquisition of the satellite images [15]. In addition to the spatialization of ET, SAMIR can be used to determine the crop water balance, which is obtained by coupling a soil module of three compartments (surface, root, and depth) to the FAO-56 model.
The FAO-56 tables [12] provide values of the crop coefficient according to the crops. In parallel to this approach, many studies have highlighted the relationship between NDVI and the crop coefficient [15,17,18,19,23].
The calculation of the water balance requires climatic data to estimate the reference evapotranspiration, ET0, precipitation, soil data, and irrigation data, as well as the crop type map and vegetation phenology (to estimate crop coefficients with the FAO-56 method). Irrigation data can be used in two ways: if they are available, they are used directly, and if not, they are estimated from the water balance calculation [43]. In this work, water quantities, as well as irrigation dates, were available. Concerning the soil data, three functional compartments can be configured: evaporative, root, and depth. Each compartment is characterized by its depth, field capacity, wilting point, diffusion coefficient, and saturation humidity. In addition, a soil type map can also be used. In our case, the data used were those published by the Food and Agriculture Organization of the United Nations (FAO) [12,43].

2.3. Crop Type Mapping

The methodology adopted for the realization of the crop type map is illustrated in Figure 5. The support vector machines (SVM) method was used for the classification of the multitemporal satellite dataset. A field survey was carried out to collect the reference data (120 samples); fifty percent of them were used for training the classification and checking the spectral profiles of the different crops in the study area, while the other fifty percent were used for the validation of the classification results.

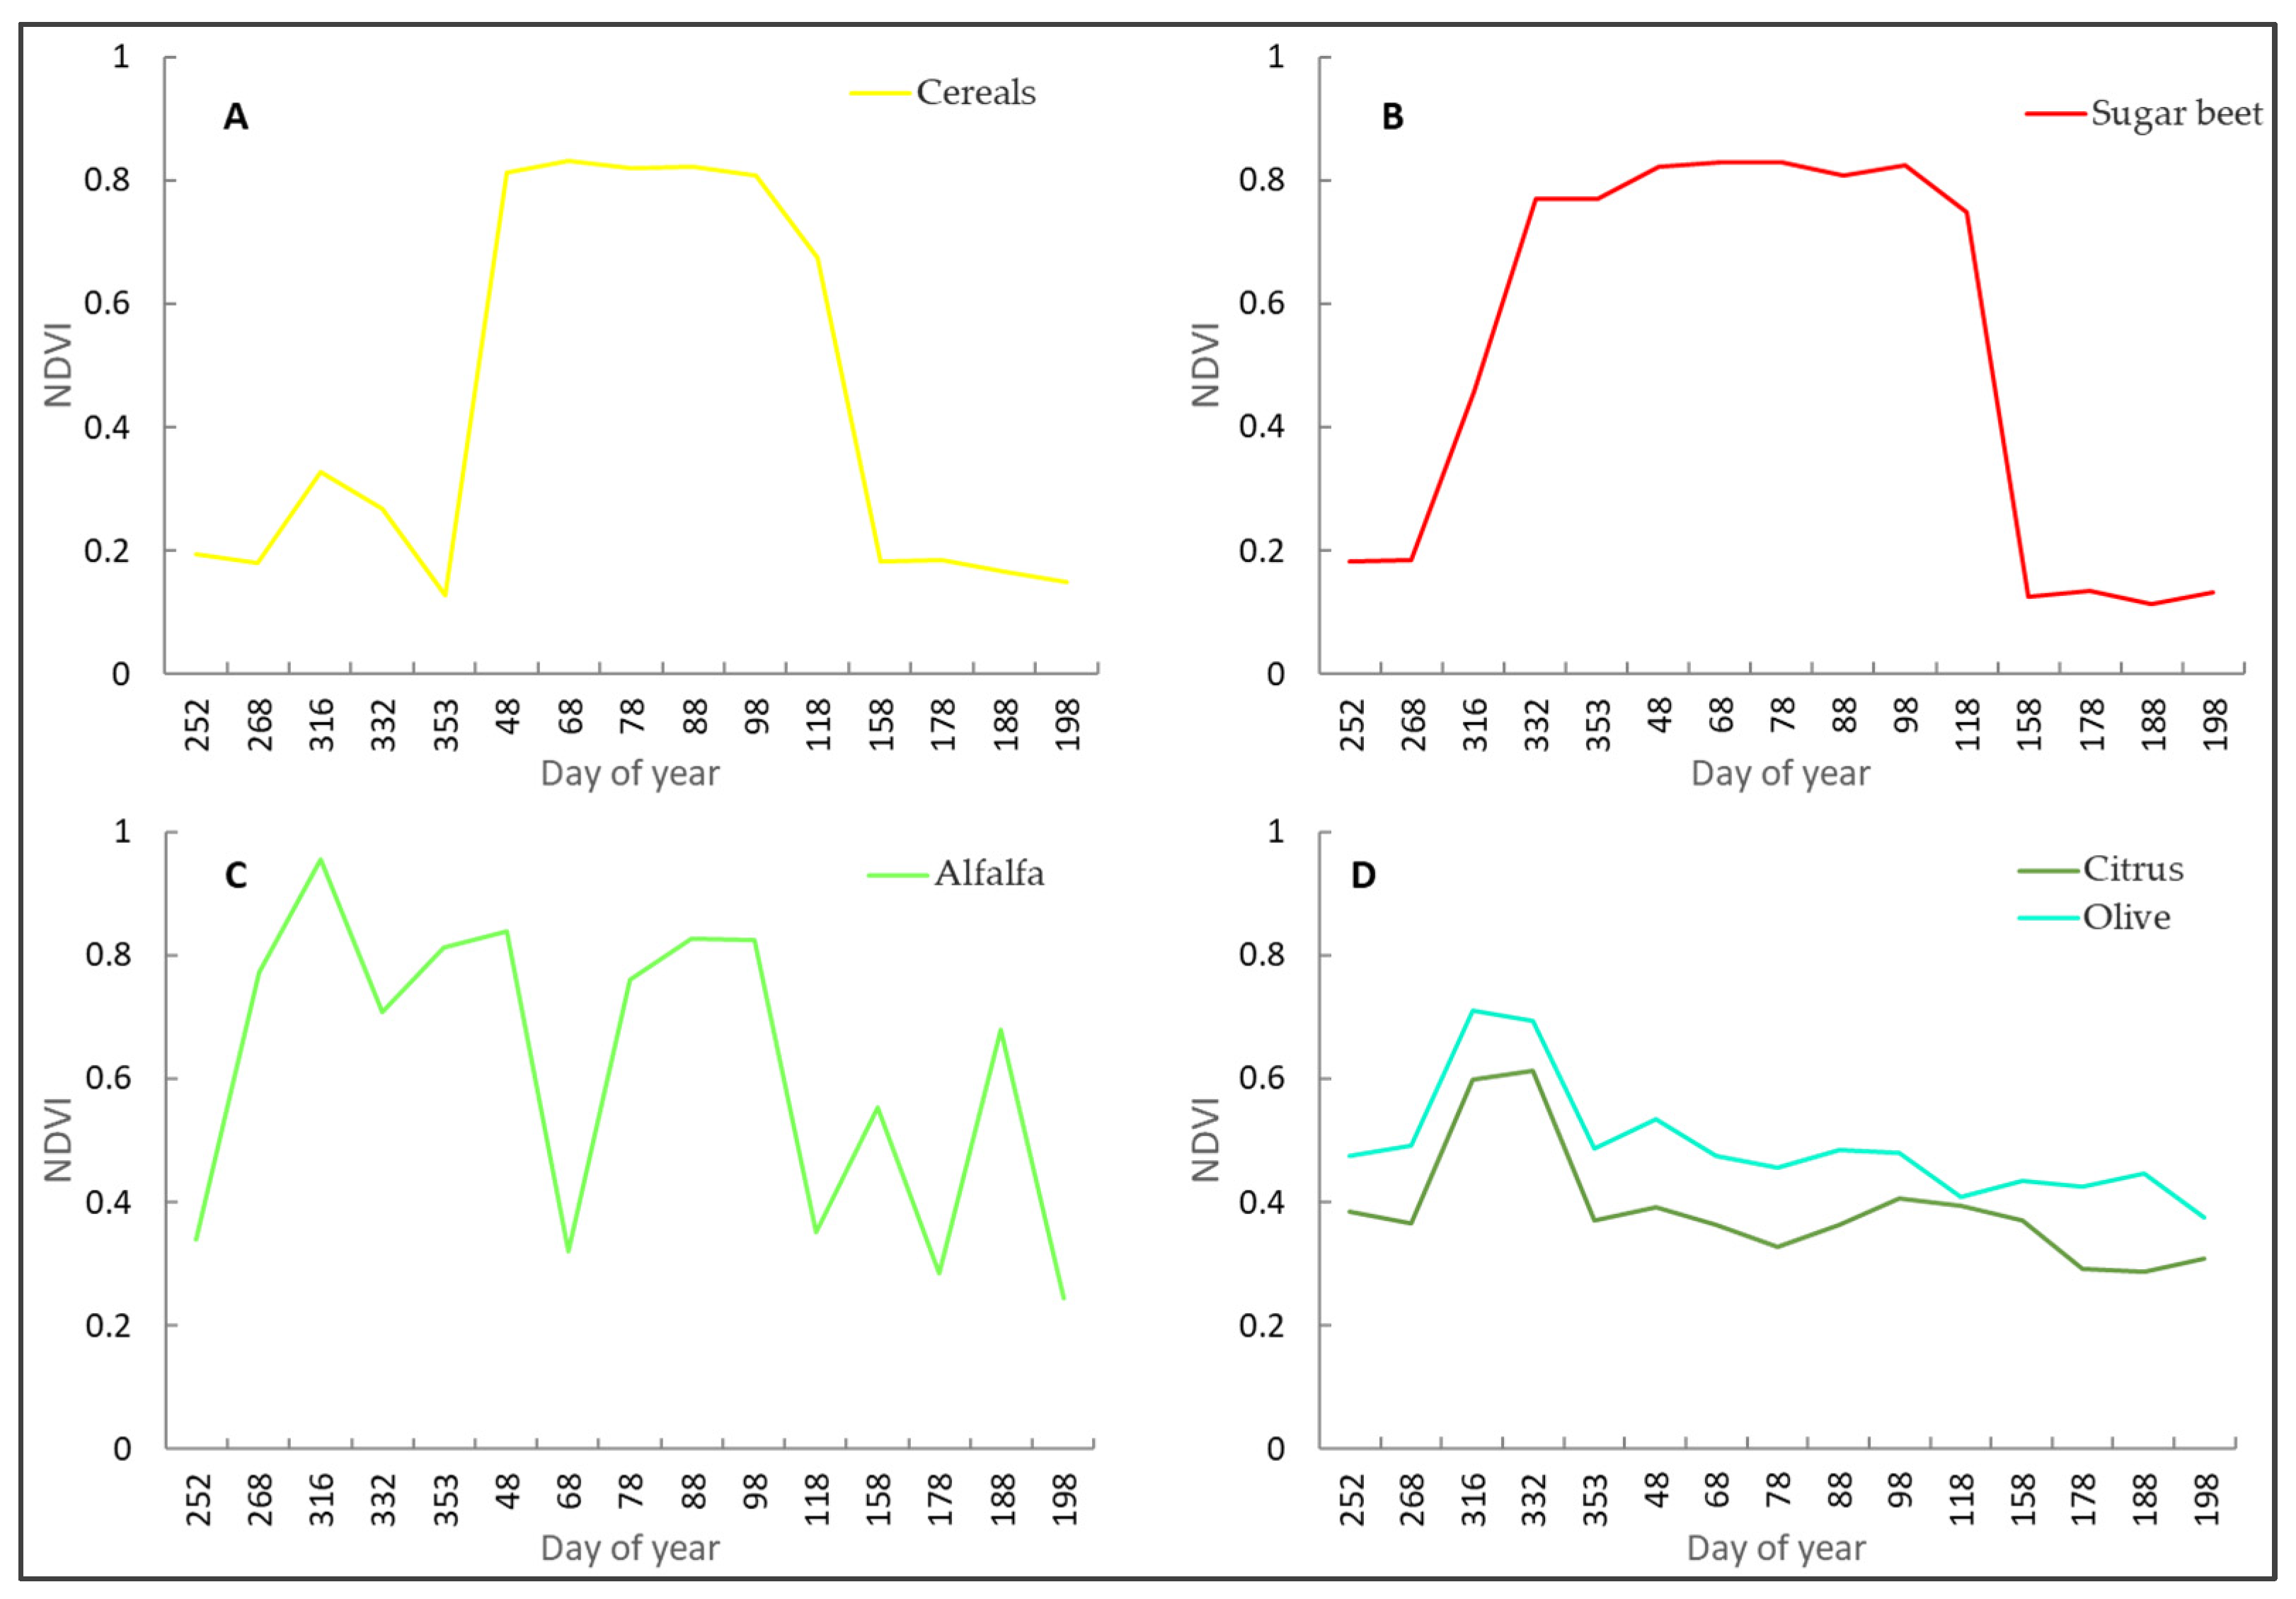
2.3.1. Extraction of NDVI Spectral Profiles from Crops

The NDVI time series was created from the multitemporal S2-A. According to the images (Figure 6), the study area contained different types of crops, such as sugar beets, alfalfa, cereals (wheat and barley), citrus fruits, and olive trees; each type of crop is characterized by a distinct spectral profile.

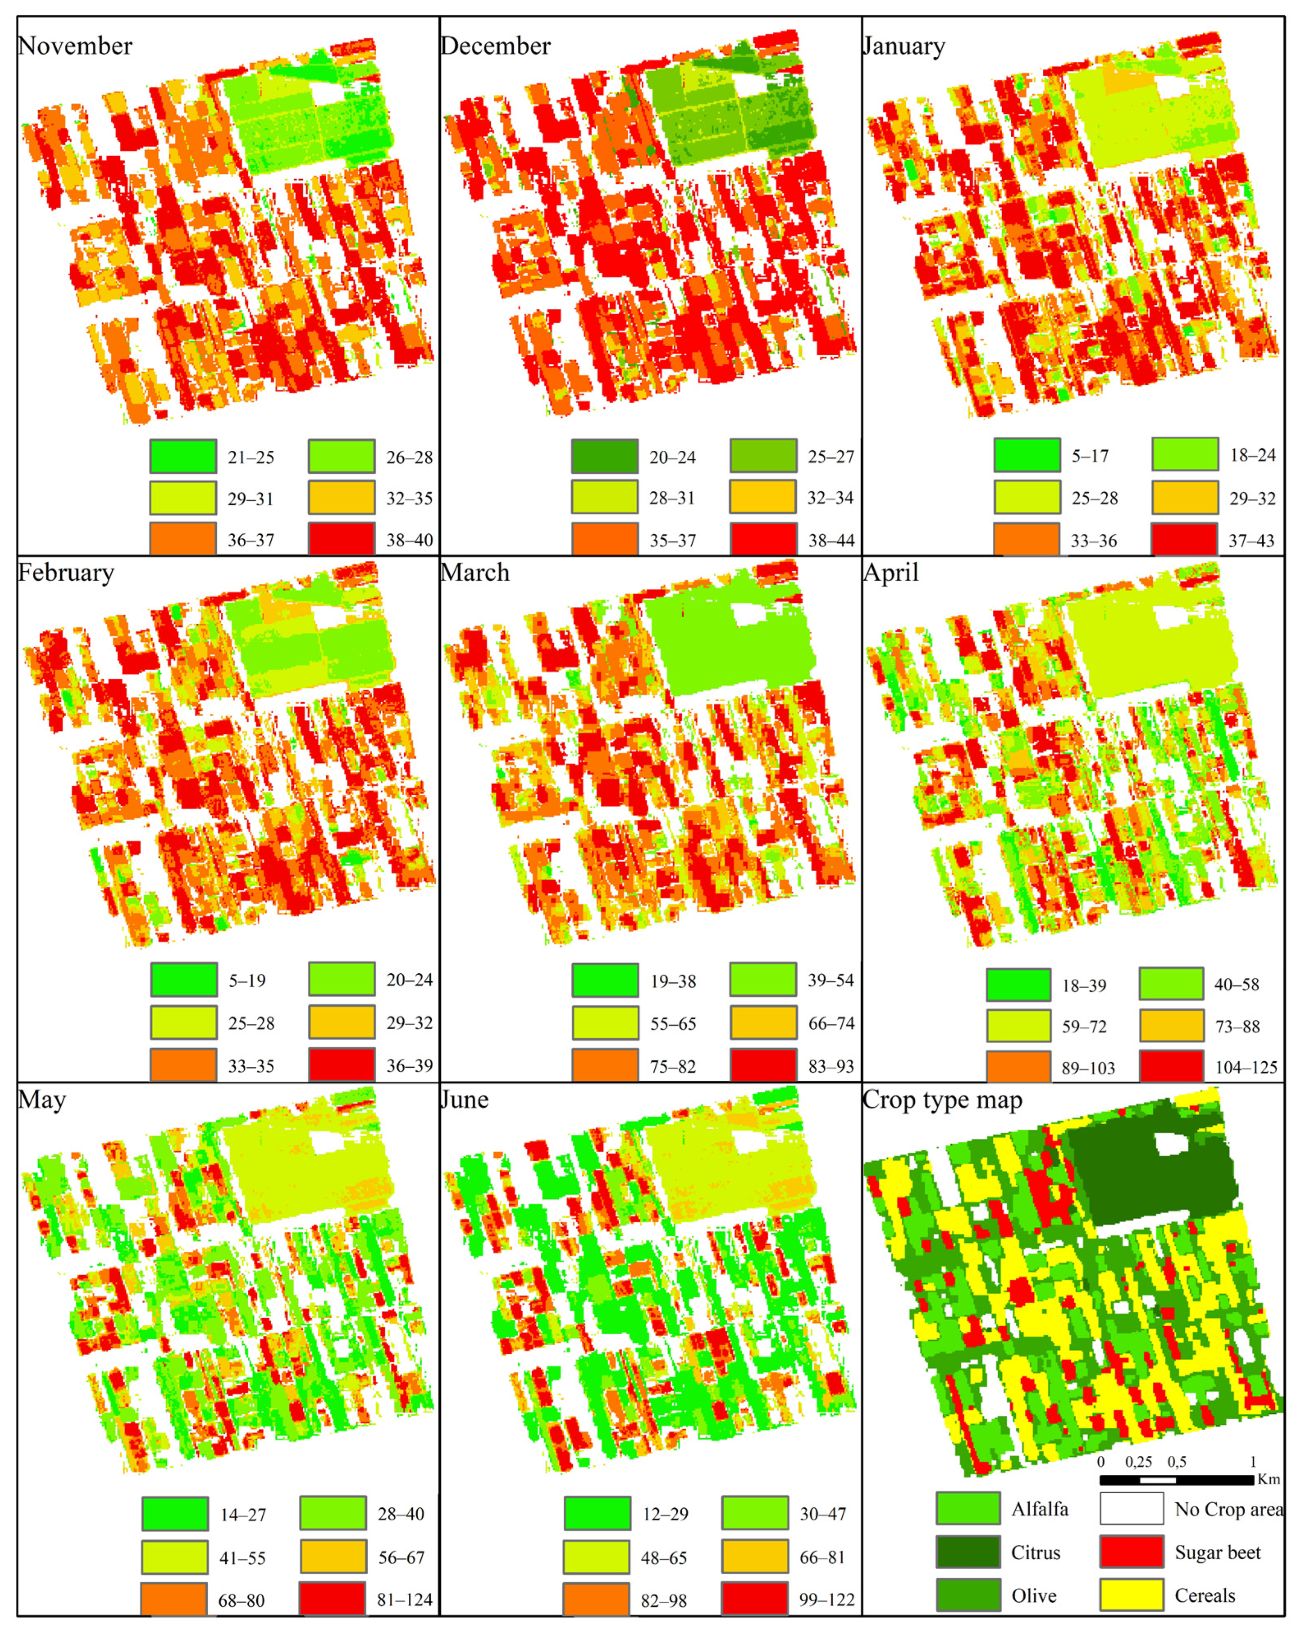
2.3.2. Crop Type Map

The NDVI was calculated for each image to create a time series covering the entire crop year. The spectral curves or profiles (endmembers) of each crop were extracted from the NDVI time series using the field database.
The result of the SVM classification is presented in Figure 7. The accuracy assessment of the SVM classification is presented in Figure 8. The evaluation of the classification result, with a time series of the normalized NDVI, returned a Kappa coefficient and an overall accuracy of 92.32% and 93.91%, respectively.

3. Results and Discussion

3.1. Crop Water Requirements under Optimal Agronomic Conditions

3.1.1. Seasonal Water Requirements

Estimating crop water requirements under optimal agronomic conditions does not consider water stress, diseases, or weeds. The spatialization of crop water requirements in the study area, during the period from 3 November 2016 to 1 June 2017, using the SAMIR tool, showed that the estimated water requirements varied from 82 mm to 552 mm depending on the type of crop (Figure 9).
Analysis of the water requirement map (Figure 9) and the crop type map (Figure 7) showed that the most water-consuming crops are alfalfa and sugar beets, respectively. The comparison of the water requirements of alfalfa, sugar beets, citrus fruits, olive trees, and cereals (wheat and barley) during the 2016–2017 agricultural season with the average rainfall for the same period, which was 308.1 mm, provided a first indication of the level of the average deficit to be covered by irrigation. These maps were used to determine the water requirements of each crop for each pixel at a resolution of 10 m throughout the agricultural season.

3.1.2. Monthly Water Requirements

In order to understand the variation in water requirements between crops on a monthly basis, a small site (Site1) was selected in the study area that aggregates the different crops studied in this work (Figure 1). The spatio-temporal distribution of the monthly accumulated amount of water required for each pixel of each crop was computed from 3 November 2016 to 1 June 2017 (Figure 10). It should be noted that crop water requirements depend on the crop development cycle; they increase when the chlorophyll activity of the vegetation becomes important, as well as with the increase in temperature. In general, the optimal amount of water for the crops is at its maximum during March and April.
Concerning arboriculture, the citrus requires a relatively less amount of water compared to other crops during November, December, January, and February. Cereals (wheat and barley) need a significant amount of water starting from the sowing period (November). This need becomes more important as the plant develops during the agricultural season, and it reaches a maximum during March and April, which is normal, because at this time, cereals begin their maturity stage, characterized by the start of the seed filling. Alfalfa is one of the crops with a short life cycle. After each harvest, alfalfa needs a large amount of water, especially during May and June.

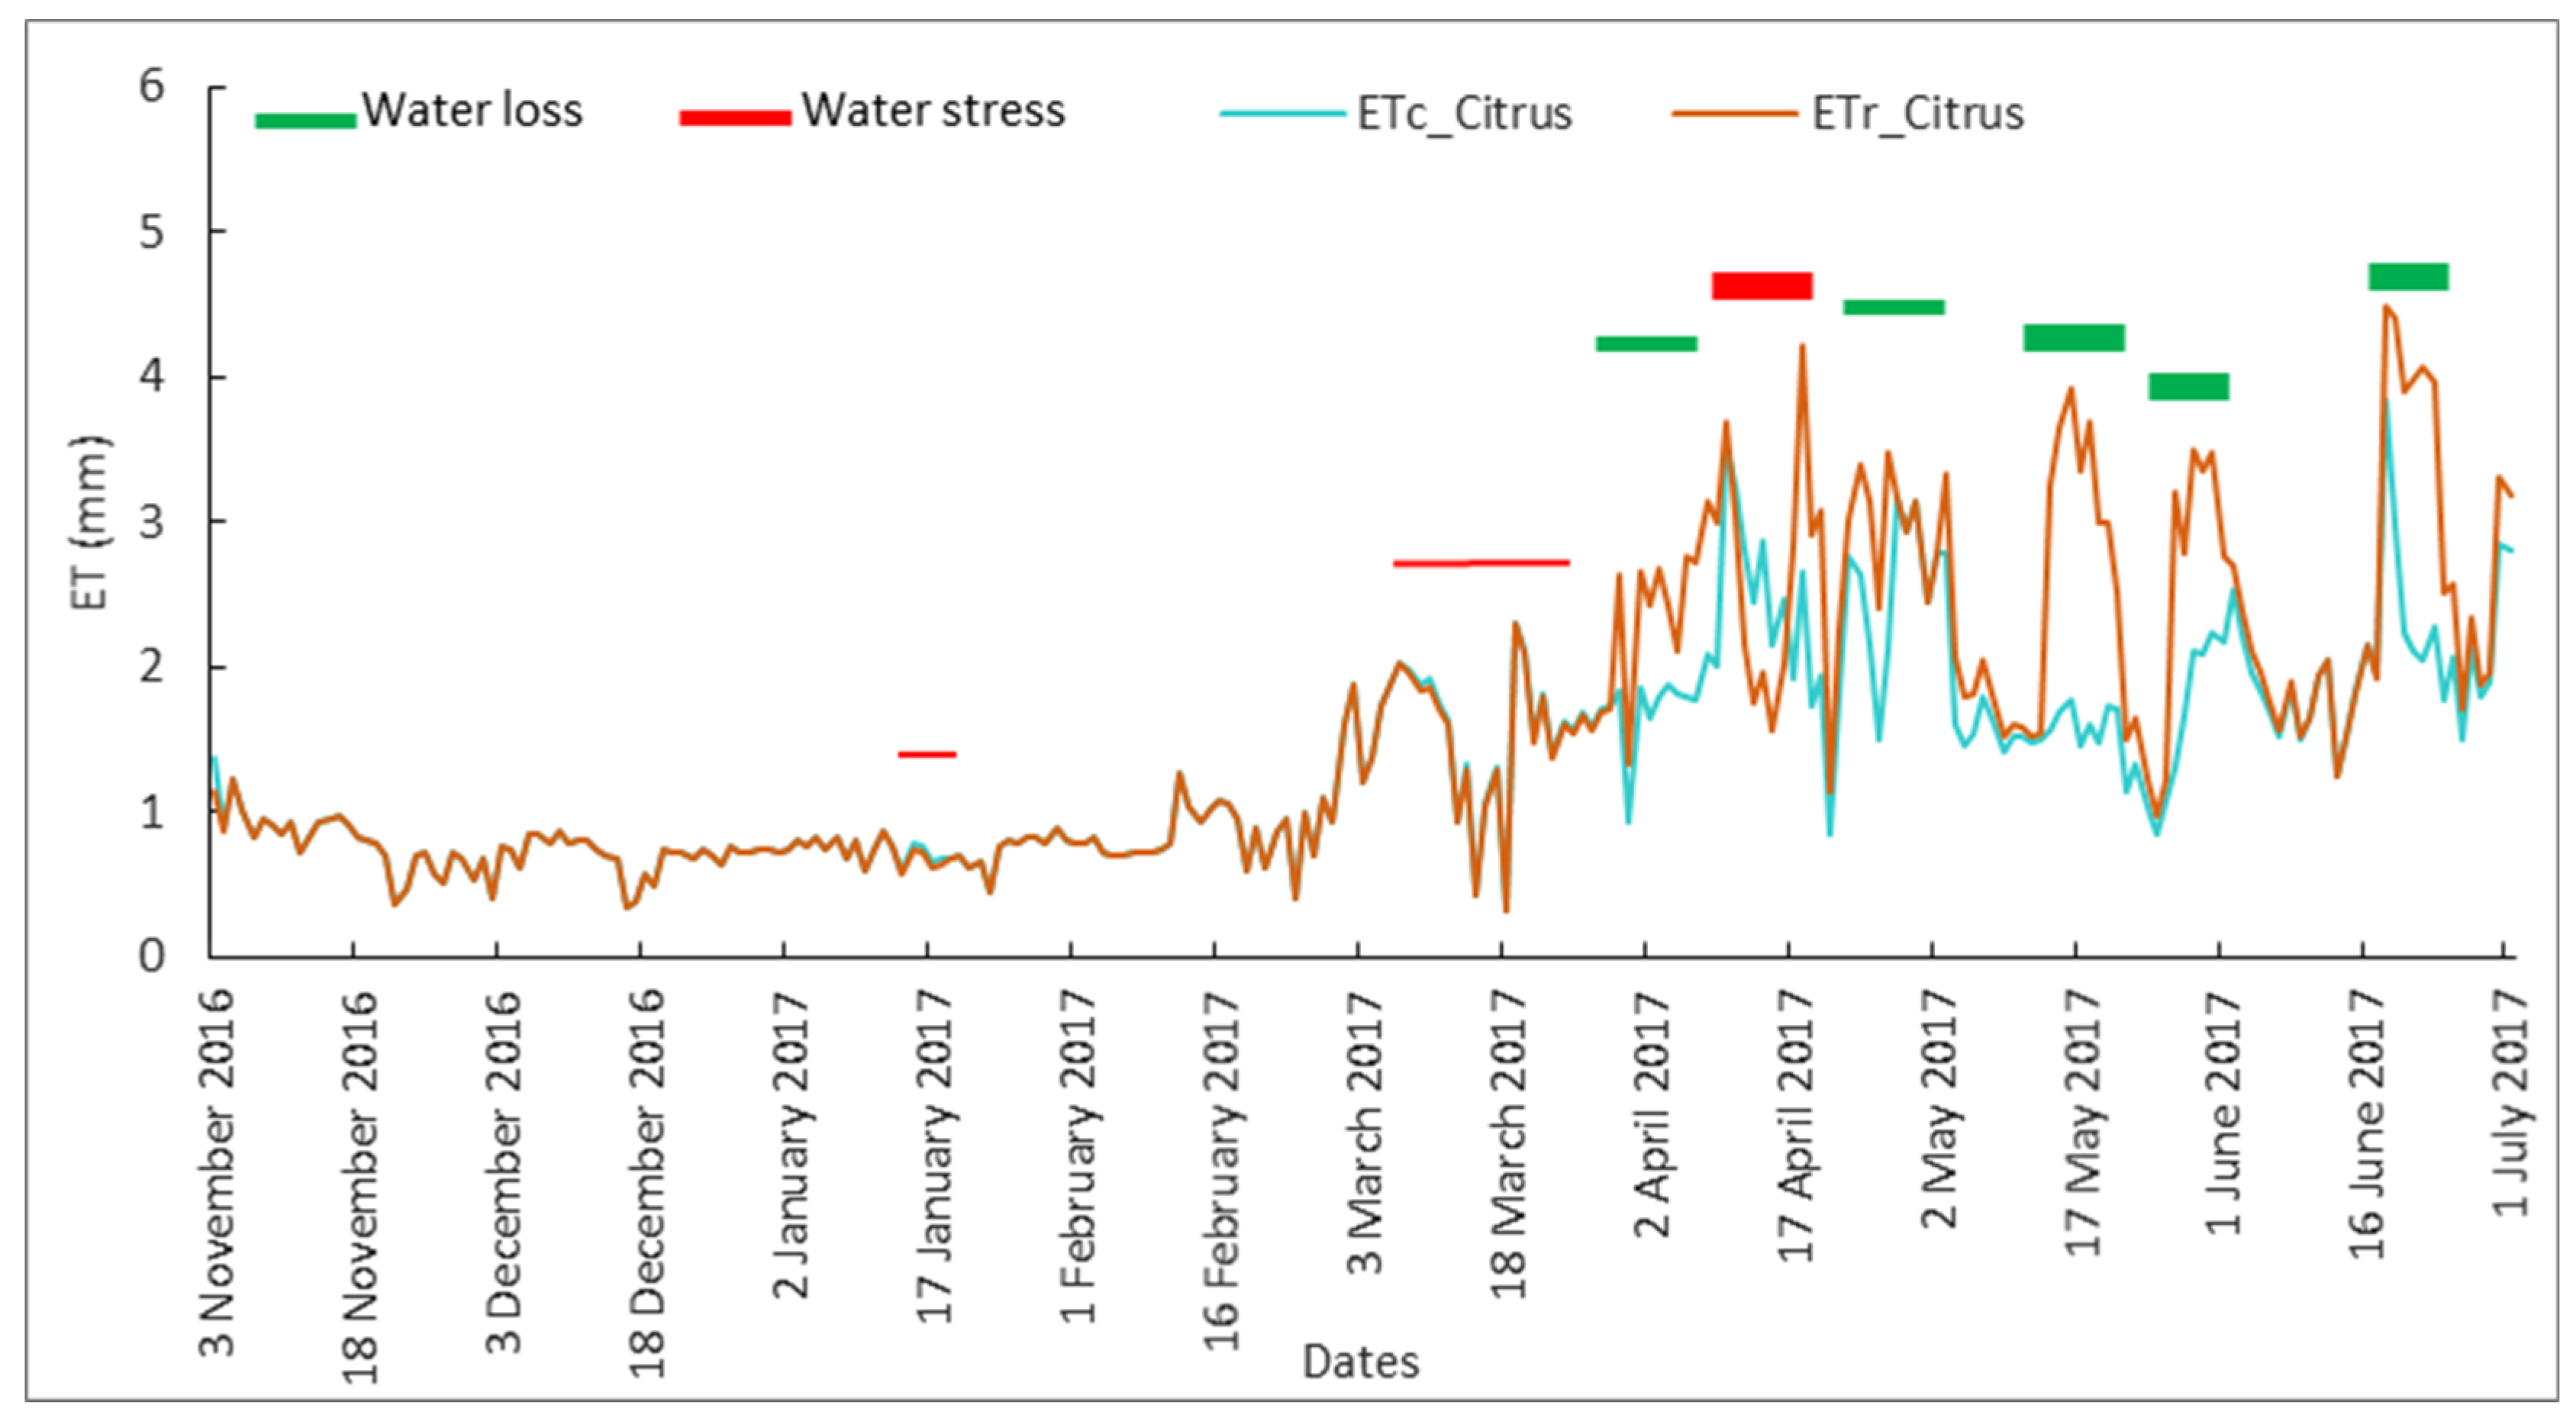
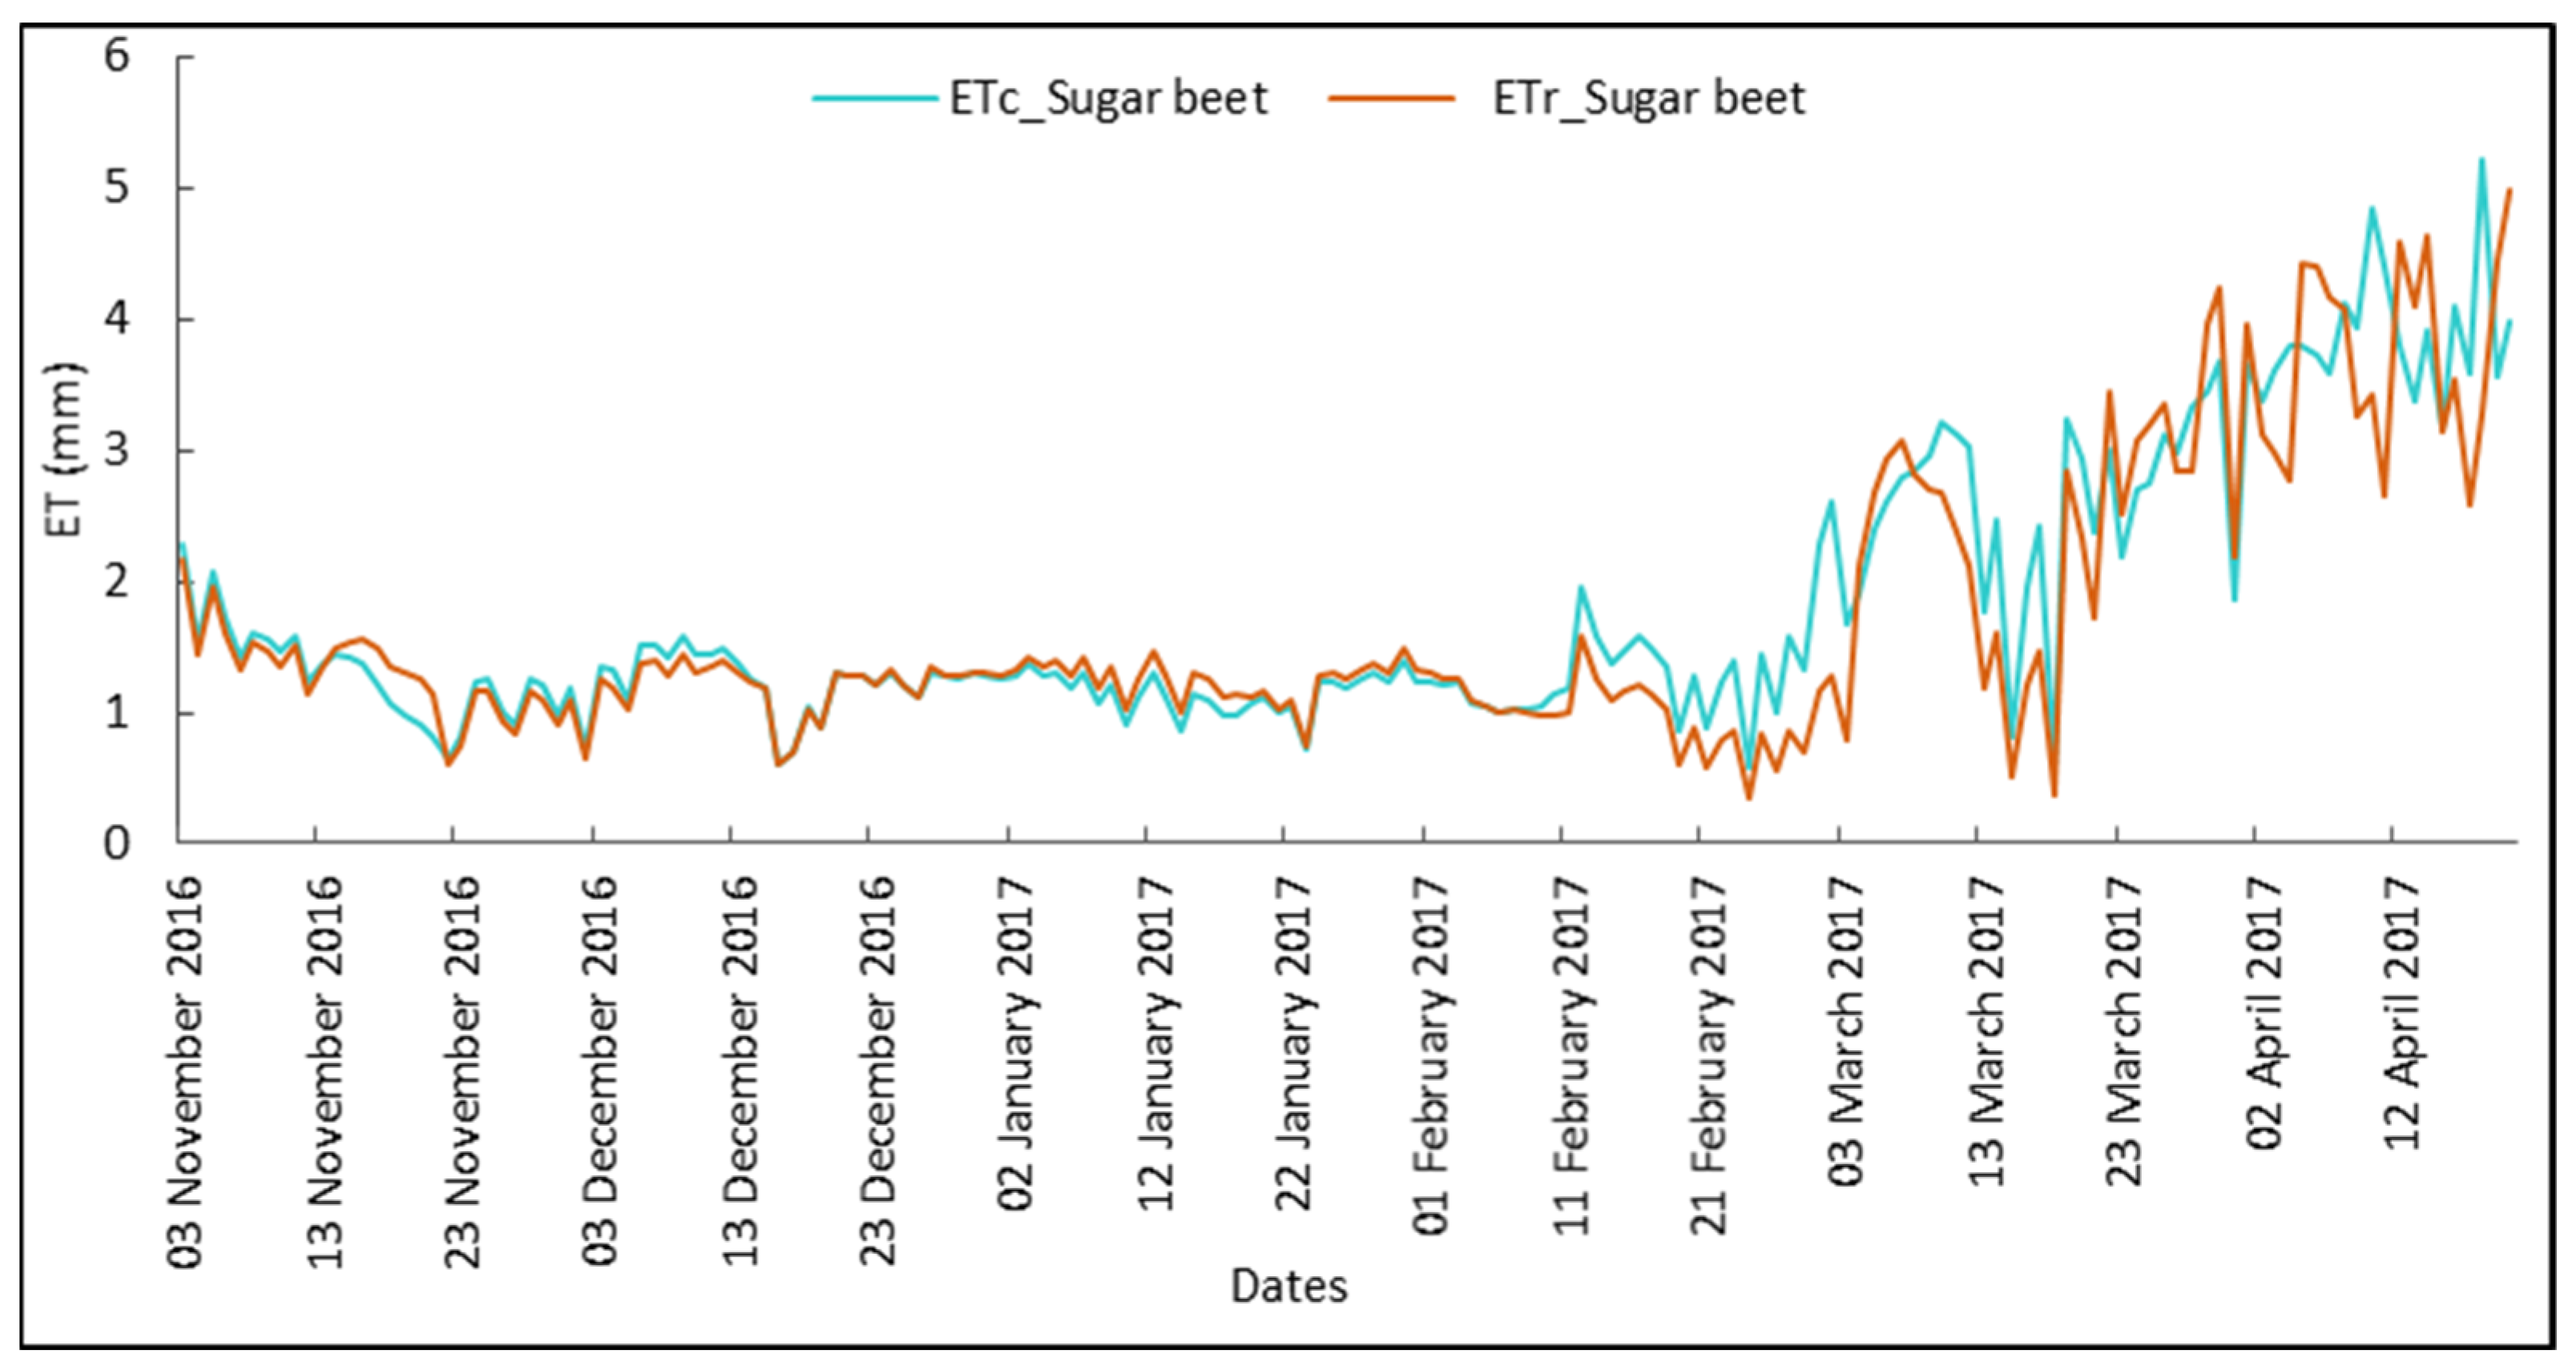
3.2. Crop Water Requirements under Real Agronomic Conditions

In order to estimate the water requirements of the crops in real conditions, five pilot parcels were chosen (Figure 1), including one citrus parcel and six mixed parcels. These parcels were selected in consultation with the ORMVAT office (Regional Office of Agricultural Development of Tadla) based on the availability of irrigation data and accessibility to these parcels during field visits.
The use of real daily data of the irrigation volumes of each parcel in the water balance modeling allowed us to estimate the real water requirements of the different crops.
The period for the estimation of crop water requirements differs due to the life cycle of each crop. Citrus fruits are inter-annual crops, in contrast to annual crops such as sugar beets and cereals. The choice of estimation dates for sugar beets and cereals depends on the grubbing-up period and the senescence phase, respectively. Table 2 shows the water requirements per hectare for the different crops in the study area.
In order to evaluate the efficiency of the water supply in the study area, a comparison of the water requirements, estimated with the SAMIR tool for five parcels (Figure 1), was made with the irrigation data provided by the ORMVAT office and the rainfall during the first quarter of the year 2017 (1 January 2017–31 March 2017) (Figure 11). In all cases, an overexploitation of irrigation water resources was noted with the traditional method of irrigation management used, and that a significant amount of water could be conserved if the proposed remote sensing method were to be used. This demonstrates the need to adopt integrated irrigation management to combat water resource depletion in the region.
The objective of this study was to evaluate the potential of Sentinel-2 satellite data in estimating crop water requirements based on the dual approach of FAO-56. The result of this study showed the importance of new technologies in the management of irrigation water by estimating the water requirements of crops. Farmers in the Tadla plain use traditional methods of irrigation, which causes the loss of large quantities of water that Morocco needs. This study allowed us to produce maps of water requirements of different crops with a daily, monthly, or seasonal time step in the irrigated perimeter of Tadla, using tools that are free and open-source.
Kharrou et al. [44] compared the water demand estimated by remote sensing and irrigation water at the parcel scale in an irrigated perimeter of the Haouz plain in Morocco. The comparison showed a large spatio-temporal variability in irrigation water demand and supply. The total amount of irrigation water simulated by the model (359 mm) was 30% less than the observed amount (512 mm), indicating an applied irrigation higher than the observed ET, revealing over-irrigation and the fact that the excess amount was probably lost by deep percolation; this finding coincides with our results presented in Figure 11 and Figure 12, where we found that there was water loss.
This could be attributed to inadequate irrigation supply and/or socio-economic considerations and farmer management practices. Their results also demonstrate the potential for irrigation managers to use remote sensing-based models to monitor irrigation water use for the efficient and sustainable use of water resources.
Saadi et al. [45] also worked on the estimation of irrigation water requirements, using a time series of high-resolution NDVI images from the Spot satellite in the Kairouan plain in Tunisia. In their work, they used the dual approach of FAO-56 with the SAMIR tool. For the whole agricultural season, they found that the modeled irrigation volumes at the perimeter were close to the observed volumes (135 and 121 mm, respectively, with an overestimation of 11.5%). This overestimation of irrigation was observed during the month of November and may be due to an error in the initialization of the soil water content parameters.

3.3. Comparison between ETr and ETc

The comparison between ETr and ETc allows to determine the periods of water loss (excess water) and water stress. During periods of water stress, ETr values are lower than ETc values, which means that the plant needs a water supply. Figure 12 shows the comparison between ETc and ETr in the study area during the 2016–2017 agricultural season for citrus crops. The comparison showed that during the period from 11 March 2016 to 4 February 2017, ETc was almost equal to ETr, which means that the plant had a normal development. Starting from April, the variations between ETc and ETr began to increase, showing a lot of periods of stress and water loss, which required an adjustment of the water supply during this period.
Figure 13 illustrates the comparison between ETc and ETr during the 2016–2017 agricultural season for sugar beets. The analysis of their temporal curves showed that the period from 11 March 2016 to 13 February 2017 was less critical for the plant, where ETc was almost equal to ETr, except for some short periods of very low water stress. Overall, during this period, the plant was considered to be in normal and good growth conditions. In contrast, the sugar beet encountered a long period of water stress between 2 November 2017 and 13 March 2017. After this severe period, the plant went through fluctuating conditions, between water stress and over supply. This can be explained by an alternation of dry days and irrigation days, which proves the need for a proactive irrigation scheduling based on temporal monitoring in order to avoid late irrigation, where the decision to irrigate is made after dry days or after the appearance of signs of water stress on the plant. This is the case in most of the irrigated perimeters in Morocco, where the agriculture is intensive, and the irrigation time is determined in a subjective way.
Concerning the cereals, the analysis of Figure 14 shows that the simulation of the ETr was well-aligned over time with the variations of the ETc, except for the period from 1 February 2017 to 17 January 2017, which showed significant water stress. By contrast, there was an excess of water for almost two months, starting from mid-April. This may be due to the senescence phase of the cereals and the decrease in chlorophyll activity.
Figure 15 shows the comparison between ETc and ETr for the alfalfa crop; the analysis of their curves showed that during the period between 18 March 2016 and 17 May 2017, the ETc was almost equal to the ETr, indicating a long normal period of development for the alfalfa. However, a few critical periods were noticed, including a slight water deficit during the first half of November and a slight excess of water from 5 September 2017 to the end of the season. This water loss in the end of the season was related to over-irrigation activity, which implies that a more effective irrigation management is needed for alfalfa.

4. Conclusions

The FAO-56 dual approach is commonly used for irrigation management and to estimate evapotranspiration at the parcel scale. The latter is determined by combining Sentinel-2 satellite data with meteorological data. The main crop types considered in this study were: cereals, sugar beets, alfalfa, citrus fruits, and olive trees (Figure 16). The combination of satellite and meteorological data allowed us to spatialize the evapotranspiration over the study area during the 2016/2017 agricultural season, using the dual approach of the FAO-56 model, based on the reference evapotranspiration, ET0, the basal crop coefficient, Kcb, and the water stress coefficient, Ks.
The estimation of water requirements was performed according to two methods.
  • The first method consists of determining the water requirements under optimal agronomic conditions (without consideration of water stress, diseases, or weeds) for each crop with a seasonal or monthly time step and a spatial resolution of 10 m. The maps produced by this method showed that alfalfa is the most water intensive crop, followed by sugar beets. The demands for alfalfa are more and more important during the months of April, May, and June because of the higher chlorophyll activity and the increase in temperature.
  • The second method consists of determining the water requirements under real agronomic conditions (including water stress). A comparison was made between the water inputs (irrigation and rain) for five parcels, with the estimated water requirements made by the SAMIR tool. For the five plots, there was almost 10,000 m3 of difference between the water inputs by irrigation and rain and the estimated requirements. Irrigation and rainwater inputs generally exceed crop water requirements, which means that water is lost.
Considering that Morocco is among the countries that suffer from drought caused by climate change, it will be essential to use new technologies for water management, such as the estimation of crop water needs by satellite data or by drones; furthermore, setting up a better irrigation scheduling strategy in the irrigated perimeter of Tadla will allow to save important quantities of water and, subsequently, to protect groundwater resources, out of concern for sustainability.

Author Contributions

Conceptualization, J.E.H. and A.E.H.; data curation, J.E.H.; formal analysis, M.C.; investigation, J.E.H.; methodology, J.E.H. and J.-E.O.; project administration, A.E.H.; resources, A.J.; software, J.E.H.; supervision, M.C.; validation, J.E.H., A.E.H. and R.L.; visualization, A.E.H. and R.L.; writing—original draft, J.E.H.; writing—review and editing, R.L. All authors have read and agreed to the published version of the manuscript.

Funding

This research received no external funding.

Data Availability Statement

Not applicable.

Acknowledgments

The authors thank the Faculty of Sciences and Techniques of Béni-Mellal for its financial and logistical support. In addition, many thanks to ESA for providing the S-2 data free of charge. Similarly, special thanks are addressed to ORMVAT (Office Régional de Mise en Valeur Agricole du Tadla) for its continuous assistance during the field work and for providing several data.

Conflicts of Interest

The authors declare no conflict of interest.

References

  1. Bleu, P. Eau et changement climatique: Quelle stratégie d’adaptation en Méditerranée. Les Notes Du Plan Bleu 2012, 23. [Google Scholar]
  2. Alexandris, S.; Psomiadis, E.; Proutsos, N.; Philippopoulos, P.; Charalampopoulos, I.; Kakaletris, G.; Papoutsi, E.-M.; Vassilakis, S.; Paraskevopoulos, A. Integrating Drone Technology into an Innovative Agrometeorological Methodology for the Precise and Real-Time Estimation of Crop Water Requirements. Hydrology 2021, 8, 131. [Google Scholar] [CrossRef]
  3. Makkink, G. Testing the Penman formula by means of lysimeters. J. Inst. Water Eng. 1957, 11, 277–288. [Google Scholar]
  4. Fernández, J.; Palomo, M.; Dıaz-Espejo, A.; Clothier, B.; Green, S.; Girón, I.; Moreno, F. Heat-pulse measurements of sap flow in olives for automating irrigation: Tests, root flow and diagnostics of water stress. Agric. Water Manag. 2001, 51, 99–123. [Google Scholar] [CrossRef]
  5. Burgess, S.S.; Adams, M.A.; Turner, N.C.; Beverly, C.R.; Ong, C.K.; Khan, A.A.; Bleby, T.M. An improved heat pulse method to measure low and reverse rates of sap flow in woody plants. Tree Physiol. 2001, 21, 589–598. [Google Scholar] [CrossRef] [PubMed]
  6. Edwards, W.; Becker, P.; Èermák, J. A unified nomenclature for sap flow measurements. Tree Physiol. 1997, 17, 65–67. [Google Scholar] [CrossRef]
  7. Granier, A. A new method of sap flow measurement in tree stems. Ann. Sci. 1985, 42, 193–200. [Google Scholar] [CrossRef]
  8. Sakuratani, T. A heat balance method for measuring water flux in the stem of intact plants. J. Agric. Meteorol. 1981, 37, 9–17. [Google Scholar] [CrossRef]
  9. Running, S.W.; Baldocchi, D.; Turner, D.; Gower, S.T.; Bakwin, P.; Hibbard, K. A global terrestrial monitoring network integrating tower fluxes, flask sampling, ecosystem modeling and EOS satellite data. Remote Sens. Environ. 1999, 70, 108–127. [Google Scholar] [CrossRef]
  10. Bowen, I.S. The ratio of heat losses by conduction and by evaporation from any water surface. Phys. Rev. 1926, 27, 779. [Google Scholar] [CrossRef]
  11. Green, A.E.; Green, S.R.; Astill, M.S.; Caspari, H.W. Estimation latent heat flux form a vineyard using scintillometry. Terr. Atmos. Ocean. Sci. 2000, 11, 525–542. [Google Scholar] [CrossRef]
  12. Allen, R.G.; Pereira, L.S.; Raes, D.; Smith, M.J.F.; FAO. Crop evapotranspiration-Guidelines for computing crop water requirements. FAO Irrig. Drain. Pap. 1998, 300, D05109. [Google Scholar]
  13. Pereira, L.; Paredes, P.; López-Urrea, R.; Hunsaker, D.; Mota, M.; Shad, Z.M. Standard single and basal crop coefficients for vegetable crops, an update of FAO56 crop water requirements approach. Agric. Water Manag. 2021, 243, 106196. [Google Scholar] [CrossRef]
  14. Allen, R.; Pereira, L.; Howell, T.; Jensen, M. Evapotranspiration information reporting: I Requirements for accuracy in measurement. Agric. Water Manag. 2011, 98, 899–920. [Google Scholar] [CrossRef]
  15. Er-Raki, S.; Chehbouni, A.; Guemouria, N.; Duchemin, B.; Ezzahar, J.; Hadria, R. Combining FAO-56 model and ground-based remote sensing to estimate water consumptions of wheat crops in a semi-arid region. Agric. Water Manag. 2007, 87, 41–54. [Google Scholar] [CrossRef]
  16. Pereira, L.S.; Paredes, P.; López-Urrea, D.; Jovanovic, N. Updates and advances to the FAO56 crop water requirements method. Agric. Water Manag. 2021, 248, 106697. [Google Scholar] [CrossRef]
  17. Allam, M.; Mhawej, M.; Meng, Q.; Faour, G.; Abunnasr, Y.; Fadel, A.; Xinli, H. Monthly 10-m evapotranspiration rates retrieved by SEBALI with Sentinel-2 and MODIS LST data. Agric. Water Manag. 2021, 243, 106432. [Google Scholar] [CrossRef]
  18. Nhamo, L.; Ebrahim, G.Y.; Mabhaudhi, T.; Mpandeli, S.; Magombeyi, M.; Chitakira, M.; Magidi, J.; Sibanda, M. An assessment of groundwater use in irrigated agriculture using multi-spectral remote sensing. Phys. Chem. Earth Parts A/B/C 2020, 115, 102810. [Google Scholar] [CrossRef]
  19. Hdoush, A.A.-A. Water requirements for irrigated crops in semi-arid region in Jordan using sentinel satellite images. Phys. Chem. Earth Parts A/B/C 2020, 122, 102949. [Google Scholar] [CrossRef]
  20. Makaya, N.P.; Mutanga, O.; Kiala, Z.; Dube, T.; Seutloali, K.E. Assessing the potential of Sentinel-2 MSI sensor in detecting and mapping the spatial distribution of gullies in a communal grazing landscape. Phys. Chem. Earth Parts A/B/C 2019, 112, 66–74. [Google Scholar] [CrossRef]
  21. Andreu, A.; Dube, T.; Nieto, H.; Mudau, A.E.; González-Dugo, M.P.; Guzinski, R.; Hülsmann, S. Remote sensing of water use and water stress in the African savanna ecosystem at local scale–Development and validation of a monitoring tool. Phys. Chem. Earth Parts A/B/C 2019, 112, 154–164. [Google Scholar] [CrossRef]
  22. Aahd, A.; le Page, M.; Simonneaux, V.; Er-Rakki, S.; Kharrou, H.; Berjamy, B.; Chehbouni, G.J.P.P. Estimation de l’évapotranspiration au niveau de la Plaine du Haouz au Maroc par utilisation d’une série d’images de moyenne résolution 2000–2009. Preface/Préface 2012, 20. [Google Scholar]
  23. Ma, Z.; Wu, B.; Yan, N.; Zhu, W.; Xu, J. Coupling water and carbon processes to estimate field-scale maize evapotranspiration with Sentinel-2 data. Agric. For. Meteorol. 2021, 306, 108421. [Google Scholar] [CrossRef]
  24. Bellvert, J.; Jofre-Ĉekalović, C.; Pelechá, A.; Mata, M.; Nieto, H. Feasibility of using the two-source energy balance model (TSEB) with Sentinel-2 and Sentinel-3 images to analyze the spatio-temporal variability of vine water status in a vineyard. Remote Sens. 2020, 12, 2299. [Google Scholar] [CrossRef]
  25. Vanino, S.; Nino, P.; de Michele, C.; Bolognesi, S.F.; D’Urso, G.; di Bene, C.; Pennelli, B.; Vuolo, F.; Farina, R.; Pulighe, G. Capability of Sentinel-2 data for estimating maximum evapotranspiration and irrigation requirements for tomato crop in Central Italy. Remote Sens. Environ. 2018, 215, 452–470. [Google Scholar] [CrossRef]
  26. Guzinski, R.; Nieto, H. Evaluating the feasibility of using Sentinel-2 and Sentinel-3 satellites for high-resolution evapotranspiration estimations. Remote Sens. Environ. 2019, 221, 157–172. [Google Scholar] [CrossRef]
  27. Amri, R.; Zribi, M.; Lili-Chabaane, Z.; Szczypta, C.; Calvet, J.; Boulet, G. FAO-56 Dual Model Combined with Multi-Sensor Remote Sensing for Regional Evapotranspiration Estimations. Remote Sens. 2014, 6, 5387–5406. [Google Scholar] [CrossRef]
  28. Belaqziz, S.; Khabba, S.; Er-Raki, S.; Jarlan, L.; le Page, M.; Kharrou, M.; El Adnani, M.; Chehbouni, A. A new irrigation priority index based on remote sensing data for assessing the networks irrigation scheduling. Agric. Water Manag. 2013, 119, 1–9. [Google Scholar] [CrossRef]
  29. Elnmer, A.; Khadr, M.; Kanae, S.; Tawfik, A. Mapping daily and seasonally evapotranspiration using remote sensing techniques over the Nile delta. Agric. Water Manag. 2019, 213, 682–692. [Google Scholar] [CrossRef]
  30. Er-Raki, S.; Chehbouni, A.; Duchemin, B. Combining satellite remote sensing data with the FAO-56 dual approach for water use mapping in irrigated wheat fields of a semi-arid region. Remote Sens. 2010, 2, 375–387. [Google Scholar] [CrossRef]
  31. Kullberg, E.G.; DeJonge, K.C.; Chávez, J.L. Evaluation of thermal remote sensing indices to estimate crop evapotranspiration coefficients. Agric. Water Manag. 2017, 179, 64–73. [Google Scholar] [CrossRef]
  32. Newton, I.H. Remote Sensing Based Estimates of Reference Evapotranspiration for the Southwest Region of Bangladesh; Bangladesh University of Engineering and Technology (BUET): Dhaka, Bangladesh, 2018. [Google Scholar]
  33. El Hachimi, J.; El Harti, A.; Ouzemou, J.-E.; Lhissou, R.; Chakouri, M.; Jellouli, A. Assessment of the benefit of a single sentinel-2 satellite image to small crop parcels mapping. Geocarto Int. 2021, 1–17. [Google Scholar] [CrossRef]
  34. Lin, S.; Li, J.; Liu, Q.; Li, L.; Zhao, J.; Yu, W.J.R.S. Evaluating the effectiveness of using vegetation indices based on red-edge reflectance from Sentinel-2 to estimate gross primary productivity. Remote Sens. 2019, 11, 1303. [Google Scholar] [CrossRef]
  35. Huete, A.R.J.G.C. Vegetation indices, remote sensing and forest monitoring. Geogr. Compass 2012, 6, 513–532. [Google Scholar] [CrossRef]
  36. Jackson, R.; Idao, S.; Reginato, R.; Pinter, P. Remotely Sensed Crop Temperatures and Reflectances as Inputs to Irrigtion Scheduling; American Association of Agricultural Engineers: New York, NY, USA, 1980. [Google Scholar]
  37. Rouse, J.; Haas, R.; Schell, J.; Deering, D. Monitoring vegetation systems in the Great Plains with ERTS. NASA Spec. Publ. 1974, 351, 309. [Google Scholar]
  38. Lhissou, R.; El Harti, A.; Chokmani, K. Mapping soil salinity in irrigated land using optical remote sensing data. Eurasian J. Soil Sci. 2014, 3, 82. [Google Scholar] [CrossRef]
  39. El Harti, A.; Lhissou, R.; Chokmani, K.; Ouzemou, J.-E.; Hassouna, M.; Bachaoui, E.M.; El Ghmari, A. Spatiotemporal monitoring of soil salinization in irrigated Tadla Plain (Morocco) using satellite spectral indices. Int. J. Appl. Earth Obs. Geoinf. 2016, 50, 64–73. [Google Scholar] [CrossRef]
  40. Allen, R.G.; Jensen, M.E.; Wright, J.L.; Burman, R.D. Operational estimates of reference evapotranspiration. Agron. J. 1989, 81, 650–662. [Google Scholar] [CrossRef]
  41. Saadi, S.; Todorovic, M.; Tanasijevic, L.; Pereira, L.S.; Pizzigalli, C.; Lionello, P. Climate change and Mediterranean agriculture: Impacts on winter wheat and tomato crop evapotranspiration, irrigation requirements and yield. Agric. Water Manag. 2015, 147, 103–115. [Google Scholar] [CrossRef]
  42. Simonneaux, V.; Duchemin, B.; Helson, D.; Er-Raki, S.; Olioso, A.; Chehbouni, A.G. The use of high-resolution image time series for crop classification and evapotranspiration estimate over an irrigated area in central Morocco. Int. J. Remote Sens. 2008, 29, 95–116. [Google Scholar] [CrossRef]
  43. Simonneaux, V.; le Page, M.; Helson, D.; Metral, J.; Thomas, S.; Duchemin, B.; Cherkaoui, M.; Kharrou, H.; Berjami, B.; Chehbouni, G. Estimation spatialisée de l’Evapotranspiration des cultures irriguées par télédétection. Application à la gestion de l’Irrigation dans la plaine du Haouz (Marrakech, Maroc). Sci. Changements Planétaires/Sécheresse 2009, 20, 123–130. [Google Scholar] [CrossRef]
  44. Kharrou, M.H.; Simonneaux, V.; Er-Raki, S.; le Page, M.; Khabba, S.; Chehbouni, A. Assessing irrigation water use with remote sensing-based soil water balance at an irrigation scheme level in a semi-arid region of Morocco. Remote Sens. 2021, 13, 1133. [Google Scholar] [CrossRef]
  45. Saadi, S.; Simonneaux, V.; Boulet, G.; Raimbault, B.; Mougenot, B.; Fanise, P.; Ayari, H.; Lili-Chabaane, Z. Monitoring irrigation consumption using high resolution NDVI image time series: Calibration and validation in the Kairouan Plain (Tunisia). Remote Sens. 2015, 7, 13005–13028. [Google Scholar] [CrossRef]
Figure 1. Location of the study area with Sentinel-2A images as a basemap.
Agriculture 12 01168 g001
Figure 2. Variation of ET0 and average daily temperature (Tavg) during the 2016/2017 agricultural season.
Agriculture 12 01168 g002
Figure 3. Flowchart of the methodology used.
Agriculture 12 01168 g003
Figure 4. Evolution of the cultural coefficient, Kc, during the growth stages of the crop [12].
Agriculture 12 01168 g004
Figure 5. The flowchart of the methodology used for crop type mapping.
Agriculture 12 01168 g005
Figure 6. Spectral profiles of NDVI time series for the main crop types: (A) cereals; (B) sugar beets; (C) alfalfa; (D) citrus fruits and olives.
Agriculture 12 01168 g006
Figure 7. Crop type map of the study area.
Agriculture 12 01168 g007
Figure 8. Accuracy assessment of SVM classification.
Agriculture 12 01168 g008
Figure 9. Crop water requirements during the 2016–2017 agricultural season in the study area.
Agriculture 12 01168 g009
Figure 10. Monthly water requirements during the 2016/2017 agricultural season.
Agriculture 12 01168 g010
Figure 11. Comparison between water requirements and irrigation water supplies.
Agriculture 12 01168 g011
Figure 12. Comparison between ETc and ETr for citrus fruits.
Agriculture 12 01168 g012
Figure 13. Comparison between ETc and ETr for sugar beet crops.
Agriculture 12 01168 g013
Figure 14. Comparison between ETc and ETr for cereal crops (wheat and barley).
Agriculture 12 01168 g014
Figure 15. Comparison between ETc and ETr for alfalfa crops.
Agriculture 12 01168 g015
Figure 16. Pictures of some crops during the field survey.
Agriculture 12 01168 g016
Table 1. Sentinel-2A image acquisition dates.
ImagesAcquisition DatesSensor
13 November 2016Sentinel-2A
213 December 2016Sentinel-2A
323 December 2016Sentinel-2A
42 January 2017Sentinel-2A
512 January 2017Sentinel-2A
61 February 2017Sentinel-2A
730 March 2017Sentinel-2A
82 May 2017Sentinel-2A
91 June 2017Sentinel-2A
1021 June 2017Sentinel-2A
Table 2. Seasonal accumulation of crop water requirements.
Crop TypeEstimation AreaEstimation PeriodWater Requirements in (m3)
Citrus1 ha3 November 2016–1 July 20173657
Sugar beets1 ha3 November 2016–20 April 20172766
Alfalfa1 ha3 November 2016–1 July 20175126
Cereals1 ha1 December 2016–20 May 20173110
Publisher’s Note: MDPI stays neutral with regard to jurisdictional claims in published maps and institutional affiliations.

