Article

Climate Shocks, Household Resource Allocation, and Vulnerability to Poverty

School of Business Administration, Zhongnan University of Economics and Law, Wuhan 430073, China
*
Author to whom correspondence should be addressed.
Agriculture 2022, 12(7), 971; https://doi.org/10.3390/agriculture12070971
Submission received: 10 June 2022 / Revised: 26 June 2022 / Accepted: 29 June 2022 / Published: 6 July 2022
(This article belongs to the Special Issue Ecological Restoration and Rural Economic Development)

Abstract

:
Climate change is widespread, rapid, and is intensifying. Using Chinese disaster data and the China Family Panel Studies (CFPS) data, this study examines the impact of climate shocks on the vulnerability of farm households to poverty and the mechanism of household resource allocation in this process. The results show that (a) climate shocks can significantly increase the poverty vulnerability of farm households. (b) The effect of climate shocks on farm household poverty vulnerability is regionally and individually heterogeneous. Climate non-security zones, risk-averse farmers, and low social capital farmers are more vulnerable to climate shocks and fall into poverty. (c) The mediating effects suggest that climate shocks affect the poverty vulnerability of farm households by influencing their developmental investment, productive investment, and precautionary saving. The paper finally concludes and discusses some policy implications in the national response to climate change and transformation of farmers’ livelihoods.

1. Introduction

The climate has imposed varied environmental constraints on humanity for millennia [1]. It is one of the most frequently cited drivers of food insecurity, as it is both a transient shock and a potential and persistent problem [2]. In recent years, climate change has been widespread, rapid, and increasing in severity, with a significant increase in the frequency and intensity of extreme heat events, oceanic heat waves, and heavy rains (IPCC, Geneva, Switzerland, 2021) [3]. These issues increase income uncertainty, affect people’s expectations, decision-making, health, and well-being, and even lead to conflict and riots [4,5,6,7]. Once again, we are reminded that something must be done to solve this problem. While some areas have benefited from climate change (e.g., at high, middle, and high latitudes), most areas have been adversely affected by changes in weather, especially those who rely primarily on agricultural gains. Climate shocks can cause significant losses to farmers’ livelihood assets, significant changes to their lifestyles, and have adverse impacts on sustained incomes [8,9,10]. China is located in a monsoon climate zone with the fastest global environmental change. The climate conditions vary greatly from year to year [11]. In this context, climate shocks can reverse past poverty reduction achievements and hinder future poverty reduction efforts. Without appropriate participatory governance strategies, climate shocks may run counter to poverty reduction efforts and exacerbate the marginalization of vulnerable farmers.
There is no doubt that the majority of the poor live in rural areas and that the main economic activity is based on agriculture, which is dependent on natural resources for its livelihood and whose fate is inextricably linked to the fate of agriculture [12,13]. Increased extreme weather events and unpredictable weather patterns have affected agriculture and food security, leading to lower yields and incomes in vulnerable areas. This is because agriculture relies heavily on the natural climate. High temperatures and water shortages can inhibit crop growth, reduce yields, and even lead to crop failure. [14,15]. In the long run, climate change also affects soil quality and the natural communities on which agricultural production depends, and indirectly affects the price of food and the household income of farmers [16,17]. Several studies have also confirmed this, with Dercon et al. (2005) using data from rural Ethiopia, finding that drought has a significant impact on the impairment of individual assets and the decline in consumption [18]. Nguyen et al. (2021) further confirmed the impact of climate shocks on household income, investment, and poverty, using data from rural household surveys in north-eastern Thailand and central Vietnam [19].
Farmers are naturally sensitive to natural disasters, and the lack of stable expectations for their land tends to affect farmers’ motivation to invest in their land, and thus farmers choose low-risk production methods, which leads to a decline in agricultural performance and long-term depression of agricultural productivity [20]. It may be due to the fact that the strategic response of farmers to external changes such as climate is not fully explained by profit maximization considerations, but also by risk preferences, social capital, and neighborhood effects [21,22]. It is of great practical significance to explore the impact and mechanism of climate change on farmers’ poverty and to explore farmers’ countermeasures against climate change for stabilizing agricultural production, ensuring food security, reducing poverty, and other tasks (FAO, Rome, Italy, 2012) [23].
While much remains to be done in this regard, we can draw preliminary conclusions about the possible impact of climate change and its related policies on agriculture and the resulting poverty effects. However, apart from the economic losses caused by climate change to farm households, the analysis of the impact of climate shocks on vulnerability to poverty from the perspective of household resource allocation to farm households is often neglected. Therefore, this study (a) provides a comprehensive analysis of the current situation of climate shocks and its vulnerability to poverty of farm households in China based on macro data and a large sample of farm household survey data; (b) estimates the impact of climate shocks on vulnerability to poverty of farm households based on econometric causal identification methods; (c) estimates heterogeneity in the impact of climate shocks on the vulnerability to poverty of farm households; and (d) verifies the mediating role of developmental investment, productive investment, and precautionary saving between climate shocks and vulnerability to poverty of farm households.
The remainder of the paper is structured as follows: Section 1 presents some background information and provides supporting evidence that climate shocks may increase vulnerability to poverty; Section 2 presents the data and model setting; Section 3 presents our main results; Section 4 presents our discussion; and the Section 5 concludes.

2. Materials and Methods

2.1. Research Sample

The samples of this study are derived from two types of databases, macro-level and micro-level. This paper also effectively matches its micro-level individual data with the macro-level climate shocks data. Considering that there may be a lag in the impact of climate shocks on farm households’ decision making, this paper examines the impact of climate shocks in 2016 on farm households’ poverty vulnerability in 2017. The details are described as follows.
Macro-level climate data. Data are from the 2014, 2015, and 2016 Statistical Yearbook of the Environment of China and the Statistical Yearbook of China. The main data are based on the total GDP of all provinces and economic losses caused by extreme weather, including drought, flood, low-temperature and freezing, storms, and marine disasters. The National Meteorological Administration (NMA) has put floods, droughts, freezing disasters (mainly frost disasters), and winds as the most important meteorological disasters, and the NBS Poverty Monitoring Survey (NMS) also lists and counts these disasters separately. It can be found that there is a strong correlation between climate shocks and economic losses [24].
Considering the reasonableness and possibility of both research needs and available data, this paper selects the above index of natural disaster damage as a proportion of GDP to measure the impact of climate shocks throughout the year by referring to the disaster intensity index and the method of Xu Xian et al. (2021) [25]. The use of relative values rather than absolute values is useful for measuring the impact of disaster losses on different regions in a localized manner. Of course, the relationship between climate shocks and agricultural productive investment will also be tested for robustness using absolute loss values caused by climate shocks. Compared with the previous literature, the microscopic data used in this paper cover a wider range and are representative at the national level.
Micro-level farm household survey data. These data come from the China Family Panel Studies (CFPS) of Peking University, which covers 25 provinces in mainland China, and uses a three-stage unequal-probability whole-group sampling design with good representativeness and timeliness. This paper mainly uses the CFPS2018 data released in 2020, and only retains the sample of rural areas still engaged in agricultural production activities in that year. Excluding some samples with missing core variables, the effective information of 23 provinces, 109 counties, and 249 villages, with a total of 2790 farm households.

2.2. Methods

2.2.1. Poverty Vulnerability Measure

According to the consensus definition of vulnerability in the report of the Intergovernmental Panel on Climate Change on managing the risks of extreme events and disasters to advance climate change adaptation, vulnerability is defined as the propensity of individuals and households to be adversely affected by climate and other environmental shocks and stresses (IPCC, 2012) [26]. In this paper, we refer to the vulnerability as expected poverty indicator (VEP) of poverty based on the definition of expected poverty proposed by Chaudhuri et al. (2002) for poverty measurement [27]. This measure is more dynamic and forward-looking than Vulnerability as Low Expected Utility (VEU) and Vulnerability as Uninsured Exposure to Risk (VER). In addition, this method is also applicable to cross-sectional data, which can effectively alleviate the problem of insufficient data accumulation in developing countries [28].
The basic principle of this method is as follows. First, income is regressed on observable variables and shocks to obtain an expression for future income, then the logarithm of income is assumed to follow a normal distribution, and finally the probability of future income falling below a certain value (usually the poverty line) is calculated, and this probability is referred to as the vulnerability line. That is, a rural household is defined as having poverty vulnerability if the probability of future poverty exceeds a set vulnerability line.
Under the definition of VEP, this paper first calculates the fitted values and residual squares by constructing regression equations. Controlling for the main variables affecting rural household income per capita such as household head characteristics, household characteristics, village level characteristics, the farm household income equation, and the residual equation are estimated with household income per capita as the explanatory variable [29].
l n Y i , t = 0 + i X i , t + ε i
where l n Y i , t denotes the income of the ith household at period t, and X i , t is a set of characteristic variables affecting household income, and to control for inter-regional fixed effects, we also include in the analysis the district and landscape characteristic variables expressed as dummy variables. ε i is a random error term.
Next, the expected value and variance of log income are estimated as follows.
E   ( l n Y i / X i ) = β F G L S X i
V   ( l n Y i / X i ) = ρ F G L S X i
where E   ( l n Y i / X i ) denotes the expected value of the logarithm of future per capita income of the farm household. V   ( l n Y i / X i ) denotes the method of the log per capita income of the farm household, the, β F G L S and ρ F G L S denote the corresponding fitted values obtained, respectively.
Finally, assuming that income follows a log-normal distribution, the vulnerability calculation can be expressed as the following equation:
V u l i = Prob   ( l n Y i l n p o o r ) =   ( l n p o o r E   ( l n Y i / X i ) V   ( l n Y i / X i ) )

2.2.2. Benchmark Model

Climate shocks are mostly exogenous and difficult to control (See Table 1). Therefore, to improve the credibility of the fitted regressions, this paper introduces a series of control variables with reference to the established literature, including household head characteristics (education level, health status, etc.), family characteristics (number of labor force, income, etc.), and village characteristics (e.g., village infrastructure, distance from the county). The definitions and descriptive statistics of the relevant variables are shown in Table 2. The baseline regression model is shown in Equation (5).
V u l i = α 0 + c 1 i C S + α 1 i X i + μ 1 i
where V u l i is the poverty vulnerability of farm households, C S i is the climate shocks index, X i is a set of control variables, and μ 1 i is a random disturbance term. The first concern of this study is the coefficient c 1 i of C S , the impact of climate shocks index on the poverty vulnerability of farm households.

2.2.3. Mediating Effects Model

Climate shocks can affect households’ economic decisions [30]. Therefore, we focus on the impact of climate shocks on household developmental investment, productive investment, and precautionary saving (See Figure 1). Specifically, with reference to existing studies, developmental investment refers to the total amount of human capital investment such as education and training, health insurance, culture, and recreation [31]. Productive investment is the investment in agricultural production such as seeds, fertilizers, pesticides, and irrigation costs spent during the year. Precautionary saving is the sum of savings, insurance, etc., owned by the farmer in the current year [32]. To further analyze the pathways of the role of climate change in influencing the expected poverty vulnerability of farm households, this paper uses a causal stepwise regression method through mediating effects, as shown below.
M e d = β 0 + β 1 C S + β 2 X i + μ 2 i
V u l i = γ 0 + γ 1 C S + γ 2 M e d + γ 3 X i + μ 3 i
where M e d denotes the mediating variable, β 1 denotes the effect of climate shocks on the mediating variable, γ 2 denotes the effect of the mediating variable on poverty vulnerability, and μ 2 i and μ 3 i are random disturbance terms.

3. Results

3.1. Descriptive Statistics

3.1.1. Climate Shock Index by Province (2014–2016)

The climate shock index is a number greater than or equal to 0. The larger the value, the more serious the climate shock in the province, and the closer the value is to 0 means the climate shock is very small or even negligible. Table 1 shows the measurements of the climate shock index for each province from 2014 to 2016. In 2016, for example, we can see that the top five climate shock indexes, Shanghai (0.001), Tianjin (0.020), Beijing (0.065), Shandong (0.107), and Guangxi (0.150), are mainly provinces with low actual losses caused by climate shocks or high GDP levels leading to strong risk resistance. Fujian (1.644), Hebei (1.930), Hainan (1.955), Anhui (2.311), and Hubei (2.564) ranked in the bottom five. These provinces are mainly caused by high disaster losses, but the actual losses in Hainan are not high. This is due to its low GDP and weak risk tolerance. Data from 2014–2016 show that the climate shock index varies from year to year. Some provinces, such as Hainan, even showed significant differences in 2014 (5.068) and 2015 (0.384), mainly due to the rare climatic disasters suffered by Hainan in 2014, which fully illustrated the uncertainty of climate shocks.

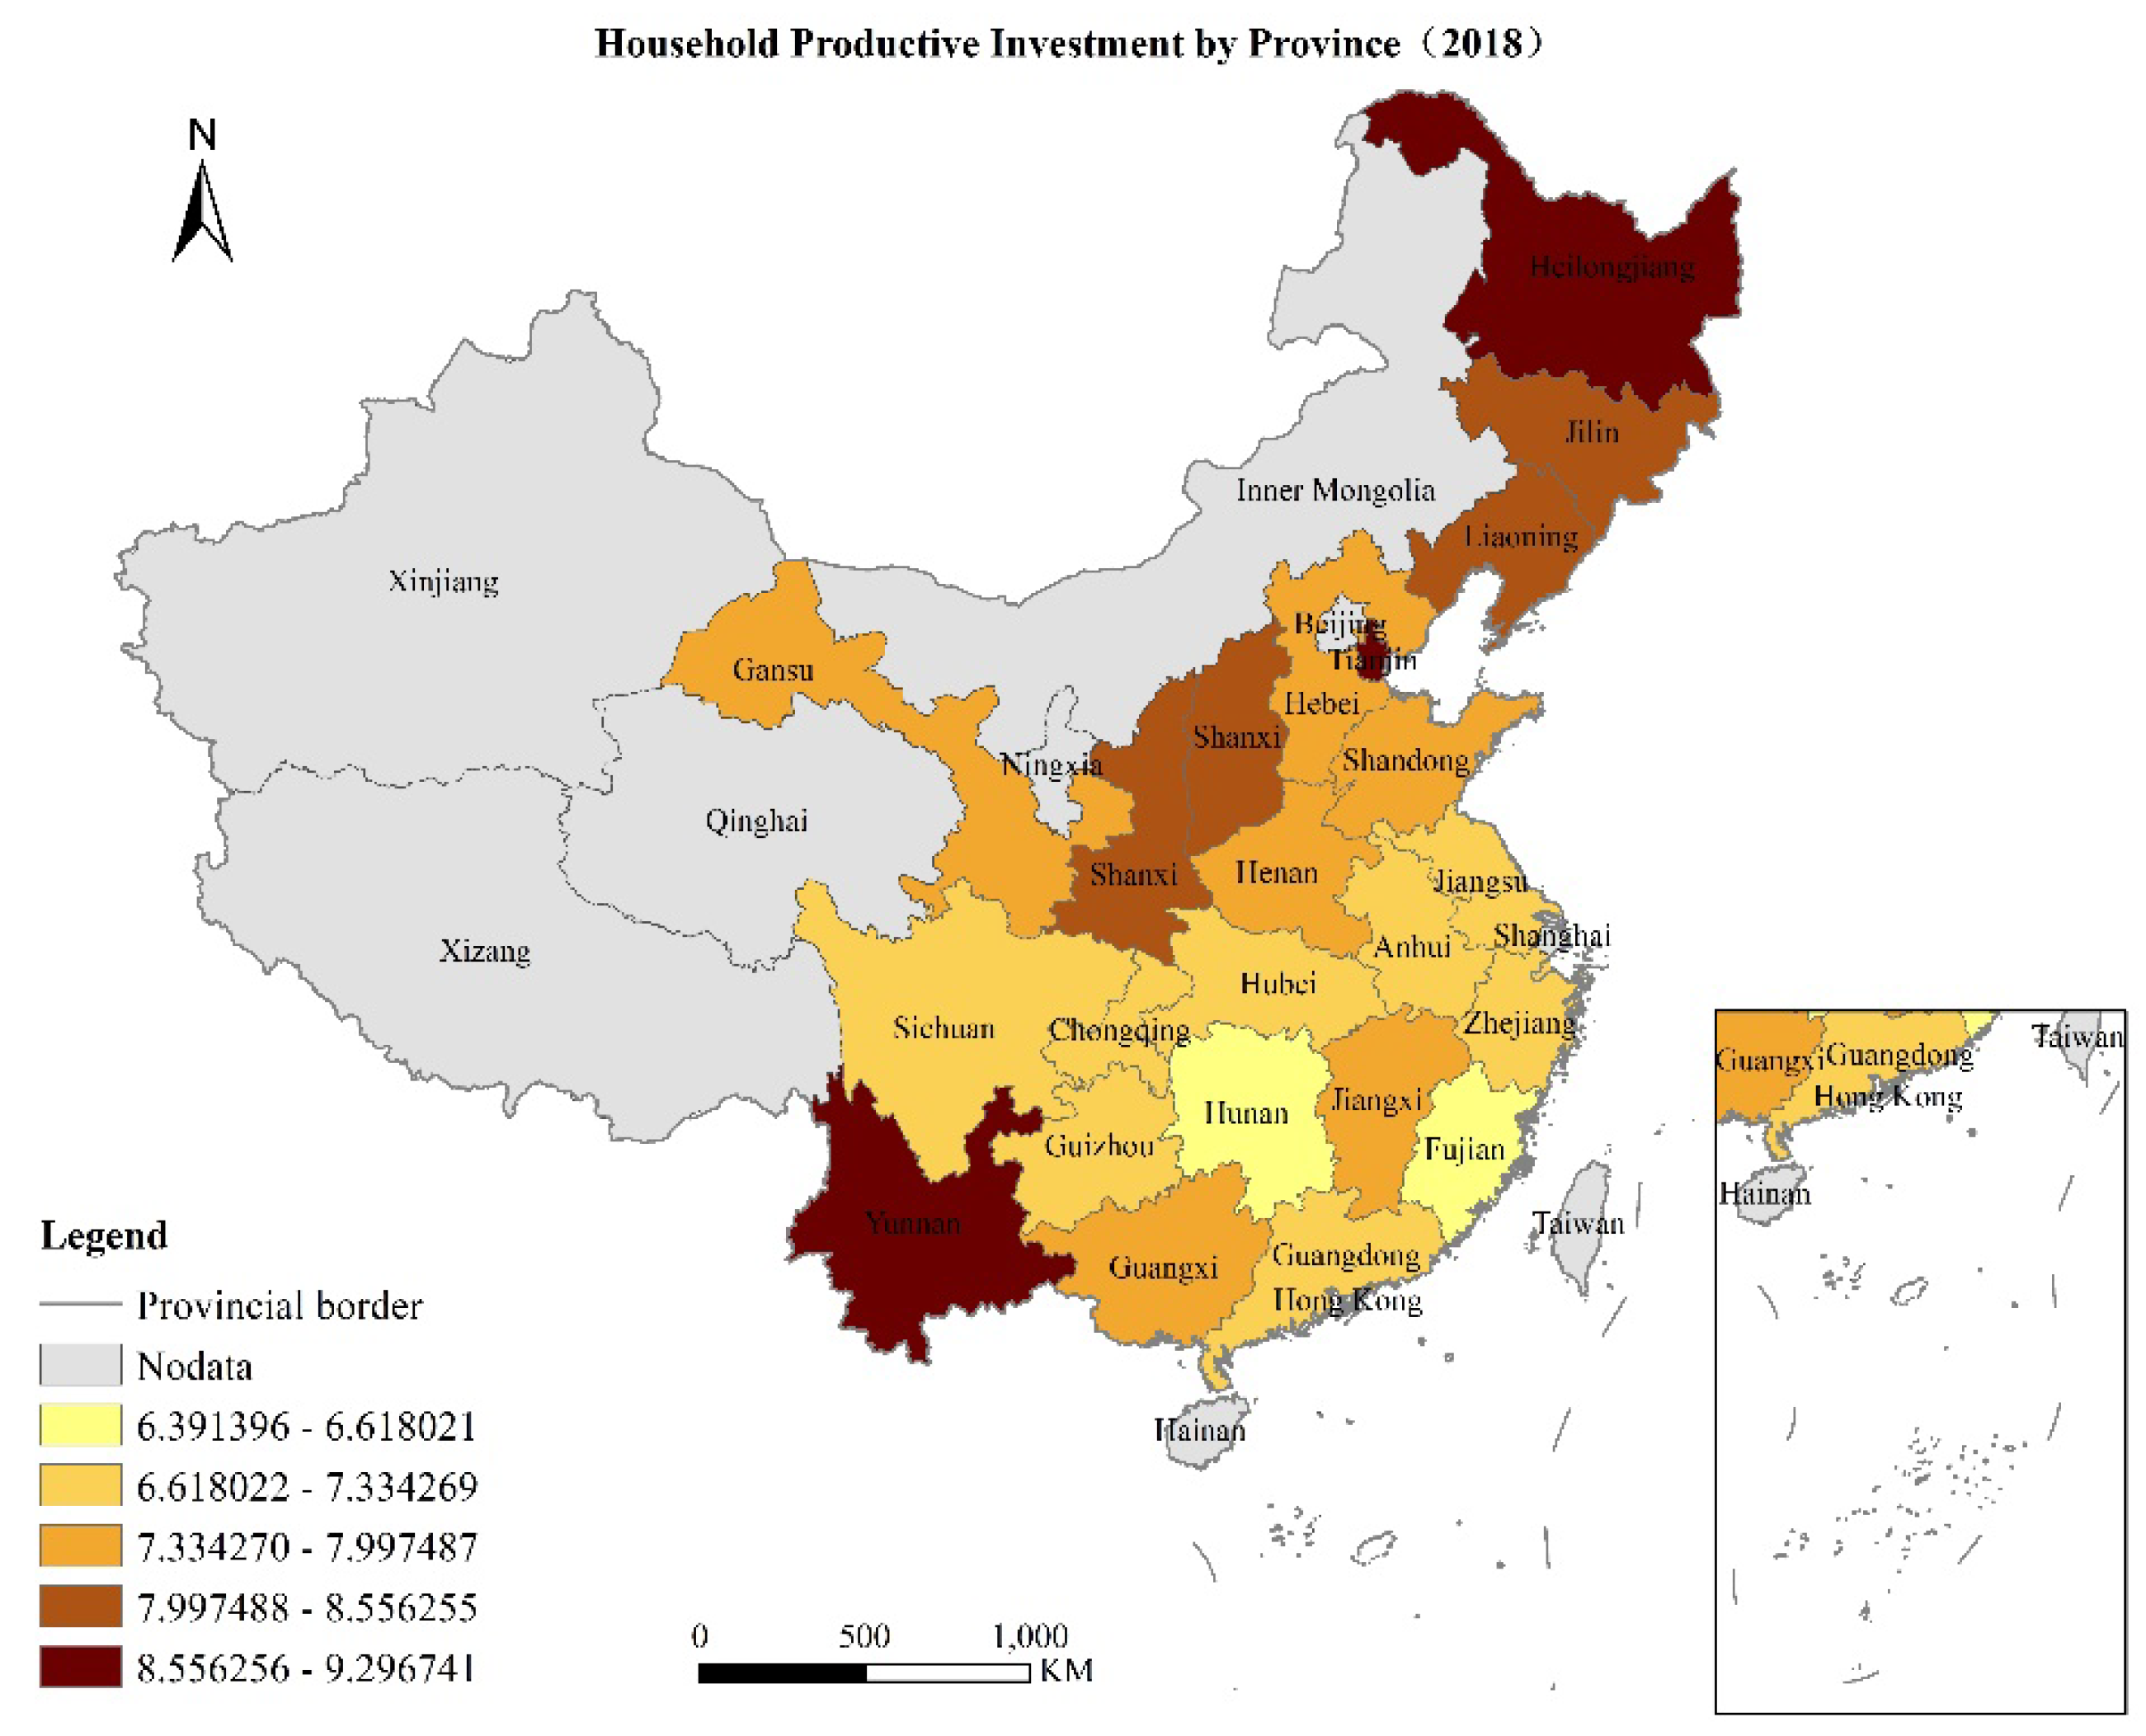
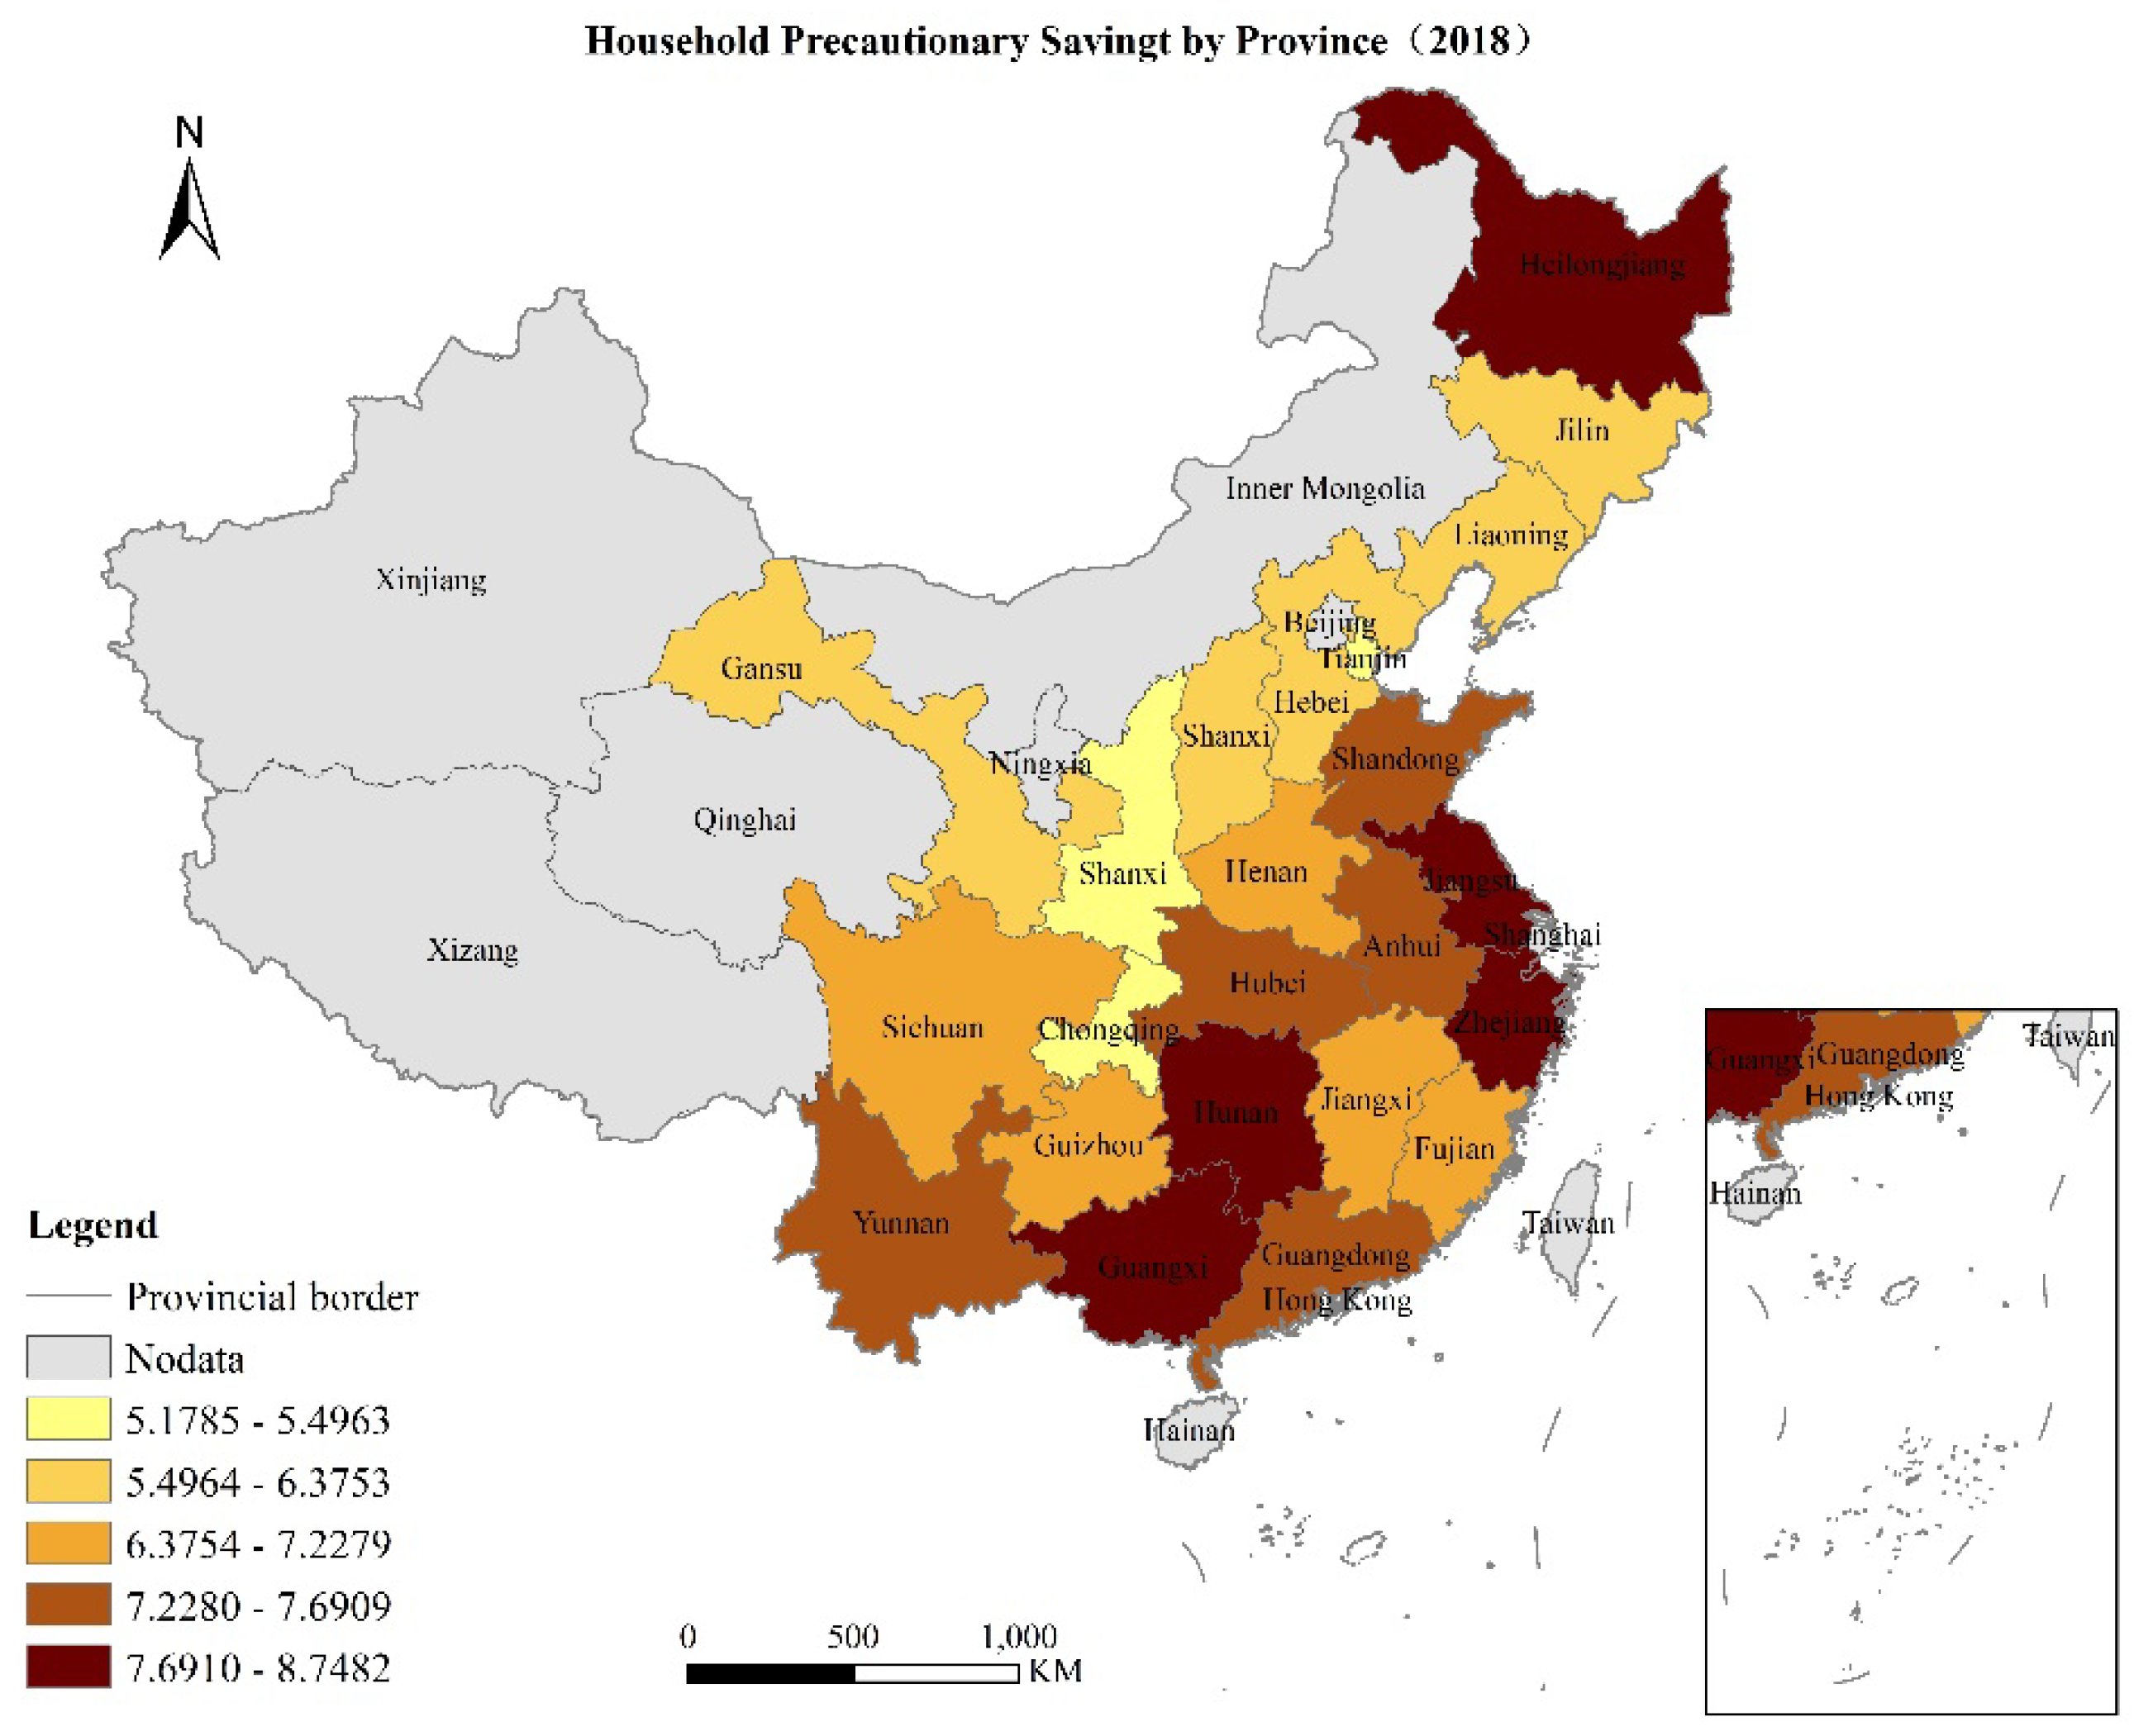
3.1.2. Household Poverty Vulnerability and Resource Allocation by Province (2018)

Based on the sample data, the probability value of individual household per capita log income below 50% of the poverty line is used as the threshold value of vulnerability. The poverty vulnerability levels, developmental investment; productive investment; and precautionary saving in each province of China are shown in Figure 2, Figure 3, Figure 4 and Figure 5.

3.1.3. Other Variable Definitions and Descriptive Statistics

The variable definitions and descriptive statistics of the explanatory variables and control variables (household head characteristics, household characteristics, and village characteristics) in this paper are shown in the Table 2.

3.2. Benchmark Model Results

In this section, we estimate the relationship between climate shocks and our main outcomes of interest: vulnerability to poverty. First, model (1) is estimated using the logit method to examine the existence of the effect of climate shocks on the poverty vulnerability of farm households, and the results are presented in Table 3. Among them, column (1) only considers the effect of the climate shocks index on farm household poverty vulnerability; columns (2)–(4) gradually control for household head characteristics, family characteristics, and village characteristics. We find, unsurprisingly, in all regressions, the coefficients of the climate shocks index are all significantly positive. This indicates that climate shocks do significantly increase the poverty vulnerability of Chinese farmers from the baseline model.
Among the control variables, household head characteristics, household characteristics, and village characteristics all affect farm household poverty vulnerability. Table 3 shows that the male head of a household has a significant effect on poverty vulnerability reduction (see column 4), and that households headed by women are disadvantaged in all aspects of vulnerability when faced with climate shocks [33,34]. In addition, consistent with our expectations, the poorer the health of the household head, the higher the probability that the household is exposed to climate risk and falls into vulnerability (see column 2). However, an increasing age of the household head is convex for poverty vulnerability (see column 2), i.e., poverty vulnerability first decreases with the increasing age of the household head, and then increases with age. This coincides with the life-cycle theory, suggesting that the youngest and oldest are more vulnerable to poverty vulnerability than the middle-aged [29]. In household characteristics, the expansion of household size increases poverty vulnerability, but the number of the household labor force, household income, and average years of education in the household, all have a significant decreasing effect on poverty vulnerability. Among the village characteristics, the distance of the village from the county town has an increasing effect on poverty vulnerability, which may be due to the fact that the weaker the farm households are influenced by the economic radiation of the county town, the lower their chances of increasing their income and the more likely they are to fall into poverty vulnerability [35]. The level of the village infrastructure has a dampening effect on the vulnerability of farm households to poverty and confirms that the appropriate infrastructure development for rural disaster prevention and resilience can improve the resistance of farm households to climate shocks [36,37].

3.3. Robustness Tests

Climate shocks are relatively exogenous to farm household poverty vulnerability, alleviating to some extent the endogeneity problem of the core explanatory variables. Therefore, to ensure the reliability of the above regression results, further robustness tests are carried out in the following four aspects, respectively. First, the criteria for identifying poverty vulnerability are replaced. A higher level of the 3.2$ poverty line criterion was chosen to identify poverty vulnerability and further examine its impact on poverty vulnerability (see Table 4, column 1). Second, the probability of falling into poverty is used as the explanatory variable. That is, instead of setting a dummy variable for poverty vulnerability, this paper directly uses the probability of rural households falling into poverty in the future as the explanatory variable and uses the OLS method to conduct an empirical analysis (see Table 4, column 2). Third, the average climate shocks variable is used to replace the core explanatory variables (see Table 4, column 3), because there may be a concern that there is some variation in the effect of climate shocks on farm household poverty vulnerability across years. Therefore, this paper examines the effect of the mean of the climate shocks index (2014–2016) on the poverty vulnerability of farm households. Finally, the actual climate shocks variable is used to replace the core explanatory variables (see Table 4, column 4). The climate shocks index set by the benchmark model in this study is a relative variable and may not fully reflect the true extent of climate shock for provinces with significant differences between climate conditions and GDP. In order to get rid of this possible confounding factor, this paper studies the impact of the economic loss of climate shock on the vulnerability to the poverty of farmers. Table 4 lists the results of the above robustness tests. The results show that the impact direction of climate shock on farmers’ poverty vulnerability is constant and significant.

3.4. Heterogeneity Analysis

Heterogeneity of village. Will climate shocks in disaster-prone areas have a greater impact on the poverty vulnerability of farm households? In order to verify the above judgment, this study divides the whole sample into a climate safety zone and a climate insecure zone according to the CFPS questionnaire.
Using the benchmark model, the regressions are fitted to the above two subsamples, and the results are shown in Table 5 (1) (2). For farmers in climate insecure zones, climate shocks significantly increase farmers’ poverty vulnerability, which is consistent with the benchmark regression. However, for farmers in climate safe zones, climate shocks do not significantly affect farmers’ poverty vulnerability. This also fully illustrates the increasing climate change and the need for a greater attention to risk response by farmers in insecure zones where natural disasters are frequent.
Heterogeneity of risk attitudes. Classical economic theory holds that individuals’ risk preference has an influence on behavior decision-making. Therefore, this part emphatically inspected the farmer household risk attitude heterogeneity to the vulnerability to poverty. This paper uses the CFPS2018 questionnaire to investigate farmers’ risk attitude. The risk attitude variable is 1–6, which represents the increasing degree of risk preference of residents. If the value of this variable of risk attitude is greater than or equal to four, it is classified as a risk preference, and vice versa as risk-averse farm households, as shown in Table 5 (3) (4). For risk-averse farmers, the impact coefficient of climate risk shock on poverty vulnerability of farmers is still positively correlated, and basically consistent with the benchmark regression. For farmers with risk preference, the impact of climate risk shocks on their poverty vulnerability will not be significant.
Heterogeneity of social capital. Social capital, as a non-institutionalized social force, can fill the gap in government management, acting as an insurance mechanism to ease credit constraints. It can also provide diversified resources for risk response and increase the risk resistance of farm households. Because social capital is difficult to observe directly, this paper uses farmers’ transfer income as a proxy variable to measure their households’ social capital. A high private transfer income indicates that households are more closely connected to the outside and have a higher social capital. If their transfer income is below the median level, the household is defined as a low social capital household, and vice versa as a high social capital household. As shown in Table 6 (5) (6), the coefficient of the effect of climate shocks on farm household poverty vulnerability remains significantly positive for low social capital households and is close to two times the magnitude of the baseline regression. However, for high social capital households, the effect of climate shocks on farm poverty vulnerability will no longer be significant. there is social capital heterogeneity in the effect of climate shocks on farm poverty vulnerability.

3.5. Mediating Effect of Household Resource Allocation

Based on the above theoretical analysis and the inferred hypotheses, this paper will test whether developmental investment, productive investment, and precautionary saving are the main transmission paths through which climate shocks affect poverty vulnerability based on models (6) and (7), respectively.
Table 6 shows the results of the test for mediating effects. Combined with the results of the baseline regression in Table 3, it can be seen that with different combinations of control variables, the independent variable natural disaster shocks all have a significant positive effect on the dependent variable poverty vulnerability, and when controlling for household head characteristics, household characteristics, and village characteristics, the coefficient is 0.3180 and is significant at the 0.01 level.
Column (1) of Table 6 shows that the coefficient of CS is negative and significant at the 0.01 level, indicating that climate shocks reduce farmers’ developmental investment; column (2) of developmental investment has a negative coefficient and is significant at the 0.01 level, indicating that an increase in farmers’ developmental investment decreases their poverty vulnerability, thus confirming the existence of a partial mediating effect, accounting for 8.11% of the total effect, and that climate shocks increase farmers’ poverty vulnerability by decreasing their developmental investment.
Column (3) of Table 6 shows that the coefficient of CS is negative and significant at the 0.01 level, indicating that climate shocks reduce the productive investment of farm households [38]. The coefficient of productive investment in column (4) is positive and significant at the 0.01 level, indicating that an increase in farmers’ productive investment increases their poverty vulnerability. This confirms the existence of a partial mediating effect, accounting for 5.05% of the total effect, where climate shocks mitigate the poverty vulnerability of farmers by reducing their productive investment.
Column (5) of Table 6 shows that the coefficient of CS is negative and significant at the 0.01 level, indicating that climate shocks reduce farmers’ precautionary saving; column (6) of precautionary saving has a positive coefficient and is significant at the 0.01 level, indicating that farmers’ precautionary saving reduces their poverty vulnerability, thus confirming the existence of a partial mediating effect, accounting for 17.67% of the total effect, where climate shocks increase farmers’ poverty vulnerability by reducing their precautionary saving. In addition, all three of the mediating variables above passed the Sobel test with statistics significant at least at the 0.05 level.

4. Discussion

4.1. Main Findings

Unlike the traditional macro perspective or case study approach [39,40,41], we try to explain the impact of climate change on poverty vulnerability from a micro perspective and analyze the transmission mechanism of this process. The findings shows that climate shocks increase the poverty vulnerability of farm households and exacerbate their risk of falling into poverty, and it remains confirmed after multiple robustness tests. These findings complement some studies in poverty research where climate shocks, even at the provincial level, have an impact on the poverty vulnerability of micro-farm households.
In order to understand these results, we try to explain this issue from the perspective of the factor allocation of farm households. It is found that after climate shocks, farm households are more inclined to exert their own initiative, which intuitively manifests itself in reducing developmental investment, productive investment, and precautionary saving to prevent and cope with possible future uncertainty disasters. However, in the long run, this can undermine the welfare of farm households and affect their vulnerability to poverty [42]. To further test the possible differences, this paper finds that there is heterogeneity in the effects of climate change on farm households in different regions and attributes through heterogeneity analysis [43], and climate risk zones, low social capital, and risk-averse farm households are more vulnerable to climate shocks, which provides a priority idea for resisting climate shocks.

4.2. Theoretical Implications

The study in this paper enriches the research perspective on climate change and poverty. Both from the perspective of scientific development and from the perspective of policy practice, the academic community needs to address these gaps in existing research. This paper shows that risk and shocks may well be an important cause of poverty persistence. It is not only the economic dimension, but also the impact on household resource allocation that needs to be taken into account, even this impact will be long-lasting [44,45]. More seriously, not only in rural areas, but climate shocks can even exacerbate the risk of poverty convergence to urban areas [46]. This paper provides a new focus on the shocks caused by climate risk issues.
This approach provided a more thorough understanding, both conceptually and methodologically of the impact of climate shocks on poverty vulnerability. The existing literature differs in its findings depending on the scope, object, and methodology of the study. This paper provides in-depth data and findings that illustrate some of these issues. The impact of climate shocks on the vulnerability of farm households to poverty can be self-offsetting to some extent. For risk-averse farmers, they will reduce their risk by reducing their agricultural investment, which in turn reduces the likelihood of falling into poverty in the current period. However, the impact of climate shocks on farm households will be conservative in the long run, affecting people’s investments, saving behaviors, work preferences, etc. [47]. In particular, when the lack of developmental investment and precautionary saving expands the uncertainty of households’ future economic income in the long run, it will stimulate households’ risk-averse appetite and increases the likelihood that climate shocks will have a serious negative impact on farm households [48,49]. These mechanisms will provide some input to the theoretical study of farm household relief systems.
Future research could decompose which features of climate risk shocks drive different responses in farmer factor allocations. and provide more nuanced policy advice related to an optimal government response. Linking household resource allocation to climate risk management is crucial, especially in climate-vulnerable areas, and risk-averse or low social capital groups. Of course, heterogeneity is not only a problem within provinces or countries, and heterogeneity analysis should also bring to our attention that climate shocks can even cause increased inequality between countries [50]. Therefore, the discussion of heterogeneity is crucial when discussing the impact of natural disasters (or any other event) on poverty [51].

4.3. Practical Implications

Poverty vulnerability emphasizes the likelihood that rural households will experience poverty in the future, and the paper’s findings capture the impact of climate shocks on poverty vulnerability. Therefore, governments should implement a set of strategies (e.g., changing crop varieties and adopting soil and water conservation strategies) to cope with long-term changes in key climate variables such as temperature and rainfall [52]. This has led to the need for agriculture to transition to systems with a higher productivity, more efficient use of inputs, less variability in output, and greater stability to adapt to long-term climate variability.
The conclusions deduced from the transmission path are also the ones that need to be embarked upon. Although farm households reduce precautionary savings, productive investment, and developmental investment under climate shocks, livelihood strategies that help maintain consumption levels during times of stress also have negative consequences for future development [53]. It is also important to understand how climate shocks affect economic behavior and the consequences of realized changes in beliefs and expectations about the future state of the world. In particular, increased climate shocks can reduce farmers’ productive investment and developmental investment. There is already evidence that climate shocks may cause young people to drop out of school and enter the labor market earlier in order to mitigate the impact on household livelihoods [54]. Obviously, this would limit the accumulation of human capital among rural residents, which would be bad.
Consequently, incorporating these measures into academic research and policy evaluation can be helpful in developing a broader understanding of the economic lives of the farmers in the context of climate change. On the one hand, we should consider new ways of adapting agricultural production to climate change and protect farmers’ precautionary savings and developmental investment; on the other hand, we should stabilize farmers’ productive investment through the promotion of crop insurance, etc. [55].
Most importantly, we need to pay attention to the issue of heterogeneity. Climate shocks can place limits on future farmer investment behavior [56]. However, the impact of climate shocks on poverty vulnerability varies across village characteristics, risk preferences, and social capital levels of farm households, and the results of this study justify this possibility. Overall, there is strong evidence that it is both feasible and cost- effective for regions with harsh climatic conditions, and it is feasible and cost-effective to invest heavily in climate change adaptation [57]. Therefore, for climate risk areas or areas with weak social capital, actions to cope with climate shocks should be started as early as possible. The public investment in pre-disaster prevention and post-disaster reconstruction should be increased, and the efficiency of the transfer policy should be improved, or a flexible approach should be adopted to change the livelihood strategy and provide appropriate non-farm employment as a channel to expand livelihoods [58,59].

5. Conclusions

Climate change is widespread, rapid, and intensifying. Although much work remains to be done in this area, using Chinese disaster data and China Household Tracking Survey (CFPS) data, our study has sufficient evidence to suggest that climate shocks have an impact on poverty vulnerability and its mechanisms of action are explored and validated. This paper provides suggestive evidence that (a) climate shocks can significantly increase the poverty vulnerability of farm households. (b) The effect of climate shocks on farm household poverty vulnerability is regionally and individually heterogeneous. Climate non-security zones, risk-averse farmers, and low social capital farmers are more vulnerable to climate shocks and fall into poverty. (c) The mediating effects suggest that climate shocks affect the poverty vulnerability of farm households by influencing their developmental investment, productive investment, and precautionary saving. These findings help to understand the adaptive measures and household resource allocation of farm households in response to climate change and are important for achieving various goals such as stabilizing agricultural production, promoting human capital investment, and reducing poverty.
A word of caution is in order regarding the results from this paper. This study still has limitations, which we believe offer opportunities for future research. First, due to data limitations, the impact of climate shocks on poverty vulnerability still has a large research potential. In the future, on the one hand, the types of climate shocks can be subdivided, and on the other hand, climate change can be focused on a smaller scale. Second, more empirical studies are needed to explore whether there may be a threshold value for the impact of climate shocks on poverty, so that the synergy between coping with climate shocks and reducing poverty can be optimized. Finally, the paper uses cross-sectional data, but climate shocks have both contemporaneous and lagged effects. We can use longer-term panel data to see whether there are short-term or long-term patterns in the allocation of production factors or livelihood strategies of farmers in response to climate shocks.

Author Contributions

Conceptualization, Z.Z. and H.W.; data curation, Z.Y.; formal analysis, Z.Z.; funding acquisition, H.W.; methodology, Z.Z.; project administration, Z.Z.; resources, H.W.; software, Z.Y.; validation, Z.Z., Z.Y. and H.W.; writing—original draft preparation, Z.Z.; writing—review and editing, Z.Z. and H.W. All authors have read and agreed to the published version of the manuscript.

Funding

We gratefully acknowledge the financial support from the National Social Science Foundation Major Project “Research on Multidimensional Identification and Collaborative Governance of Relative Poverty in China” (grant number 19ZDA151).

Institutional Review Board Statement

Ethical review and approval were waived for this study because it uses second-hand data collected from an open access database.

Informed Consent Statement

Consent was waived for this study because it uses second-hand data collected from an open access database.

Data Availability Statement

Data supporting reported results can be found at the open access database of National Bureau of Statistics. http://www.stats.gov.cn/ (accessed on 10 June 2022) and China Family Panel Studies (CFPS). http://www.isss.pku.edu.cn/cfps/download (accessed on 10 June 2022).

Conflicts of Interest

The authors declare no conflict of interest.

References

  1. Carleton, T.A.; Hsiang, S.M. Social and economic impacts of climate. Science 2016, 353, 1112. [Google Scholar] [CrossRef] [PubMed] [Green Version]
  2. Gregory, P.J.; Ingram, J.S.I.; Brklacich, M. Climate change and food security. Philos. Trans. R. Soc. B Biol. Sci. 2005, 360, 2139–2148. [Google Scholar] [CrossRef] [PubMed]
  3. IPCC (Intergovernmental Panel on Climate Change). AR6 Climate Change 2021: The Physical Science Basis. Available online: https://www.ipcc.ch/report/ar6/wg1/ (accessed on 10 June 2022).
  4. Alem, Y.; Colmer, J. Blame it on the rain: Rainfall variability, consumption smoothing, and subjective well-being in rural Ethiopia. Am. J. Agric. Econ. 2021, 104, 905–920. [Google Scholar] [CrossRef]
  5. Burke, M.; Hsiang, S.M.; Miguel, E. Climate and Conflict. Annu. Rev. Econ. 2015, 7, 577–617. [Google Scholar] [CrossRef]
  6. Donald, E.; David, C.; Rainer, R.C.; Tanenbaum, M.; Czajkowski, S. Climate change, behavior change and health: A multidisciplinary, translational and multilevel perspective. Transl. Behav. Med. 2022, 12, 503–515. [Google Scholar]
  7. Maystadt, J.F.; Ecker, O. Extreme Weather and Civil War: Does Drought Fuel Conflict in Somalia through Livestock Price Shocks? Am. J. Agric. Econ. 2014, 96, 1157–1182. [Google Scholar] [CrossRef] [Green Version]
  8. Mera, G.A. Drought and its impacts in ethiopia. Weather. Clim. Extrem. 2018, 22, 24–35. [Google Scholar] [CrossRef]
  9. Reynaud, A.; Nguyen, M.H.; Aubert, C. Is there a demand for flood insurance in vietnam? results from a choice experiment. Environ. Econ. Policy Stud. 2017, 20, 593–617. [Google Scholar] [CrossRef]
  10. Hu, X.; Zheng, W. Climate Change, Agricultural Risk and Farmers’ Purchasing of Agricultural Insurance. J. Soc. Sci. Hunan Norm. Univ. 2021, 50, 95–104. [Google Scholar]
  11. Zhou, W.; Guo, S.; Deng, X.; Xu, D. Livelihood resilience and strategies of rural residents of earthquake-threatened areas in Sichuan Province, China. Nat. Hazards 2021, 106, 255–275. [Google Scholar] [CrossRef]
  12. Hertel, T.W.; Rosch, S.D. Climate change, agriculture, and poverty. Appl. Econ. Perspect. Policy 2010, 32, 355–385. [Google Scholar] [CrossRef]
  13. Zhou, S.; Zhou, W.; Lin, G.; Chen, J.; Jiang, T.; Li, M. Adapting to climate change: Scenario analysis of grain production in China. China Agric. Econ. Rev. 2017, 9, 643–659. [Google Scholar] [CrossRef]
  14. Bhuvaneswari, K.; Geethalakshmi, V.; Lakshmanan, A.; Anbhazhagan, R.; Sekhar, U. Climate change impact assessment and developing adaptation strategies for rice crop in western zone of tamil nadu. J. Agrometeorol. 2014, 16, 38–43. [Google Scholar] [CrossRef]
  15. Kuwayama, Y.; Thompson, A.; Bernknopf, R.; Zaitchik, B.; Vail, P. Estimating the Impact of Drought on Agriculture Using the U.S. Drought Monitor. Am. J. Agric. Econ. 2018, 101, 193–210. [Google Scholar] [CrossRef]
  16. Araya, A.; Prasad, P.V.V.; Zambreski, Z.; Gowda, P.H.; Girma, A. Spatial analysis of the impact of climate change factors and adaptation strategies on productivity of wheat in ethiopia. Sci. Total Environ. 2020, 731, 139094. [Google Scholar] [CrossRef]
  17. Bandara, J.S.; Cai, Y. The impact of climate change on food crop productivity, food prices and food security in south asia. Econ. Anal. Policy 2014, 44, 451–465. [Google Scholar] [CrossRef]
  18. Dercon, S.; Hoddinott, J.; Woldehanna, T. Shocks and consumption in 15 Ethiopian villages, 1999–2004. J. Afr. Econ. 2005, 14, 559. [Google Scholar] [CrossRef]
  19. Nguyen, T.T.; Nguyen, T.T.; Le, V.H.; Managi, S.; Grote, U. Reported weather shocks and rural household welfare: Evidence from panel data in northeast thailand and central vietnam. Weather. Clim. Extrem. 2020, 30, 100286. [Google Scholar] [CrossRef]
  20. Dercon, S. Growth and shocks: Evidence from rural Ethiopia. J. Dev. Eeconomics 2004, 74, 308–329. [Google Scholar] [CrossRef]
  21. Yadav, S.S.; Redden, R.J.; Hatfield, J.L.; Ebert, A.W.; Hunter, D. Food Security and Climate Change; John Wiley & Sons: Hoboken, NJ, USA, 2018. [Google Scholar]
  22. Sattler, D.N.; Bishkhorloo, B.; Graham, J.M. Climate Change Threatens Nomadic Herding in Mongolia: A Model of Climate Change Risk Perception and Behavioral Adaptation. J. Environ. Psychol. 2021, 75, 101620. [Google Scholar] [CrossRef]
  23. FAO The State of Food and Agriculture 2012: Investing in Agriculture for a Better Future. 2012. Available online: https://www.fao.org/3/i3028e/i3028e.pdf (accessed on 10 June 2022).
  24. Wasko, C.; Sharma, A.; Pui, A. Linking temperature to catastrophe damages from hydrologic and meteorological extremes. J. Hydrol. 2021, 602, 126731. [Google Scholar] [CrossRef]
  25. Xu, X.; Liu, Q.; Wang, Y. Stock Price Effects of Natural Disasters—Empirical Evidence from the A-Share Market. World Econ. Papers 2021, 2, 1–19. [Google Scholar]
  26. Intergovernmental Panel on Climate Change (IPCC). Managing the Risks of Extreme Events and Disasters to Advance Climate Change Adaptation; Cambridge University Press: New York, NY, USA, 2012; p. 594. [Google Scholar]
  27. Chaudhuri, S.; Jalan, J.; Suryahadi, A. Assessing Household Vulnerability to Poverty from Cross-Sectional Data: A Methodology and Estimates from Indonesia; Discussion Papers; Department of Economics, Columbia University: New York, NY, USA, 2002. [Google Scholar]
  28. Günther, I.; Harttgen, K. Estimating Households Vulnerability to Idiosyncratic and Covariate Shocks: A Novel Method Applied in Madagascar. World Dev. 2009, 37, 1222–1234. [Google Scholar] [CrossRef]
  29. Fan, L.; Xie, E. Do public transfers reduce poverty vulnerability? Econ. Res. J. 2014, 49, 67–78. [Google Scholar]
  30. Colmer, J. Rainfall Variability, Child Labor, and Human Capital Accumulation in Rural Ethiopia. Am. J. Agric. Econ. 2020, 103, 858–877. [Google Scholar] [CrossRef]
  31. Luo, C. Health Risk, Medical Security and Internal Resource Allocation of Rural Households. Chin. J. Popul. Sci. 2007, 2, 34–42+95–96. [Google Scholar]
  32. Yin, Z.; Zhang, D. Financial inclusion, household poverty and vulnerability. China Econ. Q. 2020, 20, 153–172. [Google Scholar]
  33. Waite, L. How Is Household Vulnerability Gendered? Female-headed Households in the Collectives of Suleimaniyah, Iraqi Kurdistan. Disasters 2010, 24, 153–172. [Google Scholar] [CrossRef]
  34. Bairagi, S.; Mishra, A.K.; Tran, D.Q. Disentangling gender-differentiated impacts on food security and poverty: Empirical evidence from Vietnam. J. Int. Dev. 2022, 34, 493–511. [Google Scholar] [CrossRef]
  35. Partridge, M.D.; Rickman, D.S. Distance from urban agglomeration economies and rural poverty. J. Reg. Sci. 2008, 48, 285–310. [Google Scholar] [CrossRef] [Green Version]
  36. Lu, S.; Bai, X.; Li, W.; Wang, N. Impacts of climate change on water resources and grain production. Technol. Forecast. Soc. Chang. 2019, 143, 76–84. [Google Scholar] [CrossRef]
  37. Lee, D. The Impact of Natural Disasters on Neighborhood Poverty Rate: A Neighborhood Change Perspective. J. Plan. Educ. Res. 2020, 40, 447–459. [Google Scholar] [CrossRef] [Green Version]
  38. Zhou, Z.; Yu, Z.; Gao, S. Climate Shocks and Farmers’ Agricultural Productive Investment: Resisting Risk or Escaping Production? Front. Ecol. Evol. 2022, 10, 895265. [Google Scholar] [CrossRef]
  39. Fankhauser, S.; Tol, R. On climate change and economic growth. Resour. Energy Econ. 2005, 27, 1–17. [Google Scholar] [CrossRef]
  40. Case study and analogue methodologies in climate change vulnerability research. Wiley Interdiscip. Rev. Clim. Chang. 2010, 1, 374–392. [CrossRef]
  41. Westerhoff, L.; Smit, B. The rains are disappointing us: Dynamic vulnerability and adaptation to multiple stressors in the Afram Plains, Ghana. Mitig. Adapt. Strat. Glob. Chang. 2009, 14, 317–337. [Google Scholar] [CrossRef]
  42. Rubtsov, A.; Xu, W.; Evi, A.; Šević, Ž. Price of climate risk hedging under uncertainty. Technol. Forecast. Soc. Chang. 2020, 165, 120430. [Google Scholar] [CrossRef]
  43. Kosec, K.; Mo, C.H. Aspirations and the Role of Social Protection: Evidence from a Natural Disaster in Rural Pakistan. World Dev. 2017, 97, 49–66. [Google Scholar] [CrossRef]
  44. Bahinipati, C.S. Assessing the costs of droughts in rural India: A comparison of economic and non-economic loss and damage. Curr. Sci. 2020, 118, 1832–1841. [Google Scholar] [CrossRef]
  45. Maccini, S.; Yang, D. Under the Weather: Health, Schooling, and Economic Consequences of Early-Life Rainfall. Am. Econ. Rev. 2009, 99, 1006–1026. [Google Scholar] [CrossRef] [Green Version]
  46. Li, H.; Zhou, Y.; Wei, Y.D. Institutions, Extreme Weather, and Urbanization in the Greater Mekong Region. Ann. Am. Assoc. Geogr. 2019, 109, 1317–1340. [Google Scholar] [CrossRef]
  47. Oishi, S.; Yagi, A.; Komiya, A.; Kohlbacher, F.; Kusumi, T.; Ishii, K.; Jokela, M. Does a Major Earthquake Change Job Preferences and Human Values? Eur. J. Personal. 2017, 31, 258–265. [Google Scholar] [CrossRef]
  48. Daramola, A.Y.; Timothy, O.O.; Ogundele, O.; Adesanya, A. Adaptive capacity and coping response strategies to natural disasters: A study in Nigeria. Int. J. Disaster Risk Reduct. 2016, 15, 132–147. [Google Scholar] [CrossRef]
  49. Janzen, S.A.; Carter, M.R. After the Drought: The Impact of Microinsurance on Consumption Smoothing and Asset Protection. Am. J. Agric. Econ. 2018, 101, 651–671. [Google Scholar] [CrossRef]
  50. Burke, M.; Hsiang, S.; Miguel, E. Global non-linear effect of temperature on economic production. Nature 2015, 527, 235–239. [Google Scholar] [CrossRef]
  51. Warr, P.; Aung, L.L. Poverty and inequality impact of a natural disaster: Myanmar’s 2008 cyclone Nargis. World Dev. 2019, 122, 446–461. [Google Scholar] [CrossRef]
  52. Di Falco, S.; Veronesi, M.; Yesuf, M. Does Adaptation to Climate Change Provide Food Security? A Micro-Perspective from Ethiopia. Am. J. Agric. Econ. 2011, 93, 829–846. [Google Scholar] [CrossRef] [Green Version]
  53. Paavola, J. Livelihoods, vulnerability and adaptation to climate change in Morogoro, Tanzania. Environ. Sci. Policy 2008, 11, 642–654. [Google Scholar] [CrossRef]
  54. Marchetta, F.; Sahn, D.E.; Tiberti, L. The Role of Weather on Schooling and Work of Young Adults in Madagascar. Am. J. Agric. Econ. 2019, 101, 1203–1227. [Google Scholar] [CrossRef]
  55. Yang, X.; Liu, Y.; Bai, W.; Liu, B. Evaluation of the crop insurance management for soybean risk of natural disasters in Jilin Province, China. Nat. Hazards 2014, 76, 587–599. [Google Scholar] [CrossRef]
  56. Janzen, S.A.; Magnan, N.P.; Sharma, S.; Thompson, W.M. Aspirations Failure and Formation in Rural Nepal. J. Econ. Behav. Organ. 2017, 139, 1–25. [Google Scholar] [CrossRef] [Green Version]
  57. Hsiang, S.M.; Narita, D. Adaptation to cyclone risk: Evidence from the global cross-section. Clim. Chang. Econ. 2012, 3, 1250011. [Google Scholar] [CrossRef]
  58. D″Haen, S.A.L.; Nielsen, J.; Lambin, E.F. Beyond local climate: Rainfall variability as a determinant of household nonfarm activities in contemporary rural Burkina Faso. Clim. Dev. 2014, 6, 144–165. [Google Scholar] [CrossRef]
  59. Mcdowell, J.Z.; Hess, J.J. Accessing adaptation: Multiple stressors on livelihoods in the Bolivian highlands under a changing climate. Glob. Environ. Chang. 2012, 22, 342–352. [Google Scholar] [CrossRef]
Figure 1. Climate shocks, household resource allocation, and vulnerability to poverty.
Agriculture 12 00971 g001
Figure 2. Household poverty vulnerability by province (2018).
Agriculture 12 00971 g002
Figure 3. Household developmental investment by province (2018).
Agriculture 12 00971 g003
Figure 4. Household productive investment by province (2018).
Agriculture 12 00971 g004
Figure 5. Household precautionary saving by province (2018).
Agriculture 12 00971 g005
Table 1. Climate shock index by province (2014–2016).
Province201420152016Province201420152016
Shanghai0.0000.0140.001Qinghai0.4040.4960.665
Tianjin0.0080.0000.020Jilin0.8490.5820.668
Beijing0.0490.0060.065Shanxi0.3980.8090.833
Shandong0.1380.1280.107Hunan0.7640.4380.841
Guangxi1.2230.2890.150Yunnan0.7630.9630.924
Jiangsu0.0220.1210.156Inner Mongolia0.6360.6180.992
Guangdong0.4970.4330.182Heilongjiang0.3710.2621.043
Liaoning0.5920.2270.206Gansu1.0900.9071.243
Sichuan0.5840.4330.233Xizang0.2060.4071.311
Chongqing0.6910.1400.269Guizhou2.1070.6421.472
Henan0.3400.1190.308Fujian0.1890.7281.644
Zhejiang0.1440.5320.354Hebei0.4590.3611.930
Shanxi0.5280.4030.404Hainan5.0680.3841.955
Ningxia0.6030.2850.549Anhui0.1410.5402.311
Jiangxi0.4630.4170.573Hubei0.2480.2782.564
Xinjiang1.1281.6710.595
Table 2. The results of other variable definitions and descriptive statistics.
VariableVariable DefinitionMean
Vep1Poverty vulnerability level ($1.9 poverty line)0.2623
Vep2Poverty vulnerability level ($3.2 poverty line)0.6082
Vul1Probability of falling into poverty ($1.9 poverty line)0.3083
Vul2Probability of falling into poverty ($3.2 poverty line)0.5069
Household head characteristics
GenderA value of 1 if the household head is male, 0 otherwise0.5772
AgeAge of the household head (years)53.4037
Age2Age2 of the household head (years)2990.3130
EduFormal education of the household head (years)6.2780
PartyA value of 1 if the household head is CPC, 0 otherwise0.0661
HealthHousehold head is very healthy (1 = strongly agree; 2 = agree;
3 = general; 4 = disagree; and 5 = strongly disagree)
3.2301
Family characteristics
Family sizeFamily size1.2992
Num_laborNumber of household labor (15 < age < 60)2.0664
Avg_healthLogarithmic average health of family members0.1558
Avg_ageLogarithmic average age of family members3.8375
Avg_eduAverage education level of family members (average years of schooling)6.2779
Ln_incomePer capita annual household income (yuan)8.7418
LandThe scale of self-owned land (mu)12.1097
Village characteristics
CitylongThe distance from county seat (km)53.9826
Ln_infraLogarithmic amount of infrastructure investment (li)0.9567
Table 3. The results of benchmark model.
Variables(1)(2)(3)(4)
vep1vep1vep1vep1
CS0.2680 ***0.2969 ***0.3258 ***0.3180 ***
(0.0642)(0.0696)(0.0795)(0.0804)
Gender 0.1522−0.2542 **−0.2833 **
(0.0962)(0.1123)(0.1132)
Age −0.1544 ***−0.0216−0.0190
(0.0245)(0.0304)(0.0303)
Age2 0.0015 ***0.00010.0001
(0.0002)(0.0003)(0.0003)
Edu −0.1503 ***0.01600.0171
(0.0123)(0.0200)(0.0201)
Party −0.0107−0.0245−0.0241
(0.0221)(0.0242)(0.0245)
Health 0.0787 **0.0657 *0.0643
(0.0368)(0.0398)(0.0401)
Avg_health 0.23590.2208
(0.1963)(0.1968)
Family size 0.7841 ***0.8161 ***
(0.1308)(0.1313)
Num_labor −0.4626 ***−0.4751 ***
(0.0585)(0.0590)
Avg_age −0.2403−0.2318
(0.2875)(0.2897)
Ln_income −0.4319 ***−0.4282 ***
(0.0488)(0.0493)
Land 0.00100.0004
(0.0010)(0.0010)
Avg_edu −0.3194 ***−0.3168 ***
(0.0286)(0.0286)
Citylong 0.0048 ***
(0.0011)
Ln_infra −0.0867 *
(0.0470)
Constant−1.2455 ***3.0385 ***5.6673 ***5.2874 ***
(0.0674)(0.6516)(1.4051)(1.4127)
N2790279027902790
R20.00510.07730.22660.2327
Notes: The numbers in brackets are robust standard errors. *: p < 10%; **: p < 5%; ***: p < 1%.
Table 4. The results of robustness tests.
Variables(1)(2)(3)(4)
vep2vul1vep1vep1
CS0.2663 ***0.0246 ***0.5075 ***0.2243 ***
(0.0786)(0.0072)(0.1408)(0.0711)
Household head characteristicsYESYESYESYES
Family characteristicsYESYESYESYES
Village characteristicsYESYESYESYES
Constant7.6019 ***1.0157 ***5.0554 ***4.4071 ***
(1.3938)(0.1129)(1.4106)(1.4385)
N2790279027902790
R20.26300.35840.23140.2312
Notes: The numbers in brackets are robust standard errors. *: p < 10%; **: p < 5%; ***: p < 1%.
Table 5. The results of heterogeneity analysis.
VariablesHeterogeneity of VillageHeterogeneity of Risk AttitudesHeterogeneity of Social Capital
Climate Safe ZoneClimate Insecure ZoneRisk-Averse FarmersRisk-Loving Farmers Low Social CapitalHigh Social Capital
(1)(2)(3)(4)(5)(6)
CS0.4643 ***
(0.0968)
0.1071
(0.1568)
0.3928 ***
(0.0884)
0.3044
(0.2110)
0.6289 ***
(0.1139)
0.0337
(0.1178)
Household head characteristicsYESYESYESYESYESYES
Family characteristicsYESYESYESYESYESYES
Village characteristicsYESYESYESYESYESYES
Constant5.4295 ***
(1.3064)
2.9807
(3.1261)
5.3033
(1.3563)
4.3547
(2.4773)
2.3943
(1.5177)
9.1963
(1.9678)
N2154593225249513781369
R20.23180.20250.22590.19530.24920.2224
Notes: The numbers in brackets are robust standard errors. *: p < 10%; **: p < 5%; ***: p < 1%.
Table 6. The results of mediating effect of household resource allocation.
Variables(1)(2)(3)(4)(5)(6)
Developmental Investmentvep1Productive Investmentvep1Precautionary Savingvep1
CS−0.2721 ***0.3276 ***−0.2250 ***0.3746 ***−0.2646 **0.3268 ***
(0.0744)(0.0805)(0.0337)(0.0817)(0.1279)(0.0866)
Developmental investment −0.1004 ***
(0.0205)
Productive investment 0.0899 **
(0.0429)
Precautionary saving −0.2173 ***
(0.0131)
Household head characteristicsYESYESYESYESYESYES
Family characteristicsYESYESYESYESYESYES
Village characteristicsYESYESYESYESYESYES
Constant13.2583 ***6.1246 ***7.3717 ***4.2669 ***4.1155 **6.7971 ***
(0.9846)(1.2022)(0.5286)(1.2416)(1.8207)(1.2889)
N277227452765273827742747
R20.32810.22580.06660.21860.08240.3177
Sobel Test0.0090 ***−0.0026 **0.0042 ***
Mediating Effect (%)8.11%−5.05%17.67%
Notes: The numbers in brackets are robust standard errors. *: p < 10%; **: p < 5%; ***: p < 1%.
Publisher’s Note: MDPI stays neutral with regard to jurisdictional claims in published maps and institutional affiliations.

