Article

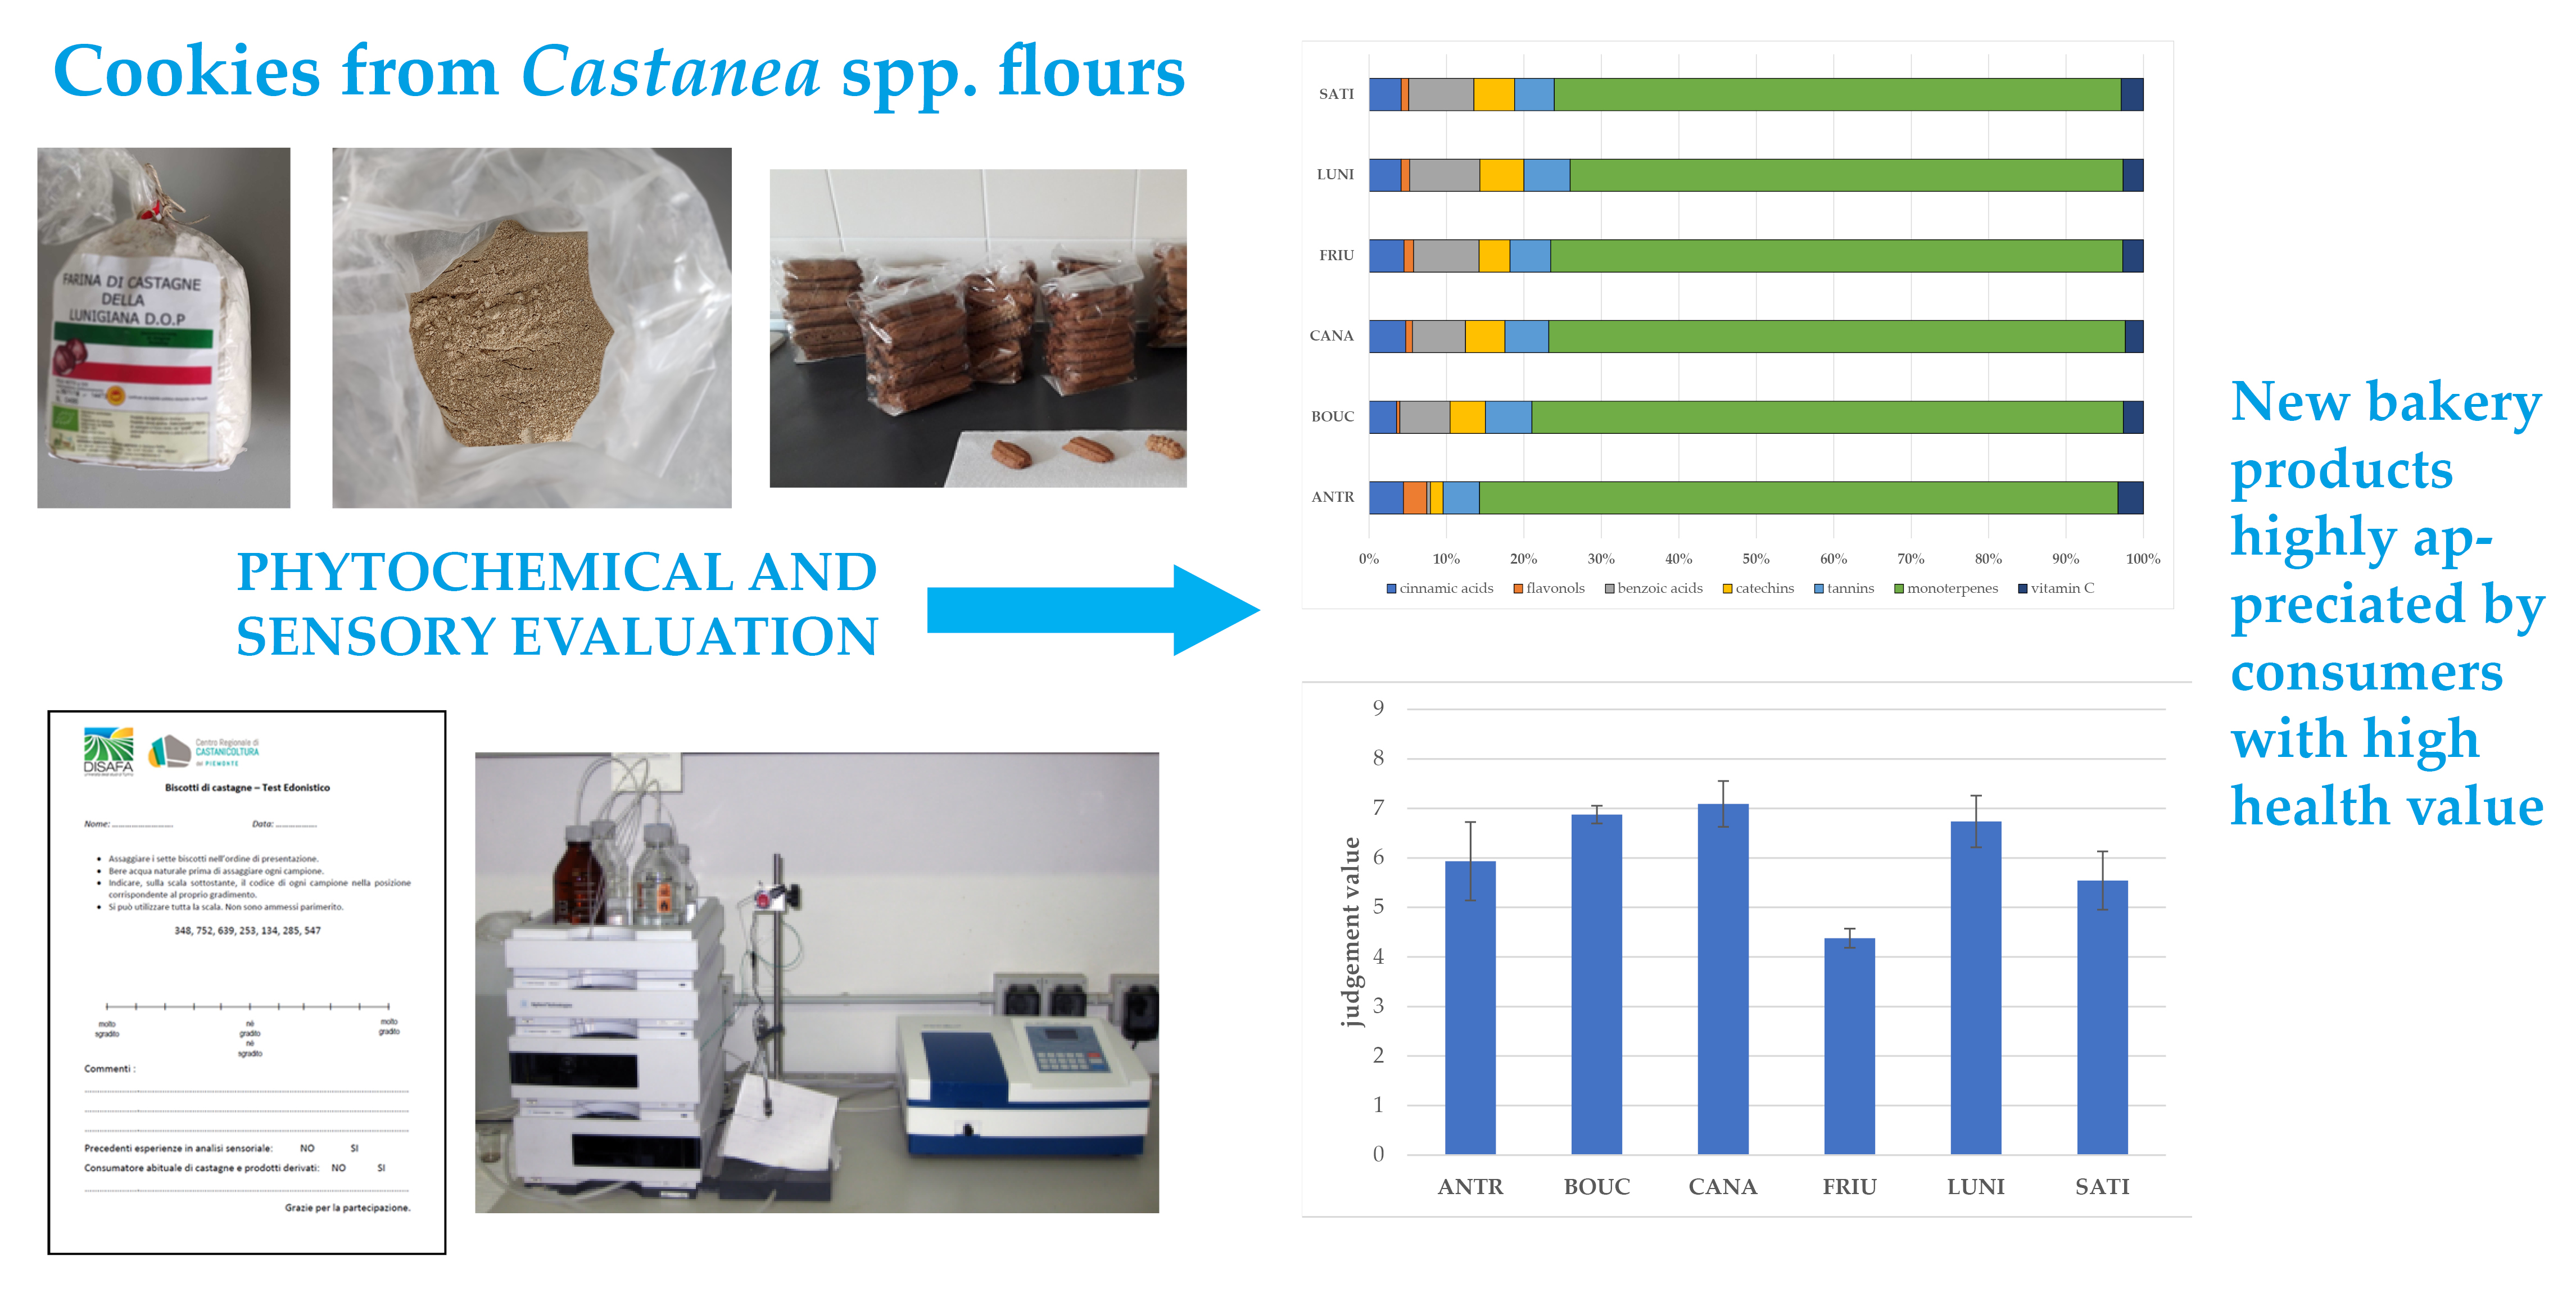
Integrating Traditional Wheat-Based Foods with High Health Value Flours: Castanea spp. Agro-Biodiversity in Bakery Products

by
Dario Donno
1,2,*,
Michele Fabro
3,
Maria Gabriella Mellano
1,2,
Giovanni Gamba
1,2,
Annachiara Fioccardi
1,2 and
Gabriele Loris Beccaro
1,2
1
Department of Agriculture, Forestry and Food Science, University of Torino, Largo Braccini 2, 10095 Grugliasco, TO, Italy
2
Chestnut R&D Center—Piemonte, Regione Gambarello 23, 12013 Chiusa di Pesio, CN, Italy
3
Agenzia Regionale per lo Sviluppo Rurale (ERSA), Via del Monte Santo, 17, 34170 Gorizia, GO, Italy
*
Author to whom correspondence should be addressed.
Agriculture 2022, 12(7), 946; https://doi.org/10.3390/agriculture12070946
Submission received: 24 May 2022 / Revised: 22 June 2022 / Accepted: 27 June 2022 / Published: 30 June 2022

Abstract

:
In European countries, the utilisation of chestnut flours (CF) has been increasing in the bakery industry because the CF ingredients provide not only nutritional and health benefits but also improve organoleptic and health-promoting properties. This work aimed to describe the phytochemical properties and antioxidant capacity of chestnut flours from different Castanea spp. genotypes and origins, studying the effects of the addition of CF to traditional wheat-based cookies on their quality and sensory traits. Commercial chestnut flours were also considered. CF used in addition to wheat-based flours may increase the quality and health-promoting value of bakery products for its many benefits: (i) nutritional and phytochemical value; (ii) zero-Km availability in many producing areas (Europe, Asia, Australia, and North and South America); (iii) for these areas, food security is connected to a vulnerable wheat-based food system. Chromatographic and spectroscopic methods were utilised to assess the composition and antioxidant properties of the considered chestnut flours. The sensory value of the prepared chestnut/wheat-based cookies was also assessed by a panel of common consumers (hedonistic test by a 9-points hedonistic scale). Monoterpenes were the main substances in the flour phytocomplex, reaching 80–90% of the total, followed by phenolics (8–12%) and vitamin C in trace (1–3%). Antioxidant capacity ranged from 9.64 ± 0.96 mmol Fe+2 kg−1 DW (BOUC flour from cv Bouche de Bétizac) to 17.33 ± 1.35 mmol Fe+2 kg−1 DW (CANA flour from cv Canalutta). In this research study, the cookies derived from CANA and BOUC flours were considered the most appreciated products by consumers, with values of 7.09 ± 0.46 and 6.88 ± 0.18, respectively. These results confirmed that integrating phytochemical data with sensory results is very important for food industries to obtain a complete description of the analysed flours and consequently of the derived products to produce new bakery products highly appreciated by consumers with high health value in comparison to the traditional products.

Graphical Abstract

1. Introduction

Chestnuts have been an important and popular food product for centuries, often used instead of wheat in many traditional common foods in different countries, thanks to their specific nutritional properties and quality. Chestnuts present several nutritional and health-promoting molecules such as carbohydrates (34.0 g/100 g), polysaccharides (9.6 g/100 g), starch (24.4 g/100 g), high-quality dietary fibres (7.3 g/100 g), vitamins (B1, B2, C, and E with a concentration of 0.1 mg/100 g, 0.3 mg/100 g, 23.0 mg/100 g, and 1.2 mg/100 g, respectively), polyphenols (50–150 mg/100 g), proteins with essential amino acids (3.2 g/100 g), fatty acids (2.0 g/100 g), and macro/microelements (sodium, potassium, phosphorus, iron, chlorine, and magnesium with a concentration of 9.0 mg/100 g, 395.0 mg/100 g, 70.0 mg/100 g, 1.5 mg/100 g, 10.0 mg/100 g, and 45 mg/100 g, respectively) [1,2]. For this reason, chestnut consumption has been associated with many potential health benefits (e.g., antioxidant capacity, antitumour activity, antimalarial and antimicrobial effects) [3,4].
A light-coloured flour (chestnut flour—CF) is produced from chestnuts dried in a hot-air flow for several hours. Chestnuts are often attacked by fungi during transportation and storage. Processing fresh chestnuts into flour may minimise losses because the CF can be stored at room temperature for several months or several years at 4 °C [5]. CF may also be used in addition to or instead of rye or wheat flour to produce several products (e.g., cookies, flakes, bread, pasta, snacks, etc.) that may be consumed by celiac, hypercholesterolemic, or cereal-allergic people. In European countries, commercial CF usage has been increasing in the bakery industry because the CF ingredients provide not only nutritional and health benefits but also improve organoleptic and health-promoting properties [6]. In the first step of producing CF, chestnuts are separated in relation to their size, cleaned, and water-immersed for 1 day. They are then easily peeled from shells and episperm. Drying ovens are used to dry chestnuts at low temperatures to not affect the nutritional value of the nuts. Following the chestnut drying, the cooling process is carried out at room temperature. Chestnuts are then ground to a fine powder, and flour is stored under normal conditions (4 °C) [7]. The CF biochemical composition is very close to that of many cereals. CF shows high starch values (50–60%), high sugar (20–32%) and protein contents (about 6%), essential amino acids (4–7%), low fat amounts (2–4%), and dietary fibres (4–10%). It is also rich in vitamins (C, B-group, and E) and mineral elements (phosphorus, iron, magnesium, and potassium) [8,9].
Chestnut flour can be utilised by persons with celiac disease thanks to being gluten-free and its nutritional properties. The utilisation of CF shows positive effects because most gluten-free food products lack B-group vitamins, fibres, and iron. CF can be used to produce high-quality gluten-free wafers by mixing rice–chestnut, rice–buckwheat, and rice–corn flour flours at different rates [10]. Additionally, it can be used in gluten-free bread preparation thanks to its nutritional and health-promoting value-enhancing effects [8]. Chestnut flour can be applied as a functional ingredient in snacks and bakery products; the addition of CF to cereal-based food items may increase some nutritional substances and health-promoting agents (B-group vitamins, vitamin E, high dietary fibre, γ-aminobutyric acid, lysine, etc.), sensory properties, and physical traits (colour, density, texture) [11].
Cookies are widespread and broadly consumed in developed countries. Traditionally, cookies are derived from three main ingredients: fat, sugar, and wheat flour. These components are mixed with other minor elements to form a dough. The main traits that affect cookie quality are flavour, appearance, and texture. Thanks to its potential positive health effects and nutritional quality, CF is suitable for health-promoting cookies formulation. The effect of the CF functional traits on consumer acceptability and quality is very high, but information on the phytochemical and sensory properties of chestnut flour is still limited [6].
This preliminary work aimed to describe the phytochemical properties, antioxidant capacity, and bioactive compound composition of chestnut flours from different Castanea spp. genotypes and origins studying the effects of the addition of CF to traditional wheat-based cookies on their quality and sensory traits. Commercial flours were also considered in comparison to the experimental ones. Chromatographic and spectroscopic analytical strategies were utilised to assess the composition and antioxidant properties of the considered chestnut flours. Different bioactive compounds and nutritional substances were considered as markers to evaluate the potential health-promoting and nutritional properties of the chestnut flours. The sensory acceptance of the prepared chestnut/wheat-based cookies was also assessed by a panel of common consumers (hedonistic test).
The present preliminary research may support the potential use of Castanea spp. flour to partially integrate wheat flour in the cookie formulation; CF may be an excellent ingredient with high amounts of phytochemicals and relative antioxidant properties to add to traditional wheat-based cookies for the human diet. Indeed, CF used in addition to wheat-based flours may increase the quality and health-promoting value of bakery products for its many benefits: (i) nutritional and phytochemical value; (ii) zero-Km availability in many producing areas in the world (Europe, Asia, Australia, and North and South America); (iii) for these areas, food security connected to a vulnerable wheat-based food system. Finally, the utilisation of chestnut flours in food products could be an important development to produce innovative and consumer-appreciated bakery products with a high health-promoting value in relation to traditional products.

2. Materials and Methods

2.1. Plant Material and Preparation of Chestnut Flours

The samples of Castanea spp. fruit used to produce the chestnut flours were collected in 2021 from two different regions of Italy (Piemonte and Friuli Venezia Giulia). Fresh chestnuts were manually peeled to separate the kernel from the shell. Raw nuts were reduced into small pieces and then dried in an oven (WIPA, Stadtlohn, Germany) at 50 °C for 48 h. Dried chestnut pieces were finally ground to a fine powder by an automatic grinder (Moulinex 505–180 W, Groupe SEB, Écully, France) and sealed in plastic bags. Two commercial flours from two other Italian regions (Toscana and Lazio) were also considered for the study.
The origin and identification codes of the used materials are listed in Table 1. Three replications (n = 3) were used for each sample.

2.2. Extraction Protocols

All the used reagents and chemicals are reported in Supplementary Materials. The extraction of phenolics was performed using a mixture of methanol: water: 37% HCl at a 95:4.5:0.5 (v/v/v) ratio. A polytetrafluoroethylene (PTFE) membrane microfilter (0.45 μm pore size) was used to filter the methanolic extracts that were then stored for the next days at 95% RH and 4 °C (normal atmosphere).
Organic acids, sugars, and monoterpenes were extracted using a 95% ethanol solution. Preparations were then stored as previous extracts until analysis.
Dehydroascorbic (DHAA) and ascorbic (AA) acids were extracted with a specific extraction solution; it was composed of 4 mmol·L−1 sodium fluoride, 2 mmol·L−1 ethylenediaminetetraacetic acid disodium salt—EDTA, 0.1 mol·L−1 citric acid in a 5:95 (v/v) methanol-water solution. A solution of o-Phenylenediamine (OPDA) (18.8 mmol·L−1) was mixed (250 μL) with 750 μL of the extracted preparations to derivatise DHAA into a fluorophore, 3-(1,2-dihydroxy ethyl) furo(3,4-b) quinoxaline-1-one (DFQ).

2.3. Spectrophotometric Analysis

The Total Polyphenolic Content (TPC) was evaluated according to the Folin–Ciocalteu colourimetric method [12], and mg of gallic acid equivalents (GAE) per 100 g of dried weight (DW) was utilised to express the results.
Antioxidant capacity (AOC) was assessed by the FRAP assay (Ferric Reducing Antioxidant Power test) [13], and mmol of Fe2+ equivalents per kilogram of DW was used to express the results.
Absorbance at 760 nm (for TPC) and 595 nm (for AOC) was recorded by a UV/Vis spectrophotometer (1600-PC, VWR International, Milano, Italy).

2.4. Chromatographic Analysis

A High-Performance Liquid Chromatograph (HPLC, Agilent 1200 series), equipped with a manual injection valve (20 μL sample loop) and a quaternary pump, was used for the analysis; the instrument was coupled to a UV-Vis diode array detector (Agilent Technologies, Santa Clara, CA, USA).
Six different chromatographic methods were utilised for the analysis of chestnut flours. Chromatographic separations were performed by a Kinetex—C18 column (4.6 × 150 mm, 5 μm, Phenomenex, Torrance, CA, USA) and a SphereClone—NH2 column (4.6 × 250 mm, 5 μm, Phenomenex, Torrance, CA, USA). Different HPLC strategies were carried out for the flour analysis according to the conditions described and previously validated by other studies [14,15,16], with few modifications. The external standard calibration method was utilised for quantitative analyte determinations. Then, mg·100 g−1 of DW was used to express all the results, except the content of sugars that was reported as g·100 g−1 of DW). The chromatographic conditions of all the analytical methods are reported in Table S1 in the Supplementary Materials.

2.5. Cookie Preparation

Chestnut flours were then used by the commercial food company Omero Agroalimentare (Ormea, Cuneo, Italy) to prepare cookies. The recipe was selected among the standard formulas normally utilised by the company to highly valorise the chestnut aroma; for this reason, a recipe with no added flavourings and a minimum of other ingredients was used. Specifically, the ingredients were: wheat type 1 flour (21%), butter (18%), raw cane sugar (18%), chestnut flour (33%), eggs (4%), buckwheat flour (5%), and yeast (1%). The percentage of each ingredient is referred to as the total weight. The cookies were packaged in 250 g bags containing about 35–40 elements, then used for the hedonistic sensory test.

2.6. Hedonistic Analysis

Forty (40) untrained panellists (used conditions: 50:50 for gender ratio: and 20–60-year-old for age range:) were provided with six coded cookie samples. Water was utilised for cleaning the palate after each evaluation. Consumers were asked to assess the acceptance of the tested cookies and highlight the samples they preferred using a 9-point hedonic scale; their evaluation was reported in terms of the degree of liking/disliking (from dislike extremely to like extremely) [17]. The mean values for all the chestnut flours were then calculated. The hedonic scale points were then divided into three categories (1–3 for “dislike”; 4–6 for “neither dislike nor like”; 7–9 for “like”) to assess the frequencies related to the consumer judgment for the cookies derived from each chestnut flour.

2.7. Data Analysis

A one-way analysis of variance (ANOVA) was performed on nutraceutical and hedonistic data of the six samples, and the mean values were compared with Tukey’s HSD posthoc comparison test (n = 3) [18]. Pearson’s coefficient (r) was utilised for the evaluation of the correlation between hedonistic and phytochemical results [18].
A first principal component analysis (PCA) [18,19] was performed on the result matrix that included 18 rows (6 samples with 3 analytical repetitions) and 11 fields, each one representing a variable. These variables included the TPC, the AOC, and the content of 9 phytochemical classes. The second PCA was applied to the matrix of data that included 18 rows (6 samples with 3 analytical repetitions) and 31 fields, each one representing a single variable (TPC, AOC, and each detected bioactive molecule). For each PCA, the Kaiser–Meyer–Olkin index (KMO) and Bartlett’s test of sphericity (BTS) were performed from the result matrix [18,19]. This matrix was centred column-wise and then scaled, and the relative values were transformed into Z-scores [20]. The minimum principal components (PCs) number with at least 50% of the total variance was considered. Varimax rotation of the PCs was applied [18,19]. The correlation between the original variables and the obtained PCs was evaluated by the plots that presented the loadings of each phytochemical compound/class in the plane PCs of [18,19].
IBM SPSS Statistics 22.0 (IBM, Armonk, NY, USA) and Minitab 18.1 (State College, PA, USA), two statistical software packages, were applied for ANOVA and PCA. The significance threshold was considered at 5% for each statistical test.

3. Results and Discussion

The nutritional and phytochemical profile (sugars, organic acids, vitamin C, monoterpenes, and polyphenols) together to the assessment of the antioxidant capacity of chestnut flours from different Castanea spp. genotypes (C. sativa and C. sativa × C. crenata) and origins (Piemonte, Lazio, Toscana, and Friuli-Venezia Giulia Regions) were defined by phytochemical analysis [3,21]. The sensory acceptance of the cookies prepared with the addition of the considered chestnut flours to wheat one was also assessed by a hedonistic test.

3.1. Total Polyphenolic Content and Antioxidant Capacity

The mean total polyphenolic content (TPC) and antioxidant capacity (AOC) values are reported in Figure 1 and Figure 2.
TPC amounts significantly varied from 55.37 ± 2.72 mgGAE 100 g−1 DW for the CANA flour (cv Canalutta) to 87.47 ± 2.46 mgGAE 100 g−1 DW for the LUNI flour (mix of cv Bresciana, cv Carpinese, and cv Rossola) (Figure 1) in agreement with other studies [5,22,23,24] that showed TPC values ranging from 50 to 140 mgGAE 100 g−1 DW. The highest contents of total phenolics were observed for the flour derived from a mix of C. sativa cultivars (Piemonte Region) and the commercial flours from Lazio and Toscana.
Antioxidant capacity (AOC by FRAP assay) showed significant statistical differences (p < 0.05) among the flours with a level trend slightly different from the TPC one. AOC ranged from 9.64 ± 0.96 mmol Fe+2 kg−1 DW (BOUC flour from cv Bouche de Bétizac) to 17.33 ± 1.35 mmol Fe+2 kg−1 DW (CANA flour from cv Canalutta), as shown in Figure 2, in accordance with other studies [23,25] that showed AOC values ranging from 9 to 20 mmol Fe+2 kg−1 DW. Previous preliminary studies presented the same phytochemical analysis on the same chestnut genotypes, cultivation areas, or used agro-techniques and showed results similar to the present study [3,23,24,26]. For this reason, some differences with other previous studies may be due to the differences in the agronomic and environmental conditions and genotypes as well as the analytical methods used for the quantification [5].
These results showed that chestnut flours from different genotypes could be considered a potentially good source of phenolic active substances, with an excellent antioxidant capacity, as also shown by several studies [1,9,23]. The accordance with previous research works was very important because it positively confirmed the high health-promoting value of chestnut flour, regardless of plant material genotype and origin, and the analytical approach used as a strategy for evaluating derived products integrated with CF. Enrichment of bakery products (e.g., cookies, pasta, bread, cake, breakfast cereals, etc.) poor in bioactive compounds by the addition of phytochemical items derived from CFs may improve the health-promoting properties of these products [8]. In any case, it is very difficult to assess the real contribution of every single biomolecule to total antioxidant properties due to the “phytocomplex” effect, a combination of synergistic and additive biological effects among the different substances and molecules) [27]. The “phytocomplex” effect may support the statistical differences in the AOC values among the different flours [3,16]; therefore, CFs with the highest contents of TPC (and vitamin C) did not always present the highest AOC (e.g., LUNI and SATI flours).

3.2. Phytochemical Composition and Nutritional Properties

The chemical profile of the tested flours characterised 30 phytochemical markers by HPLC-DAD (Table S2, Supplementary Materials). The biologically active molecules were grouped into the following three classes: vitamin C, monoterpenes, and polyphenols (as the sum of benzoic acids, catechins, cinnamic acids, flavonols, and tannins). Mean values were considered to evaluate the influence of each class on the whole phytocomplex (Figure 3).
Monoterpenes, recognised for their anti-inflammatory activity and anti-tumour capacity [28,29], were the main substances in the flour phytocomplex, reaching 80–90% of the total, followed by phenolics (8–12%), characterised by anti-bacterial properties, antioxidant capacity, and anti-tumour activity [30,31,32], and vitamin C in trace (1–3%). The highest amounts of monoterpenes were quantified in FRIU and CANA flours (about 1490 mg·100 g−1 DW and 1440 mg·100 g−1 DW, respectively), two C. sativa flours from Friuli-Venezia Giulia Region, while the highest values of phenolics were detected in the LUNI flour (about 135 mg·100 g−1 DW), a commercial C. sativa flour from Toscana Region. The highest levels of vitamin C were again observed in FRIU flour (about 15 mg·100 g−1 DW), as shown in Table 2.
In the phenolic class, differences were identified among flours derived from different chestnut genotypes, but most of the samples showed similar phenolic levels. Benzoic acids and cinnamic acids (expressed as phenolic acids), and tannins were the most abundant classes in this group (40–50% and 20–30%, respectively), followed by catechins (15–20%), as shown in Figure 4. Flavonols were observed in low levels (<5%). The ANTR sample, a commercial C. sativa (cv Marrone Antrodocano) flour from Lazio, showed a different phenolic composition in relation to the other flours (e.g., high levels of cinnamic acids and flavonols and low quantities of benzoic acids and catechins).
Chlorogenic and coumaric acids were detected in each analysed flour in good quantities (mean values of about 14 mg·100 g−1 DW and 7 mg·100 g−1 DW, respectively); in particular, the FRIU flour showed a value of 15.29 ± 1.52 mg·100 g−1 DW for chlorogenic acid, while CANA flour presented a value of 8.18 ± 2.06 mg·100 g−1 DW for coumaric acid. Ferulic acid and caffeic acid were quantified in all the chestnut flours, although at low levels (<2 mg·100 g−1 DW). Similarly to previous studies [3,23], ellagic acid was the most important phenolic acid in FRIU, LUNI, and SATI flours (about 40–45 mg·100 g−1 DW), while gallic acid presented discrete contents in the considered flours, except for CANA sample which contained trace amounts (about 0.5 mg·100 g−1 DW). The lowest values of benzoic acids (<2 mg·100 g−1 DW) characterised the ANTR flour. Phenolic acids are very important molecules in human health and nutrition in relation to many biological activities and properties, such as anti-inflammatory and anticancer activities, anti-atherosclerotic, antihepatotoxic, and anti-HIV replication capacities [33].
Tannins were the second most abundant phenolic class in the analysed chestnut flours, with great variability in the results. The BOUC sample, a C. sativa × C. crenata flour (cv Bouche de Bétizac from Piemonte Region), presented higher tannin levels (36.34 ± 4.88 mg·100 g−1 DW) than other flours (in particular, if compared to ANTR and SATI samples), as shown by Tukey’s test (p < 0.05), which included BOUC flour in a separate statistical group (Table 2). Except for BOUC flour (the highest value) and the ANTR and SATI samples (the lowest values), all the other CFs showed tannin contents between 29 and 30 mg·100 g−1 DW. They were classified by the posthoc Tukey test in a separate statistical group (p < 0.05). The good tannin amounts found in all the analysed samples increase the health-promoting properties of chestnut flours since these compounds are free radical quenchers [34].
The catechin class was mainly represented by catechin (about 10–20 mg·100 g−1 DW) except for ANTR and CANA flours that showed higher values of epicatechin (about 7–16 mg·100 g−1 DW). In particular, regarding epicatechin, CANA flour was included in a separate statistical group in relation to the other samples. At the same time, the levels of catechin showed relevant amounts of this molecule except for ANTR flour (about <0.5 mg·100 g−1 DW), as shown by Inkaya et al. [22]. The detection of catechins is an excellent result to hypothesize the utilisation of chestnut flours as a functional ingredient in bakery products because they are involved in several biological activities such as the inhibition of (i) human cancer cell line proliferation, (ii) lipid peroxidation, and (iii) cyclooxygenase enzymes [35].
Quercetin was not detected in any of the analysed flours, and the other flavonols only occurred at trace levels (<3–4 mg·100 g−1 DW), except in ANTR flour, which presented an isoquercitrin value of 11.93 ± 1.57 mg·100 g−1 DW. The most representative flavonols for all the chestnut flours were hyperoside and quercetin. ANTR flour showed the highest flavonol content (14.36 ± 1.82 mg·100 g−1 DW), followed by FRIU flour (6.95 ± 0.16 mg·100 g−1 DW), and LUNI sample (5.67 ± 0.75 mg·100 g−1 DW), while BOUC flour presented the lowest value (<3 mg·100 g−1 DW). This polyphenolic class is important for inhibiting in vitro oxidation of low-density lipoproteins and quenching active oxygen species [36].
Ascorbic and dehydroascorbic acids were considered to evaluate vitamin C content due to their synergistic and additive biological activity in humans, as reported in other studies [16,37,38]. The maximum level of vitamin C was observed in the ANTR, BOUC, and FRIU flours (about 15–16 mg·100 g−1 DW), followed by SATI sample (about 14 mg·100 g−1 DW), while the minimum value was quantified in CANA flour (about 12 mg·100 g−1 DW). In any case, no statistical differences were observed among the several considered chestnut flours. These results were similar to the amounts (5–20 mg·100 g−1 DW) reported in De Biaggi et al. (2018) [23].
Significant differences (p < 0.05) in sugar content and organic acid levels were observed in the analysed CFs. Mean values of organic acids and sugars for each flour are reported in Table 3.
High amounts of organic acids were quantified in flours from Friuli-Venezia Giulia, in particular, FRIU (1486.90 ± 34.60 mg·100 g−1 DW) and CANA (1439.50 ± 16.20 mg·100 g−1 DW), while the ANTR flour presented the lowest levels (481.80 ± 6.86 mg·100 g−1 DW). Citric and quinic acids were the most abundant organic acids in the tested chestnut flours, with high values in CANA for citric acid (741.19 ± 10.14 mg·100 g−1 DW) and FRIU for quinic acid (507.20 ± 35.20 mg·100 g−1 DW), followed by succinic acid (maximum value of 138.87 ± 16.83 mg·100 g−1 DW in FRIU flour), as reported by similar studies [39,40] that showed a total content of 300–600 mg·100 g−1 DW. Tartaric acid was not detected in the analysed flours, while malic and oxalic acids were identified only in CANA, FRIU, LUNI, and SATI samples (Table 3). These compounds are very important components in chestnut flours because they are considered positive for human health thanks to their antioxidant properties [8]. Tukey’s test showed significant statistical differences (p < 0.05) in the composition of the considered organic acids among the several flours, leading to the characterisation of different statistical groups composed of one or a few substances. This result may be caused by the differences due to the genetic factors, but because these molecules are volatile compounds, the results could also be influenced by other factors, such as the applied drying technique and the extraction method [41].
The highest sugar levels were detected in CANA and FRIU flours (about 12 g·100 g−1 DW). In comparison, the average values of the other flours ranged from about 5 g·100 g−1 DW to about 7 g·100 g−1 DW, lower than some previous research [42,43] that presented values of 12–14 g·100 g−1 DW. However, other studies presented sugar (especially glucose, sucrose, and fructose) levels of chestnut flours varying between 9% and 23% [11], similar to the results of the present research. Flours from Friuli-Venezia Giulia showed significant statistical differences in relation to the other samples, as shown by Tukey’s test (Table 3). Sucrose showed the highest levels among the considered sugars in many analysed CFs, including CANA, FRIU, and BOUC flours (about 2–7 g·100 g−1 DW). Moreover, all the samples presented higher values of fructose than glucose, as already observed in previous studies [3,23]. The higher levels of fructose in relation to the glucose may be very critical to identifying chestnut flours as a potential active ingredient for type-2 diabetic consumers because fructose presents a lower glycaemic index than glucose; for this reason, the postprandial glycaemic peak derived from fructose and the insulin response is lower than the glycaemic peak and the insulin concentration derived from glucose [44].

3.3. Multivariate Analysis

Health-promoting effects derived from the consumption of chestnuts and derived products as flours are due to the additive and synergistic interaction of phytochemicals rather than the action of every single compound [45]. For this reason, molecules were grouped in phytochemical classes for multivariate data analysis (PCA_1). Selected variables included the nine chemical classes, BA (benzoic acids), CA (cinnamic acids), CT (catechins), FL (flavonols), MT (monoterpenes), OA (organic acids), SU (sugars), TA (tannins), and VC (vitamin C), together to AOC (antioxidant capacity) and TPC (total polyphenol content). Bartlett’s test of sphericity (p < 0.05) showed significant statistical collinearity among variables. The KMO index showed a level of 0.72. The two principal components accounted for 65.64% of the total variance (43.13% explained by PC1 and 22.51% by PC2). The score plot shows the six samples (mean values derived from three repetitions for each flour) in the PCs plane in accordance with nutraceutical traits and chemical composition (Figure 5).
PCA score plot highlighted as CANA, FRIU, LUNI, and SATI samples (flours belonging to the same chestnut species) presented similar traits according to the phytochemical and nutritional results (Figure 5), and they constituted a single statistical group, while ANTR (derived from ‘marrone’ chestnut type) and BOUC (derived from ‘hybrid’ chestnut type) were characterised in two other single groups. In this case, the differences among samples may be due to the “genotype” factor, as shown in other studies [3,23]. PCA loading plot presented an association between TPC, phenolic (cinnamic and benzoic), and organic acids, catechins, flavonols, and PC1, and a correlation between AOC, monoterpenes, and PC2 (Figure 6). Vitamin C, sugars, and tannins were shown in an intermediate position.
Most polyphenolic classes associated with PC1 were identified as biologically active groups with the most discriminating power among the considered genotypes; these phytochemical groups included biomarkers with statistical differences (p < 0.05) in their contents among the different flours. Moreover, tannins, monoterpenes, and organic acids, molecules with important effects on flour sensory properties, also confirmed a positive discriminating power among CFs. For this reason, all these chemical classes may be considered the most important biomarkers for building a discriminant model among flours derived from different chestnut genotypes, but this hypothesis should be confirmed by further studies.
A second PCA (PCA_2) was performed using the single bioactive compounds and nutritional substances as variables. Bartlett’s test of sphericity (p < 0.05) showed significant statistical collinearity among all the variables. The KMO index presented a level of 0.75. The PCA generated two PCs which represented 58.31% of the total variance, 40.76% explained by PC1 and 17.55% by PC2. The six samples (expressed as mean values from three repetitions for each flour) were placed in the PCs plan in relation to their phytochemical composition and nutraceutical properties, as indicated in the score plot (Figure 7).
PCA score plot highlighted that CANA and FRIU samples (flours coming from the Friuli-Venezia Giulia Region) constituted the same statistical group in accordance with the nutritional and phytochemical data (Figure 7), while ANTR (raw material from Lazio) was characterised in a single group. A third group was constituted by BOUC and SATI from Piemonte and LUNI from Toscana. In this case, the differences among samples may be due to the “origin” factor, as shown in other studies [3,23], except for the case of LUNI flour, whose location in the PC plan could be derived from a high genotype influence (LUNI sample, a C. sativa flour, was near to SATI sample, another C. sativa flour). PCA loading plot presented an association between single phenolic and organic acids and PC1 and a correlation between single monoterpenes and PC2 (Figure 8). However, defining the correlation between single molecules and PCs is more difficult if compared to the same action in PCA_1, where the variables were defined as chemical classes [46].
In this research, a PCA multivariate analysis made it possible to better highlight and confirm the information included in the fingerprints. The PCA classification defined the different flours in relation to the chemical composition (single molecules and classes), providing information on the main chemical markers and classes that may mostly influence the phytocomplex, as already reported by Cirlini et al. [7]. For this reason, the PCAs applied in this research were used to further confirm the relationships among chestnut flours already defined by univariate statistical analysis.
The determination of security and authenticity in fresh foods and derived products is a very important, and sometimes crucial, target in the quality control of food items. Chestnut flours could be subjected to adulteration as they are relatively expensive in relation to the other common flours, as reported in the literature. In previous studies, specific genes in several kinds of cereal and legumes were selected and amplified, and a decision tree was utilised to interpret the data; 12 fraudulent species were identified in chestnut flour by an optimised PCR, highlighting the effectiveness of the method. Experimental conditions were improved to identify an adulteration percentage of 1%, but the adulteration rate should be higher (>10%) to obtain real benefits [47]. This method was similar to the approach developed and used to identify and quantify the common percentage of wheat in pasta [48]. In addition, this approach is expensive and time-consuming. Therefore, it becomes difficult to apply on many samples to be quickly processed for a preliminary screening.
In this research, instead, an approach based on the application of chromatographic analysis coupled with chemometrics for composition assessment of chestnut flours was presented. Different chemical markers (intended as single phytochemicals and general classes) were identified as the variables most useful for the CF discrimination; these substances and groups of compounds may be applied to an accurate CF composition control highlighting differences derived from specific genotypes and origins. As phytochemical results are very complex and more calculations than univariate statistical analysis are necessary to fully evaluate them, a chemometric multivariate approach is crucial. Indeed, chemometrics reduce the data multidimensionality, extracting information on relations among the original variables [49]. Chemometric techniques are very useful with multidimensional data obtained from chromatographic analysis for comparative research on food item composition. The obtained chromatograms are specific fingerprints derived from the phytochemical composition of the analysed food products. Thus, coupling HPLC analysis with chemometric strategies is becoming more and more popular [21]. In the present research, an HPLC—chemometrics-based method was used for the comprehensive CF characterization; indeed, it provided more specific information (identification and quantification of single compounds) if compared to spectrophotometric protocols that provide information only on compounds grouped to phytochemical classes [50]. Moreover, the obtained HPLC chromatograms and UV spectra combined with the multivariate analysis showed a high potential for including much of the information necessary for the determination of statistical differences in the evaluated samples. In the PCs plane, the similarity of the different flours was related to spatial proximity between points [51]. Therefore, CFs derived from similar genotypes and origins were closely located in the PCA plane, and they were defined by a similar phytochemical profile and antioxidant properties. In this study, the combination of chromatographic strategies with multivariate statistical techniques showed a strong potential for time-saving regarding the evaluation of many samples. Compared to PCR procedures used in other studies [47,48], HPLC analysis coupled with PCA was simpler and did not require hard processes for the sample preparation. This preliminary study highlighted as the HPLC phytochemical fingerprint coupled to chemometrics may be intended as a traceability tool to distinguish genotypes by their antioxidant and phytochemical traits, as reported in other works [52,53]. However, more cultivars with different genotypes and origins should be considered in future research to confirm these preliminary results. The recognition of any adulterations and counterfeits with flours derived from different genotypes and/or origins in relation to the declared ones may be very important for industrial companies to produce standardised bakery products such as cookies with stable phytochemical properties and nutritional traits.
The combination of chemometrics and a phytochemical fingerprint may contribute to the evaluation of different bakery products as cookies and be a potential tool to select the best chestnut flour based on the desired properties and traits. In addition, this tool may be utilised to avoid potential involuntary and voluntary contaminations and adulterations. Moreover, this hyphenated technique could also be used to obtain label certifications for the valorisation of specific chestnut flours derived from local genotypes.

3.4. Hedonistic Properties

In this study, a 9-point hedonistic scale was used to evaluate the hedonistic properties of cookies prepared from different chestnut flours. This method was based on a bipolar scale balanced around the central point (point n = 5) with four positive (“like” zone) and four negative (“dislike” zone) categories on each part. These categories were marked by short phrases that represented different degrees of acceptance (extremely, very much, moderately, and slightly dislike/like), suggesting a single continuum of dislikes/likes [17].
In this research, the cookies derived from CANA and BOUC flours were considered the most appreciated products by consumers with values of 7.09 ± 0.46 and 6.88 ± 0.18, respectively (Table 4), while the cookies prepared from FRIU flour were considered the less appreciated (4.38 ± 0.19). The cookies derived from the other flours, including the commercial ones, presented intermediate values (about 5–6).
The used scale produces ordinal data because it is a category scale with ratings limited to nine groups and the labels unequally spaced in terms of distances. Since the results obtained by this method are discrete and categorical without a real 0-point, the statistical analysis that may be used with confidence are limited (e.g., nonparametric statistics). However, many researchers utilise stronger parametric statistics (e.g., analysis of variance) to evaluate data derived from this scale [54]. For this reason, in the present study, the responses of the scale were utilised as points on a continuum and not as discrete and categorical data; parametrical statistics (e.g., analysis of variance) were applied as shown in other studies [17] since they are more sensitive than non-parametric tests.
Limited choices and the categorical nature of this scale are the main reasons for its international acceptance; moreover, it is easy to use for the study researchers and participants in relation to other scaling techniques (e.g., estimation of magnitude). For these reasons, many studies are based on a 9-point hedonic scale without extensive training of participants [55]. As shown in the present study, data handling of this scale is also easier than other methods that could include the evaluation of fractions (e.g., recording estimates of magnitude or measuring lines). Simple category scales (e.g., 9-points hedonistic scale) show a sensitivity similar to other scaling methods (e.g., magnitude estimation and line marking) in relation to discrimination power [56]. Therefore, if the research is mainly aimed at studying the hedonic differences among beverages, foods, and other similar products and predict their acceptance by consumers, the 9-point hedonic scale may be an effective and simple measuring tool, as shown in this study.
However, several limitations have been reported on the 9-point hedonic scale, even if it is widely used in the sensory sciences. For example, this scale can only yield ordinal numbers or interval data because of the lack of a 0-point and its inequality in the scaling intervals. Moreover, the 9-point hedonic scale cannot produce information about ratios of disliking/liking for stimuli nor provide comparisons of hedonic perception among groups and individuals [54]. Since its limited response categories, the used scale does not provide much freedom for participants to widely express their hedonic experiences [55]. Moreover, due to the reduced number of categories available by the participants and their common tendency to not use extreme values, the scale may be influenced by ceiling effects [17,54]. Therefore, a wide sample size, as 40–60 responses per stimulus, is important to approximate normality and obtain good statistical inferences.
To avoid the above-described problems, the nine points of the hedonic scale were divided into three large categories (1–3 for “dislike”; 4–6 for “neither dislike nor like”; 7–9 for “like”) and the frequencies related to the consumer judgment for all the samples were evaluated (Table 5). BOUC and CANA flours showed the highest frequency in the “like” category (65.63% and 63.64%, respectively), while the FRIU sample presented the highest frequency in the “dislike” category (48.28%). ANTR and SATI flours showed the highest frequency in the “neither dislike nor like” category (60.53% and 60.61%, respectively), while the LUNI sample was equally distributed in the “neither dislike nor like” and “like” categories (41.67% and 47.22%, respectively).
Data presented an excellent correlation level, assessed by Pearson’s coefficient (r), between “like” categories and sugar content in the analysed flours (r = 0.73). Monoterpenes also showed a good correlation with the “neither dislike nor like” and “like” categories (r = 0.58 and r = 0.61, respectively), while cinnamic acids presented a positive correlation with the “neither dislike nor like” category (r = 0.63). A high correlation was also detected between the “dislike” category and the chemical classes of organic acids and tannins (r = 0.68 and r = 0.64, respectively). The negative judgement on the FRIU flour may be due to the phytocompounds related to aroma and flavour (e.g., monoterpenes, organic and phenolic acids, tannins, etc.), as shown by the strong correlation between these phytochemical classes and the “dislike” category, but more sensory analysis performed by a panel of trained tasters are necessary to confirm the hypothesis of this preliminary study. In this study, the correlation between phytochemical composition of the considered flours and frequencies related to the consumer judgment for each CF-derived cookie was an important tool to define the flour most appreciated by the consumers to prepare cookies with high sensory and health-promoting properties.
These results confirmed that the integration of phytochemical data with sensory results is very important to obtain a complete description of the analysed flours and consequently of the derived products, as already shown in similar studies [6,57], to produce new bakery products highly appreciated by consumers with high health value in comparison to the traditional products.

4. Conclusions

The research interest in chestnuts and derived products has been increasing in recent years thanks to their excellent nutraceutical and sensory quality, but most of the information is focused on C. sativa. Little information is available on the flour of other species (e.g., C. dentata, C. henryi, and C. crenata) and relative hybrids. This study showed that CF phytochemical composition and sensory properties are much influenced by chestnut genotypes and origins.
In this research, an approach to producing innovative bakery products (cookies based on chestnut/wheat flour) with high health-promoting value was developed as an alternative to traditional products (wheat-based cookies) with a positive impact on the food industries. Indeed, integrating chestnut flours with wheat-based ones may improve phytochemical and sensory quality of bakery products thanks to many benefits derived from chestnuts (e.g., nutritive and health-promoting values, zero-Km source for food items, food security in relation to a wheat-based food system exposed to several issues). The results showed that CF is a good ingredient for cookie production. This research highlighted the finding that chestnut flours from different genotypes may be utilised as an excellent source of phenolics and other phytochemicals (e.g., vitamin C and monoterpenes) to be utilised as an additional ingredient in bakery products (e.g., cookies). This represents an important innovation in the food sector. Results showed that cookies derived from C. sativa flours from Piemonte and Friuli Venezia Giulia presented excellent amounts of health-promoting phenolics, similar to or even higher than the tested commercial flours. The hedonistic test showed that the cookies derived from these flours were highly appreciated by consumers.
The use of chestnut flours from different genotypes in cookies may contribute to the development of different bakery products for the market in terms of improvement of phytochemical value and sensory properties. Moreover, chestnut flour can also be used as an alternative flour additive. The utilisation of Castanea spp. flours, thanks to their excellent nutraceutical and sensory properties, are increasing in the food industry. Chestnut flour can positively affect human health if used in food enrichment due to its phytochemical composition (e.g., polyphenols, vitamin C, and other antioxidant molecules) as well as its high nutritional and antioxidant capacity. Nevertheless, this is only preliminary research to provide the first phytochemical and sensory information in this sector. The newly developed products should be subjected to a more detailed sensory evaluation to confirm their potential commercial applications. Finally, biological research by in vivo/in vitro tests and phytochemical studies by liquid chromatography coupled to mass spectrometry is necessary to integrate these preliminary results.

Supplementary Materials

The following are available online at https://www.mdpi.com/article/10.3390/agriculture12070946/s1, Table S1: Chromatographic conditions of the used methods. Table S2: Chromatographic fingerprint of the analysed chestnut flours.

Author Contributions

Conceptualization, D.D., M.F., M.G.M. and G.L.B.; methodology, D.D. and M.G.M.; validation, D.D.; formal analysis, D.D., M.G.M., G.G. and A.F.; investigation, D.D. and M.G.M.; resources, M.G.M. and M.F.; data curation, D.D. and M.G.M.; writing—original draft preparation, D.D.; writing—review and editing, D.D., M.G.M., G.G. and G.L.B.; supervision, G.L.B.; project administration, G.L.B. and M.F.; funding acquisition, G.L.B. and M.F. All authors have read and agreed to the published version of the manuscript.

Funding

This research was funded by the Agenzia Regionale per lo Sviluppo Rurale del Friuli Venezia Giulia (ERSA), project: “Individuazione, caratterizzazione e propagazione di germoplasma autoctono di Castanea sativa del Friuli-Venezia Giulia”.

Institutional Review Board Statement

Not applicable.

Informed Consent Statement

Not applicable.

Data Availability Statement

Not applicable.

Acknowledgments

The authors thank the Agenzia Regionale per lo Sviluppo Rurale del Friuli Venezia Giulia (ERSA) for providing plant material and the commercial food company Omero Agroalimentare (Ormea, Cuneo, Italy) for preparing cookies.

Conflicts of Interest

The authors declare no conflict of interest.

References

  1. De Vasconcelos, M.D.C.B.M.; Bennett, R.N.; Rosa, E.A.S.; Cardoso, J.V.F. Primary and secondary metabolite composition of kernels from three cultivars of portuguese chestnut (Castanea sativa Mill.) at different stages of industrial transformation. J. Agric. Food Chem. 2007, 55, 3508–3516. [Google Scholar] [CrossRef] [PubMed]
  2. Beccaro, G.; Bounous, G.; De Biaggi, M.; Donno, D.; Marinoni, D.T.; Zou, F.; Mellano, M.G. Botany, anatomy, and nut composition. In The Chestnut Handbook; CRC Press: Boca Raton, FL, USA, 2019; pp. 5–34. [Google Scholar]
  3. Beccaro, G.L.; Donno, D.; Lione, G.G.; De Biaggi, M.; Gamba, G.; Rapalino, S.; Riondato, I.; Gonthier, P.; Mellano, M.G. Castanea spp. Agrobiodiversity conservation: Genotype influence on chemical and sensorial traits of cultivars grown on the same clonal rootstock. Foods 2020, 9, 1062. [Google Scholar] [CrossRef] [PubMed]
  4. De Vasconcelos, M.C.; Bennett, R.N.; Rosa, E.A.; Ferreira-Cardoso, J.V. Composition of european chestnut (castanea sativa mill.) and association with health effects: Fresh and processed products. J. Sci. Food Agric. 2010, 90, 1578–1589. [Google Scholar] [CrossRef]
  5. Zhu, F. Properties and food uses of chestnut flour and starch. Food Bioproc. Technol. 2017, 10, 1173–1191. [Google Scholar] [CrossRef]
  6. Šoronja-Simović, D.; Pajin, B.; Šubarić, D.; Dokić, L.; Šereš, Z.; Nikolić, I.J. Quality, sensory and nutritional characteristics of cookies fortified with chestnut flour. J. Food Proc. Preserv. 2017, 41, e12887. [Google Scholar] [CrossRef]
  7. Cirlini, M.; Dall’Asta, C.; Silvanini, A.; Beghe, D.; Fabbri, A.; Galaverna, G.; Ganino, T. Volatile fingerprinting of chestnut flours from traditional emilia romagna (Italy) cultivars. Food Chem. 2012, 134, 662–668. [Google Scholar] [CrossRef]
  8. Mete, M.; Dülger Altıner, D. Chestnut flour and applications of utilization. Int. J. Food Eng. Res. 2017, 3, 9–16. [Google Scholar]
  9. Durazzo, A.; Turfani, V.; Azzini, E.; Maiani, G.; Carcea, M. Phenols, lignans and antioxidant properties of legume and sweet chestnut flours. Food Chem. 2013, 140, 666–671. [Google Scholar] [CrossRef]
  10. Mir, S.A.; Bosco, S.J.D.; Shah, M.A. Technological and nutritional properties of gluten-free snacks based on brown rice and chestnut flour. J. Saudi Soc. Agric. Sci. 2019, 18, 89–94. [Google Scholar] [CrossRef]
  11. Neri, L.; Dimitri, G.; Sacchetti, G. Chemical composition and antioxidant activity of cured chestnuts from three sweet chestnut (Castanea sativa Mill.) ecotypes from italy. J. Food Compos. Anal. 2010, 23, 23–29. [Google Scholar] [CrossRef]
  12. Slinkard, K.; Singleton, V.L. Total phenol analysis: Automation and comparison with manual methods. Am. J. Enol. Vitic. 1977, 28, 49–55. [Google Scholar]
  13. Benzie, I.F.; Strain, J. Ferric reducing/antioxidant power assay: Direct measure of total antioxidant activity of biological fluids and modified version for simultaneous measurement of total antioxidant power and ascorbic acid concentration. Methods Enzymol. 1999, 299, 15–27. [Google Scholar] [PubMed]
  14. Donno, D.; Mellano, M.G.; Prgomet, Z.; Beccaro, G.L. Advances in ribes x nidigrolaria rud. Bauer and a. Bauer fruits as potential source of natural molecules: A preliminary study on physico-chemical traits of an underutilized berry. Sci. Hortic. 2018, 237, 20–27. [Google Scholar] [CrossRef]
  15. Soifoini, T.; Donno, D.; Jeannoda, V.; Rakotoniaina, E.; Hamidou, S.; Achmet, S.M.; Solo, N.R.; Afraitane, K.; Giacoma, C.; Beccaro, G.L. Bioactive compounds, nutritional traits, and antioxidant properties of artocarpus altilis (parkinson) fruits: Exploiting a potential functional food for food security on the comoros islands. J. Food Qual. 2018; in press. [Google Scholar] [CrossRef] [Green Version]
  16. Donno, D.; Hassani, S.; Sofoini, T.; Mellano, M.G.; Riondato, I.; Gamba, G.; Beccaro, G.L. Traditional foods and sustainable rural development: Exploiting the case of the comoros tea as a potential source of bioactive compounds. Sustainability 2021, 13, 5815. [Google Scholar] [CrossRef]
  17. Lim, J.J. Hedonic scaling: A review of methods and theory. Food Qual. Pref. 2011, 22, 733–747. [Google Scholar] [CrossRef]
  18. Crawley, M. The R Book, 2nd ed.; John Wiley & Sons: Chichester, UK, 2013. [Google Scholar]
  19. Field, A. Discovering Statistics Using IBM Spss Statistics; Sage: Newbury Park, CA, USA, 2013. [Google Scholar]
  20. Dinç, İ.; Sigdel, M.; Dinç, S.; Sigdel, M.S.; Pusey, M.L.; Aygün, R.S. Evaluation of normalization and pca on the performance of classifiers for protein crystallization images. In Proceedings of the IEEE SOUTHEASTCON 2014, Lexington, KY, USA, 13–16 March 2014; pp. 1–6. [Google Scholar]
  21. Donno, D.; Mellano, M.G.; Gamba, G.; Riondato, I.; Beccaro, G.L. Analytical strategies for fingerprinting of antioxidants, nutritional substances, and bioactive compounds in foodstuffs based on high performance liquid chromatography–mass spectrometry: An overview. Foods 2020, 9, 1734. [Google Scholar] [CrossRef]
  22. Inkaya, A.N.; Gocmen, D.; Ozturk, S.; Koksel, H. Investigation on the functional properties of chestnut flours and their potential utilization in low-fat cookies. Food Sci. Biotechnol. 2009, 18, 1404–1410. [Google Scholar]
  23. De Biaggi, M.; Rapalino, S.; Donno, D.; Mellano, M.G.; Beccaro, G.L. Genotype influence on chemical composition and sensory traits of chestnut in 18 cultivars grown on the same rootstock and at the same agronomic conditions. In Proceedings of the VI International Chestnut Symposium 1220, Samsun, Turkey, 9–13 October 2018; pp. 215–220. [Google Scholar]
  24. Mellano, M.G.; Donno, D.; Sabrina, R.; Beccaro, G.L. Fingerprint chimico e sensoriale dei frutti di 18 cultivar di castanea sativa ed ibride euro-giapponesi innestate su portinnesto clonale. In Proceedings of the VII CONVEGNO NAZIONALE CASTAGNO, Napoli, Italy, 14–16 September 2020; pp. 200–204. [Google Scholar]
  25. Torra, M.; Belorio, M.; Ayuso, M.; Carocho, M.; Ferreira, I.C.; Barros, L.; Gómez, M.J.F. Chickpea and chestnut flours as non-gluten alternatives in cookies. Foods 2021, 10, 911. [Google Scholar] [CrossRef]
  26. Fabro, M.; Raso, R.; Donno, D.; Riondato, I.; Beccaro, G.L. Il germoplasma di c. Sativa in friuli venezia giulia: Nuovi ritrovamenti e strategie regionali di valorizzazione della filiera. In Proceedings of the VII CONVEGNO NAZIONALE CASTAGNO, Napoli, Italy, 14–16 September 2020; pp. 77–82. [Google Scholar]
  27. Donno, D.; Mellano, M.G.; De Biaggi, M.; Riondato, I.; Rakotoniaina, E.N.; Beccaro, G.L. New findings in prunus padus l. Fruits as a source of natural compounds: Characterization of metabolite profiles and preliminary evaluation of antioxidant activity. Molecules 2018, 23, 725. [Google Scholar] [CrossRef] [Green Version]
  28. Gould, M.N. Cancer chemoprevention and therapy by monoterpenes. Environ. Health Perspect. 1997, 105, 977. [Google Scholar] [PubMed]
  29. De Cassia da Silveira e Sa, R.; Andrade, L.N.; de Sousa, D.P. A review on anti-inflammatory activity of monoterpenes. Molecules 2013, 18, 1227–1254. [Google Scholar] [CrossRef]
  30. Link, A.; Balaguer, F.; Goel, A. Cancer chemoprevention by dietary polyphenols: Promising role for epigenetics. Biochem. Pharmacol. 2010, 80, 1771–1792. [Google Scholar] [CrossRef] [Green Version]
  31. Chiva-Blanch, G.; Visioli, F. Polyphenols and health: Moving beyond antioxidants. J. Berry Res. 2012, 2, 63–71. [Google Scholar] [CrossRef] [Green Version]
  32. Donno, D.; Mellano, M.G.; Riondato, I.; De Biaggi, M.; Andriamaniraka, H.; Gamba, G.; Beccaro, G.L. Traditional and unconventional dried fruit snacks as a source of health-promoting compounds. Antioxidants 2019, 8, 396. [Google Scholar] [CrossRef] [PubMed] [Green Version]
  33. Landete, J.M. Ellagitannins, ellagic acid and their derived metabolites: A review about source, metabolism, functions and health. Food Res. Int. 2011, 44, 1150–1160. [Google Scholar] [CrossRef]
  34. Ammar, I.; Ennouri, M.; Bouaziz, M.; Ben Amira, A.; Attia, H. Phenolic profiles, phytchemicals and mineral content of decoction and infusion of opuntia ficus-indica flowers. Plant Food Human Nutr. 2015, 70, 388–394. [Google Scholar] [CrossRef]
  35. Seeram, N.P. Berry fruits: Compositional elements, biochemical activities, and the impact of their intake on human health, performance, and disease. J. Agric. Food Chem. 2008, 56, 627–629. [Google Scholar] [CrossRef]
  36. Del Rio, D.; Rodriguez-Mateos, A.; Spencer, J.P.; Tognolini, M.; Borges, G.; Crozier, A. Dietary (poly) phenolics in human health: Structures, bioavailability, and evidence of protective effects against chronic diseases. Antioxid. Redox Signal. 2013, 18, 1818–1892. [Google Scholar] [CrossRef] [Green Version]
  37. De Biaggi, M.; Donno, D.; Mellano, M.G.; Riondato, I.; Rakotoniaina, E.N.; Beccaro, G.L. Cornus mas (L.) fruit as a potential source of natural health-promoting compounds: Physico-chemical characterisation of bioactive components. Plant Food Human Nutr. 2018, 73, 89–94. [Google Scholar] [CrossRef]
  38. Donno, D.; Mellano, M.G.; Gamba, G.; Riondato, I.; Beccaro, G.L. Mulberry: An ornamental tree that gives bioactive compounds for human health. In Proceedings of the International Society for Horticultural Science (ISHS), Leuven, Belgium, 3–4 March 2021; pp. 205–214. [Google Scholar]
  39. Ertürk, Ü.; Mert, C.; Soylu, A. Chemical composition of fruits of some important chestnut cultivars. Braz. Arch. Biol. Technol. 2006, 49, 183–188. [Google Scholar] [CrossRef] [Green Version]
  40. Ribeiro, B.; Rangel, J.; Valentão, P.C.; Andrade, P.B.; Pereira, J.A.; Bölke, H.; Seabra, R.M.J. Organic acids in two portuguese chestnut (Castanea sativa Miller) varieties. Food Chem. 2007, 100, 504–508. [Google Scholar] [CrossRef]
  41. Delgado, T.; Pereira, J.A.; Ramalhosa, E.; Casal, S. Comparison of different drying methods on the chemical and sensory properties of chestnut (Castanea sativa M.) slices. Eur. Food Res. Technol. 2017, 243, 1957–1971. [Google Scholar] [CrossRef]
  42. de Vasconcelos, M.; Nunes, F.; Viguera, C.G.; Bennett, R.N.; Rosa, E.A.S.; Ferreira-Cardoso, J.V. Industrial processing effects on chestnut fruits (Castanea sativa Mill.) 3. Minerals, free sugars, carotenoids and antioxidant vitamins. Int. J. Food Sci. Technol. 2010, 45, 496–505. [Google Scholar] [CrossRef]
  43. Künsch, U.; Schärer, H.; Patrian, B.; Höhn, E.; Conedera, M.; Sassella, A.; Jermini, M.; Jelmini, G. Effects of roasting on chemical composition and quality of different chestnut (Castanea sativa Mill) varieties. J. Sci. Food Agric. 2001, 81, 1106–1112. [Google Scholar] [CrossRef]
  44. Lamothe, L.M.; Lê, K.-A.; Samra, R.A.; Roger, O.; Green, H.; Macé, K. The scientific basis for healthful carbohydrate profile. Crit. Rev. Food Sci. Nutr. 2019, 59, 1058–1070. [Google Scholar] [CrossRef] [Green Version]
  45. Nicoletti, M. Nutraceuticals and botanicals: Overview and perspectives. Int. J. Food Sci. Nutr. 2012, 63 (Suppl. 1), 2–6. [Google Scholar] [CrossRef]
  46. Fioccardi, A.; Donno, D.; Razafindrakoto, Z.R.; Gamba, G.; Beccaro, G.L. First phytochemical study of six tree and shrub species with high health-promoting potential from madagascar: Innovative uses for food and medicinal applications. Sci. Hortic. 2022, 299, 111010. [Google Scholar] [CrossRef]
  47. Alary, R.; Buissonade, C.; Joudrier, P.; Gautier, M.-F.J. Detection and discrimination of cereal and leguminous species in chestnut flour by duplex pcr. Eur. Food Res. Technol. 2007, 225, 427–434. [Google Scholar] [CrossRef]
  48. Alary, R.; Serin, A.; Duviau, M.P.; Jourdrier, P.; Gautier, M.F. Quantification of common wheat adulteration of durum wheat pasta using real-time quantitative polymerase chain reaction (pcr). Cereal Chem. 2002, 79, 553–558. [Google Scholar] [CrossRef]
  49. Mildner-Szkudlarz, S.; Jeleń, H.H. The potential of different techniques for volatile compounds analysis coupled with pca for the detection of the adulteration of olive oil with hazelnut oil. Food Chem. 2008, 110, 751–761. [Google Scholar] [CrossRef]
  50. Esteki, M.; Farajmand, B.; Kolahderazi, Y.; Simal-Gandara, J. Chromatographic fingerprinting with multivariate data analysis for detection and quantification of apricot kernel in almond powder. Food Anal. Method 2017, 10, 3312–3320. [Google Scholar] [CrossRef]
  51. Lione, G.; Giordano, L.; Sillo, F.; Gonthier, P. Testing and modelling the effects of climate on the incidence of the emergent nut rot agent of chestnut gnomoniopsis castanea. Plant Pathol. 2015, 64, 852–863. [Google Scholar] [CrossRef]
  52. Donno, D.; Beccaro, G.L.; Carlen, C.; Ancay, A.; Cerutti, A.K.; Mellano, M.G.; Bounous, G. Analytical fingerprint and chemometrics as phytochemical composition control tools in food supplement analysis: Characterization of raspberry bud-preparations of different cultivars. J. Sci. Food Agric. 2016, 96, 3157–3168. [Google Scholar] [CrossRef]
  53. Karabagias, I.K.; Koutsoumpou, M.; Liakou, V.; Kontakos, S.; Kontominas, M.G. Characterization and geographical discrimination of saffron from greece, spain, iran, and morocco based on volatile and bioactivity markers, using chemometrics. Eur. Food Res. Technol. 2017, 243, 1577–1591. [Google Scholar] [CrossRef]
  54. Schutz, H.G.; Cardello, A.V. A labeled affective magnitude (lam) scale for assessing food liking/disliking. J. Sens. Stud. 2001, 16, 117–159. [Google Scholar] [CrossRef]
  55. Villanueva, N.D.; Da Silva, M.A. Comparative performance of the nine-point hedonic, hybrid and self-adjusting scales in the generation of internal preference maps. Food Qual. Pref. 2009, 20, 1–12. [Google Scholar] [CrossRef]
  56. Lawless, H.T.; Popper, R.; Kroll, B.J. A comparison of the labeled magnitude (lam) scale, an 11-point category scale and the traditional 9-point hedonic scale. Food Qual. Pref. 2010, 21, 4–12. [Google Scholar] [CrossRef]
  57. Dundar, A.; Gocmen, D.; Ozturk, S.; Koksel, H. Effects of chestnut flour on cookie quality. In Proceedings of the 6th International Congress Flour-Bread’11 and 8th Croatian Congress of Cereal Technologists, Opatija, Croatia, 12–14 October 2011; Faculty of Food Technology Osijek, University of Josip Juraj Strossmayer: Osijek, Croatia, 2012; pp. 118–125. [Google Scholar]
Figure 1. Total polyphenolic content of the analysed chestnut flours. Different letters for each flour indicate the significant differences at p < 0.05. Blue colour: commercial flours from Lazio (ANTR) and Toscana (LUNI); orange colour: flours from Piemonte; green colour: flours from Friuli-Venezia Giulia.
Agriculture 12 00946 g001
Figure 2. Antioxidant capacity of the analysed chestnut flours. Different letters for each flour indicate the significant differences at p < 0.05. Blue colour: commercial flours from Lazio (ANTR) and Toscana (LUNI); orange colour: flours from Piemonte; green colour: flours from Friuli-Venezia Giulia.
Agriculture 12 00946 g002
Figure 3. Representation of the phytocomplex of the analysed flours. Different colours identify each chemical class. Blue: polyphenols; orange: monoterpenes; grey: vitamin C.
Agriculture 12 00946 g003
Figure 4. Polyphenolic profile of the analysed chestnut flours. Different colours highlighted the different phenolic classes. Blue: cinnamic acids; orange: flavonols; grey: benzoic acids; yellow: catechins; sky blue: tannins.
Agriculture 12 00946 g004
Figure 5. Principal component analysis (PCA_1) score plot of tested CFs. Mean values (n = 3) were included for each sample. Flour IDs were reported in Table 1.
Agriculture 12 00946 g005
Figure 6. PCA_1 loading plot of the considered variables.
Agriculture 12 00946 g006
Figure 7. Principal component analysis (PCA_2) score plot of the tested CFs. Mean values (n = 3) were included for each sample. Flour IDs were reported in Table 1.
Agriculture 12 00946 g007
Figure 8. PCA_2 loading plot of the tested variables.
Agriculture 12 00946 g008
Table 1. Identification (ID) codes of the analysed chestnut flours. For each sample, the table shows the cultivars (and their origin) that compose the chestnut flour.
Flour ID CodeSpeciesCultivarRegionProvince
SATIC. sativaBrunettePiemonteCuneo
C. sativaGentile
C. sativaGarrone Rosso
C. sativaContessa
C. sativaGabiana
FRIUC. sativaCiuffaFriuli Venezia
Giulia
Pordenone/
Udine
C. sativaObiacco
C. sativaMuron
BOUCC. sativa × C. crenataBouche de BétizacPiemonteCuneo
CANAC. sativaCanaluttaFriuli Venezia
Giulia
Pordenone/
Udine
ANTRC. sativaMarrone AntrodocanoLazioRieti
LUNIC. sativaBrescianaToscanaMassa-Carrara
C. sativaCarpinese
C. sativaRossola
Table 2. Phytochemical profiles of the analysed chestnut flours.
Cinnamic AcidsFlavonolsBenzoic AcidsCatechinsTanninsMonoterpenesVitamin C
CAFLBACTTAMTVC
(mg/100 g DW) (mg/100 g DW) (mg/100 g DW) (mg/100 g DW) (mg/100 g DW) (mg/100 g DW) (mg/100 g DW)
SampleMean ValueSDTukey TestMean ValueSDTukey TestMean ValueSDTukey TestMean ValueSDTukey TestMean ValueSDTukey TestMean ValueSDTukey TestMean ValueSDTukey Test
ANTR21.090.98a14.361.82d2.230.13a7.740.27a22.322.81a391.728.6a15.62.23a
BOUC21.441.21a2.550.15a39.295.84bc27.572.5b36.344.88c461.578.77b15.750.65a
CANA24.820.95a4.570.17ab35.852.11b26.684b29.633.14bc389.927.66a12.272.23a
FRIU25.443.9a6.950.16c47.583.4c22.493.41b29.551.9bc415.725.3ab15.112.38a
LUNI21.442.98a5.670.75bc47.143.94c29.492.44b30.943.98bc370.333.84a13.662.49a
SATI21.371.05a4.910.19bc43.251.64bc26.941.83b26.252.61a375.822.8a14.771.82a
The mean value together with standard deviation (SD) are given for each sample (n = 3). Different letters for each flour indicate the significant differences at p < 0.05.
Table 3. Nutritional substances of the tested CFs.
Organic AcidsSugars
OASU
(mg/100 g DW) (g/100g DW)
SampleMean ValueSDTukey TestMean ValueSDTukey Test
ANTR481.806.86a5.340.63a
BOUC1229.204.77b6.120.76a
CANA1439.5016.20c12.080.61b
FRIU1486.9034.60c12.072.34b
LUNI1239.9010.90b7.271.28a
SATI1251.8031.40b7.030.20a
The mean value together with standard deviation (SD) are given for each sample (n = 3). Different letters for each flour indicate the significant differences at p < 0.05.
Table 4. Hedonistic profile of the cookies derived from the analysed chestnut flours.
Judgement
(1–9 scale)
SampleMean ValueSDTukey Test
ANTR5.930.79b
BOUC6.880.18c
CANA7.090.46c
FRIU4.380.19a
LUNI6.740.52bc
SATI5.550.59b
The mean value together with standard deviation (SD) are given for each sample (n = 40). Different letters for each flour highlight the significant differences at p < 0.05.
Table 5. Frequencies related to the consumer judgment for the cookies derived from the analysed chestnut flours.
Sample
Judgment ValueHedonistic AttributeHedonistic CategoryANTRBOUCCANAFRIULUNISATI
1dislike extremelydislike15.79%9.38%18.18%48.28%11.11%18.18%
2dislike very much
3dislike moderately
4dislike slightlyneither dislike nor like60.53%40.63%18.18%41.38%41.67%60.61%
5indifferent
6like slightly
7like moderatelylike23.68%65.63%63.64%10.34%47.22%30.30%
8like very much
9like extremely
Publisher’s Note: MDPI stays neutral with regard to jurisdictional claims in published maps and institutional affiliations.

