Article

Modeling the Water and Nitrogen Management Practices in Paddy Fields with HYDRUS-1D

College of Agricultural Sciences and Engineering, Hohai University, Nanjing 210098, China
*
Author to whom correspondence should be addressed.
Agriculture 2022, 12(7), 924; https://doi.org/10.3390/agriculture12070924
Submission received: 20 May 2022 / Revised: 21 June 2022 / Accepted: 23 June 2022 / Published: 26 June 2022
(This article belongs to the Special Issue Water-Saving Irrigation Technology and Strategies for Crop Production)

Abstract

:
Rice production involves abundant water and fertilizer inputs and is prone to nitrogen (N) loss via surface runoff and leaching, resulting in agricultural diffuse pollution. Based on a two-season paddy field experiment in Jiangsu Province, China, field water and N dynamics and their balances were determined with the well-calibrated HYDRUS-1D model. Then, scenarios of different controlled drainage and N fertilizer applications were simulated using the HYDRUS-1D model to analyze the features and factors of N loss from paddy fields. Evapotranspiration and deep percolation were the two dominant losses of total water input over the two seasons, with an average loss of 50.9% and 38.8%, respectively. Additionally, gaseous loss of N from the whole soil column accounted for more than half of total N input on average, i.e., ammonia volatilization (17.5% on average for two seasons) and denitrification (39.7%), while the N uptake by rice accounted for 37.1% on average. The ratio of N loss via surface runoff to total N input exceeded 20% when the N fertilizer rate reached 300 kg ha−1. More and longer rainwater storage in rice fields under controlled drainage reduced surface runoff losses but increased the risk of groundwater contamination by N leaching. Therefore, compared with raising the maximum ponding rainwater depth for controlled drainage, optimizing N fertilizer inputs may be more beneficial for controlling agricultural diffuse pollution by reducing N loss via surface runoff and leaching. The HYDRUS-1D model provides an approach for the quantitative decision-making process of sustainable agricultural water and N management.

1. Introduction

Appropriate water management practices are indispensable in agricultural production systems to create suitable soil moisture and ensure the supply of nutrients such as nitrogen (N). Different from the water scarcity in arid areas, humid areas face the great challenge of agricultural diffuse pollution, especially in rice paddies [1]. Rice feeds more than 50% of the world’s population [2], and its high and stable yield is inseparable from the high application rate of N fertilizer.
Excessive N application is easily lost to the surrounding water environment as a result of surface runoff, which has become the major inducement of lake eutrophication and groundwater contamination [3,4,5]. Due to differences in rainfall, soil, and field management strategies in different regions, N runoff loss accounts for 5.6% to 68.2% of the total N input [6,7]. The low recovery rate of fertilizer for crops leads to significant leaching of residual N into groundwater due to irrigation or rain [8]. In particular, nitrate contributes more to groundwater pollution than any other form of N due to its fluidity [9]. In China, it was reported that more than 50% of paddies required reduced N application to meet the environmental optimum of N-fertilizer, i.e., 169–199 kg N ha−1 [10]. Many studies have previously revealed the impact of reduced N application rates on crop growth or yield [11,12,13]. However, there is still a lack of effective quantitative research to assess the impact of optimizing N application on reducing agricultural diffuse pollution in paddy fields, which is unlikely to convince farmers and policymakers to pay attention to agricultural water management and optimize N fertilizer investments.
In recent years, extreme hydrological events have occurred more frequently due to climate change, especially threatening the security of agriculture production [14,15]. For rice, the introduction of alternate wetting and drying (AWD) regime, one of the widely promoted water-saving irrigation methods, regulates the field surface’s wetting or drying state and improves water productivity in rice production [16]. In humid areas, rainfall is abundant, and most crops depend on rain-fed irrigation. The uncertainty of time, frequency, and volume of rainfall can affect the movement of soil water [17] and change the transport and transformation process of N correspondingly [7]. Moreover, the paddy field experiences extreme soil moisture fluctuations under AWD conditions, which significantly affects water storage capacity and runoff output [18].
Farmers often perform artificial drainage to avoid continuous flooding of paddy fields, resulting in more than 23.9% loss of N runoff [18,19], which has been recognized as a critical source of diffuse agricultural pollution [20]. However, despite the high frequency of surface runoff in paddy fields, the characteristics of nutrient loss under controlled drainage conditions have attracted less attention. Within the rapid degradation stages (less than 10 days) of N fertilizer such as urea, it is reported that the N concentration in paddy water decreases exponentially [21,22], and significant variations of N content were observed in intra- and inter- runoff events [17]. Consequently, it is important to investigate the response relation between controlled drainage and N losses in paddy fields after rainfall in humid areas.
On-site monitoring over years is primary and helpful, but time-consuming and laborious to accurately quantify N loss loads. In particular, when analyzing, evaluating, and predicting the combination of various water and N management strategies, model simulation methods cannot be neglected and are of great significance to agro-hydrology research [23]. Several models, such as CERES-Rice [24], APSIM [25], and ORYZA [26], have been applied in rice production systems. These models can simulate the crop growth process very well, but the simulation of N transport and transformation is limited. In this regard, HYDRUS-1D has been applied extensively to simulate water, heat, and solute transport in various environments [27,28]. The sequential first-order decay chain is used to describe N transformation among urea, ammonia, and nitrate. It has the flexibility to consider the absorption of nutrients by roots and simulates the dynamics of soil water and solutes under different boundary conditions [29].
In southern China with a humid climate, frequent heavy rainfall events significantly increase surface runoff and leaching loss of solutes. Surface runoff happens particularly when rainfall exceeds paddy storage capacity, and it is determined by the height difference between the drainage outlet height (hmax, i.e., the maximum ponding rainwater depth) and the ponding water depth (hp) [30], which are relied on manual field measurements. Agro-hydrology models such as HYDRUS-1D may be helpful in quantifying field runoff process and water and solute balances under the background of increasing frequency, intensity, and duration of extreme weather events. However, the relevant evidence is relatively scarce in this regard.
In the present study, the environmental benefits of controlled drainage and N fertilizer reduction in paddy fields were investigated in a humid climate, based on a two-year experimental observation and a well-calibrated HYDRUS model simulation. We designed different combinations of rainwater storage and N application rates and evaluated the risk of N loss via leaching and surface runoff. Under different scenarios, modeling techniques were utilized to accurately determine the elements of water and N balance in paddy fields. Research results are expected to guide water and N fertilizer management in paddy fields for sustainable agriculture.

2. Materials and Methods

2.1. Study Area and Experiment Design

The experiment was conducted at the Jiangning Water-saving Park of Hohai University, Jiangsu province, China (31°55′ N, 118°46′ E). This region has a subtropical monsoon climate. The annual average temperature, sunshine hours, and evaporation are 15.7 °C, 2017.2 h, and 900 mm, respectively. The annual average rainfall is about 1072.9 mm with an average annual 120 rainfall days, of which the period between May and September accounts for 60% of the annual rainfall. With the temporarily uneven distribution of rainfall, surface runoff from paddy fields may occur from time to time. There are 32 non-weighing drainage lysimeters in the Water-saving Park, 2.5 m × 2.0 m in length and width and 2.0 m in depth, which are separated by concrete and then sealed with waterproof coatings [31]. The plots were cultivated with rice–wheat rotation for many years and the basic properties of the test soils are listed in Table 1.
The experiments with the rice cultivar Nanjing 9108 were carried out in 2020 and 2021. Rice seedlings at 35 days old were transplanted into the lysimeters on 17 June 2020 and 4 July 2021 at 20 cm × 15 cm spacing. The N application rate was 225 kg N ha−1, and urea was applied as the base fertilizer (17 June 2020 and 5 July 2021), tiller initiation fertilizer (30 June 2020 and 7 July 2021), and spikelet-developing fertilizer (2 August 2020 and 14 August 2021) at a ratio of 4:3:3. All plots were managed with practices commonly adopted by local farmers, including P and K fertilization, pesticide application, and water regimes. Specifically, water management in paddy fields followed an improved AWD technology adapted to southern China [32], and its irrigation thresholds are shown in Table 2. When the field water level dropped to the lower threshold of irrigation, paddy was irrigated with an electromagnetic flowmeter until the upper threshold was reached. On the other hand, surface drainage occurred when rainfall caused hp to exceed drainage outlet height at 10 cm.

2.2. Measurements and Analysis

Daily meteorological data, such as air temperature, wind speed, radiation, and humidity, were measured by an automatic weather station (31°55′ N, 118°46′ E, altitude of 15.0 m) in the Water-saving Park. According to the irrigation instructions (Table 2), the field water level dynamic was measured at 9 a.m. each day by a perforated PVC pipe [33]. Irrigation of each lysimeter was controlled by a solenoid valve connected to a computer system, and the irrigation water volume was recorded by the flowmeter at the water inlet. Similarly, the amount of surface runoff was measured by a flowmeter at the outlet. In general, half an hour after the irrigation or drainage event, the field water level was monitored to ensure that it reached the lower or upper threshold.
Within two weeks after each N fertilizer application, water samples were collected at 9:00 a.m. daily for the first five days, and then every three days or after irrigation/rain events. Using a small electric vacuum pump, water samples were taken by the siphon method in the ponded layer of each lysimeter, and three different positions were taken for mixing each time. Before rice transplanting, several bottom porous PVC tubes were implanted at 20, 40, and 60 cm soil depths in the lysimeters to collect leachate [34]. Electrical water pumps were also used to extract leachate from the PVC tubes. If there was no sampling on the adjacent days, the residual leachate in the PVC tubes was drained the night before. The water samples were stored quickly at −20 °C after being collected.
The N content in water samples was determined by a spectrophotometer (P4UV, MAPADA, Shanghai, China). In specific, ammonia nitrogen (NH4+-N), and nitrate-nitrogen (NO3-N) were analyzed by Naismith’s reagent UV spectrophotometry, and the hydrochloric acid acidification-UV spectrophotometry, respectively. The cumulative N loss was the product of water flux of surface runoff or percolation rate and the corresponding NH4+-N and NO3-N concentrations. Moreover, leaf area index (LAI) was measured every ten days with an AccuPAR LP-80 analyzer (Decagon, Pullman, WA, USA) during rice growth. Rice samples of aboveground organs were first dried at 70 °C for 48 h and then weighed and ground. Total N contents were subjected to the Kjeldahl method and digested with H2SO4-H2O2 at 260 °C [35]. Cumulative total N uptake was dry matter weight multiplied by the measured total N content.
Soil samples were collected ten days before rice transplanting. After removal of surface debris, soil samples (in triplicate) were collected from 2 quadrats along the diagonal of each plot by soil drill. In addition, undisturbed soil cores were collected using a 5 cm-diameter ring knife to determine soil bulk density, which was based on the inner diameter of the ring knife, sampling depth, and soil drying weight. The air-dried soil samples were sieved through a 2 mm sieve and then pretreated with 6% H2O2 after which 10% HCl was added to remove oxides and carbonates. A laser particle size analyzer (s Malvern Panalytical Ltd., Malvern, UK) was applied to determine particle-size distribution after chemical treatment and mechanical dispersion.

2.3. Model Description

Since lateral seepage was minimized in paddy plots, the HYDRUS-1D model was applied to simulate and predict one-dimensional soil water movement, mass balance, and N dynamics in rice paddies.

2.3.1. Soil Water Flow

The Richard’s equation was used to calculate one-dimensional soil water flow [29]:
θ t = z K ( h ) h z + 1 S r
where z and t denote the soil profile coordinate (cm) and time (day) respectively; θ is the volumetric water content (cm3 cm−3); Sr represents the sink term of root (cm3 cm−3 day−1); K(h) is the unsaturated hydraulic conductivity (cm day−1) associated with water pressure head (cm). In addition, the mathematical relationships between θ(h) and K(h) are described as follows [36]:
θ ( h ) = θ r + θ s θ r 1 + | α h | n m ( h < 0 ) θ s ( h 0 )
K ( h ) = K s S e λ 1 1 S e 1 m m 2
where θs and θr denote saturated water content and residual water content (cm3 cm−3), respectively; Ks means saturated hydraulic conductivity (cm day−1); and l, m, and α are empirical shape factors (-); and the Se effective saturation is calculated by:
S e = θ ( h ) θ r θ s θ r

2.3.2. Evapotranspiration and Root Water Uptake

Reference evapotranspiration (ET0) rates are calculated by the Penman–Monteith equation [37] with daily weather data, and the potential evapotranspiration rates (ETc) are the product of ET0 and the crop coefficient (Kc). Then, LAI is used to partition evaporation and transpiration [38]:
E p = E T C × e K g r × L A I
where Kgr is an extension coefficient for global solar radiation, which was set to 0.3 for rice [39]. Thus, the potential transpiration is the difference between ETc and potential evaporation. In addition, a piecewise linear function was parameterized to describe the water stress response [40], including four pressure heads associated with root water uptake. The meanings are as follows: if h > h1 and h < h4, then the root is assumed to stop absorbing water; and water uptake maintain at the highest state between h2 and h3, while it linearly decreases (or increases) between h3 and h4 (or h1 and h2).

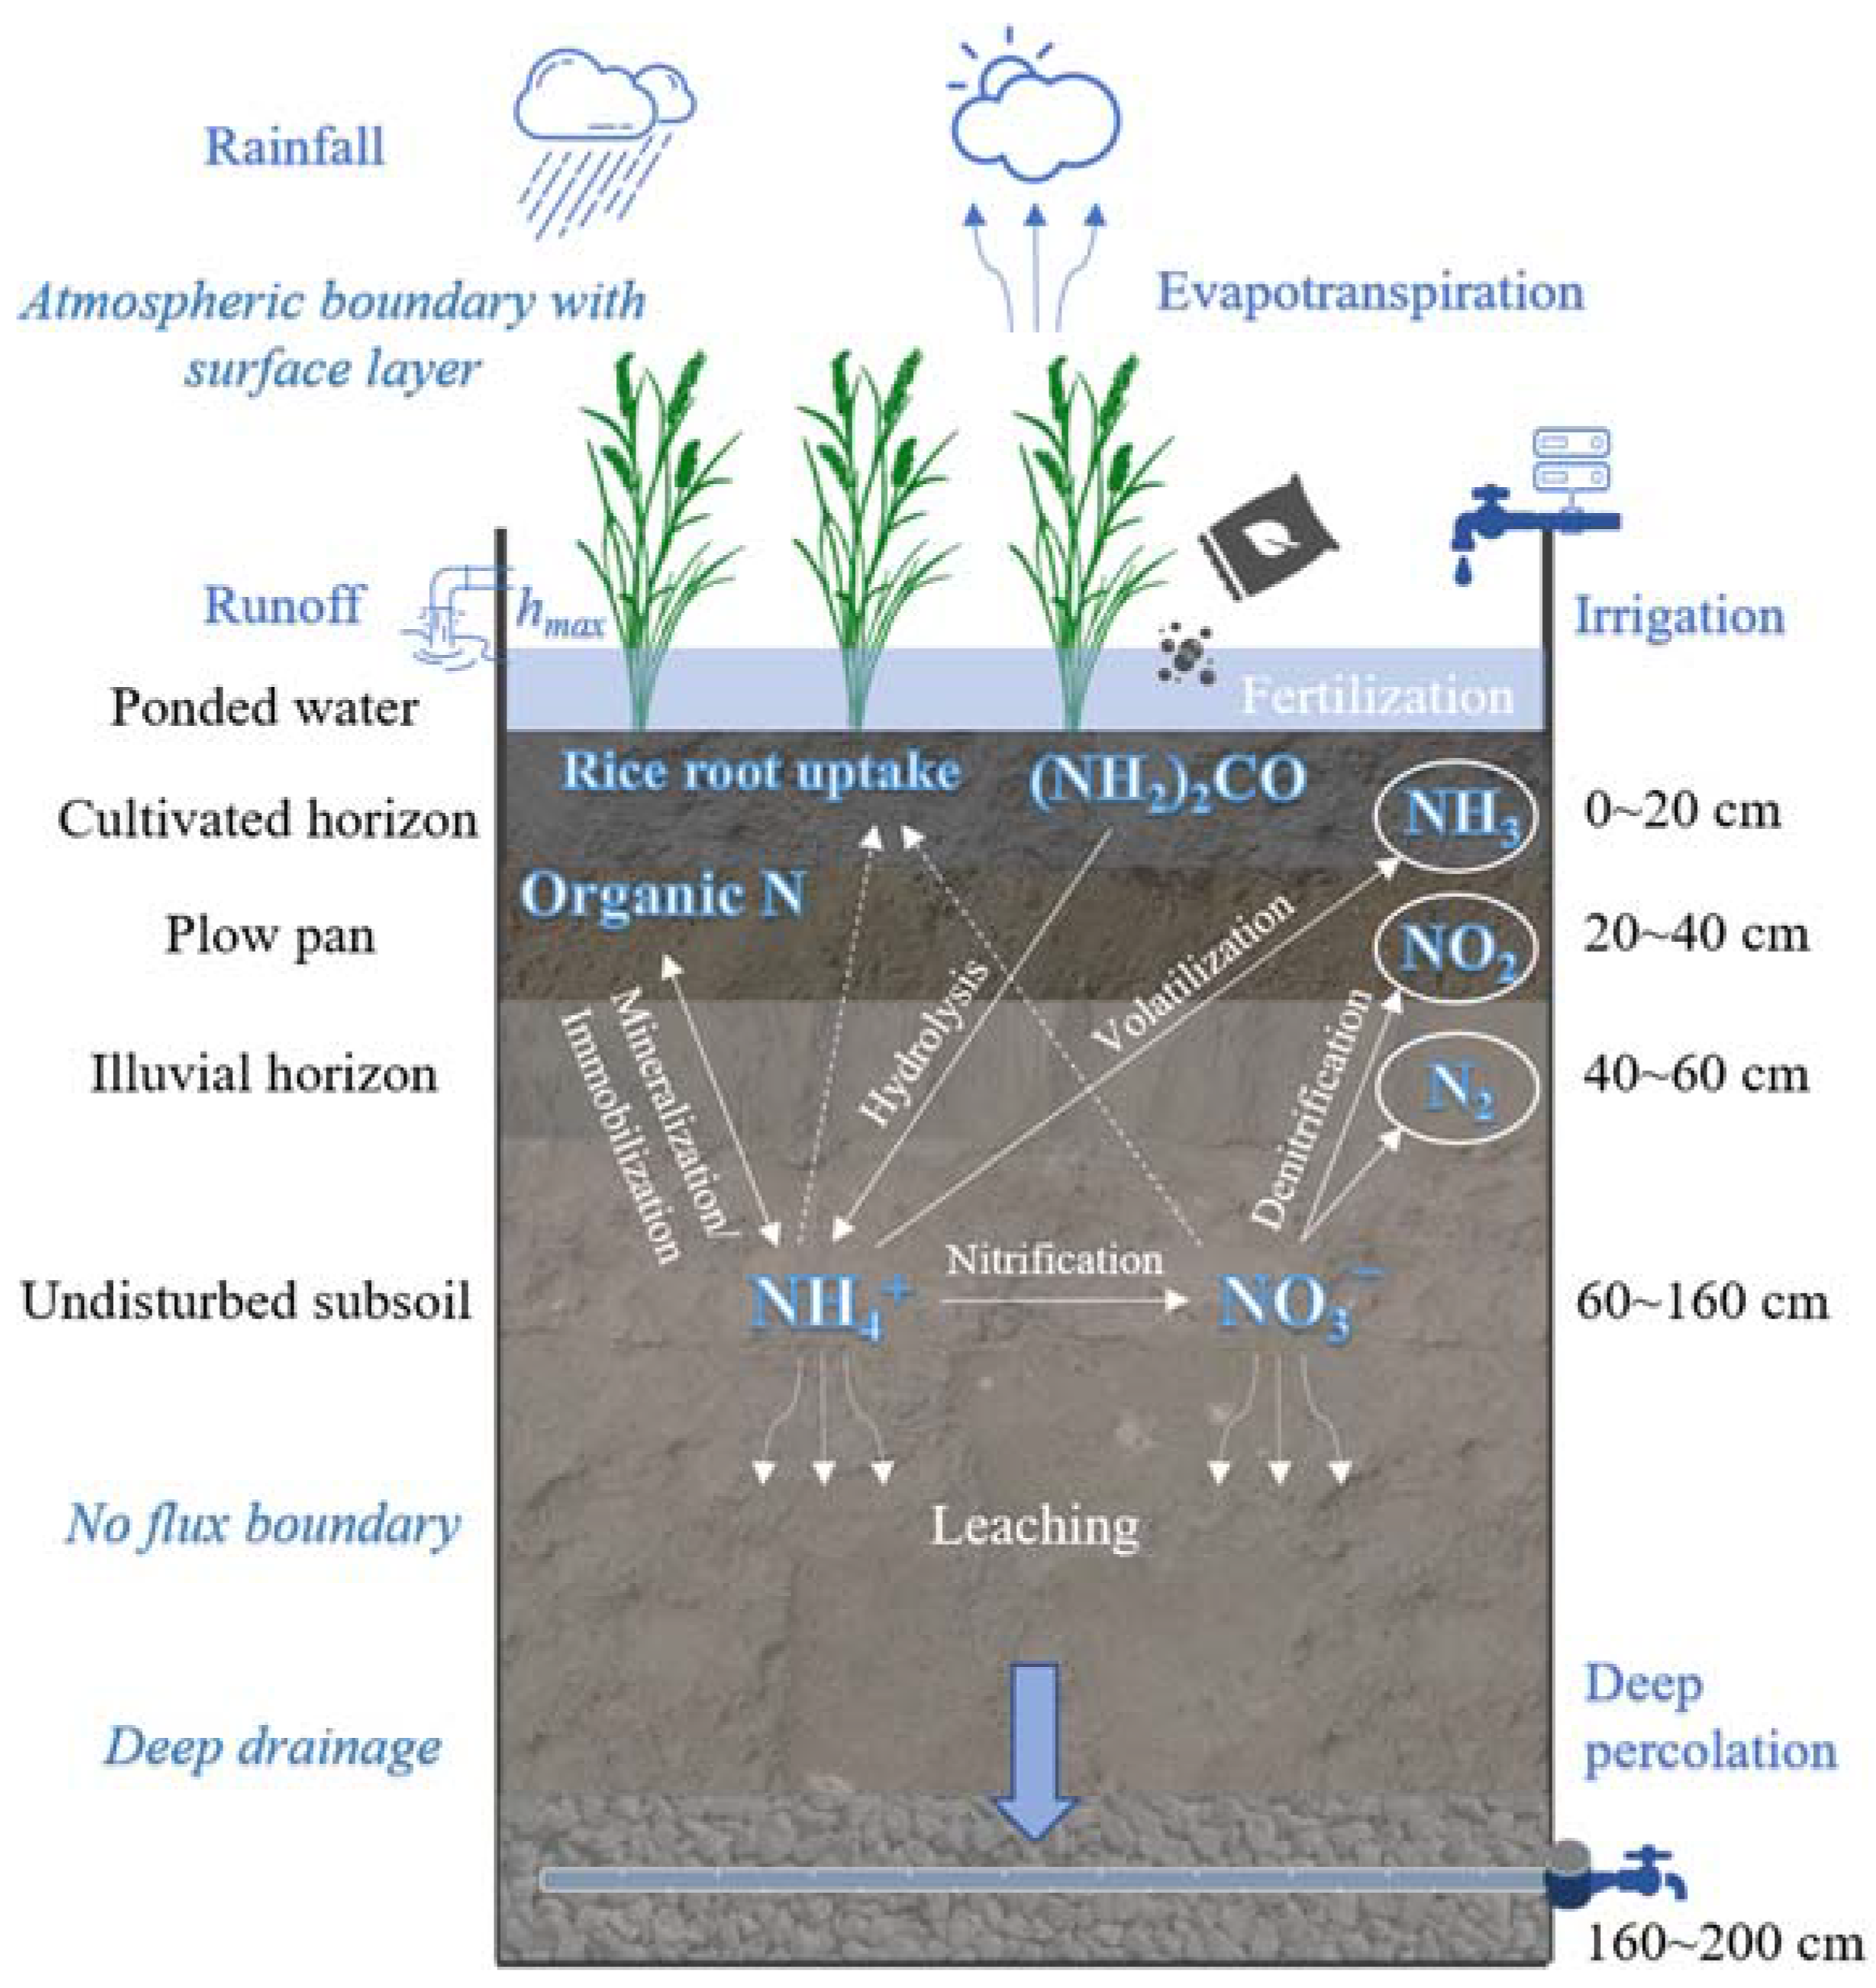
2.3.3. N Transport and Transformation

Three N forms in rice paddies including urea, NH4+-N, and NO3-N are described as first-order chain reactions, calculated by following the convection–diffusion equation [29]:
θ C 1 t = z θ D 1 w C 1 z q C 1 z μ w , 1 θ C 1
θ C 2 t + ρ S 2 t + a v G 2 t = z θ D 2 w C 2 z + z a v D 2 g G 2 z q C 2 z μ w , 2 θ C 2 + μ w , 1 θ C 1 + γ s , 2 ρ r a , 2
θ C 3 t = z θ D 3 w C 3 z q C 3 z μ w , 3 θ C 3 + μ w , 2 θ C 2 r a , 3
where the subscripts 1, 2, and 3 represent urea, NH4+-N, and NO3-N, respectively; C, S, and G denote the N concentration in liquid (mg L−1), solid (mg g−1), and gas (mg g−1) phases, respectively; ρ is soil dry bulk density (g cm−3); Dw and Dg represent N dispersion coefficients for liquid and gas phase, respectively (cm2 day−1); q is the volumetric water flux (cm day−1); µw is the first-order rate constant for N in the liquid phase (day−1), µ′w is the first-order rate constant for chain reaction between urea, NH4+-N and NO3-N (day−1); γs is a zero-order rate constant in the solid phase (day−1); ra is a passive root N uptake.

2.4. Initial and Time-Variable Boundary Conditions

The HYDRUS-1D model was simulated on a daily time scale starting from transplanting. As illustrated in Figure 1, the paddy soil domain with a depth of 160 cm represented the lysimeter soil column, which was divided into four layers. Since the paddy field allowed water to pond on the surface, the upper boundary condition was set as the atmospheric boundary condition with the surface layer, of which the maximum thickness (i.e., hmax) was specified as 10 cm before surface runoff was initiated. The bottom boundary condition was defined as the deep drainage boundary based on percolation flux observed at the bottom of the lysimeters. The initial condition for water flow was assigned as the shallow ponded water depth during transplanting for each season.
Initial ammonia and nitrate N concentrations in the soil profile were obtained by linear interpolation of observed data in prescriptive depths, while the initial urea concentration was the N application rate of base fertilizer divided by hp at transplanting. Similarly, the concentration of urea taken as the upper boundary condition was calculated by the top-dressed fertilizer rate and incoming water flux at the tillering and heading stages, while the Dirichlet boundary was set as the bottom boundary condition. Since irrigation and drainage were no longer managed in the paddy field after entering the yellow-ripening stage, the simulation was started the day after transplanting until the end of the milky-ripening stage. The discretization scheme uses 111 nodes distributed in the soil profile, i.e., a spatial step of 1 cm for the upper three soil layers (0–20 cm, 20–40 cm, and 40–60 cm), and a spatial step of 2 cm for the bottom 60–160 cm soil layer.

2.5. Model Input Parameters

The van Genuchten soil hydraulic parameters were estimated by the Rosetta-Lite module and then calibrated according to the observed ponding water depth (Table 3). Rosetta considered the measured particle size distribution and bulk density dataset as shown in Table 1. The Feddes model parameters, including h1, h2, h3high, h3low, and h4, have been optimized for rice at 100 cm, 55 cm, −160 cm, −250 cm, and −15,000 cm [41], respectively. For the analysis of solute transport, the longitudinal dispersivity was initially considered equal to one-tenth of the profile depth and then calibrated [42], the molecular diffusion coefficients in free water (Dw) for NH4+-N and NO3-N were 1.52 and 1.64 cm2 day−1, and Dg in soil air for NH3 was 18,057.6 cm2 day−1. N uptake rates were calculated using linear interpolation for the observed total N content of rice between two sample time intervals. It was assumed that mineral N (NH4+-N and NO3-N) could be unlimited passively absorbed by rice roots (cmax = 1000 mg L−1) while urea could not (cmax = 0 mg L−1). Besides, the active uptake was considered only for NH4+-N and its Michaelis-Menten constant was set as 0.31 mg L−1 [43].
The N first-order chain reaction processes were temperature and water content dependent, but it is a common practice to neglect these dependences [44]. The parameters of the N chain reaction were hard to measure practically, thus the parameters were initially taken from published literature [45,46,47] and then calibrated and validated (Table 4). It was reported that mineralization/immobilization was mostly active in the root zone, while ammonia volatilization only happened on the field surface [47]. Besides, the parameters of nitrification and denitrification were initially defined as the same in the soil column and then calibrated for each layer. The NH4+-N distribution coefficient (Kd) between its liquid and solid phase was set as 3.5 cm3 g−1, which was consistent with previous literature by Tan et al. [34], Hanson et al. [44], and Dash et al. [48], while urea and NO3-N only existed in the liquid phase (i.e., Kd = 0 cm3 g−1).
The well-fit parameters were obtained through trial and error until the simulated model results closely matched the observed ponding water depth and N concentrations. Three statistical indicators including determination coefficient (R2), Nash–Sutcliffe modeling efficiency (NSE), and root mean square error (RMSE) were calculated and served as a measure of the agreement between observed and simulated data (Table 5).

2.6. Model Simulation and Evaluation

  • Scenarios Design and Model Runs
According to the existing drainage outlet depth (10 cm), the maximum ponding rainwater depth (hmax) was changed to 5–15 cm, in steps of 1 cm. N fertilizer was applied at eleven levels in the range of 100 to 350 kg ha−1 increased by 25 kg ha−1. In particular, N fertilizer was applied at 40%, 30%, and 30% at transplanting, tillering, and panicle initiation stages, respectively. For each scenario of combined N application and controlled drainage, the simulation was for two typical years (2020 and 2021 rice-growing seasons). Therefore, there were 11 × 11 = 121 treatments and 121 × 2 = 242 model runs in total. The coupling environmental effects between different N fertilizer levels and controlled drainage thresholds were analyzed according to the N loss load in the percolation from the root zone and surface runoff under different scenarios calculated by the HYDRUS-1D model.
  • Model Performance Criteria
R M S E = 1 n 1 n P i O i 2
N S E = 1 P i O i 2 O i O ¯ 2
R 2 = i = 1 n O i O ¯ P i P ¯ i = 1 n O i O ¯ 2 i = 1 n P i P ¯ 2 2
where n denotes the number of results and subscript number i denotes its order; Pi and Oi denote the simulated and observed values, respectively, with the bar above letters indicating their means.

3. Results and Discussion

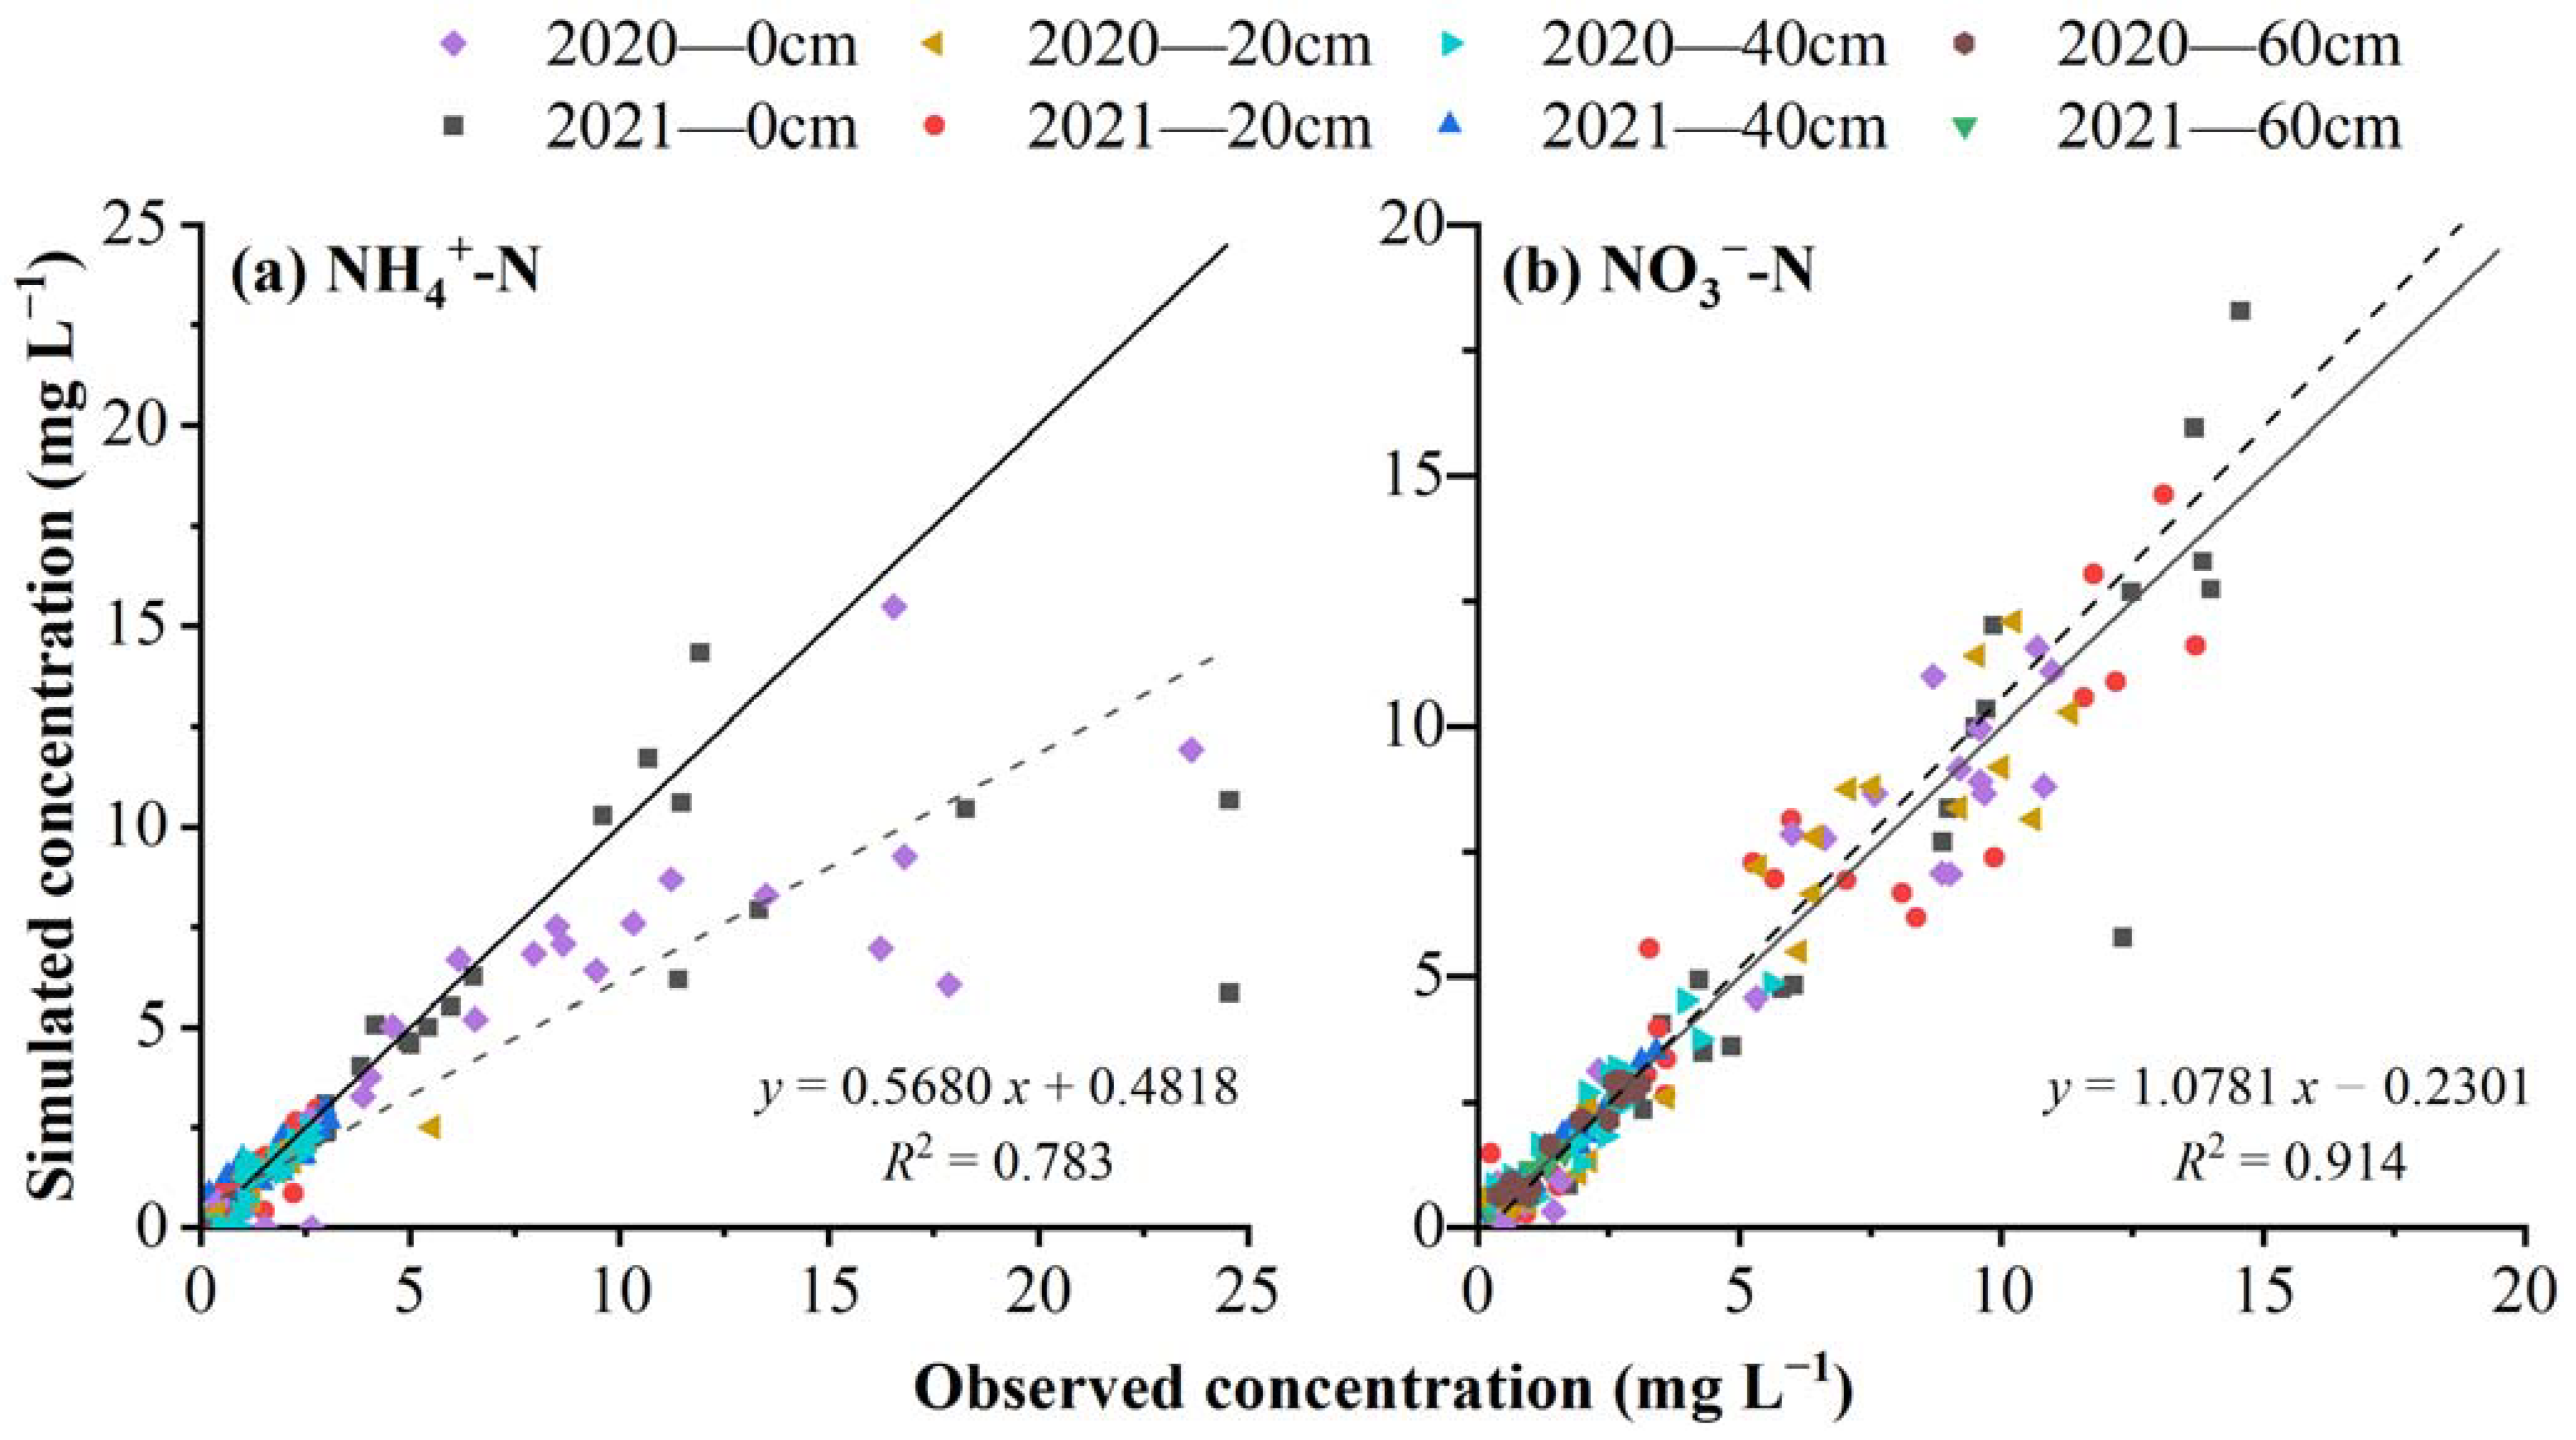
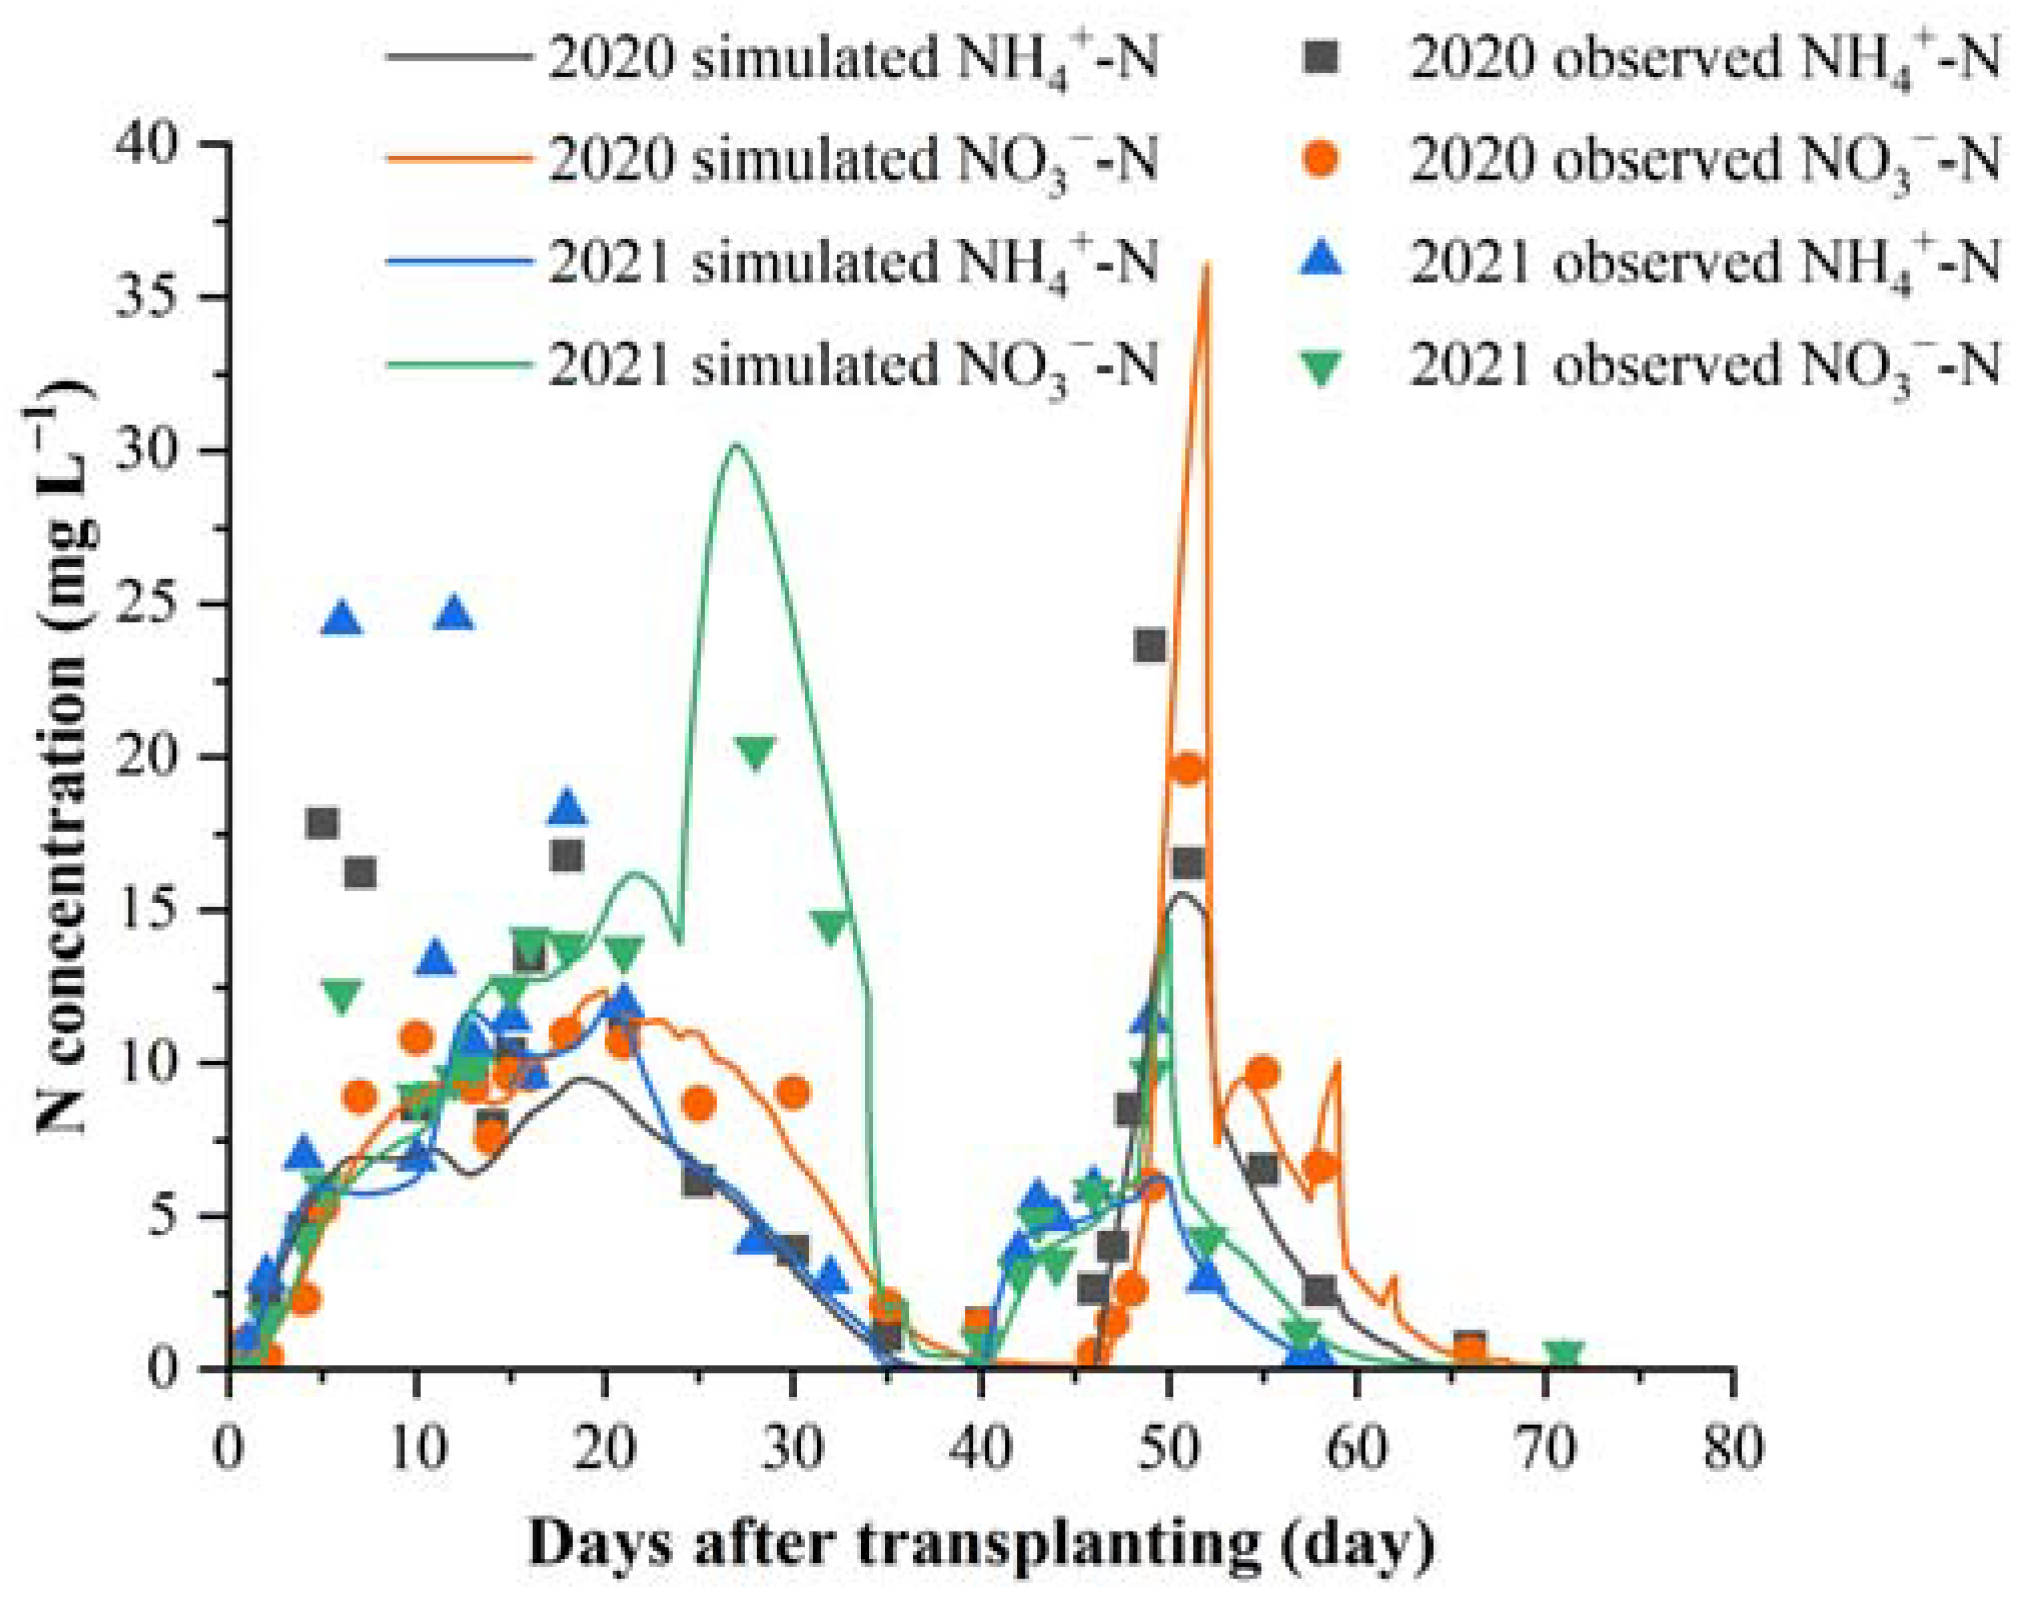
3.1. Model Calibration and Validation

The observed data during the 0–90 DAT in the 2020 season were used for model calibration, and then the HYDRUS-1D model with calibrated parameters was validated during the 0–80 DAT in the 2021 season. The soil hydraulic parameters were estimated by the Rosetta approach and then calibrated and validated according to the observed values of hp, and then the calibrated water model was applied to determine the nitrification and denitrification rates at 20, 40, and 60 cm depths. The agreement between observed and simulated hp during calibration was good (Table 5), with R2 = 0.981, NSE = 0.980, and RMSE = 0.382 cm. And the validation performance of calibrated water model was similarly good, with R2 = 0.983, NSE = 0.981, and RMSE = 0.373 cm. The HYDRUS-1D model does not consider the preferential flow due to macropores and cracks under AWD irrigation, which would cause an increase in percolation and a decrease in surface drainage to a certain extent, especially during the periods of dry and wet alternation of paddy fields [34], which may reduce the accuracy of simulating soil water flow movement.
For NH4+-N, the model performed better for subsurface concentrations than for the surface (Table 5), with R2 = 0.537–0.669 (NSE = 0.393–0.451 and RMSE = 4.608–5.570 mg L−1) for surface concentration, and R2 = 0.517–0.845 (NSE = 0.440–0.773 and RMSE = 0.002–0.729 mg L−1) for subsurface concentration. The observed NH4+-N concentrations at 0 cm and 60 cm had relatively low R2 with respect to the simulation, but the simulated trend in the soil column was consistent with observation. In contrast, the model performance on NO3-N was generally better; the simulation accuracy of NO3-N was higher than that of NH4+-N, and NO3-N concentration values decreased from the surface along the soil profile (Figure 2). Moreover, the simulation accuracy was better with the increased soil depth, with R2 = 0.881–0.895, NSE = 0.756–0.767, and RMSE = 2.310–2.568 mg L−1 for surface concentration, and R2 = 0.881–0.962, NSE = 0.880–0.960, and RMSE = 0.116–1.407 mg L−1 for subsurface concentration. Overall, the present study showed that the observed and simulated values of NH4+-N or NO3-N concentrations were in good agreement compared with similar studies in rice paddies [46,48].
As illustrated in Figure 2a, the values of simulated NH4+-N concentration were slightly underestimated with a slope of 0.568 (R2 = 0.783). It is often difficult to improve the accuracy of simulated N concentrations because paddy field conditions such as pH, soil aeration, temperature, and C/N ratio may have individual or combined effects on N transformation [49]. When urea was hydrolyzed to NH4+-N, the accompanying volatilization of NH3 that was easily soluble in water was also determined by Naismith’s reagent UV spectrophotometry, which may make the observed surface concentration of NH4+-N greater than the simulated value. Moreover, at 60 cm depth, it may be that the sampling pipe has been punctured through the plow pan so that the observed NH4+-N concentration was larger and more fluctuating than the simulated value. With a slope of 1.078 (R2 = 0.914), simulated NO3-N concentration matched measured values well (Figure 2b). Although previous studies have confirmed that it was reliable for HYDRUS-1D to be applied in lowland rice fields, some problems still existed including a sampler, macropores, earthworm burrows, roots, and soil cracks [50,51], which would affect the accuracy of water and N transport calculations.

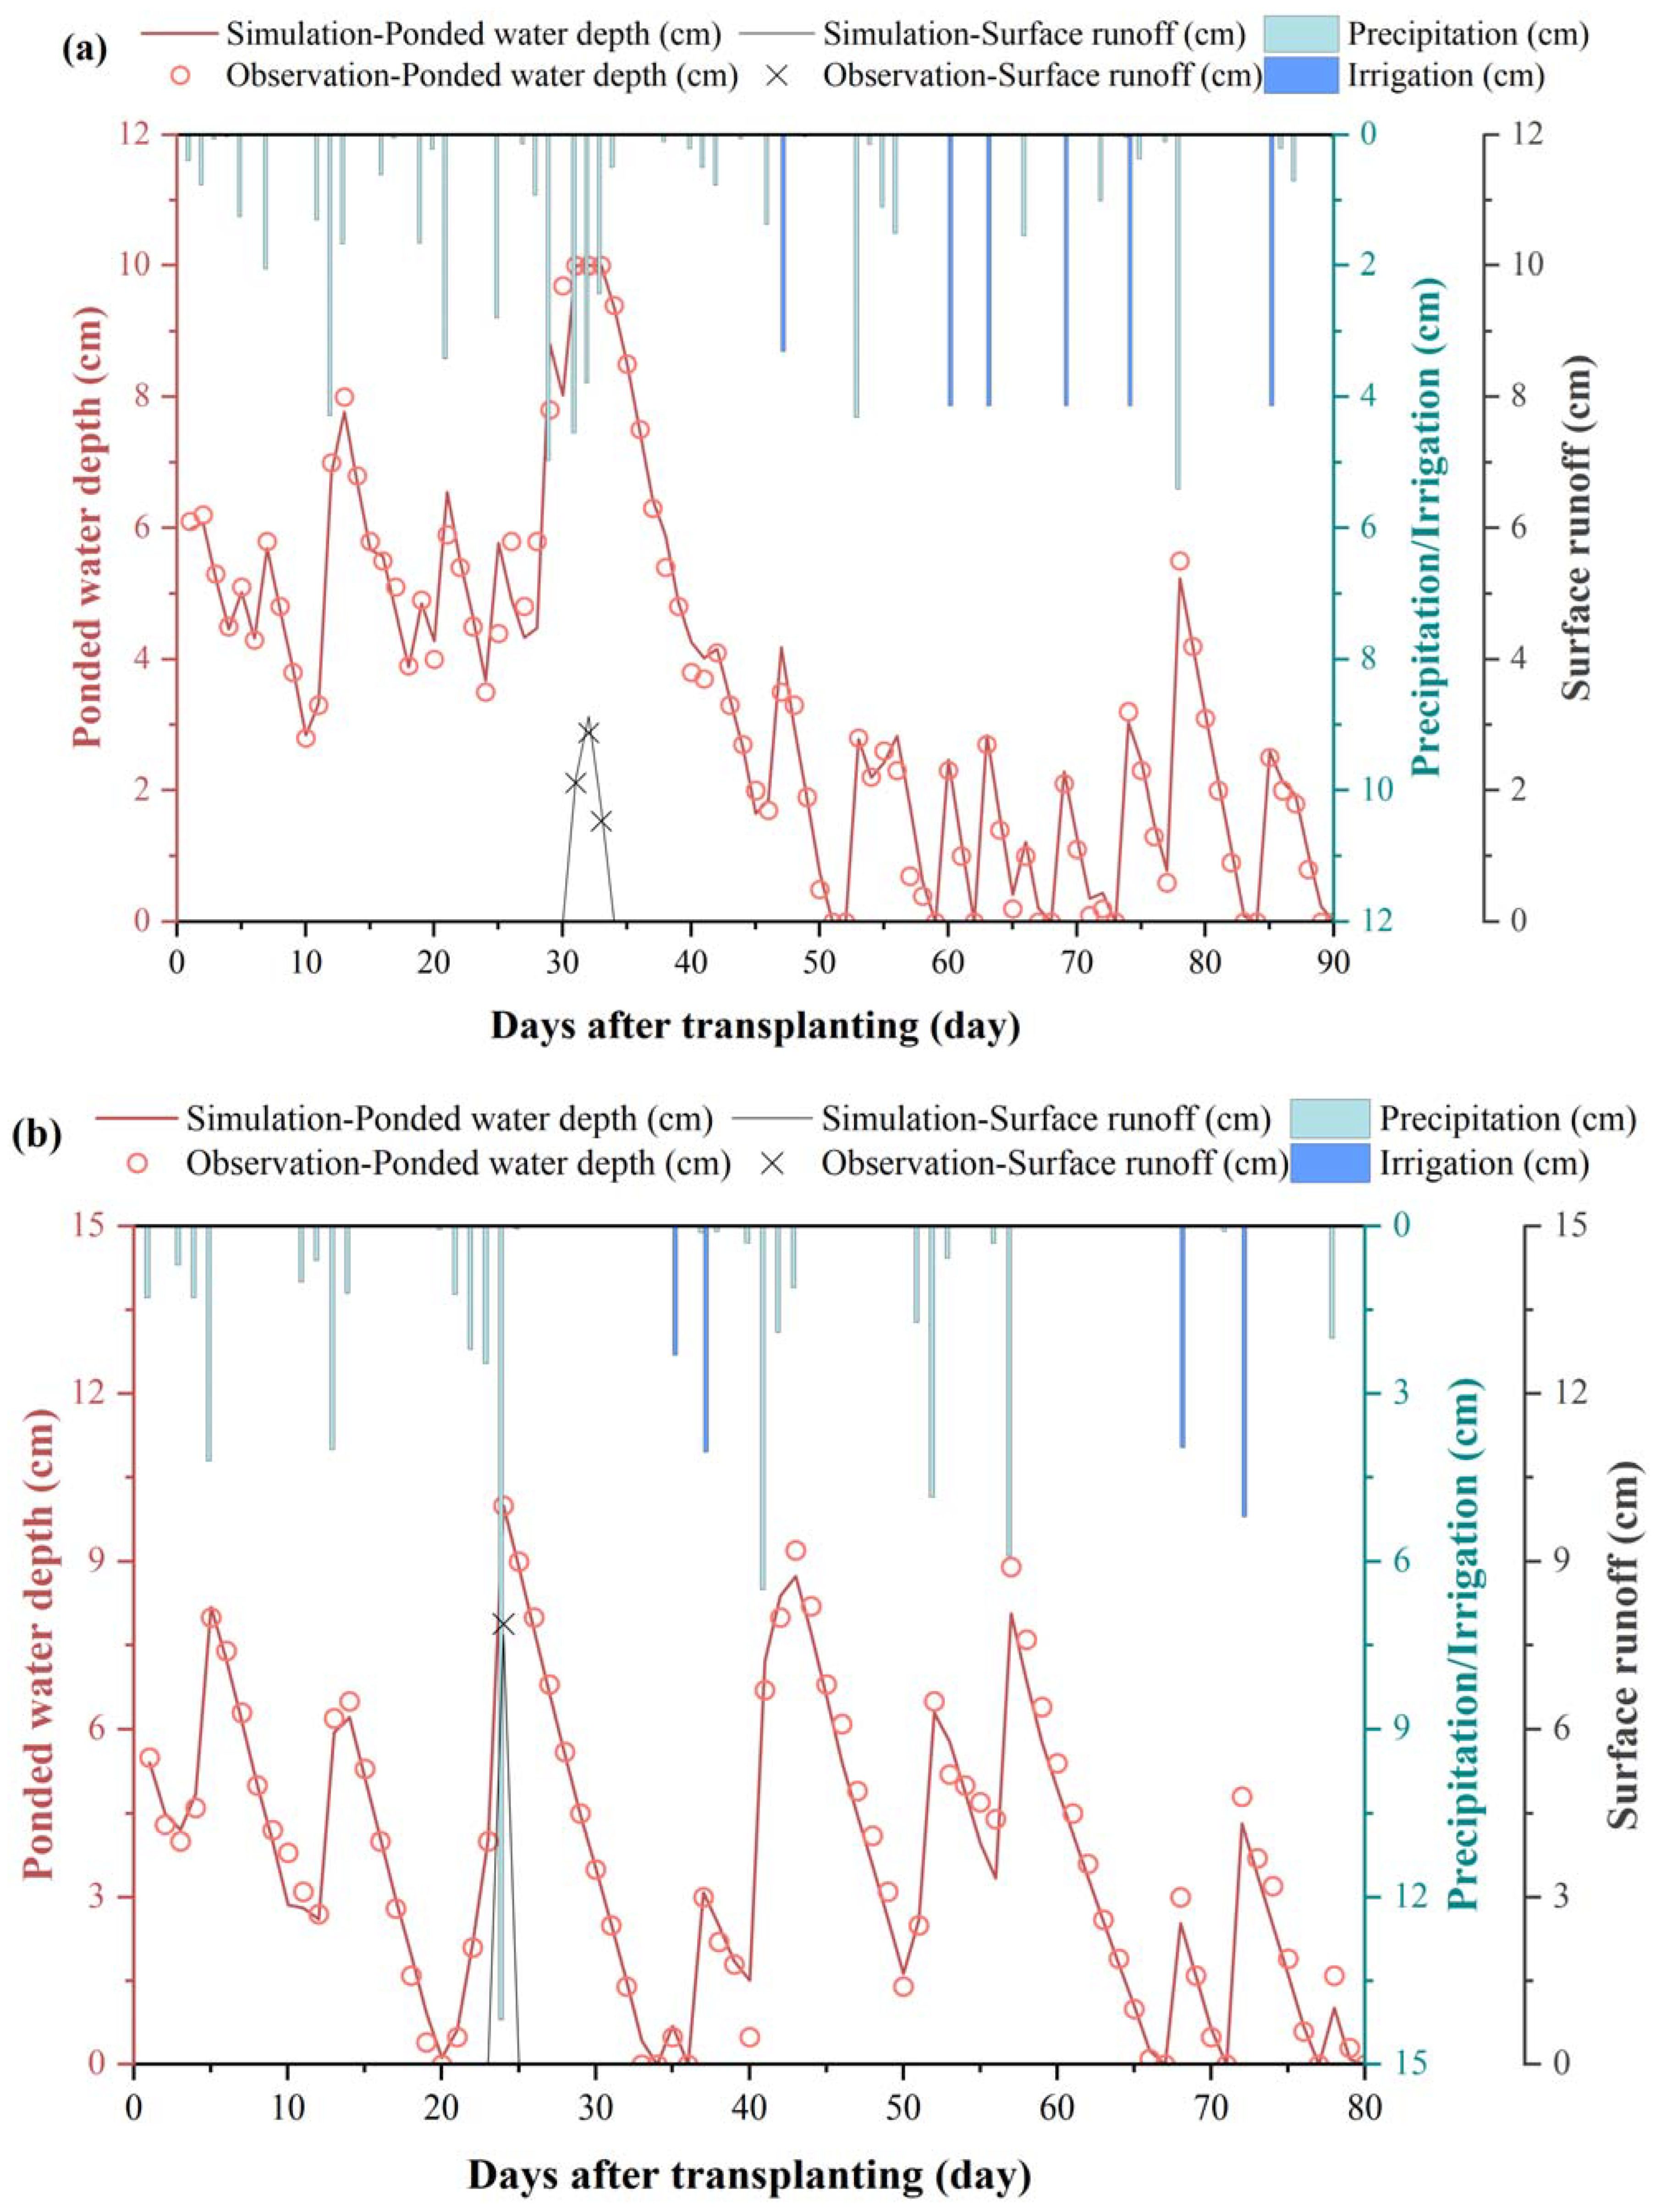
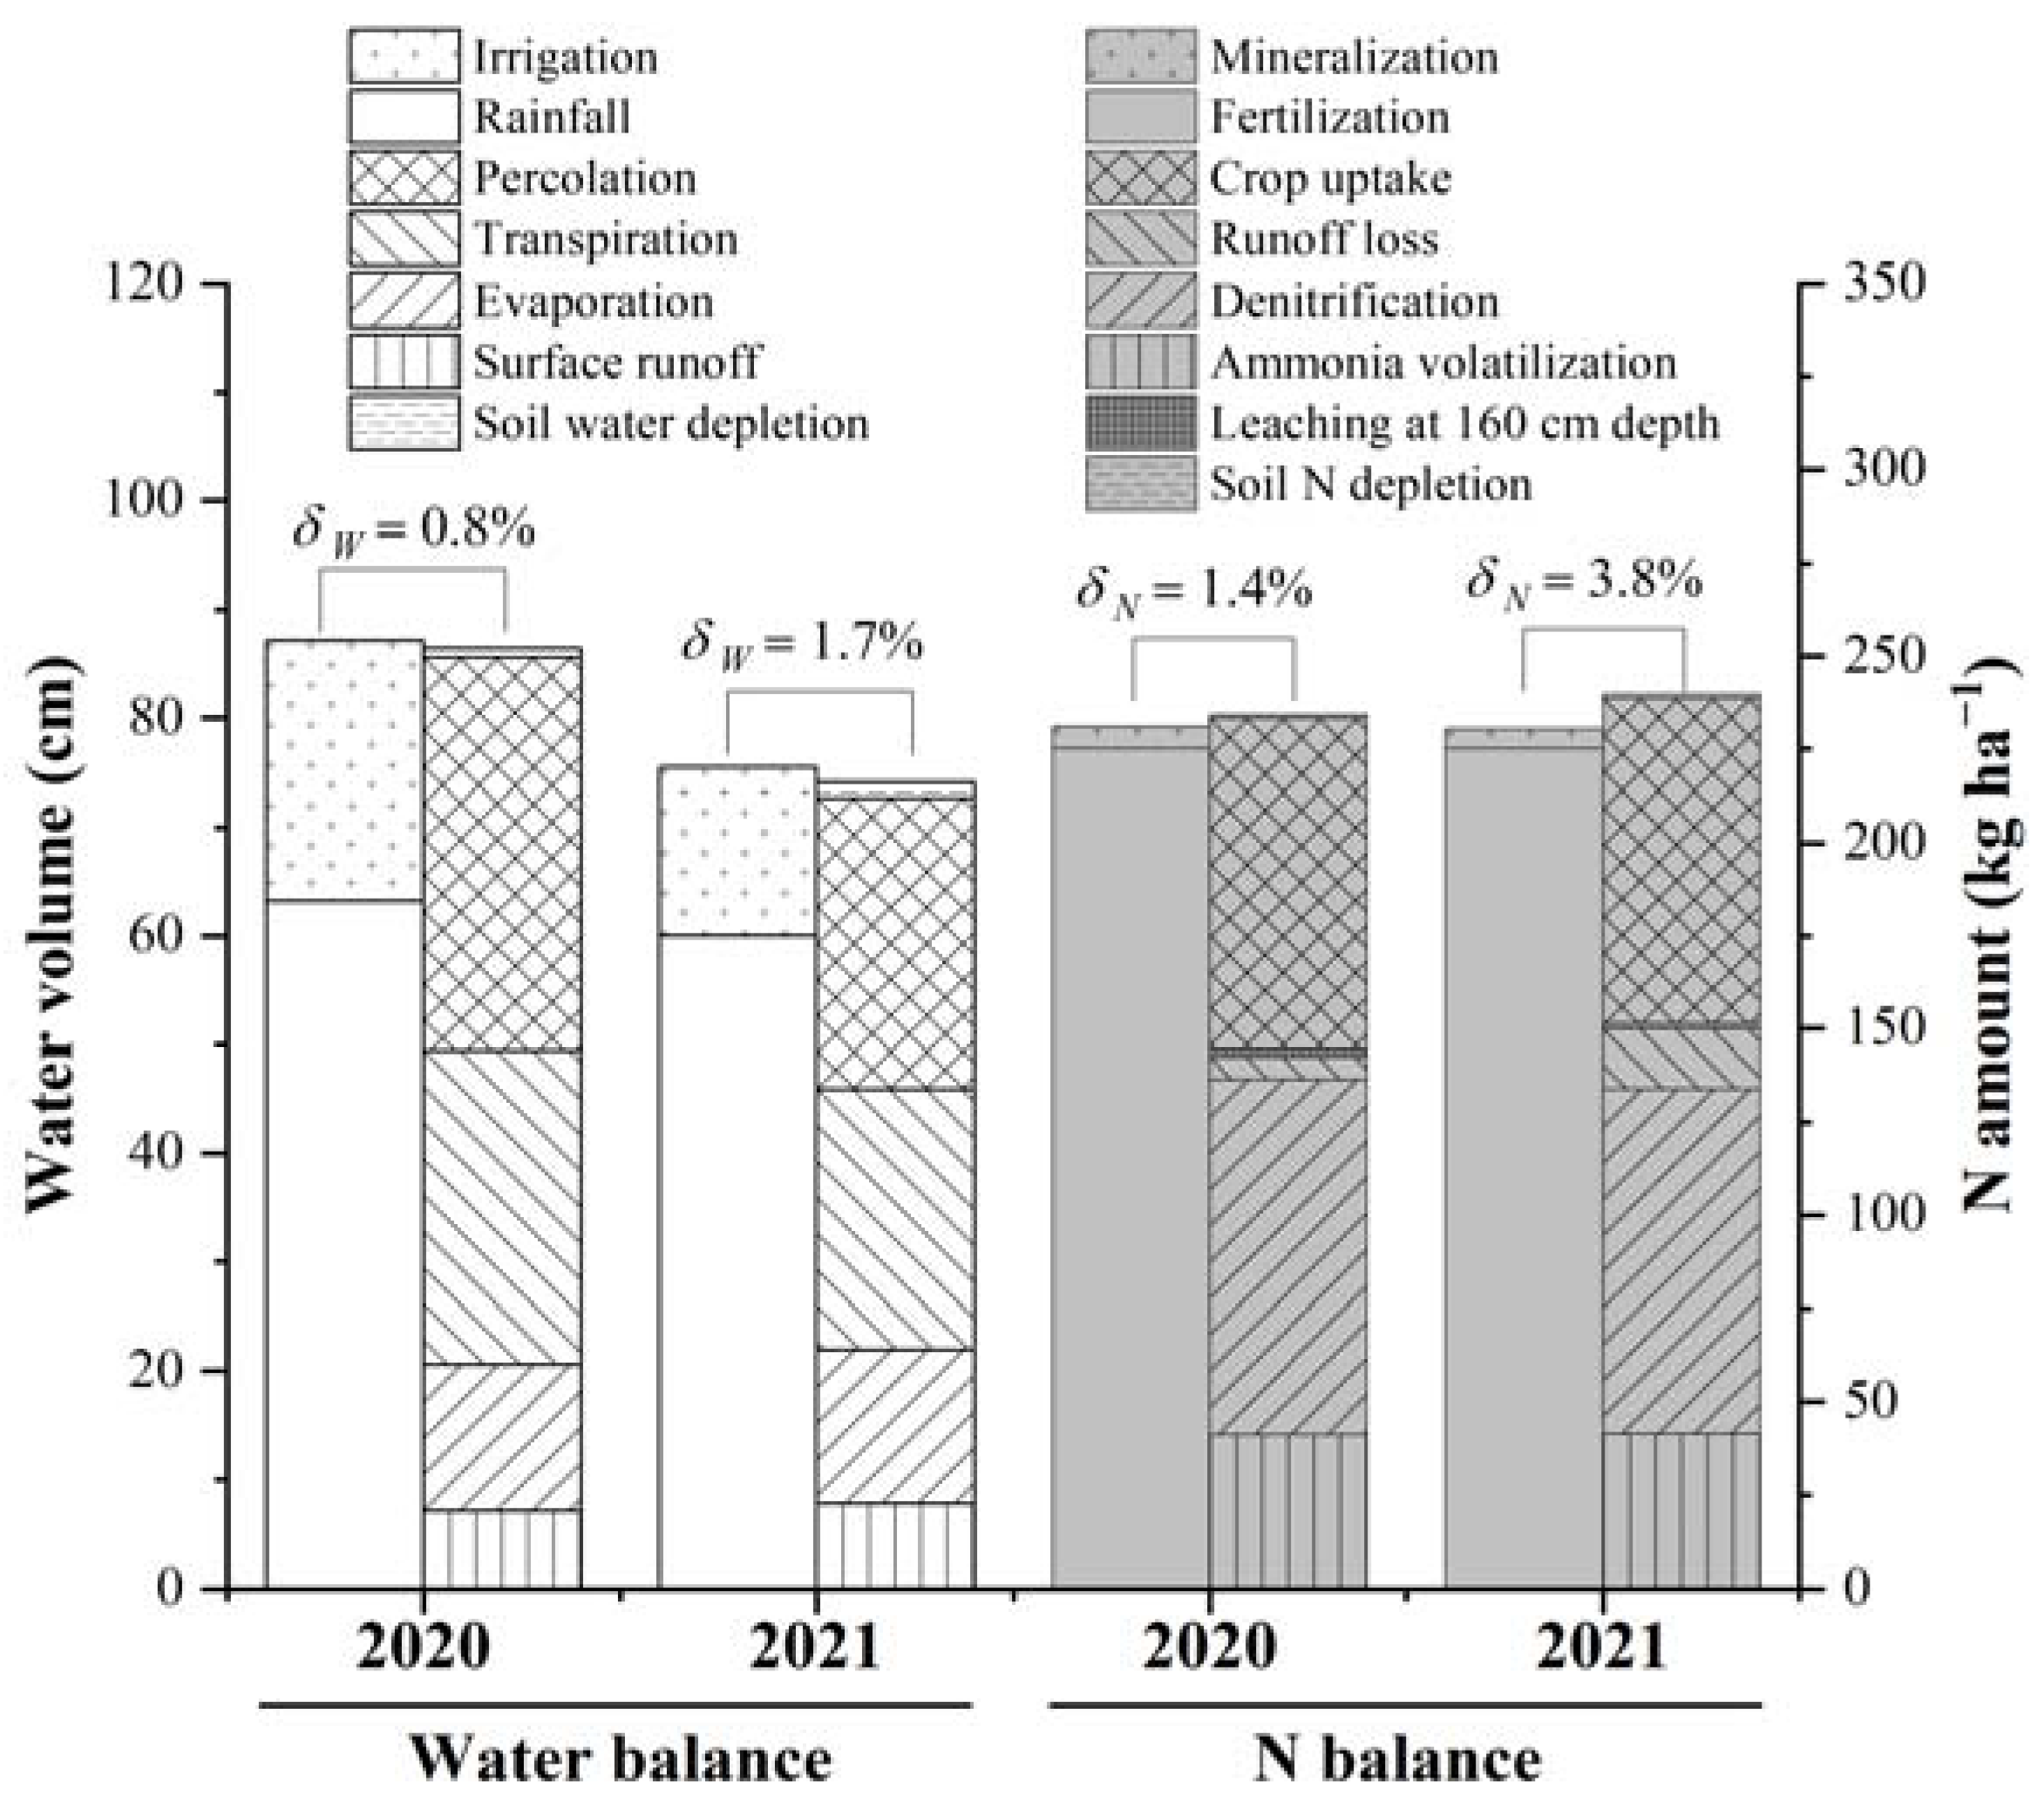
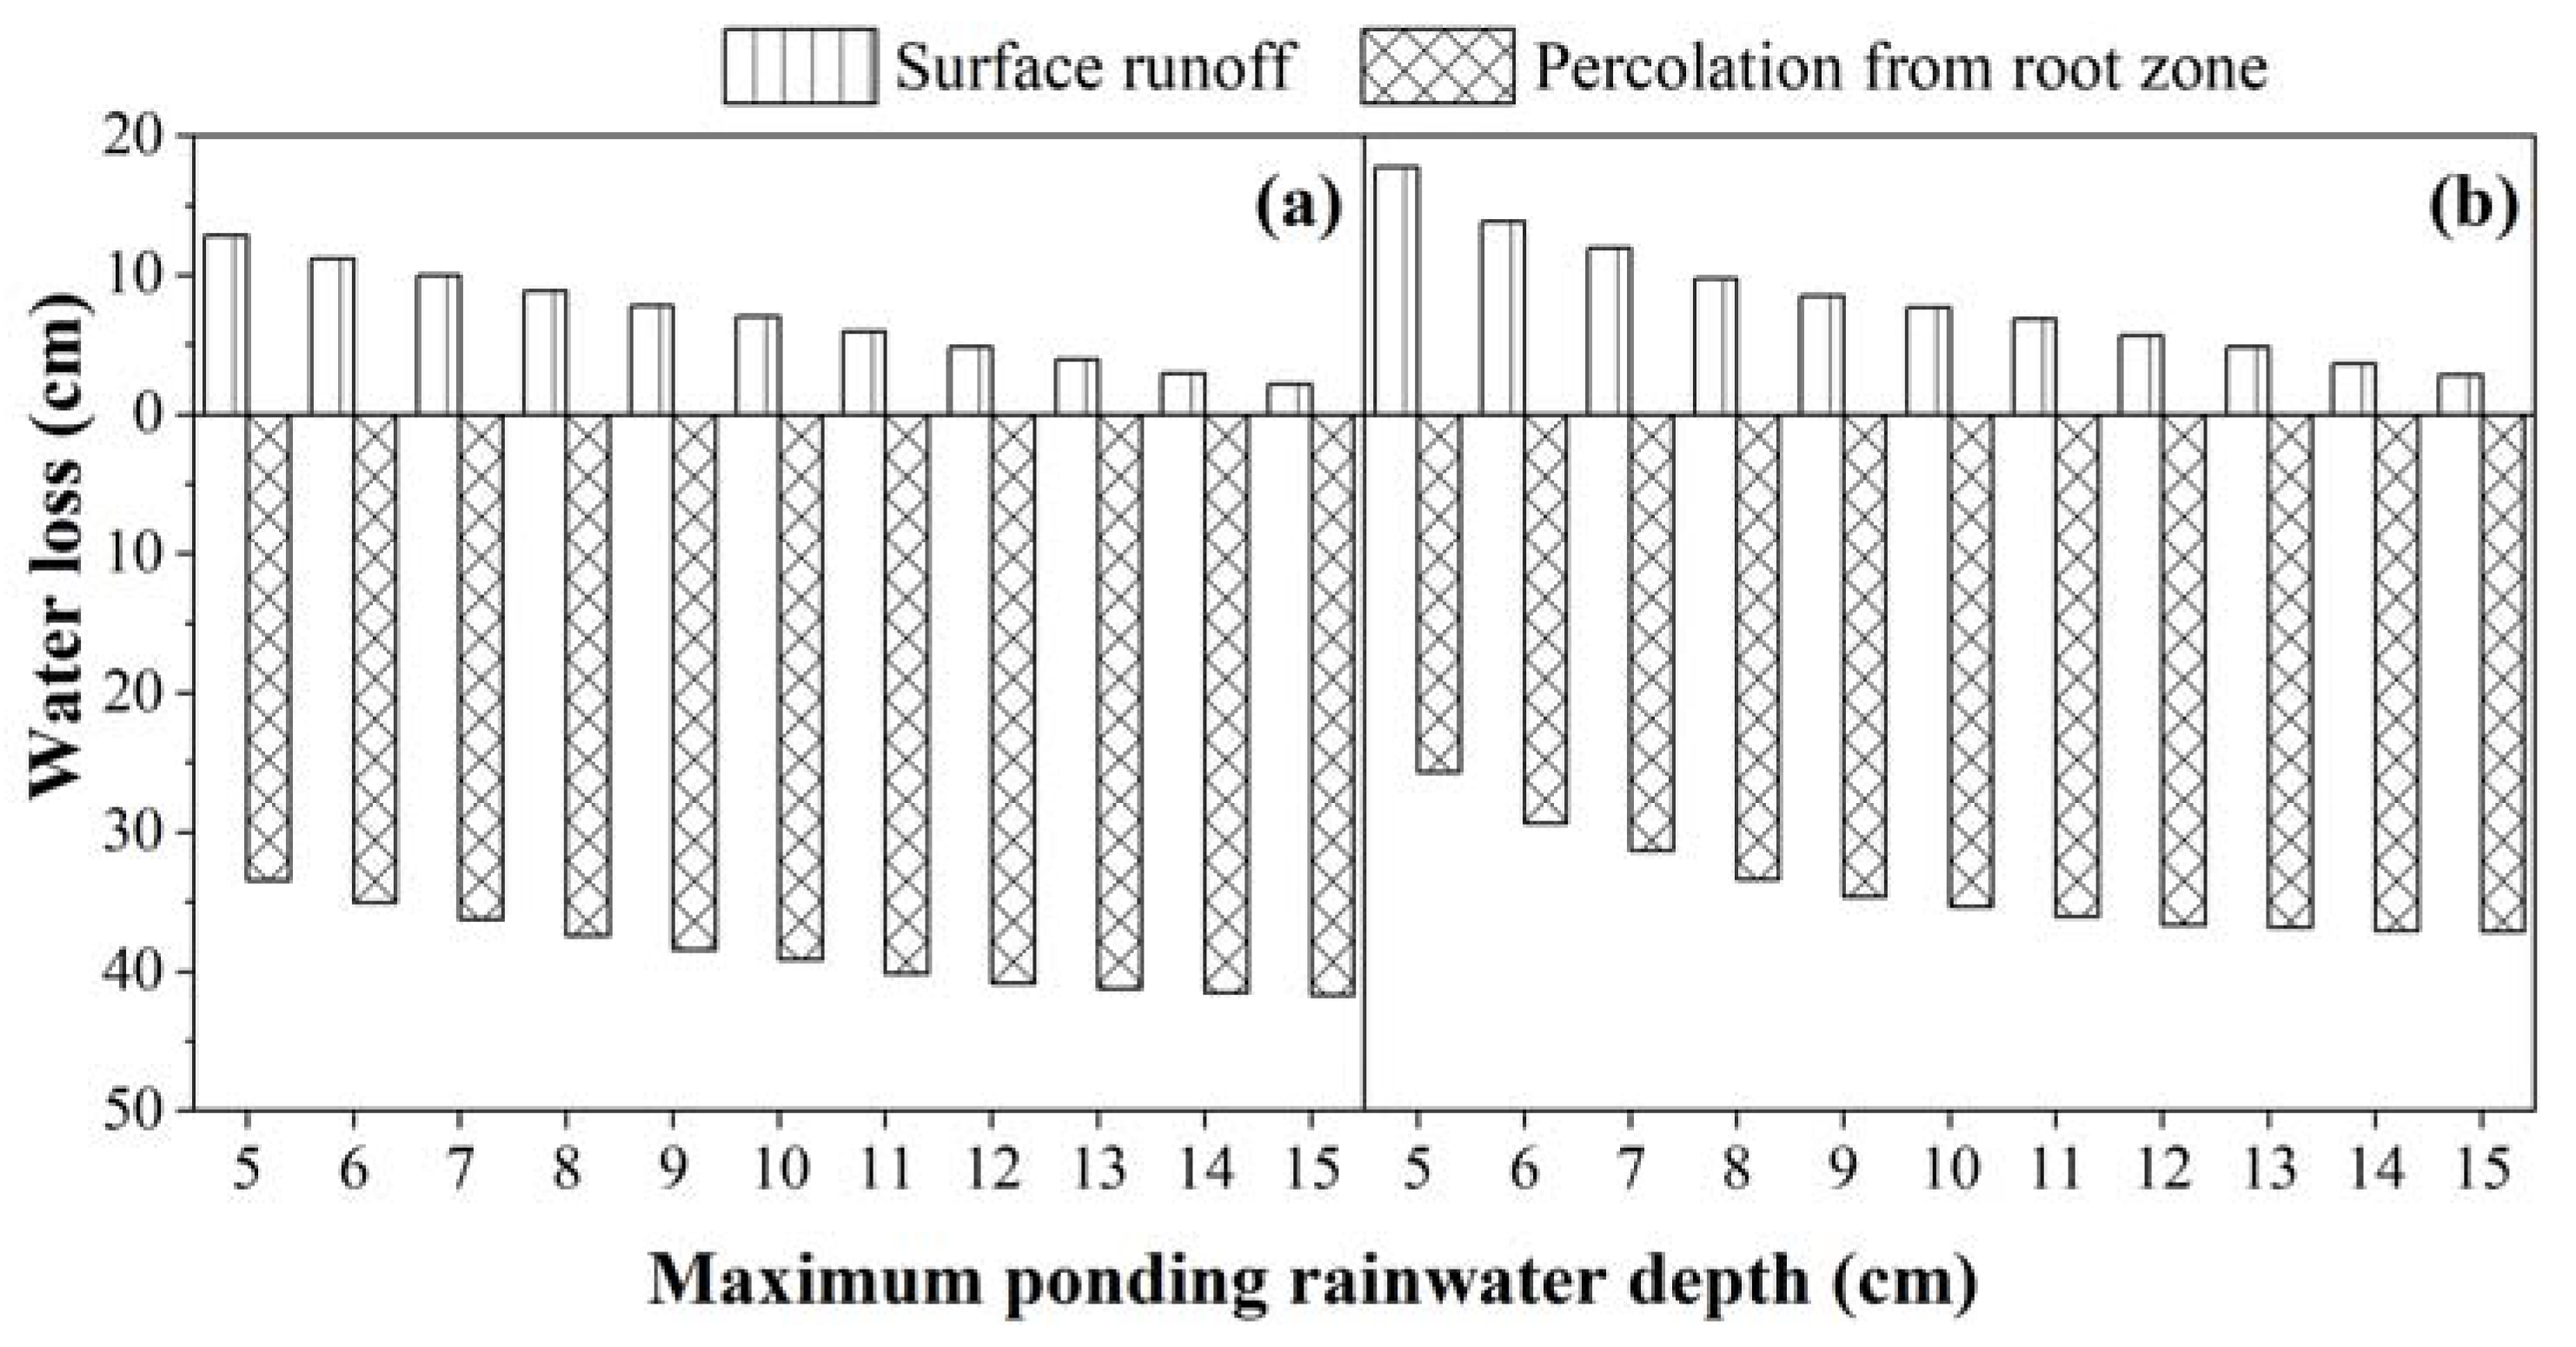
3.2. Analysis of Field Water Dynamics and Balance

Figure 3a,b shows the dynamics of precipitation, irrigation, surface runoff, and ponded depth during the 2020 and 2021 rice-growing seasons, respectively. Apparently, the overall trend of observed hp was in good agreement with simulated values, but differences between simulated and observed values during 2020 and 2021 mainly occurred during rainstorm events and alternate drying and wetting periods. During the 0–35 DAT in 2020, frequent heavy rainfall lasting for about one month kept hp at more than 4 cm. In addition, three drainage events exceeding the upper limit of paddy rainwater storage resulted in a total surface runoff of 6.5 cm. Due to the large evapotranspiration of paddy fields on continuous sunny days, six irrigation events in the periodic dry/wet cycles occurred in the latter half of the season. In contrast, in the 2021 season, a rainstorm of 14.19 cm per day on the 24 DAT raised hp to a maximum depth of 10 cm, causing surface runoff which reached 7.9 cm within one day. Under the regime of controlled drainage, the paddy field experienced long-term flooding and anaerobic conditions (Figure 3). The alternating occurrence of drought and flood may have an adverse impact on the rice growth process [52]. How to optimally control the rainwater storage amount and time to reduce the impact on rice yield under water-saving irrigation paddies merits further research.
As shown in Figure 4, the cumulative precipitation in the 2021 season was 59.9 cm, which was 5.1% lower than that in the 2020 season, but the rainwater use efficiency (i.e., surface runoff/rainfall) in the 2021 season was 15.4% higher than that in the 2020 season with irrigation reduced by 35.4%. According to simulated values, hp above 3 cm during the 2020 and 2021 seasons were 47 and 43 days, respectively, and the corresponding deep percolation was 36.2 and 25.8 cm, respectively. Moreover, simulated ET (evaporation + transpiration) in 2020 and 2021 accounted for 49.3% and 52.6% of total water input (TWI) respectively, and deep percolation accounted for about 42.1% and 35.5% of TWI, respectively. Frequent heavy rain and more irrigation events during 2020 resulted in much more percolation water. Actually, the paddy plow pan with relatively low buffers the vertical soil water movement during the dry/wet alternating stage [53], making it possible to couple water-saving irrigation and controlled drainage in paddy fields. The water balance errors were 0.8% and 1.7% of TWI, indicating that it was reliable in applying HYDRUS-1D to analyze the water balance in rice paddies. With less rainwater loss via surface runoff, controlled drainage applied in paddy fields could utilize freshwater resources sufficiently for irrigation in the humid climate.

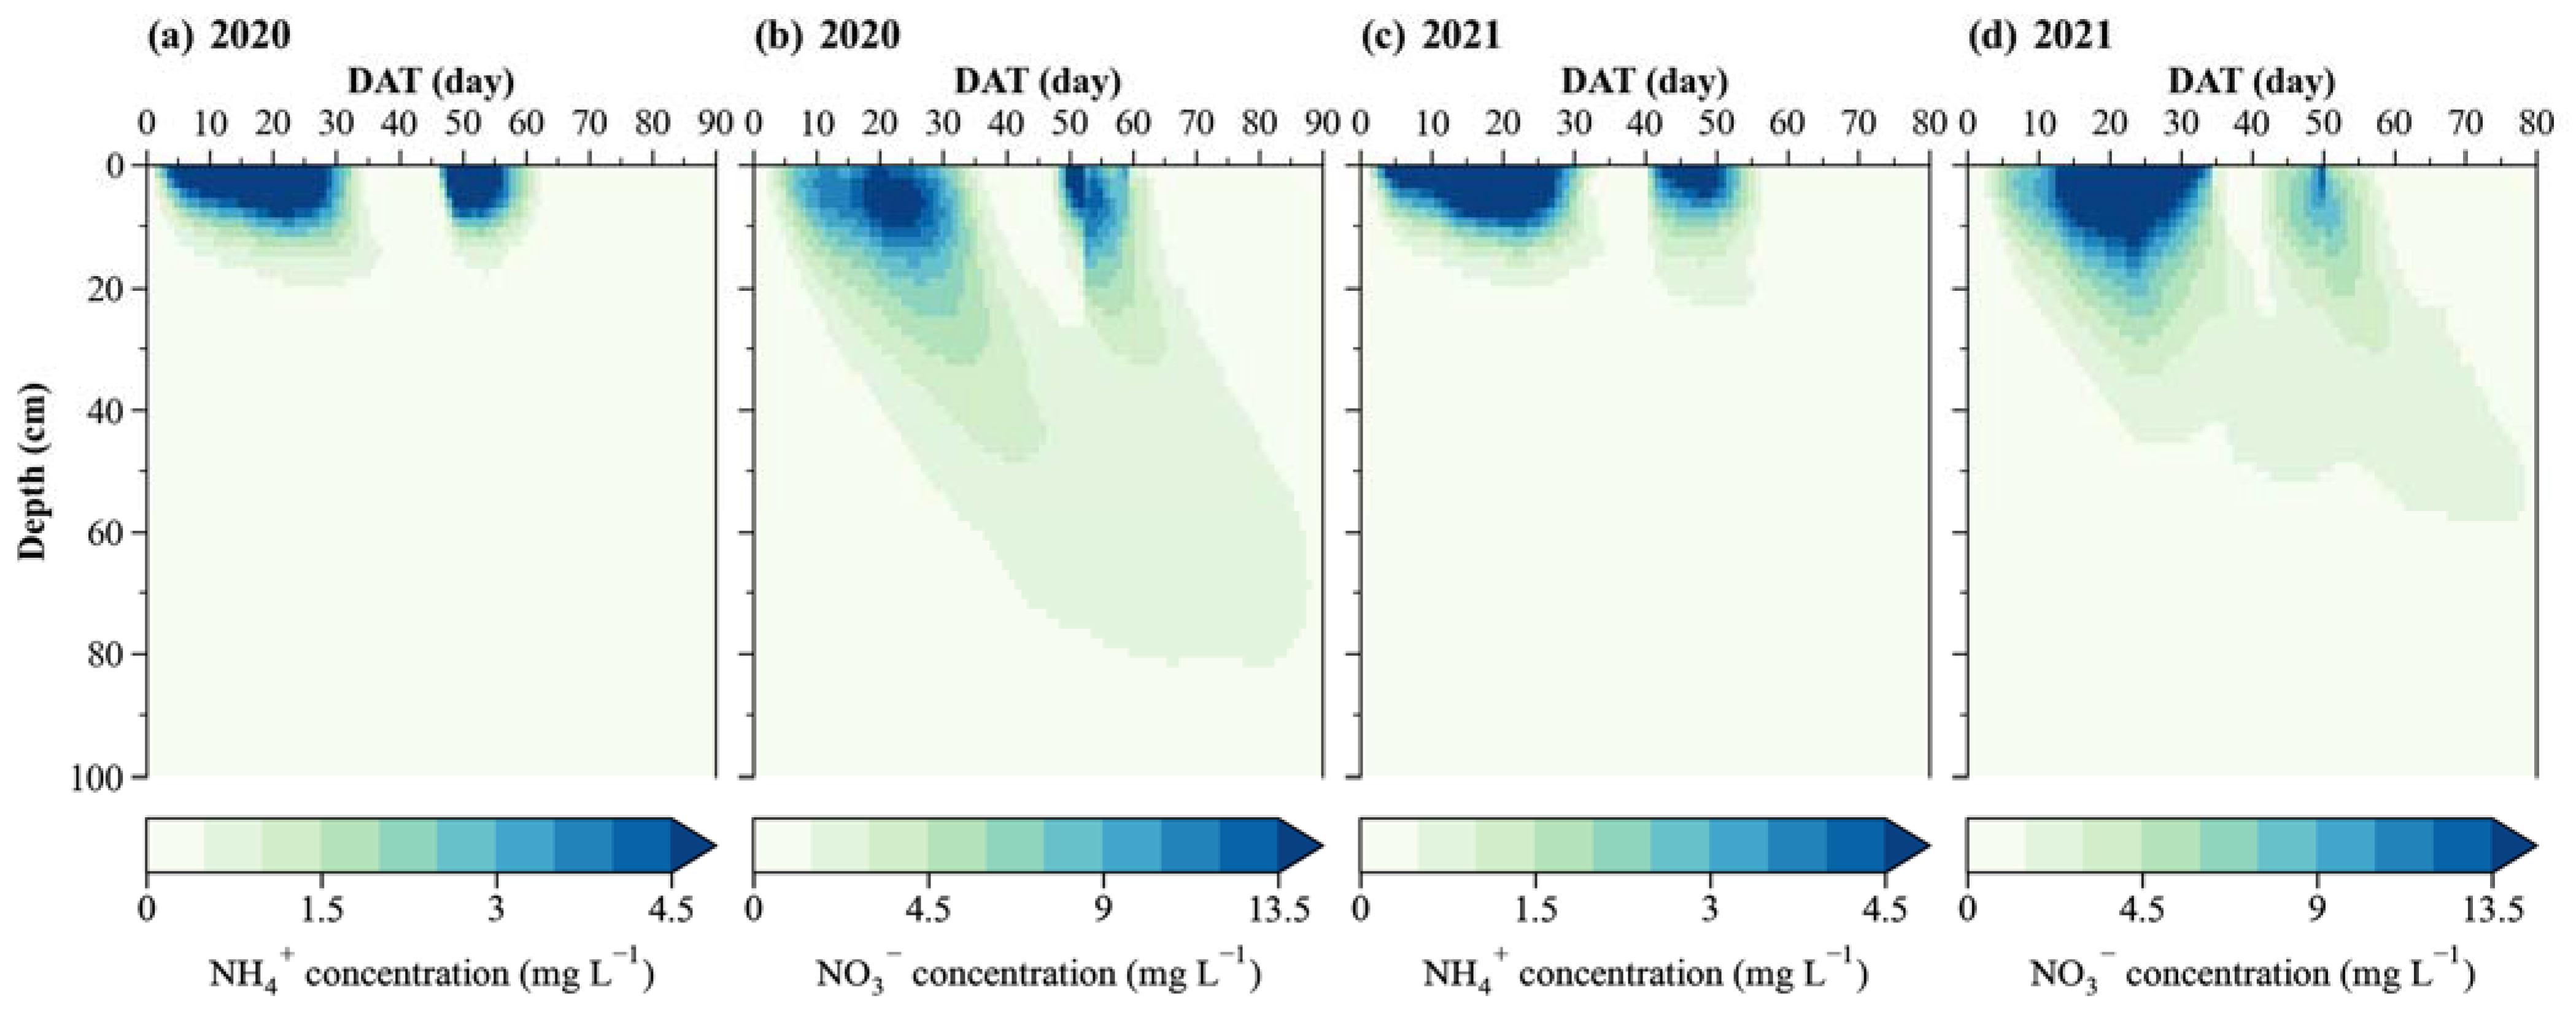
3.3. Analysis of N Concentration Dynamics and N Balance

Figure 5 shows the dynamics of surface NH4+-N and NO3-N concentrations for two seasons, and the overall trend of the simulation was in good agreement with the measured value. In particular, the N concentration increased abruptly after the soil surface dried up and encountered irrigation or rainfall, whose peak values were difficult to capture by field sampling and monitoring. Frequent intense rainfall also reduced the accuracy of the model simulation results matching the observed N concentrations. The distribution of N leaching at the depth of 0–100 cm soil profile is shown in Figure 6. N leaching occurred mainly within two weeks after fertilizer application, especially under conditions of large rainwater storage at the paddy field surface. In both seasons, two peak values of N concentrations were observed after urea fertilization, tillering and spikelet-developing fertilizer, respectively. The concentrations of NH4+-N and NO3-N at the upper 0–10 cm soil were higher than 3.0 and 9.0 mg L−1 within 1–2 weeks after fertilization, respectively. The NO3-N values throughout the soil column were higher than that of NH4+-N, and the NO3-N leaching was more frequent than that of NH4+-N. In addition, the plow pan with low permeability at depths of 20–40 cm prevented nutrients from leaching deeper soil layers (Figure 6), which was fundamental to rice water-saving irrigation.
N dynamics in paddy fields are uncertain and time-varying affected by the wetting and drying states of soil [17]. Urea was hydrolyzed to NH4+-N first, then diffused mainly to the upper 0–20 cm soil and continuously provided an N source for nitrification. In the latter half of each season, a concentration decline of NH4+-N was observed under aerobic conditions of alternating dry and wet in paddy fields. It should be noted that compared with NO3-N, NH4+-N was prone to adsorbing to negatively charged soil, thus significantly retarding its leaching [54]. Long-term rainwater storage may reduce oxygen in the rhizosphere, which prevents nitrification of NH4+-N, as well as its leaching [55]. Moreover, relatively high NO3-N leaching continued before the soil wetting/drying stage. The concentration of NO3-N above the plow pan remained above 3 mg L−1 for two seasons (Figure 6), and the difference in surface flooding duration affected the soil depth of N loads leaching. Considering that rice roots were predominantly distributed in the upper 60 cm depth of the soil column, the transport and transformation process of N in the upper soil layer affected the efficiency of nutrient uptake by rice.
Quantitative and precise analysis of N balance is beneficial to understanding N fertilizer use efficiency and loss pathways. As illustrated in Figure 4, during the 2020 and 2021 seasons, N gaseous loss from the simulated 160 cm soil column accounted for more than half of total N input (TNI) on average, i.e., ammonia volatilization (17.5%) and denitrification (39.7%), while the N absorbed and utilized by crops accounted for 37.1% of TNI on average. Except that N runoff loss was 5.8 and 16.0 kg ha−1 for the 2020 and 2021 seasons respectively, other N output components were close. Both N leaching and soil N depletion accounted for less than 5% of TNI on average. The total N balance errors of simulations were less than 3.8% of TNI for the 2020 and 2021 seasons. Typically, nitrification and denitrification are two important processes in paddy fields, and ammonia volatilization and N2O emission are important ways of N loss in the paddy field [56,57,58]. The N balance results were similar to previous studies [47,49], which were affected by the degree of soil saturation, oxygen, and temperature [59]. Additionally, rice roots and microorganisms, variably distributed in the soil, significantly affect the N transformations, which makes the N distribution in the soil profile more complex. In terms of the N balance system of the entire rice field, TNI component such as wet deposition was neglected in the calculation.

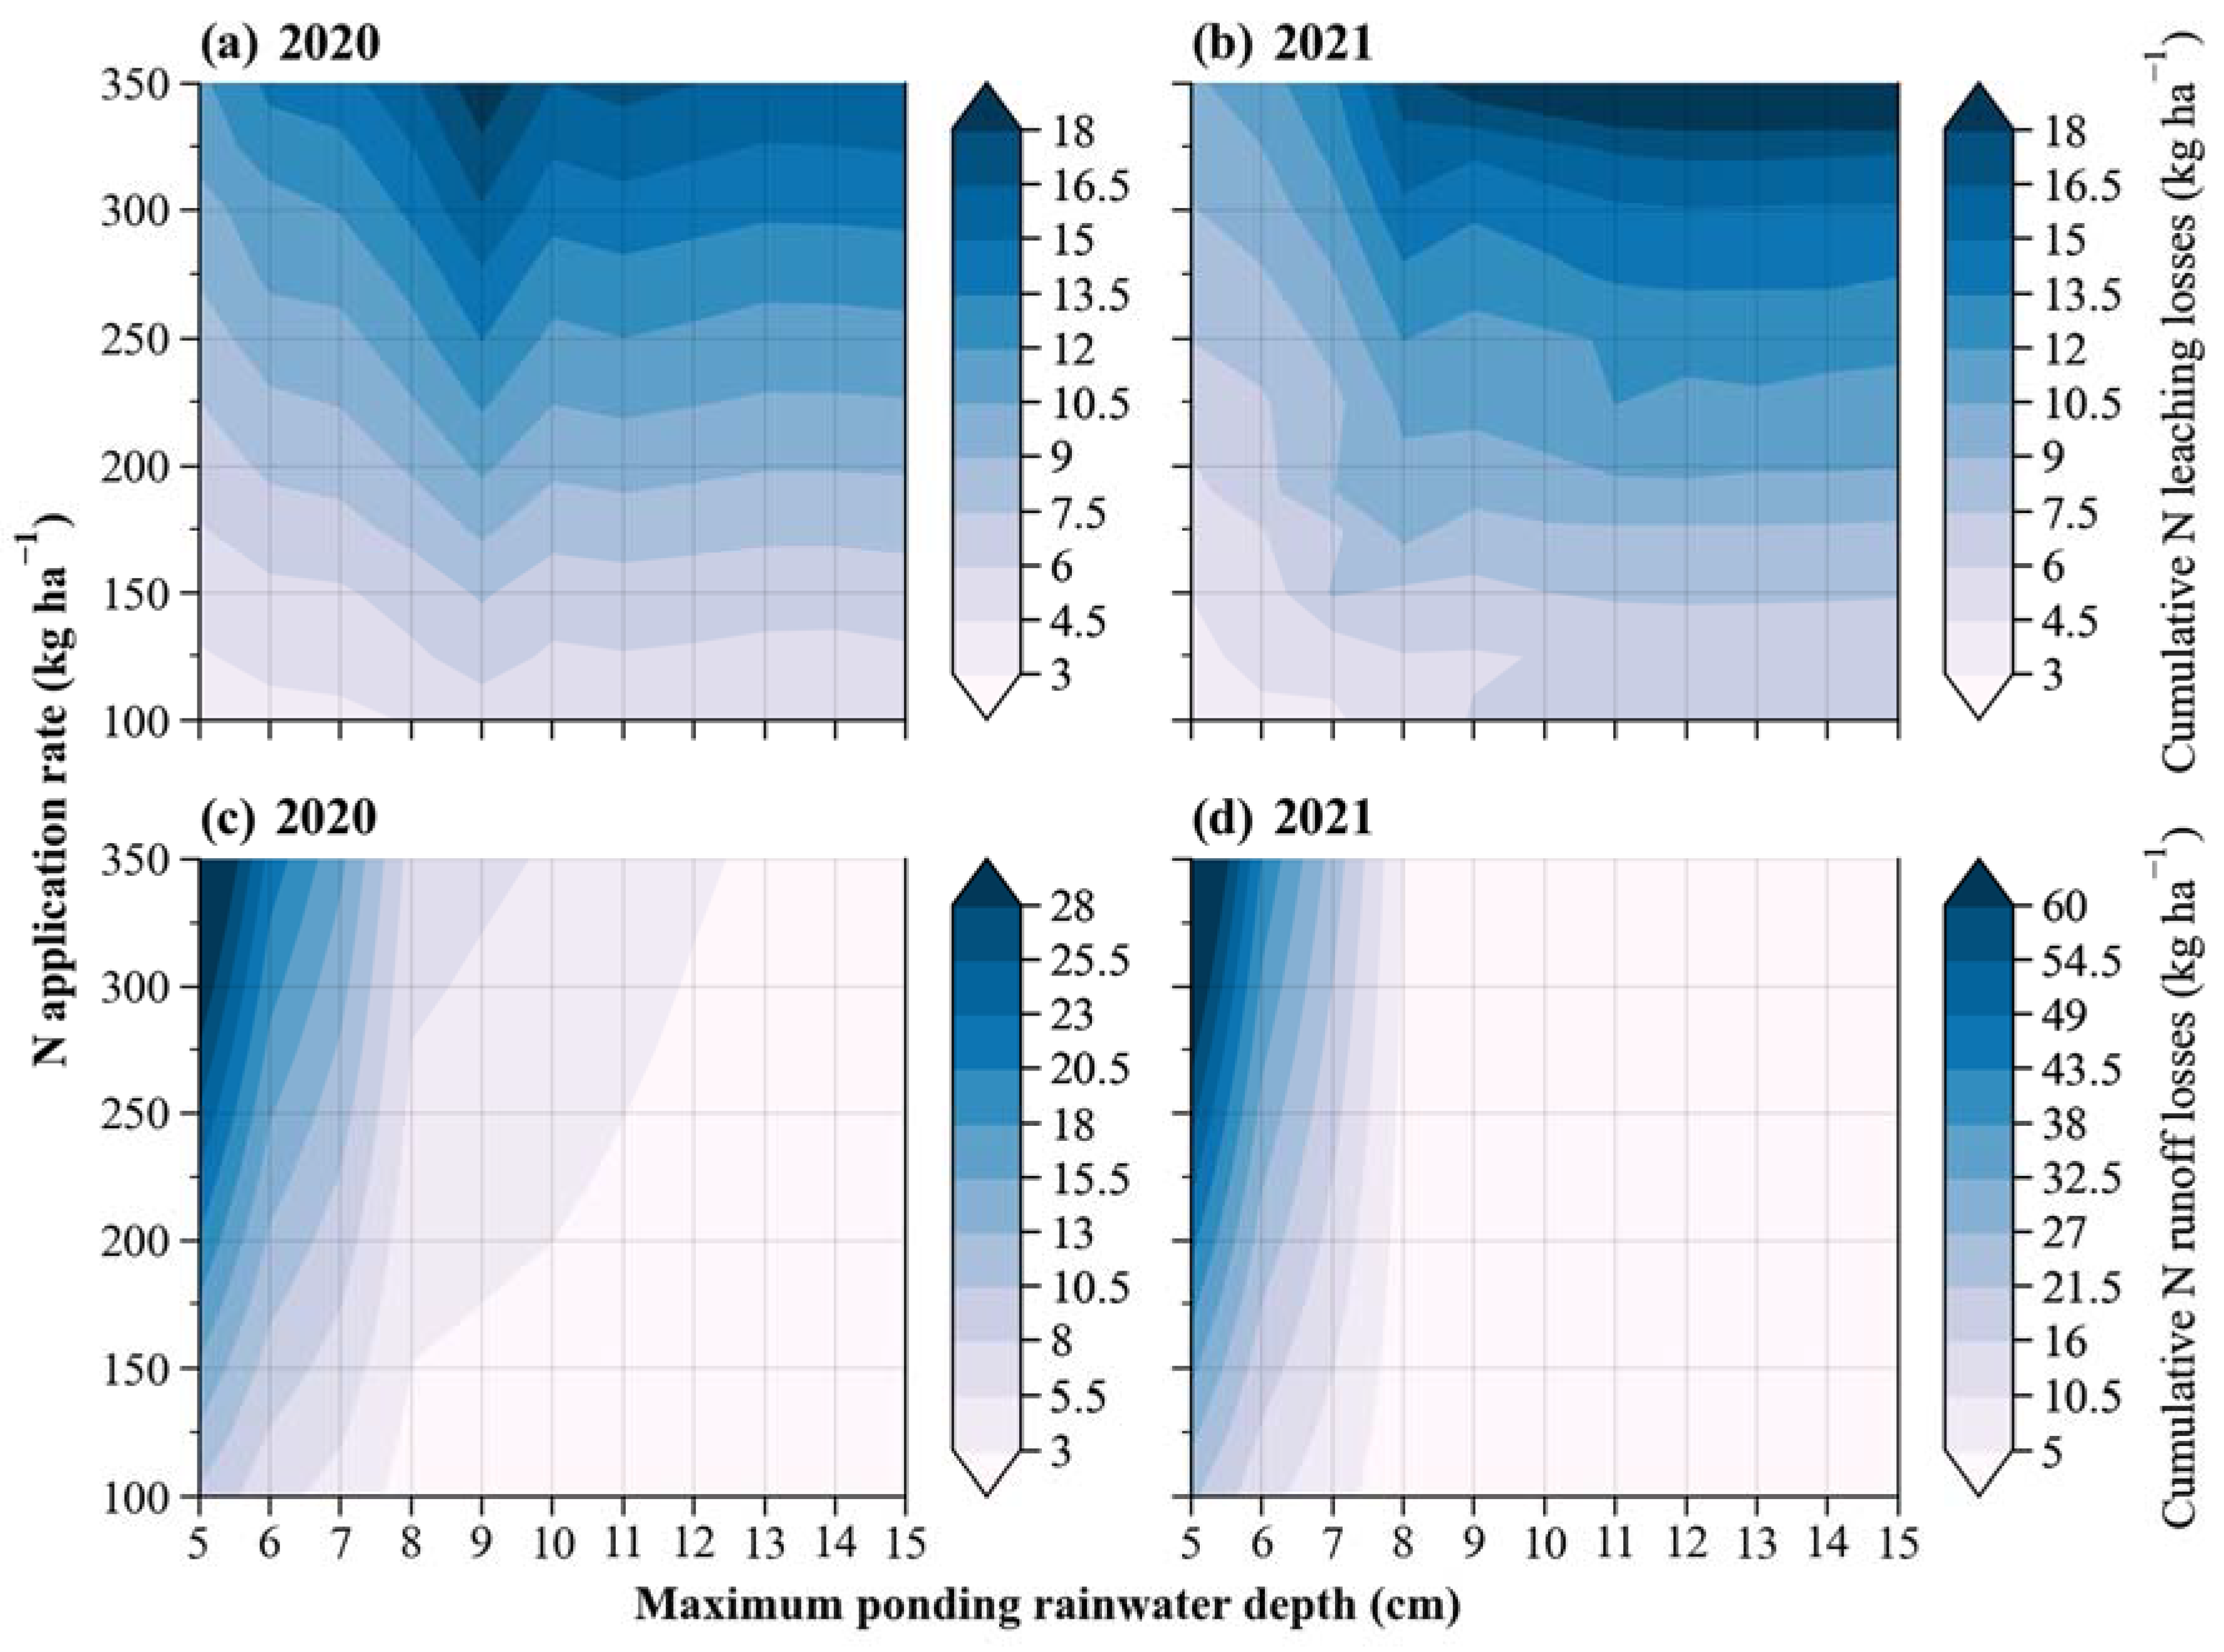
3.4. Scenarios of Paddy Controlled Drainage and N Fertilizer Application

Generally, paddy fields have the characteristics of bunds and plow pans. The former is established to allow surface water ponded to maintain the humid environment for lowland paddy, and the latter can retard the water and nutrients leaching from the root zone due to its low hydraulic conductivity. Figure 7 shows surface runoff and percolation from the root zone at a depth of 60 cm under different thresholds of hmax for controlled drainage. The percolation of the root zone greatly increased when hmax ranged from 5 to 10 cm, and then the increment of percolation slowed down when hmax continued to increase. In the seasons of 2020 and 2021, when hmax was increased from 5 cm to 10 cm, surface runoff loss of paddy field was reduced by 45.3% and 56.7%, respectively, and the corresponding leakage was increased by 17.0% and 37.8%, respectively; when hmax was increased from 10 cm to 15 cm, surface runoff loss of paddy field was reduced by 69.0% and 63.2%, respectively, and the corresponding leakage was increased by 6.5% and 5.0%, respectively. Over the two typical years, the maximum surface runoff and percolation reached 17.8 cm and 41.7 cm, respectively. Downward leaching from the root zone represented the largest portion of the available water for rice. Based on mini-tensiometers and double-ring infiltrometer measurements [60], it was reported that the infiltration rate of the paddy field increased by 1.5 times when hp increased from 6 cm to 16 cm. Leaching predominantly depended on the soil hydraulic conductivity of each soil layer and the overall pressure head gradient that changed with surface ponding depth [53].
Runoff and leaching are the direct pathways of N load loss from farmland to the adjacent water environment [61]. Figure 8 shows that the changes in cumulative N leaching loss and surface runoff loss are similar under all scenarios of controlled drainage and N fertilizer application. N loss via surface runoff was very small and showed little variation when hmax was greater than 12 cm in the 2020 season and 8 cm in 2021. Under the current N application rate (225 kg N ha−1), when hmax was set to 15 cm, the average N leaching loss was 11.10 kg ha−1 and the average N runoff loss was 0.44 kg ha−1 for two typical years. When hmax was lower than 8 cm, surface runoff was more sensitive to the threshold of controlling drainage. The proportion of N runoff loss to TNI exceeded 20% when the N application rate reached 300 kg ha−1. Meanwhile, the risk of N leaching loss was relatively low and stable when the strategy of low fertilizer rate and low rainwater storage was adopted. In both the 2020 and 2021 seasons, N leaching loss reached above 12 kg ha−1 when the N application rate was between 250 and 350 kg ha−1 and hmax was higher than 10 cm. N loss via leaching and surface runoff showed a positive trend with increasing N application levels. Thus, our study suggested that it was difficult for controlled drainage to reduce N loss via surface runoff and leaching at the same time while controlling the N application rate was more sensitive to reducing the non-point pollutants of N.
Unreasonable agricultural water management practices, such as uncontrolled over-irrigation and leakage loss from irrigation channels, may make the lowland paddies prone to flooding and waterlogging [62]. Although a large threshold of hmax can be set in the rice water-saving irrigation regime to reduce surface runoff, more and longer rainwater storage in paddy fields increased the loss of deep percolation, which may increase the risk of N leaching. The higher soil surface water pressure was accompanied by more vertical water flow, as well as N leaching. Moreover, long flooding and anaerobic conditions may have a negative impact on rice growth and yield [52]. However, HYDRUS-1D faced difficulties in assessing the impact of flooding on crop production due to its limited number and accuracy of modules. In further investigation, it is necessary to couple hydrologic and crop growth models to analyze the comprehensive processes of soil water movement, nonpoint nutrient loss, and crop growth, and develop a more robust water-saving and environmentally friendly rice production technology.

4. Conclusions

Field water dynamics and N transport and transformation of a rice paddy have been monitored and simulated with the HYDRUS-1D model. The calibrated results showed that the model has better accuracy in simulating hp and NO3-N concentration, followed by the simulation of NH4+-N. Evapotranspiration and deep percolation were two dominant losses of TWI across two seasons, while ammonia volatilization and denitrification from the entire soil column accounted for more than half of TNI. Plow pan with low permeability reduced the downward migration of water and solute, especially NH4+-N. The proportion of N runoff loss to TNI exceeded 20% when the N application rate reached 300 kg ha−1. Additionally, it should be noted that more and longer rainwater storage in paddy fields increased the loss of deep percolation, which increased the risk of N leaching. Therefore, it was difficult to achieve optimal control of N loss via both surface runoff and leaching at the same time under controlled drainage, and reducing the N fertilizer level was more effective than increasing the allowable rainwater storage threshold of controlled drainage. It merited further investigation on the comprehensive effects of controlled drainage and N application on rice production and diffuse agricultural pollution with the coupled hydrologic and crop growth models.

Author Contributions

Conceptualization, S.Y. and K.C.; methodology, K.C. and T.M.; software, K.C. and Y.L.; validation, K.C. and Y.L.; formal analysis, K.C. and G.Z.; investigation, K.C., Y.D. and Y.L.; data curation, Y.L. and P.H.; writing—original draft preparation, K.C.; writing—review and editing, K.C. and T.M.; visualization, K.C.; supervision, S.Y., J.D. and T.M.; funding acquisition, S.Y., J.D. and T.M. All authors have read and agreed to the published version of the manuscript.

Funding

This research was funded by the National Natural Science Foundation of China (Grant No. 51879074 and 52109051), the Postgraduate Research & Practice Innovation Program of Jiangsu Province (Grant No. KYCX21_0540), and the financial support from the 2020 Jiangsu Entrepreneurship and innovation Program of Ph.D. researchers (Grant No. 202030453).

Institutional Review Board Statement

Not applicable.

Informed Consent Statement

Not applicable.

Data Availability Statement

Data is contained within the article.

Acknowledgments

We are grateful for the help of Qiong Wang, Yiqun Yin, and Xin Chen in the implementation of the experiment.

Conflicts of Interest

The authors declare no conflict of interest.

References

  1. Ma, L.; Ni, J.; Fleskens, L.; Wang, H.; Xuan, Y. Modelling Fertilizer Use in Relation to Farmers’ Household Characteristics in Three Gorges Reservoir Area, China. Agriculture 2021, 11, 472. [Google Scholar] [CrossRef]
  2. Fageria, N.K. Yield Physiology of Rice. J. Plant Nutr. 2007, 30, 843–879. [Google Scholar] [CrossRef]
  3. Diaz, R.J.; Rosenberg, R. Spreading Dead Zones and Consequences for Marine Ecosystems. Science 2008, 321, 926–929. [Google Scholar] [CrossRef] [PubMed]
  4. Cameira, M.D.R.; Santos Pereira, L. Innovation Issues in Water, Agriculture and Food. Water 2019, 11, 1230. [Google Scholar] [CrossRef] [Green Version]
  5. Jayaraman, S.; Dang, Y.P.; Naorem, A.; Page, K.L.; Dalal, R.C. Conservation Agriculture as a System to Enhance Ecosystem Services. Agriculture 2021, 11, 718. [Google Scholar] [CrossRef]
  6. Kim, J.S.; Oh, S.Y.; Oh, K.Y. Nutrient Runoff from a Korean Rice Paddy Watershed during Multiple Storm Events in the Growing Season. J. Hydrol. 2006, 327, 128–139. [Google Scholar] [CrossRef]
  7. Han, H.; Gao, R.; Cui, Y.; Gu, S. Transport and Transformation of Water and Nitrogen under Different Irrigation Modes and Urea Application Regimes in Paddy Fields. Agric. Water Manag. 2021, 255, 107024. [Google Scholar] [CrossRef]
  8. Tamini, T.; Mermoud, A. Water and Nitrate Dynamics under Irrigated Onion in a Semi-Arid Area. Irrig. Drain. 2002, 51, 77–86. [Google Scholar] [CrossRef]
  9. Pandey, A.; Li, F.; Askegaard, M.; Rasmussen, I.A.; Olesen, J.E. Nitrogen Balances in Organic and Conventional Arable Crop Rotations and Their Relations to Nitrogen Yield and Nitrate Leaching Losses. Agric. Ecosys. Environ. 2018, 265, 350–362. [Google Scholar] [CrossRef]
  10. Zhang, D.; Wang, H.; Pan, J.; Luo, J.; Liu, J.; Gu, B.; Liu, S.; Zhai, L.; Lindsey, S.; Zhang, Y.; et al. Nitrogen Application Rates Need to Be Reduced for Half of the Rice Paddy Fields in China. Agric. Ecosys. Environ. 2018, 265, 8–14. [Google Scholar] [CrossRef] [Green Version]
  11. Ma, T.; Zeng, W.; Lei, G.; Wu, J.; Huang, J. Predicting the Rooting Depth, Dynamic Root Distribution and the Yield of Sunflower under Different Soil Salinity and Nitrogen Applications. Ind. Crops Prod. 2021, 170, 113749. [Google Scholar] [CrossRef]
  12. Zhu, D.; Zhang, H.; Guo, B.; Xu, K.; Dai, Q.; Wei, H.; Gao, H.; Hu, Y.; Cui, P.; Huo, Z. Effects of Nitrogen Level on Yield and Quality of Japonica Soft Super Rice. J. Integr. Agric. 2017, 16, 1018–1027. [Google Scholar] [CrossRef]
  13. Stone, E.C.; Hornberger, G.M. Impacts of Management Alternatives on Rice Yield and Nitrogen Losses to the Environment: A Case Study in Rural Sri Lanka. Sci. Total Environ. 2016, 542, 271–276. [Google Scholar] [CrossRef] [PubMed]
  14. Wang, W.; Yu, Z.; Zhang, W.; Shao, Q.; Zhang, Y.; Luo, Y.; Jiao, X.; Xu, J. Responses of Rice Yield, Irrigation Water Requirement and Water Use Efficiency to Climate Change in China: Historical Simulation and Future Projections. Agric. Water Manag. 2014, 146, 249–261. [Google Scholar] [CrossRef]
  15. Ding, Y.; Wang, W.; Zhuang, Q.; Luo, Y. Adaptation of Paddy Rice in China to Climate Change: The Effects of Shifting Sowing Date on Yield and Irrigation Water Requirement. Agric. Water Manag. 2020, 228, 105890. [Google Scholar] [CrossRef]
  16. Bouman, B.A.M.; Peng, S.; Castañeda, A.R.; Visperas, R.M. Yield and Water Use of Irrigated Tropical Aerobic Rice Systems. Agric. Water Manag. 2005, 74, 87–105. [Google Scholar] [CrossRef]
  17. Li, J.; Qian, X.; Zhang, M.; Fu, K.; Zhu, W.; Zhao, Q.; Shen, G.; Wang, Z.; Chen, X. Methodology for Studying Nitrogen Loss from Paddy Fields under Alternate Wetting and Drying Irrigation in the Lower Reaches of the Yangtze River in China. Agric. Water Manag. 2021, 254, 106963. [Google Scholar] [CrossRef]
  18. Ouyang, W.; Chen, S.; Wang, X.; Shan, Y. Paddy Rice Ecohydrology Pattern and Influence on Nitrogen Dynamics in Middle-to-High Latitude Area. J. Hydrol. 2015, 529, 1901–1908. [Google Scholar] [CrossRef]
  19. Nan, Z.; Wang, X.; Du, Y.; Melching, C.S.; Shang, X. Critical Period and Pathways of Water Borne Nitrogen Loss from a Rice Paddy in Northeast China. Sci. Total Environ. 2021, 753, 142116. [Google Scholar] [CrossRef]
  20. Rudra, R.P.; Mekonnen, B.A.; Shukla, R.; Shrestha, N.K.; Goel, P.K.; Daggupati, P.; Biswas, A. Currents Status, Challenges, and Future Directions in Identifying Critical Source Areas for Non-Point Source Pollution in Canadian Conditions. Agriculture 2020, 10, 468. [Google Scholar] [CrossRef]
  21. Hua, L.; Zhai, L.; Liu, J.; Guo, S.; Li, W.; Zhang, F.; Fan, X.; Liu, H. Characteristics of Nitrogen Losses from a Paddy Irrigation-Drainage Unit System. Agric. Ecosyst. Environ. 2019, 285, 106629. [Google Scholar] [CrossRef]
  22. Liu, Y.; Li, J.; Jiao, X.; Li, H.; Hu, T.; Jiang, H.; Mahmoud, A. Effects of Biochar on Water Quality and Rice Productivity under Straw Returning Condition in a Rice-Wheat Rotation Region. Sci. Total Environ. 2021, 819, 152063. [Google Scholar] [CrossRef] [PubMed]
  23. Kroes, J.; van Dam, J.; Supit, I.; de Abelleyra, D.; Veron, S.; de Wit, A.; Boogaard, H.; Angelini, M.; Damiano, F.; Groenendijk, P.; et al. Agrohydrological Analysis of Groundwater Recharge and Land Use Changes in the Pampas of Argentina. Agric. Water Manag. 2019, 213, 843–857. [Google Scholar] [CrossRef]
  24. Devkota, K.P.; Hoogenboom, G.; Boote, K.J.; Singh, U.; Lamers, J.P.A.; Devkota, M.; Vlek, P.L.G. Simulating the Impact of Water Saving Irrigation and Conservation Agriculture Practices for Rice—Wheat Systems in the Irrigated Semi-Arid Drylands of Central Asia. Agric. For. Meteorol. 2015, 214–215, 266–280. [Google Scholar] [CrossRef]
  25. Amarasingha, R.P.R.K.; Suriyagoda, L.D.B.; Marambe, B.; Gaydon, D.S.; Galagedara, L.W.; Punyawardena, R.; Silva, G.L.L.P.; Nidumolu, U.; Howden, M. Simulation of Crop and Water Productivity for Rice (Oryza sativa L.) Using APSIM under Diverse Agro-Climatic Conditions and Water Management Techniques in Sri Lanka. Agric. Water Manag. 2015, 160, 132–143. [Google Scholar] [CrossRef]
  26. Yuan, S.; Peng, S.; Li, T. Evaluation and Application of the ORYZA Rice Model under Different Crop Managements with High-Yielding Rice Cultivars in Central China. Field Crops Res. 2017, 212, 115–125. [Google Scholar] [CrossRef]
  27. Shekhar, S.; Mailapalli, D.R.; Raghuwanshi, N.S. Simulating Nitrogen Transport in Paddy Crop Irrigated with Alternate Wetting and Drying Practice. Paddy Water Environ. 2021, 19, 499–513. [Google Scholar] [CrossRef]
  28. Li, Y.; Šimůnek, J.; Wang, S.; Yuan, J.; Zhang, W. Modeling of Soil Water Regime and Water Balance in a Transplanted Rice Field Experiment with Reduced Irrigation. Water 2017, 9, 248. [Google Scholar] [CrossRef] [Green Version]
  29. Šimůnek, J.; Genuchten, M.T.; Šejna, M. Development and Applications of the HYDRUS and STANMOD Software Packages and Related Codes. Vadose Zone J. 2008, 7, 587–600. [Google Scholar] [CrossRef] [Green Version]
  30. Jung, J.-W.; Yoon, K.-S.; Choi, D.-H.; Lim, S.-S.; Choi, W.-J.; Choi, S.-M.; Lim, B.-J. Water Management Practices and SCS Curve Numbers of Paddy Fields Equipped with Surface Drainage Pipes. Agric. Water Manag. 2012, 110, 78–83. [Google Scholar] [CrossRef]
  31. Howell, T.A. LYSIMETRY. In Encyclopedia of Soils in the Environment; Hillel, D., Ed.; Elsevier: Oxford, UK, 2005; pp. 379–386. ISBN 978-0-12-348530-4. [Google Scholar]
  32. Shao, G.; Deng, S.; Liu, N.; Yu, S.; Cheng, M.; She, D. Effects of Controlled Irrigation and Drainage on Growth, Grain Yield and Water Use in Paddy Rice. Eur. J. Agron. 2014, 53, 1–9. [Google Scholar] [CrossRef]
  33. Tsubo, M.; Fukai, S.; Basnayake, J.; Tuong, T.P.; Bouman, B.; Harnpichitvitaya, D. Estimating Percolation and Lateral Water Flow on Sloping Land in Rainfed Lowland Rice Ecosystem. Plant Prod. Sci. 2005, 8, 354–357. [Google Scholar] [CrossRef]
  34. Tan, X.; Shao, D.; Gu, W.; Liu, H. Field Analysis of Water and Nitrogen Fate in Lowland Paddy Fields under Different Water Managements Using HYDRUS-1D. Agric. Water Manag. 2015, 150, 67–80. [Google Scholar] [CrossRef]
  35. Yoshida, S.; Forno, D.A.; Cock, J.; Gomez, K. Laboratory Manual for Physiological Studies of Rice. In Laboratory Manual for Physiological Studies of Rice, 3rd ed.; International Rice Research Institute: Los Baños, Philippines, 1976. [Google Scholar]
  36. Van Genuchten, M.T. A Closed-form Equation for Predicting the Hydraulic Conductivity of Unsaturated Soils. Soil. Sci. Soc. Am. J. 1980, 44, 892–898. [Google Scholar] [CrossRef] [Green Version]
  37. Allen, R.; Pereira, L.; Raes, D.; Smith, M. Crop Evapotranspiration. Guidelines for Computing Crop Water Requirements. In FAO Irrigation and Drainage Paper; FAO: Rome, Italy, 1998; Volume 56. [Google Scholar]
  38. Belmans, C.; Wesseling, J.G.; Feddes, R.A. Simulation Model of the Water Balance of a Cropped Soil: SWATRE. J. Hydrol. 1983, 63, 271–286. [Google Scholar] [CrossRef]
  39. Phogat, V.; Yadav, A.K.; Malik, R.S.; Kumar, S.; Cox, J. Simulation of Salt and Water Movement and Estimation of Water Productivity of Rice Crop Irrigated with Saline Water. Paddy Water Environ. 2010, 8, 333–346. [Google Scholar] [CrossRef]
  40. Feddes, R.A.; Kowalik, P.J.; Zaradny, H. Simulation of Field Water Use and Crop Yield. In Simulation of Plant Growth and Crop Production; Pudoc: Wageningen, The Netherlands, 1978. [Google Scholar]
  41. Singh, R.; van Dam, J.C.; Feddes, R.A. Water Productivity Analysis of Irrigated Crops in Sirsa District, India. Agric. Water Manag. 2006, 82, 253–278. [Google Scholar] [CrossRef]
  42. Phogat, V.; Skewes, M.A.; Cox, J.W.; Alam, J.; Grigson, G.; Šimůnek, J. Evaluation of Water Movement and Nitrate Dynamics in a Lysimeter Planted with an Orange Tree. Agric. Water Manag. 2013, 127, 74–84. [Google Scholar] [CrossRef] [Green Version]
  43. Duan, Y.-H.; Yin, X.-M.; Zhang, Y.-L.; Shen, Q.-R. Mechanisms of Enhanced Rice Growth and Nitrogen Uptake by Nitrate. Pedosphere 2007, 17, 697–705. [Google Scholar] [CrossRef]
  44. Hanson, B.R.; Šimůnek, J.; Hopmans, J.W. Evaluation of Urea–Ammonium–Nitrate Fertigation with Drip Irrigation Using Numerical Modeling. Agric. Water Manag. 2006, 86, 102–113. [Google Scholar] [CrossRef]
  45. Mo’allim, A.A.; Kamal, M.R.; Muhammed, H.H.; Mohd Soom, M.A.; Mohamed Zawawi, M.A.B.; Wayayok, A.; Che Man, H.B. Assessment of Nutrient Leaching in Flooded Paddy Rice Field Experiment Using Hydrus-1D. Water 2018, 10, 785. [Google Scholar] [CrossRef] [Green Version]
  46. Yang, R.; Tong, J.; Hu, B.X.; Li, J.; Wei, W. Simulating Water and Nitrogen Loss from an Irrigated Paddy Field under Continuously Flooded Condition with Hydrus-1D Model. Environ. Sci. Pollut. Res. 2017, 24, 15089–15106. [Google Scholar] [CrossRef]
  47. Li, Y.; Šimůnek, J.; Zhang, Z.; Jing, L.; Ni, L. Evaluation of Nitrogen Balance in a Direct-Seeded-Rice Field Experiment Using Hydrus-1D. Agric. Water Manag. 2015, 148, 213–222. [Google Scholar] [CrossRef] [Green Version]
  48. Jyotiprava Dash, C.; Sarangi, A.; Singh, D.K.; Singh, A.K.; Adhikary, P.P. Prediction of Root Zone Water and Nitrogen Balance in an Irrigated Rice Field Using a Simulation Model. Paddy Water Environ. 2015, 13, 281–290. [Google Scholar] [CrossRef]
  49. Chowdary, V.M.; Rao, N.H.; Sarma, P.B.S. A Coupled Soil Water and Nitrogen Balance Model for Flooded Rice Fields in India. Agric. Ecosyst. Environ. 2004, 103, 425–441. [Google Scholar] [CrossRef]
  50. Akay, O.; Fox, G.A.; Šimůnek, J. Numerical Simulation of Flow Dynamics during Macropore–Subsurface Drain Interactions Using HYDRUS. Vadose Zone J. 2008, 7, 909–918. [Google Scholar] [CrossRef]
  51. Wang, Y.; Zhang, B.; Lin, L.; Zepp, H. Agroforestry System Reduces Subsurface Lateral Flow and Nitrate Loss in Jiangxi Province, China. Agric. Ecosyst. Environ. 2011, 140, 441–453. [Google Scholar] [CrossRef]
  52. Meng, Y.; Yu, S.; Yu, Y.; Jiang, L. Flooding Depth and Duration Concomitantly Influence the Growth Traits and Yield of Rice. Irrig. Drain. 2022, 71, 94–107. [Google Scholar] [CrossRef]
  53. Li, Y.; Šimůnek, J.; Jing, L.; Zhang, Z.; Ni, L. Evaluation of Water Movement and Water Losses in a Direct-Seeded-Rice Field Experiment Using Hydrus-1D. Agric. Water Manag. 2014, 142, 38–46. [Google Scholar] [CrossRef] [Green Version]
  54. Sodano, M.; Said-Pullicino, D.; Fiori, A.F.; Catoni, M.; Martin, M.; Celi, L. Sorption of Paddy Soil-Derived Dissolved Organic Matter on Hydrous Iron Oxide–Vermiculite Mineral Phases. Geoderma 2016, 261, 169–177. [Google Scholar] [CrossRef]
  55. Chen, Y.; Li, S.; Zhang, Y.; Li, T.; Ge, H.; Xia, S.; Gu, J.; Zhang, H.; Lü, B.; Wu, X.; et al. Rice Root Morphological and Physiological Traits Interaction with Rhizosphere Soil and Its Effect on Methane Emissions in Paddy Fields. Soil Biol. Biochem. 2019, 129, 191–200. [Google Scholar] [CrossRef]
  56. Wang, C.; Sun, H.; Zhang, J.; Zhang, X.; Lu, L.; Shi, L.; Zhou, S. Effects of Different Fertilization Methods on Ammonia Volatilization from Rice Paddies. J. Clean. Prod. 2021, 295, 126299. [Google Scholar] [CrossRef]
  57. Zhang, G.; Wang, D.; Yu, Y. Investigation into the Effects of Straw Retention and Nitrogen Reduction on CH4 and N2O Emissions from Paddy Fields in the Lower Yangtze River Region, China. Sustainability 2020, 12, 1683. [Google Scholar] [CrossRef] [Green Version]
  58. Kim, G.W.; Kim, P.J.; Khan, M.I.; Lee, S.-J. Effect of Rice Planting on Nitrous Oxide (N2O) Emission under Different Levels of Nitrogen Fertilization. Agronomy 2021, 11, 217. [Google Scholar] [CrossRef]
  59. Tan, X.; Shao, D.; Gu, W. Effects of Temperature and Soil Moisture on Gross Nitrification and Denitrification Rates of a Chinese Lowland Paddy Field Soil. Paddy Water Environ. 2018, 16, 687–698. [Google Scholar] [CrossRef]
  60. Chen, S.-K.; Liu, C.W. Analysis of Water Movement in Paddy Rice Fields (I) Experimental Studies. J. Hydrol. 2002, 260, 206–215. [Google Scholar] [CrossRef]
  61. Zhao, X.; Zhou, Y.; Min, J.; Wang, S.; Shi, W.; Xing, G. Nitrogen Runoff Dominates Water Nitrogen Pollution from Rice-Wheat Rotation in the Taihu Lake Region of China. Agric. Ecosyst. Environ. 2012, 156, 1–11. [Google Scholar] [CrossRef]
  62. Surendran, U.; Raja, P.; Jayakumar, M.; Subramoniam, S.R. Use of Efficient Water Saving Techniques for Production of Rice in India under Climate Change Scenario: A Critical Review. J. Clean. Prod. 2021, 309, 127272. [Google Scholar] [CrossRef]
Figure 1. The N first-order chain reaction process of the HYDRUS-1D model and water flow boundary conditions for the lysimeter experiment.
Agriculture 12 00924 g001
Figure 2. Comparison of simulated and observed values of NH4+-N (a) and NO3-N (b) concentrations at 0, 20, 40, and 60 cm soil depth during the 2020 (calibration) and 2021 (validation) rice-growing seasons.
Agriculture 12 00924 g002
Figure 3. The dynamics of precipitation, irrigation, surface runoff, and ponded water depth during the 2020 (a) and 2021 (b) rice-growing seasons.
Agriculture 12 00924 g003
Figure 4. Water and N balance in paddy fields of the 2020 and 2021 seasons. The δ denotes the total water or N balance error between mass input and output of the soil column calculated by the HYDRUS-1D model.
Agriculture 12 00924 g004
Figure 5. Comparison of measured and simulated surface N concentration in 2020 and 2021.
Agriculture 12 00924 g005
Figure 6. Distribution of simulated NH4+-N (a,c) and NO3-N (b,d) concentrations in 0–100 cm soil depth during the 2020 and 2021 seasons. DAT represents the days after transplanting.
Agriculture 12 00924 g006
Figure 7. Surface water runoff and percolation from the root zone at a depth of 60 cm under different controlled drainage scenarios in the 2020 (a) and 2021 (b) seasons.
Agriculture 12 00924 g007
Figure 8. N losses via surface runoff and leaching from root zone under different controlled drainage and N fertilizer application scenarios in 2020 (a,c) and 2021 (b,d) seasons.
Agriculture 12 00924 g008
Table 1. Basic soil properties of different layers.
Soil Layer (cm)Soil Particle Fraction (%)Bulk Density (g cm−3)Organic Matter (%) pH (H2O)
SandSiltClay
0–20 40.21 (9.06)38.22 (6.43)21.57 (3.26)1.36 (0.23)1.24 (0.06)6.94 (0.06)
20–40 39.12 (6.31)39.16 (4.71)21.72 (2.63)1.40 (0.19)1.35 (0.06)6.97 (0.05)
40–60 38.87 (5.46)39.86 (4.06)21.27 (2.83)1.43 (0.20)1.20 (0.08)6.85 (0.07)
60–160 40.25 (5.02)38.12 (3.72)21.63 (2.41)1.48 (0.21)-6.80 (0.04)
Note: The standard deviations calculated from six soil samples are given in parentheses.
Table 2. Control thresholds of field water levels during the rice-growing season.
Irrigation Criteria (cm)Returning GreenTilleringJointing-BootingHeading-FloweringMilky RipeningYellow Ripening
Lower threshold1.0−20.0−30.0−20.0−30.0Naturally drying
Upper threshold3.03.03.03.03.0
Table 3. The calibrated soil hydraulic parameters for different soil layers.
Depth (cm)θr (cm3 cm3)θs (cm3 cm−3)α (cm−1)nKs (cm day−1)
0–200.0660.4180.00951.52615.19
20–400.0650.4080.00951.5217.48
40–600.0630.3990.00961.51211.27
60–1600.0620.3910.01081.4849.08
Note: θr is the residual water content; θs is the saturated water content; α and n are the van Genuchten shape parameters; and Ks is the saturated hydraulic conductivity.
Table 4. The calibrated parameters of N first-order chain reaction for different soil layers.
Depth (cm)DL (cm)Kd (cm3 g−1)Kv (day−1)Kn (day−1)Kdn (day−1)Km (day−1)Kh (day−1)
0–207.53.50.030.080.250.00450.74
20–405.53.50.030.020.050.00450.74
40–606.23.50.010.030.0100
60–160163.50.010.020.0100
Note: DL is the longitudinal dispersivity; Kd is the distribution coefficient for ammonia N; Kv is the ammonia volatilization coefficient; Kn is the nitrification rate; Kdn is the denitrification rate; Km is the comprehensive production rate of NH4+-N representing mineralization/immobilization; and Kh is the hydrolysis rate.
Table 5. Model calibration and validation results of hp and NH4+-N and NO3-N concentrations in different soil depths. hp denotes ponding water depth of paddy field.
PeriodType (Units for RMSE)Depth (cm)RMSENSER2
Calibration
2020
hp (cm)00.3820.9800.981
NH4+-N concentration
(mg L−1)
04.6080.4510.669
200.7290.6090.712
400.3990.7290.845
600.0020.6050.608
NO3-N concentration
(mg L−1)
02.3100.7560.895
201.1390.9110.921
400.4610.8800.881
600.2300.9470.947
Validation
2021
hp (cm)00.3730.9810.983
NH4+-N concentration
(mg L−1)
05.5700.3930.537
200.4530.5760.704
400.4360.7730.777
600.0110.4400.517
NO3-N concentration
(mg L−1)
02.5680.7670.881
201.4070.8920.893
400.1900.9600.962
600.1160.9520.957
Publisher’s Note: MDPI stays neutral with regard to jurisdictional claims in published maps and institutional affiliations.

