Article

Space Comparison of Agricultural Green Growth in Agricultural Modernization: Scale and Quality

1
School of Public Policy and Management, Guangxi University, Nanning 530004, China
2
School of Economics and Management, Tongren University, Tongren 554300, China
*
Author to whom correspondence should be addressed.
Agriculture 2022, 12(7), 1067; https://doi.org/10.3390/agriculture12071067
Submission received: 15 June 2022 / Revised: 19 July 2022 / Accepted: 19 July 2022 / Published: 21 July 2022
(This article belongs to the Special Issue Ecological Restoration and Rural Economic Development)

Abstract

:
Promoting agricultural green growth has become an indispensable key content to speed up the process of agricultural modernization, has become a necessary prerequisite to achieve common prosperity of the rural people, and has become the basic practice of implementing people-centered development thought in the stage of high-quality development. Many researchers have studied the problems, level measurement and route choice of the growth of agriculture. However, there have been few studies on how to promote the agricultural green growth from the perspective of agricultural modernization, and how to combine the green agricultural GDP with the agricultural green total factor productivity (GTFP). To address this research inadequacy, in this paper, we focus on the time and space comparison of green agricultural GDP, agricultural GTFP, and their source decomposition, and summarize and discuss the key factors affecting agricultural GTFP. The results show that the share of output value of green agriculture in Tongren City is relatively high within the region of the province, and there is a large temporal and spatial difference between the change of agricultural GTFP and agricultural technology utilization efficiency and agricultural technology progress. At the same time, the improvement of economic development level can significantly promote the rise of agricultural GTFP, agricultural technology utilization efficiency, and agricultural technology progress. On balance, our results compare green agricultural GDP, agricultural GTFP, and their source decomposition in time and space, and reveals their evolution law and development trend from the perspective of high-quality development of agricultural modernization. In this way, we can provide an empirical basis and decision-making reference for accelerating the high-quality development of agricultural modernization.

1. Introduction

The green development of agriculture is an important guarantee for the sustainability of agricultural development and the necessary path for the ”Carbon Peaking and Carbon Neutrality” targets [1,2]. Promoting agricultural green growth and accelerating agricultural modernization have become necessary prerequisites to realize the common prosperity of rural farmers, and a grassroots practice in implementing people-centered development thought [2,3,4,5]. The idea of agricultural green development has been advocated in China from ancient times [6]. Since the reform and opening up, the Communist Party of China (CPC) and the State have always insisted on solving the problems of agriculture, rural areas and farmers as the top priority of all development work, and regard promoting agricultural green growth and accelerating agricultural modernization as the core issue of doing well in the work of agriculture, rural areas, and farmers [5,7,8]. At the national level, agricultural green development and agricultural modernization are profoundly expounded, the task requirements are clarified, and the fundamental compliance is empowered. The 19th National Congress of the Communist Party of China and the spirit of the Fifth and Sixth Plenary Sessions of the 19th Central Committee of the Communist Party of China successively emphasized “promoting green development” and “accelerating agricultural modernization”. According to the No. 1 document issued by the Central Committee of the CPC and the State Council over the years [9,10,11,12,13,14,15,16,17], there were a total of 24 central No. 1 documents from 1982 to 1986 and 2004 to 2022, which emphasized the theme of “green”, “agricultural modernization”, and highly related documents, reaching 62 and 87 times, respectively. The above top-level design, institutional arrangements, and policy measures provide forward-looking thinking, overall planning, and strategic layout at grassroots to promote green agricultural development and boost agricultural modernization.
China has entered the stage of high-quality development, but the level of agricultural green growth and the process of agricultural modernization still face many contradictions and challenges, such as the expansion and application of agricultural green technology, agricultural product trade, impacts on food security and rural public services, unbalanced development of new agricultural business entities, etc. [4,5,8]. Especially in mountainous areas, the comprehensive efficiency, effectiveness, effect, and efficacy of agricultural green growth are still not strong, and the tasks and missions of agricultural modernization are still heavy. This will directly affect and determine the shortcomings and weaknesses of high-quality development. Therefore, the pushing forward of agricultural green growth and acceleration of agricultural modernization are entrusted with the mission of the historical era, which has become an urgent need for the times of progress, national prosperity, regional development, and people enjoying prosperity. Tongren, which belongs to the hinterland of the Wuling Mountains area in China, is a key support area for the overall national modernization. It is a national green agriculture demonstration area and agricultural standardization demonstration area, a provincial green development pilot demonstration area and a modern high-efficiency agricultural demonstration park. This paper selects Tongren, a prefecture city with mountainous geographic characteristics and green ecological advantages, as the main research area, which has special value and representational significance. Based on the perspective of agricultural modernization research, this paper focuses on the spatiotemporal comparison of traditional agricultural GDP and green agricultural GDP, the spatiotemporal comparison of agricultural traditional total factor productivity (TFP) and agricultural green total factor productivity (GTFP), and the spatiotemporal comparison of agricultural GTFP and its source decomposition. It depicts and reveals the spatiotemporal difference and evolution law of agricultural green growth in Tongren City, and empirically analyzes the influencing factors of agricultural GTFP and its source decomposition in prefecture-level cities in Guizhou Province at the provincial level. This paper summarizes and discusses the key influencing factors of provincial agricultural GTFP, and lays the logical origin and empirical foundation for the next step to put forward policy suggestions suitable for promoting agricultural green growth in mountainous areas. It has important and long-term significance and practical value for promoting the process of agricultural modernization, realizing the common prosperity of rural people, practicing the people-centered development thought, giving full play to the role of complementing shortcomings, strengthening weaknesses, and accelerating progress.
The rest of the paper is structured as follows. Section 2 provides a literature review. Section 3 proposes the research design. Section 4 describes the spatiotemporal evolution and comparison. Section 5 details the empirical results and analysis. Finally, Section 6 summarizes the research conclusions and policy enlightenment of this paper.

2. Literature Review

Combining the research purpose and research content of this paper, throughout all of the existing theories and practices, there is growing literature on agricultural growth in agricultural modernization at home and abroad, which is mainly focused on the problems of agricultural growth in agricultural modernization, the measures of agricultural growth in agricultural modernization, and the agricultural growth path in agricultural modernization. It is gratifying to note that these existing research results provide theoretical guidance and experience reference for this paper.
In literature, there are numerous studies on the problems of agricultural growth in agricultural modernization. How to realize the agricultural green growth and promote agricultural modernization has always been confronted with historic and realistic problems, which have attracted much attention and discussion from academic circles. At a very early time, some scholars proposed that the core problem to promote the transformation from traditional agriculture to modern agriculture is to continuously introduce new modern production elements, the essence of which is to promote the progress of agricultural technology [18]. As we all know, agricultural production has obvious regional characteristics [19], and there are gaps between input of agricultural elements, R&D of science and technology, production mode, and requirements of agricultural green development [20] in different regions. In this way, the change of agricultural green total factor productivity based on homogeneity and heterogeneity of technology has time, space and regional differences [3]. Likewise, China has been confronted with many imbalanced and insufficient development problems in the process of promoting agricultural green growth and promoting agricultural modernization. The development of basic public services and social undertakings in rural areas is not sufficient [4]. There is a large gap in the level of human capital compared with developed countries [21]. The degree of agricultural mechanization affects the development of agricultural transformation, the scale operation of peasant households, the flow of rural labor force, and the rural ecological environment [22,23,24,25]. In particular, due to the topographic conditions, agricultural mechanization in mountainous areas directly hinders the agricultural green growth and leads to a serious lag in the process of agricultural modernization [26]. Overall, the above literature highlights the weaknesses and lagging process of agricultural green growth in agricultural modernization. However, at present, there is little research literature focusing on the promotion of agricultural green growth in mountainous areas from the perspective of agricultural modernization.
There have been many studies on the measurement of agricultural growth in agricultural modernization. For example, some scholars put forward the construction of evaluation indexes for measuring agricultural growth in agricultural modernization, and selected the measure indicators such as agricultural input, agricultural increase, total agricultural carbon emissions [3,27], agricultural green production level, natural environment foundation, resource and environmental quality [28], agricultural policy, economic development level, scientific and technological innovation ability, infrastructure investment, and labor quality [29]. In addition, other scholars investigated and quantified the input–output ratio of agriculture from the core indicators such as agricultural mechanization, agricultural science and technology, agricultural specialization, high-standard farmland proportion, comprehensive grain-production capacity, comprehensive utilization rate of livestock and poultry manure, processing value of agricultural products, output value of animal husbandry, soil and water conservation, cultivated land protection, energy consumption, quality of workers, quality of life of farmers [7,30,31], and so on. From another point of view, from the perspective of research-method selection of agricultural growth measurement in agricultural modernization, most of the literature focuses on the measurement methods such as evaluation method of agricultural monitoring, entropy method, technique for order preference by similarity to an ideal solution, analytic hierarchy process, regression analysis method, dynamic panel threshold model, super efficiency data envelopment analysis model, comprehensive index measurement model [3,19,31,32,33,34], etc. It can be summarized that this literature fully indicates that an integrated evaluation system for agricultural green growth should be constructed around the following dimensions: agricultural green input level, agricultural green production level, agricultural green industry level, and agricultural green operation level. However, the inclusion of this key core indicator of agricultural GTFP to illustrate the research literature on advancing agricultural green growth and accelerating agricultural modernization is currently scarce.
Much research has been focused on agricultural growth paths in agricultural modernization. Many scholars have reached relatively consistent conclusions that pay attention to the harmonious coexistence between human and nature, pursue the sustainability of development [6], regard agricultural green development as a systematic project and an arduous task [2], design reasonable environmental policies and improve green technology innovation subsidies [27], and build a policy system and market environment to support the development of green finance [35]. As far as China is concerned, it is essential to hold on to actual conditions and agriculture conditions in China, and to take the progress of mechanical technology and biochemical technology as an important engine and inexhaustible drive force for agricultural green growth, and to adopt the categorical strategy path that is staged, regional, industrial, and main-body-oriented, so as to take the road of socialist agricultural modernization with Chinese characteristics [36,37]. In consideration to local conditions, a new type of rural operation organization, which is the “Consortium” that is “Driven by Leading Enterprises of agricultural Industrialization + linkaging by Professional Cooperatives of farmers + promoting by Family Farms + participating by specialized Households” [38] was innovated and perfected. It provides the “agriculture, rural areas and farmers” services of specialization, differentiation, diversity, generalization, equalization, quality, digitization, information technology, intelligence, and socialization. Taken together, this literature provides theoretical and empirical references on the choice of agricultural growth and development path at the macro level. However, the national agriculture situation and differences in resource endowment in different countries and regions determine the uniqueness and differentiation of the agricultural green-growth path, and the exploration of the focused mountain area for advancing agricultural green growth to accelerate the agricultural modernization path is urgently accelerated and optimized.
In summary, the existing literature has carried out extensive research on the issues of agricultural growth in agricultural modernization, measurement of agricultural growth in agricultural modernization, and the path of agricultural growth in agricultural modernization, and has formed abundant research results, which provide a solid theoretical reference and practical reference for this research. Towards the stage of high-quality development, at the important historical stage of the intersection of the intersection of “Two Centenary Goals”, the handover of “Two Five Years”, and the interweaving of “Two General Situations”, and under the realistic challenge of the imbalance and insufficiency of agricultural green growth, research paying attention to agricultural green growth from the perspective of agricultural modernization urgently needs to be developed in depth, and the agricultural GTFP fully takes into account the protection of the ecological environment; this is precisely the direction of promoting green agricultural growth and accelerating agricultural modernization. In view of this, this paper studies agricultural green growth from the perspective of agricultural modernization; focuses on the temporal and spatial comparison of green agricultural GDP, agricultural GTFP, and their source decomposition; and makes an empirical analysis on its influencing factors, which is a supplement and improvement to the previous research on agricultural modernization.

3. Research Design

The connotation and epitaxy of agricultural green growth are more abundant in the context of agricultural modernization. Based on this, the impact factors of green agricultural GDP, agricultural GTFP and their source decomposition, and agricultural GTFP and their source decomposition will be focused, and the research design will be conducted by combining the availability, quantifiability, and sustainability of data.

3.1. Selection of Research Methods

3.1.1. Accounting Method of Green Agricultural GDP

Green agricultural GDP is a method of measuring agricultural output value that pays more attention to environmental protection and sustainable development. It is based on traditional agricultural GDP to deduct the environmental resources loss cost and the ecological environment loss cost. Therefore, the formula of green agricultural GDP accounting is as follows:
AGGDP i , t = i = 1 n AGDP i , t i = 1 n ERLC i , t i = 1 n EELC i , t
In Equation (1), AGGDP i , t stands for the green agricultural GDP, AGDP i , t is the traditional agricultural GDP, ERLC i , t is the environmental resources loss cost, EELC i , t is the ecological environment loss cost, n represents quantity, the subscript i indicates the sample region, and the subscript t indicates the time. In combination with the fact that the sample and variable set are studied in this paper, the formula of Equation (1) is further converted as follows:
AGGDP i , t = i = 1 n AGDP i , t i = 1 n TRLC i , t
AGGDP i , t = i = 1 n AGDP i , t i = 1 n SLC i , t i = 1 n TNEL i , t i = 1 n TPEL i , t i = 1 n CODEL i , t
where TRLC i , t is the total resource loss cost, SLC i , t represents the soil loss cost, TNEL i , t indicates the environmental loss of total nitrogen, TPEL i , t indicates the environmental loss of total phosphorus, and CODEL i , t represents the COD environmental loss.

3.1.2. Measurement Method of Agricultural GTFP

In this paper, we referred to some scholars, such as Jiangfeng Hu [39,40], Qinghua Huang [27], and Yanling Chen [41] for the comprehensive construction of agricultural GTFP calculation as follows:
AGTFP t t + 1 = 1 2 S a t I t , E t , U t ; G S a t I t + 1 , E t + 1 , U t + 1 ; G + S a t + 1 I t , E t , U t ; G S a t + 1 I t + 1 , E t + 1 , U t + 1 ; G
Among them, I indicates input, E is expected output, U is unexpected output, G is the direction vector that anticipated output and nonanticipated output increase or decrease according to the same proportion under the given input, S a is the directional distance function, and t is the period. In this way, when the AGTFP was greater than 0, it meant the rise and progress of the agricultural GTFP; when it was less than 0, it reflected the decline and concession of the agricultural GTFP.

3.1.3. Source Decomposition of Agricultural GTFP

Combined with Formula (4), agricultural GTFP can be further decomposed into agricultural technology utilization efficiency (EFFCH) and agricultural technology progress rate (TECH) [27]; that is, the decomposition formula as follows:
AGTFP t t + 1 = EFFCH t t + 1 + TECH t t + 1
EFFCH t t + 1 = S a t I t , E t , U t ; G S a t + 1 I t + 1 , E t + 1 , U t + 1 ; G
TECH t t + 1 = 1 2 S a t + 1 I t , E t , U t ; G S a t I t , E t , U t ; G + S a t + 1 I t + 1 , E t + 1 , U t + 1 ; G S a t + 1 I t , E t , U t ; G
The above formula shows that when EFFCH is greater than 0, it reflects the improvement of agricultural technology utilization efficiency. When EFFCH is less than 0, it reflects the reduced agricultural technology utilization efficiency. At the same time, when TECH is greater than 0, it reveals the agricultural technology progress. When TECH is less than 0, it reveals a retreat in agricultural technology.

3.2. Description of Variable Setting

The indicators of agricultural inputs and agricultural outputs and their contents need to be clarified before measuring agricultural GTFP. This paper refers to the research of Qinghua Huang [27] and Yanling Chen [41], and considers the representativeness, availability, and authority of the statistics, and follows the principles of consistency, integrity, and scientificity of variables [30], which selects the following variables closely related to the green development of agriculture, including the expected output (E), unintended output (U), and input (input) variables of agriculture. In the meantime, empirical variables include urbanization rate of population (RUP), level of economic development (PGDP), population density (DP), environmental regulation (ER), level of technological innovation (patent), and foreign direct investment (FDI).

3.2.1. Agricultural Green Total Factor Productivity

(1) Input of agricultural (INPUT). The following indicators are mainly selected: ① Labor input (N)—measured by the number of agricultural employees; ② land input (L)—measured by the total planting area of crops; ③ machinery input (M)—measured by total power of agricultural machinery; ④ fertilizer input (F)—measured by the purity measurement of the amount of chemical fertilizer actually applied to agricultural production every year.
(2) Output of agriculture (OUTPUT). Taking into account expected output (E) and unintended output (U), specifically as follows: ① Expected output (E)—gross output value for agriculture (Y) is measured; ② unintended output (U)—reflected by indicators such as total phosphorus (TP), total nitrogen (TN), and chemical oxygen demand (COD).

3.2.2. Urbanization Rate of Population

As rural people were constantly transferred to the cities and towns, on the one hand, the transfer of rural people would ease the tense relationship between the people and the land in the countryside, which was conducive to the increase in the agriculture TFP. On the other hand, the urban construction would affect the decrease in the cultivated land of rural people, and then restrict the improvement of the comprehensive production ability of food. If a large number of chemicals were used, it would increase the pollution of the rural area. Based on this, this article used the ratio of the non-farm population to the total population as the index of urbanization rate (RUP).

3.2.3. Per Capita Gross Domestic Product

Generally speaking, a higher level of economic development would be conducive to obtaining richer industrial factors and more advanced industrial technology. In this way, the industrial environment of the industrial factors would be improved and the comprehensive production ability of the agriculture would be improved [40]. Therefore, in this paper, the ratio of GDP per capita to total population of prefecture-level cities is used to represent the level of economic development (PGDP) index.

3.2.4. Population Density

In reality, the excessive population in the city would bring a large number of unemployed people and floating people at the same time, which would lead to a shortage of public resources, resulting in a series of social problems such as excessive consumption of resources, traffic congestion, the use of farmland, and a shortage of water supply, which would bring many chain effects on the ecological environment. Based on this, this paper expressed the population density (DP) index with the number of people per square kilometer.

3.2.5. Environmental Regulation

Objectively, the intensity of the implementation of environmental rules would bring two-sided effects. On one side, the intensity of the environmental rules would squeeze into the normal investment environment, which would be disadvantageous to the promotion of the industrial competition of a country. For another, the intensity of the environmental regulation would stimulate innovations in technology, which would further promote the improvement of the GTFP [42]. Therefore, this paper used the total number of organizations at the end of the year to express the index of the environmental regulation (ER).

3.2.6. Level of Technological Innovation

It is generally believed that technological innovation is a key variable to solve the contradiction between economic development and environmental pollution [27], and has a positive impact on GTFP. Therefore, in this paper, the number of domestic patent applications accepted (pieces) is used to represent the technical innovation (patent) index.

3.2.7. Foreign Direct Investment

FDI has a two-way impact on the green development of developing countries. The first tendency is that FDI might bring the host country some problems and pressures such as waste of resources and pollution. The second tendency might be the opposite; that is, FDI is very likely to promote the growth of the GTFP, in the host country through spillover effects of technology and relatively strict standards of environment protection. Based on this, this paper represents a foreign direct investment (FDI) indicator in terms of foreign direct investment amount (USD 10,000).
Taking the above analyses together, the urbanization rate of population, economic development level, population density, environmental regulation, technological innovation level, and foreign direct investment have different degrees of impacts on the agricultural green total factor productivity, based on which the following research hypotheses are proposed in this paper.
Hypothesis 1.
The effect of urbanization rate of population (RUP) on agricultural green total factor productivity is uncertain, and the effect may be positive or negative;
Hypothesis 2.
The level of economic development (PGDP) has a positive effect on agricultural green total factor productivity;
Hypothesis 3.
The effect of population density (DP) on agricultural green total factor productivity is negative;
Hypothesis 4.
The impacts of environmental regulation (ER) on agricultural green total factor productivity are uncertain, and the impacts may be positive or negative;
Hypothesis 5.
The level of technological innovation (patent) has a positive effect on agricultural green total factor productivity;
Hypothesis 6.
The effect of foreign direct investment (FDI) on agricultural green total factor productivity may be bidirectional, and its effect may be positive or negative.

3.3. Introduction to Data Sources

The relevant data in this paper are mainly from “CHINA STATISTICAL YEARBOOK”, “CHINA RURAL STATISTICAL YEARBOOK”, “CHINA CITY STATISTICAL YEARBOOK”, “CHINA STATISTICAL YEARBOOK (TOWNSHIP)” and locality statistical yearbooks (Query URL: https://www.cnki.net/, accessed on 21 December 2021). The empirical data used are mainly from the panel data of eight prefecture-level cities and provincial panel data in Guizhou Province from 1996 to 2017 (Bijie was not included for data reasons), so as to facilitate the analysis of temporal and spatial evolution and horizontal comparison. Because some of the prefecture-level city data have missing problems, to ensure the consistency and coherence of the data, this paper adopts the following methods for alignment: first, the data at the county level are added up to the city level; second, linear fitting, moving average method, and equality of means were used; third, the data at the province level are decomposed to the prefecture level and city level based on the ratio of the prefecture level and city level to the province level; fourth, samples that still had missing values were removed.

4. Spatiotemporal Evolution and Comparison

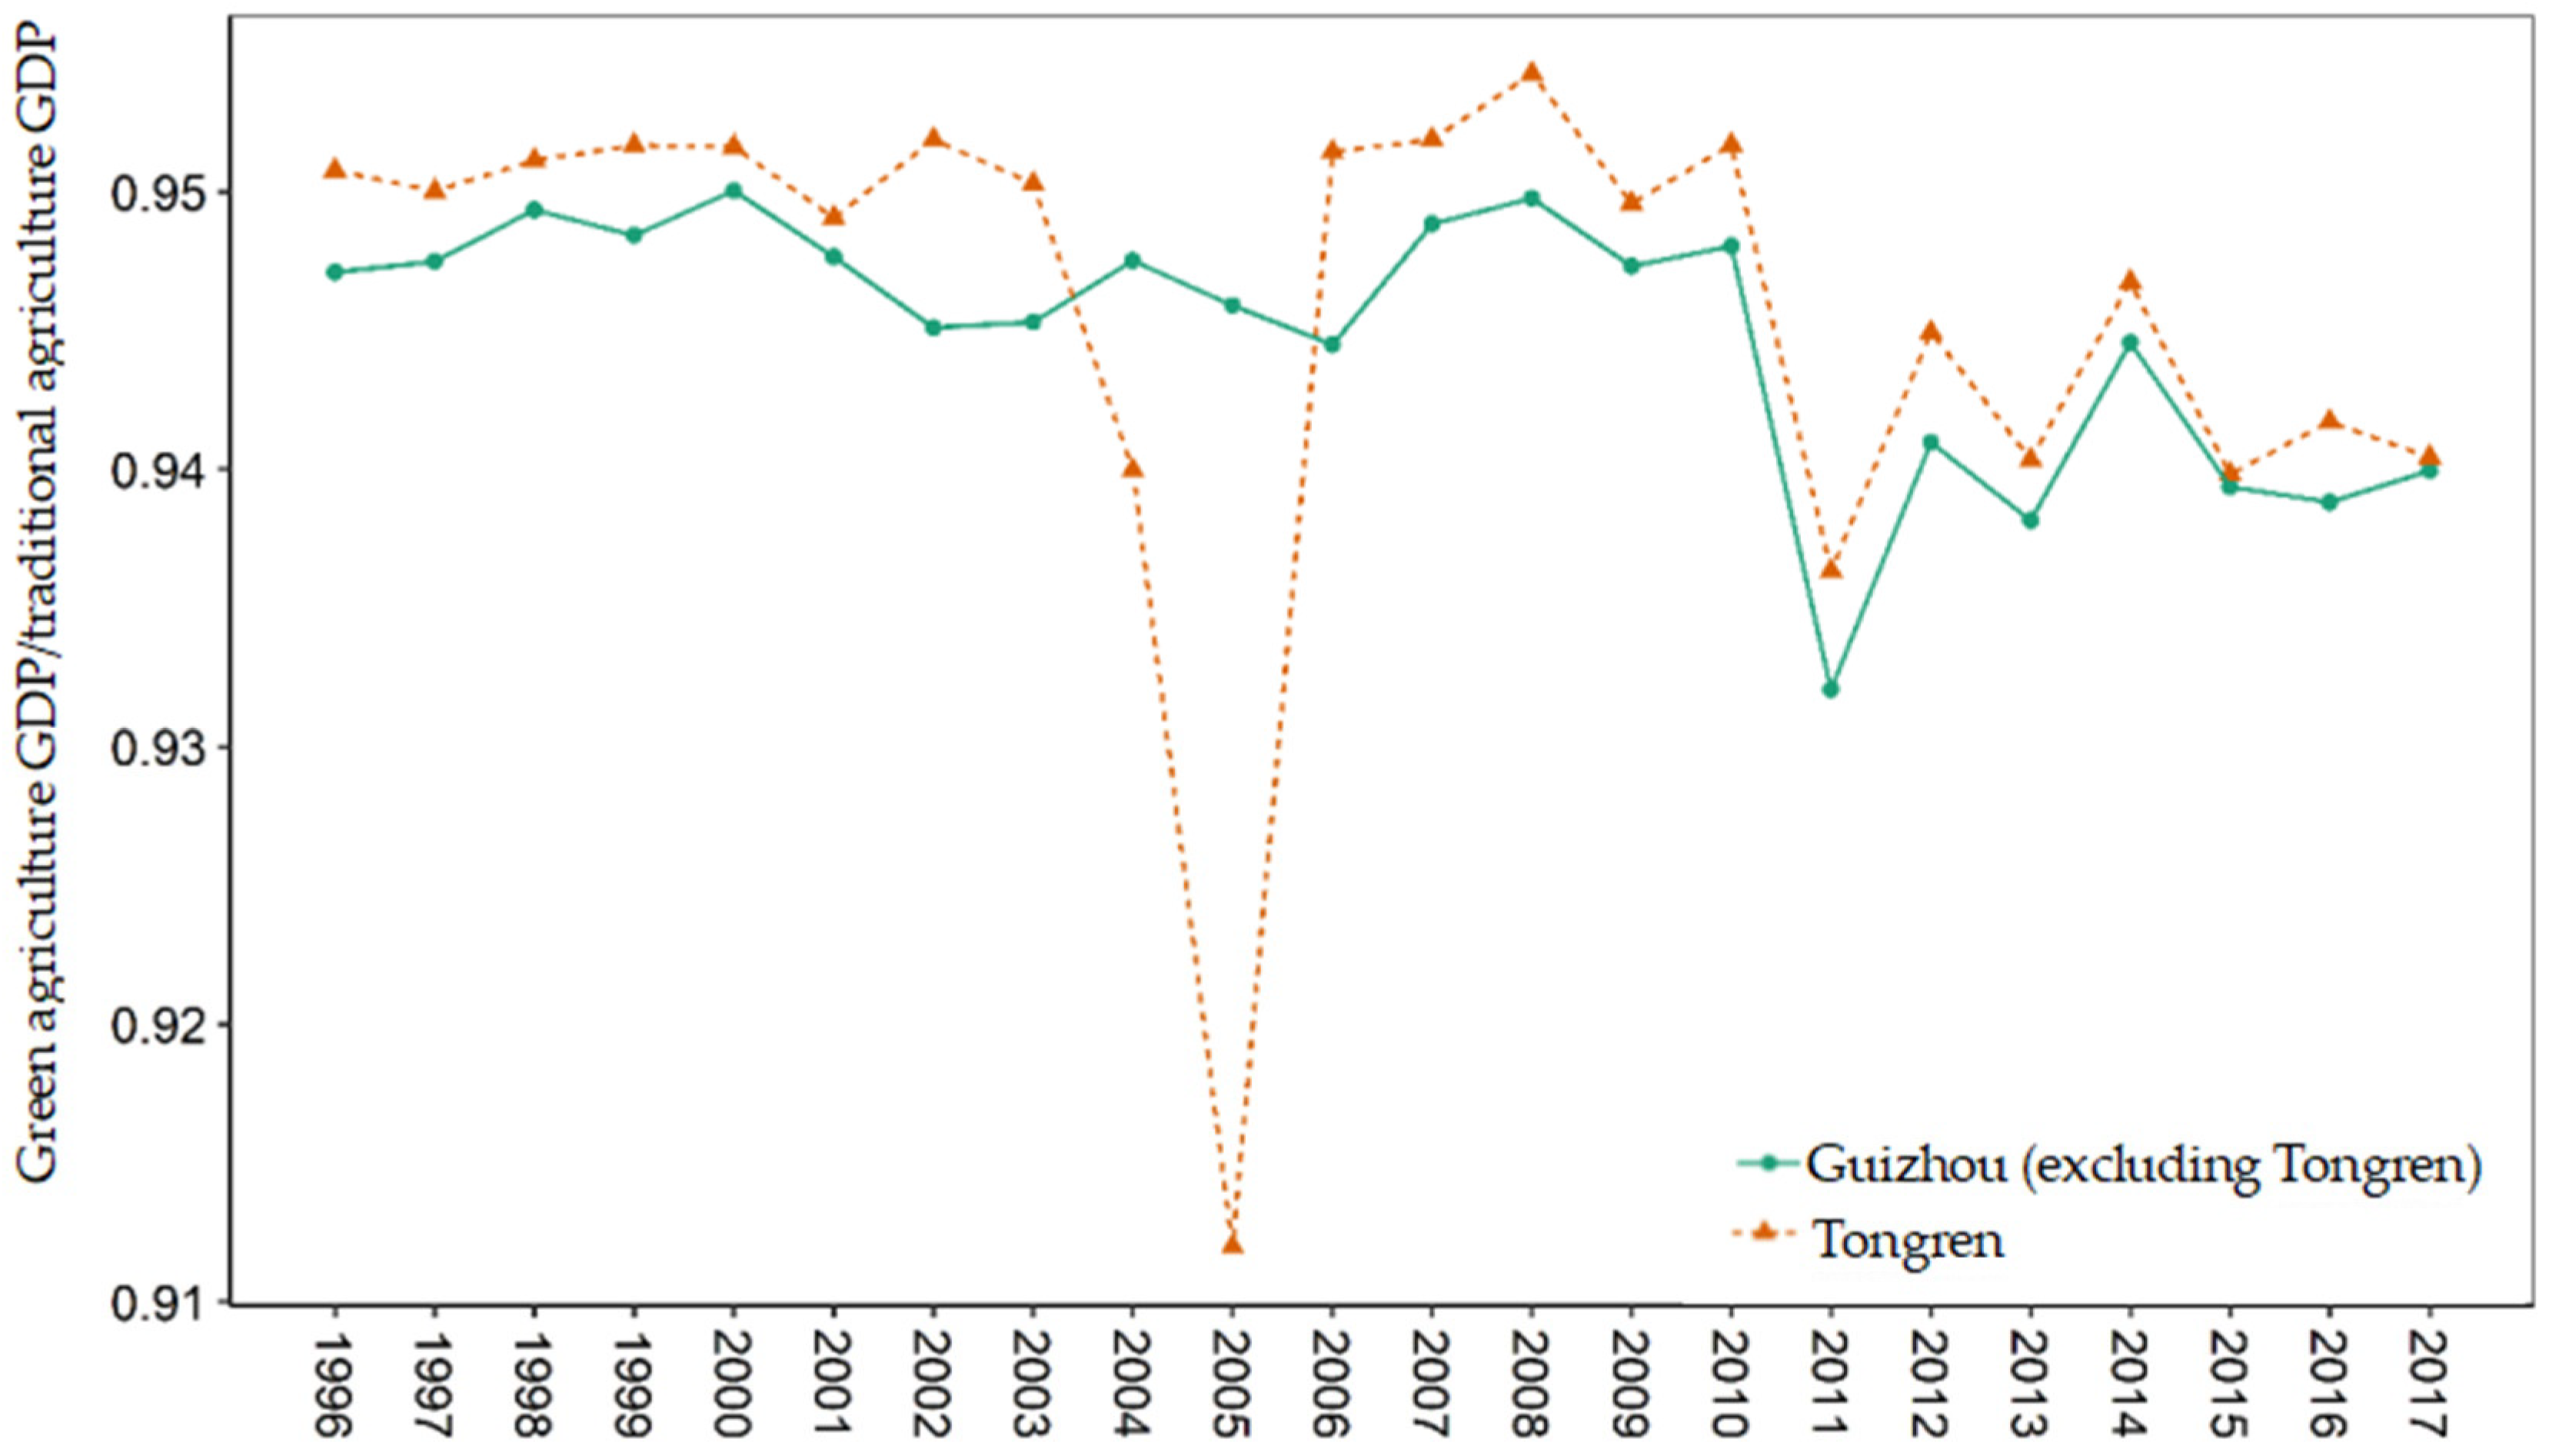
4.1. Spatiotemporal Evolution of AGDP and AGGDP in Tongren City

The detailed changes of green agricultural GDP and traditional agricultural GDP in Tongren City from 1996 to 2017 are shown in Table 1. From the data in the table, from 1996 to 2017, Tongren City’s traditional agricultural GDP increased from 16.9208 to 24.6884; soil loss cost changed from 0.5968 to 1.0061; total nitrogen environmental loss changed from 0.2136 to 0.4327; total phosphorus environmental loss changed from 0.0201 to 0.0274; COD environmental loss changed from 0.0025 to 0.0043; total resource loss cost changed from 0.8330 to 1.4704; green agricultural GDP increased from 16.0878 to 23.2180. The ratio of green agricultural GDP to traditional agricultural GDP has remained slightly fluctuating, at 95% overall. This shows that traditional agriculture in Tongren City was further reformed during the period 1996–2017, and the development of green agriculture achieved remarkable results, driving the growth of total agricultural output.
In general, first, the ratio of green agricultural GDP to traditional agricultural GDP in Tongren City and the ratio of green agricultural GDP to traditional agricultural GDP in Guizhou Province (excluding Tongren City) remain at a level of more than 93%, indicating that the development of green agriculture in Tongren City and other cities and states is improving. Second, the ratio of green agricultural GDP to traditional agricultural GDP in Tongren City is slightly higher than that in Guizhou Province (excluding Tongren City), indicating that the output-value share of green agriculture in Tongren City is relatively high in the whole province. Third, it is worth noting that the ratio of green agricultural GDP to traditional agricultural GDP in Tongren City dropped significantly in 2005, which indicates that the ratio of green agriculture GDP to traditional agriculture GDP decreased compared with the previous stage. The possible reasons for this situation are as follows: in order to promote the development of local economy and society, Tongren developed and introduced some industrial projects in the first few years of 2005, which may not well coordinate the relationship between industrial development and green development while promoting economic development. In this way, the development of green agriculture is likely to be adversely affected by the loss of natural resources and pollution of resources and environment. The protection of agricultural resources and environment and sustainable development are restricted, and the ratio of green agricultural GDP has also changed. At the same time, the ratio of green agricultural GDP to traditional agricultural GDP has gradually rebounded in Tongren City since 2011, which shows that Tongren’s municipal Party committee and government have established a concept of green development, promoted green economic and social development and transformation, paid attention to the protection of the environment and the comprehensive utilization of resources, and made a historic leap in its comprehensive strength in promoting the process of urbanization. The comprehensive agricultural production capacity has been improved, and the development of green agriculture has been accelerated. The temporal and spatial variation trend of the ratio of green agricultural GDP to traditional agricultural GDP between Tongren City and Guizhou Province (excluding Tongren City) from 1996 to 2017 are depicted in Figure 1.
Figure 2 further depicts the temporal and spatial comparison of the ratio of green agricultural GDP to traditional agricultural GDP between Tongren City and other cities and prefectures in Guizhou Province. From each radar chart, the closer the numerical point is to the central point, the smaller the ratio of green agricultural GDP to traditional agricultural GDP; the closer the numerical point is to the edge line, the greater the ratio of green agricultural GDP to traditional agricultural GDP, and the better the development of green agriculture. Compared with the data analysis and presentation from 1996 to 2017, compared with other cities and states, the ratio of green agricultural GDP to traditional agricultural GDP in Tongren is generally higher than that in most cities and states, and has always been among the best, which also means that the development level of green agriculture in Tongren is higher in the whole province, and its demonstration effect and significance of green development and sustainable development play a better role.

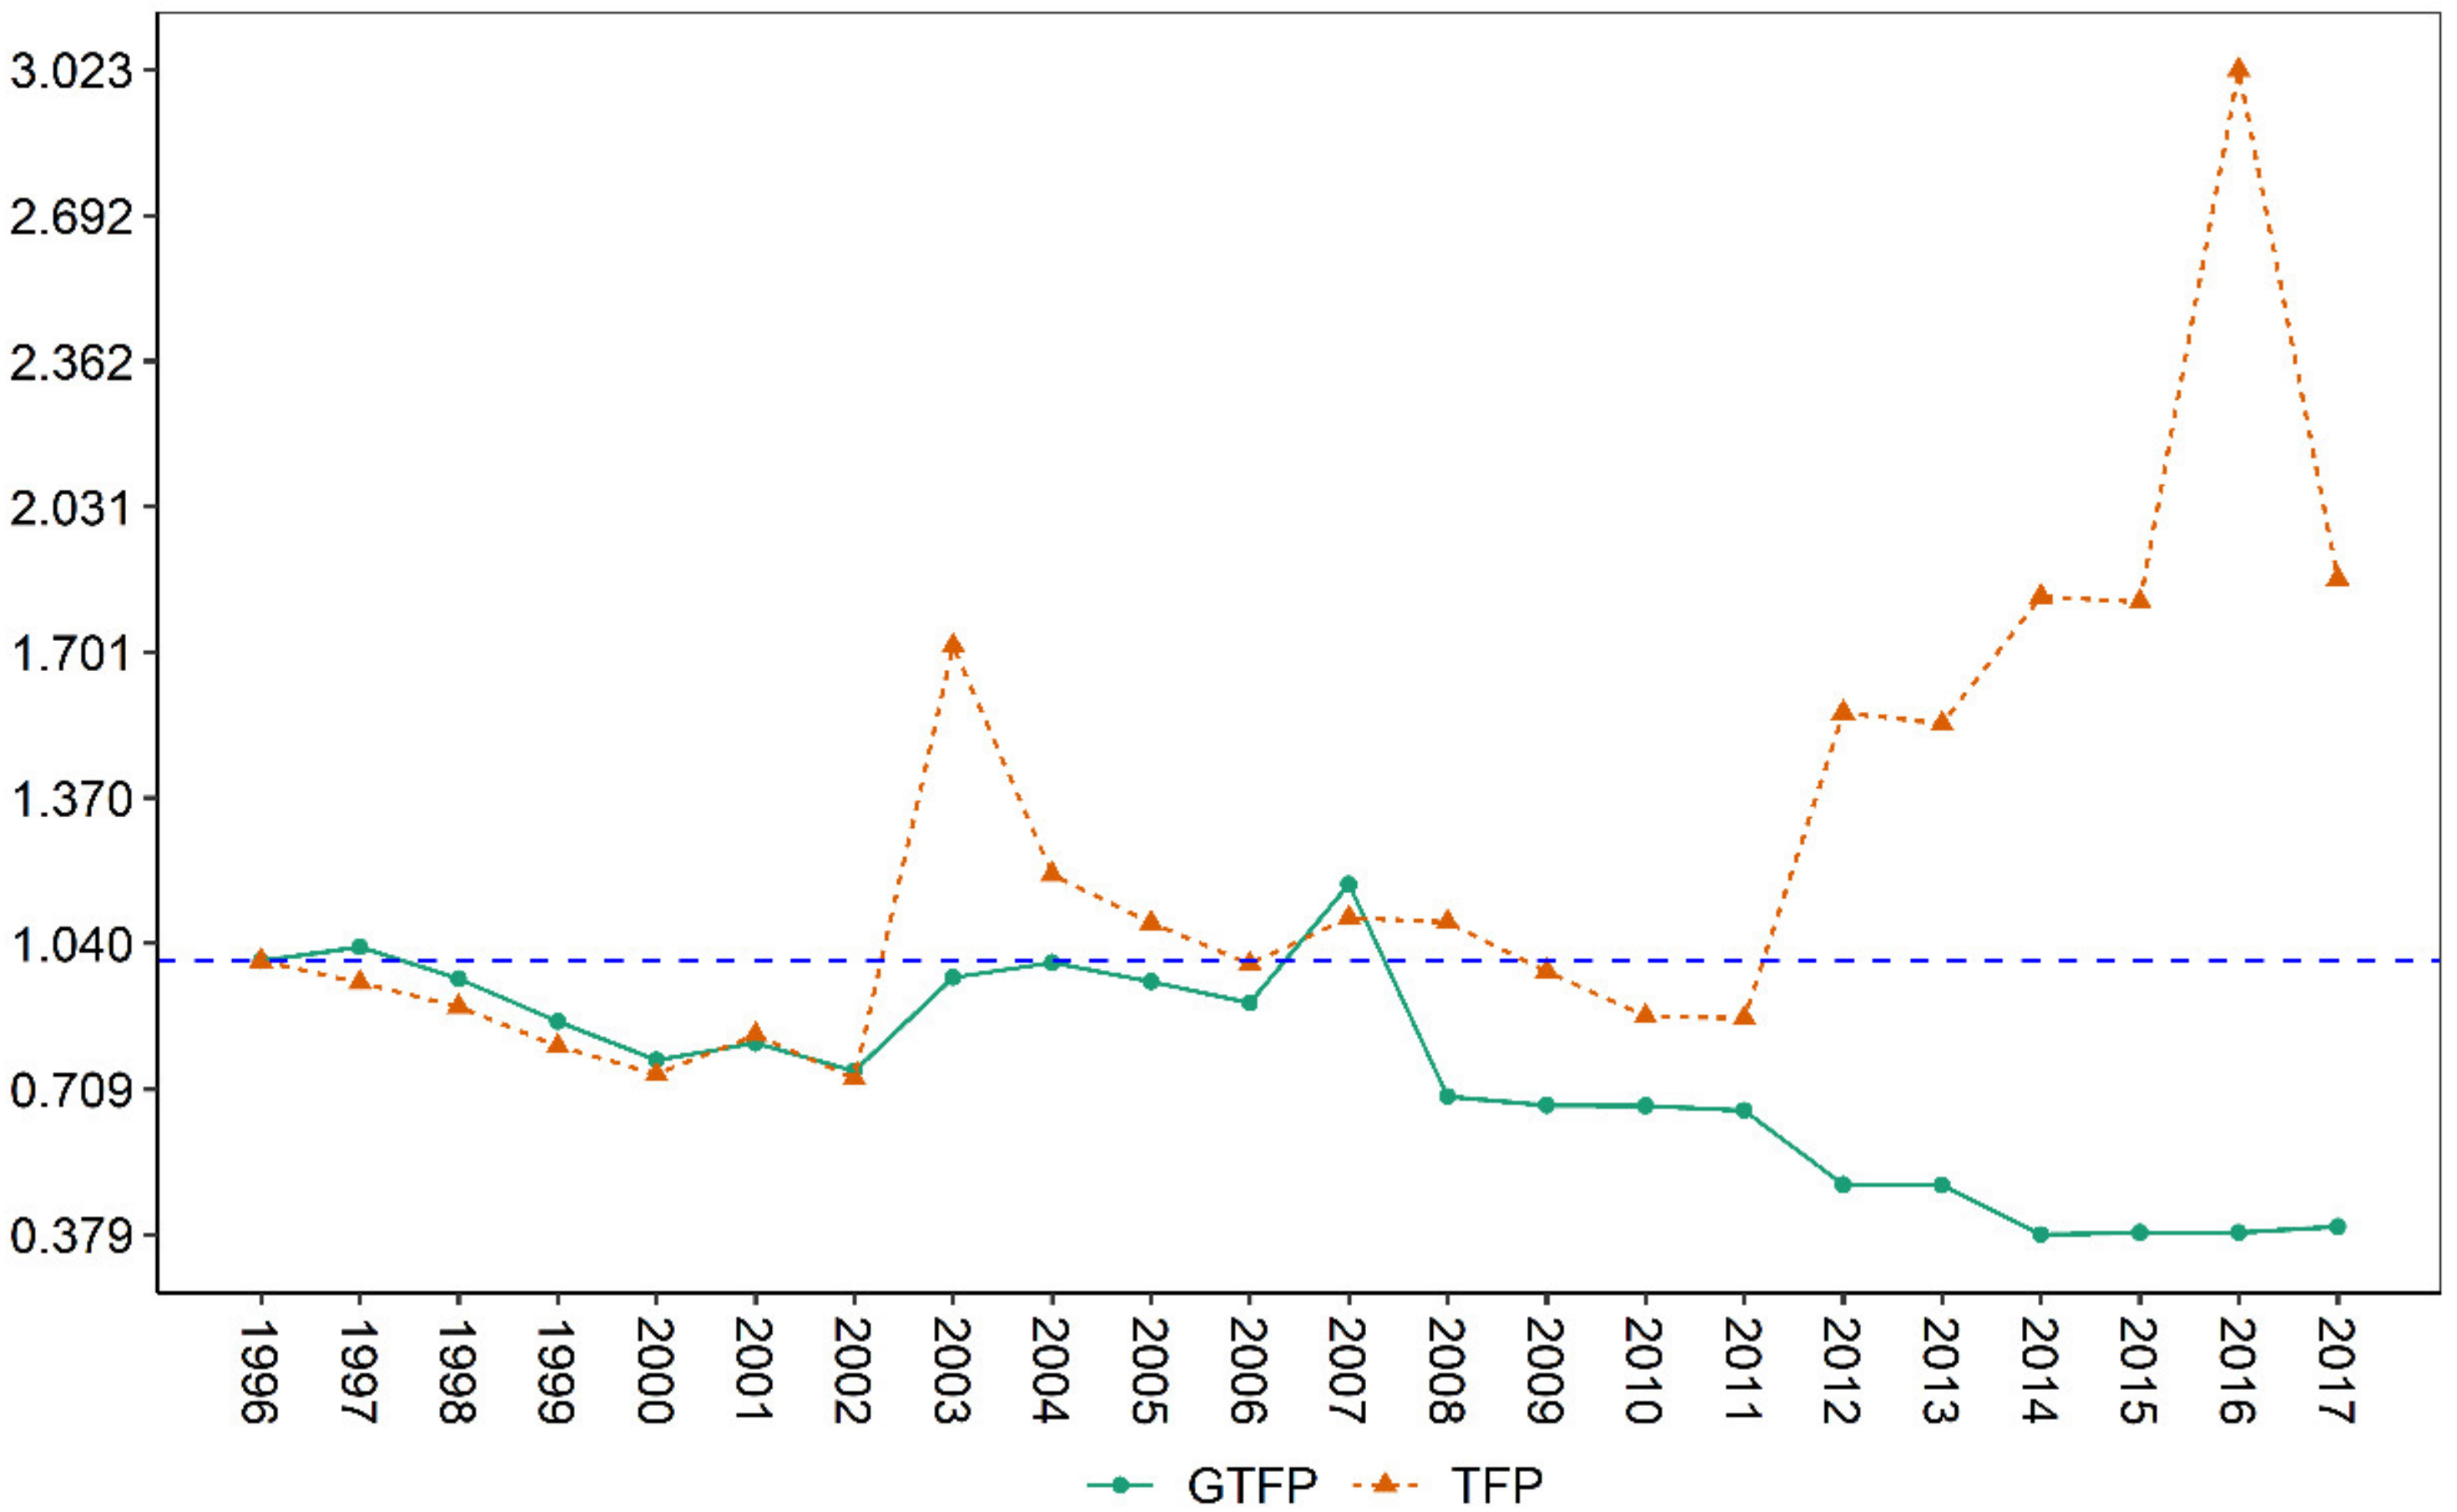
4.2. Temporal and Spatial Comparison between ATFP and AGTFP in Tongren City

The spatial and temporal evolution trend of traditional agricultural TFP and agricultural GTFP in Tongren City from 1996 to 2017 are portrayed in Figure 3. From the overall evolution trend, the agriculture TFP in Tongren City is generally on the rise, while the agricultural GTFP has a slow downward trend. During the periods of 1996–2002 and 2006–2007, the gap between agriculture TFP and agricultural GTFP in Tongren City remained relatively small, but there were differences in different ratios in the rest of the period. After 2011, the gap between agriculture TFP and agricultural GTFP in Tongren City rapidly expanded; that is, the agriculture TFP was much higher than that of agricultural GTFP. These spatiotemporal trends basically indicate that with other conditions unchanged, the growth rates of agricultural labor input, capital input, and agricultural output changed in different ranges and affected each other.

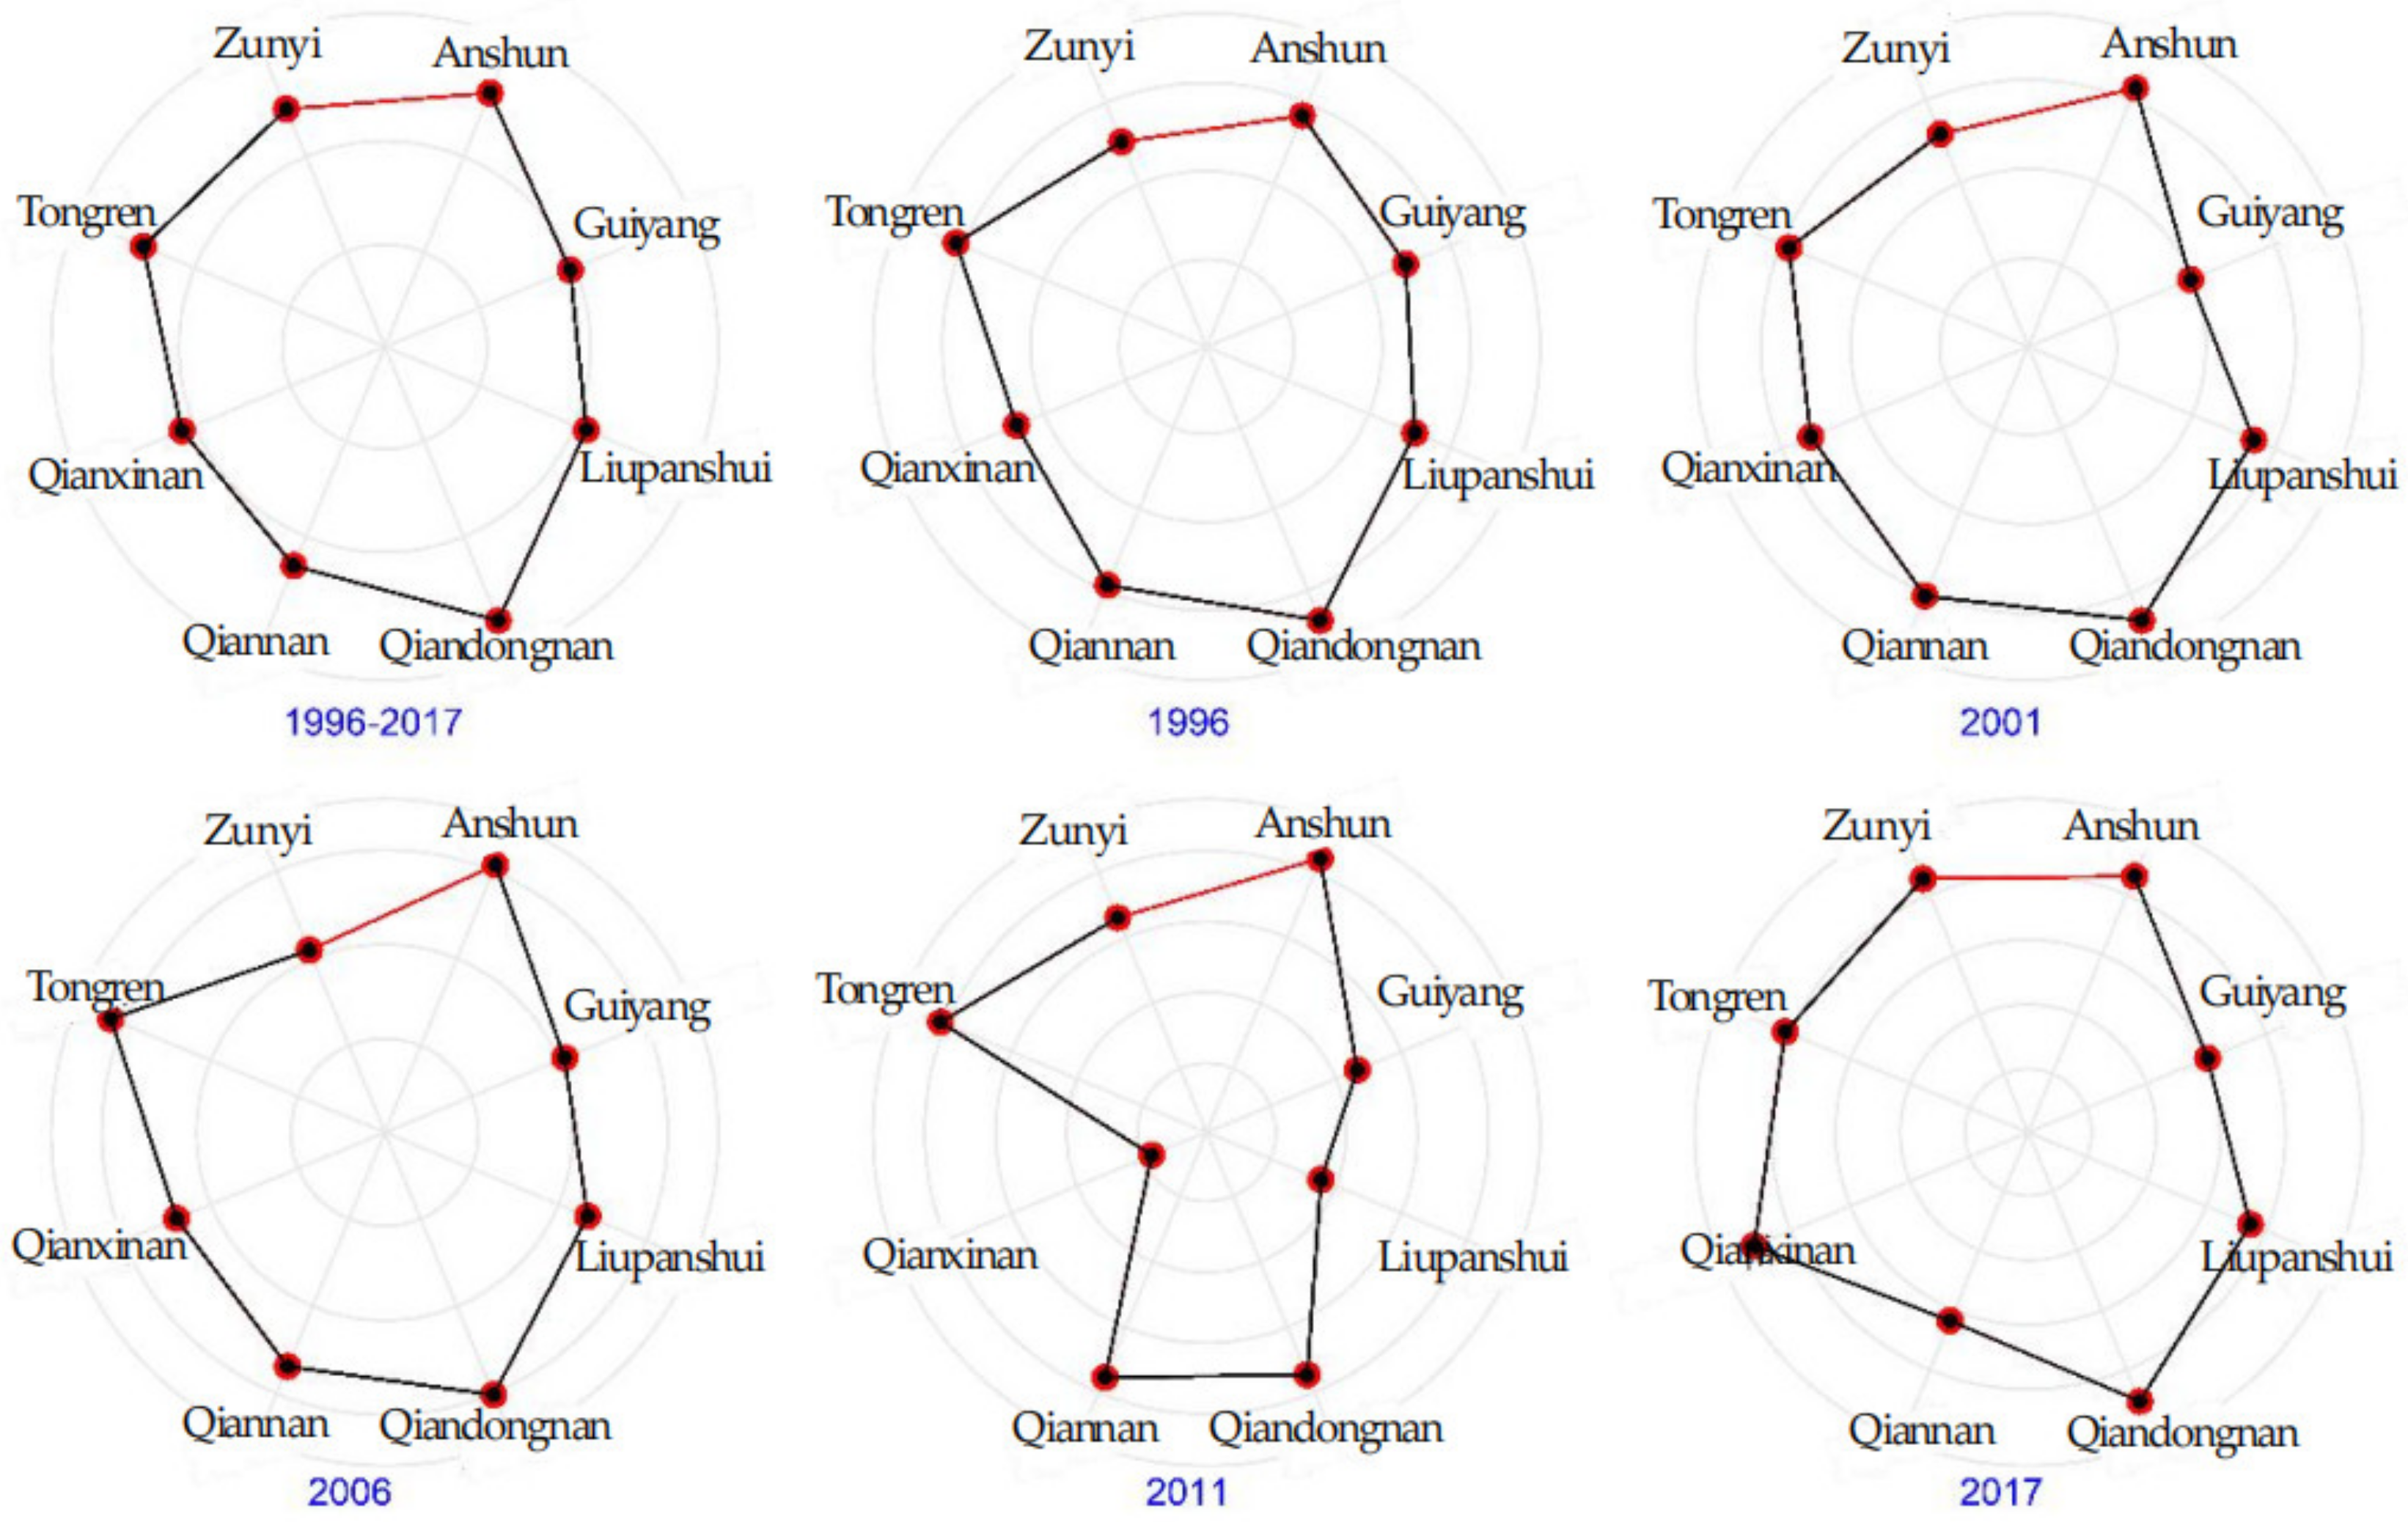
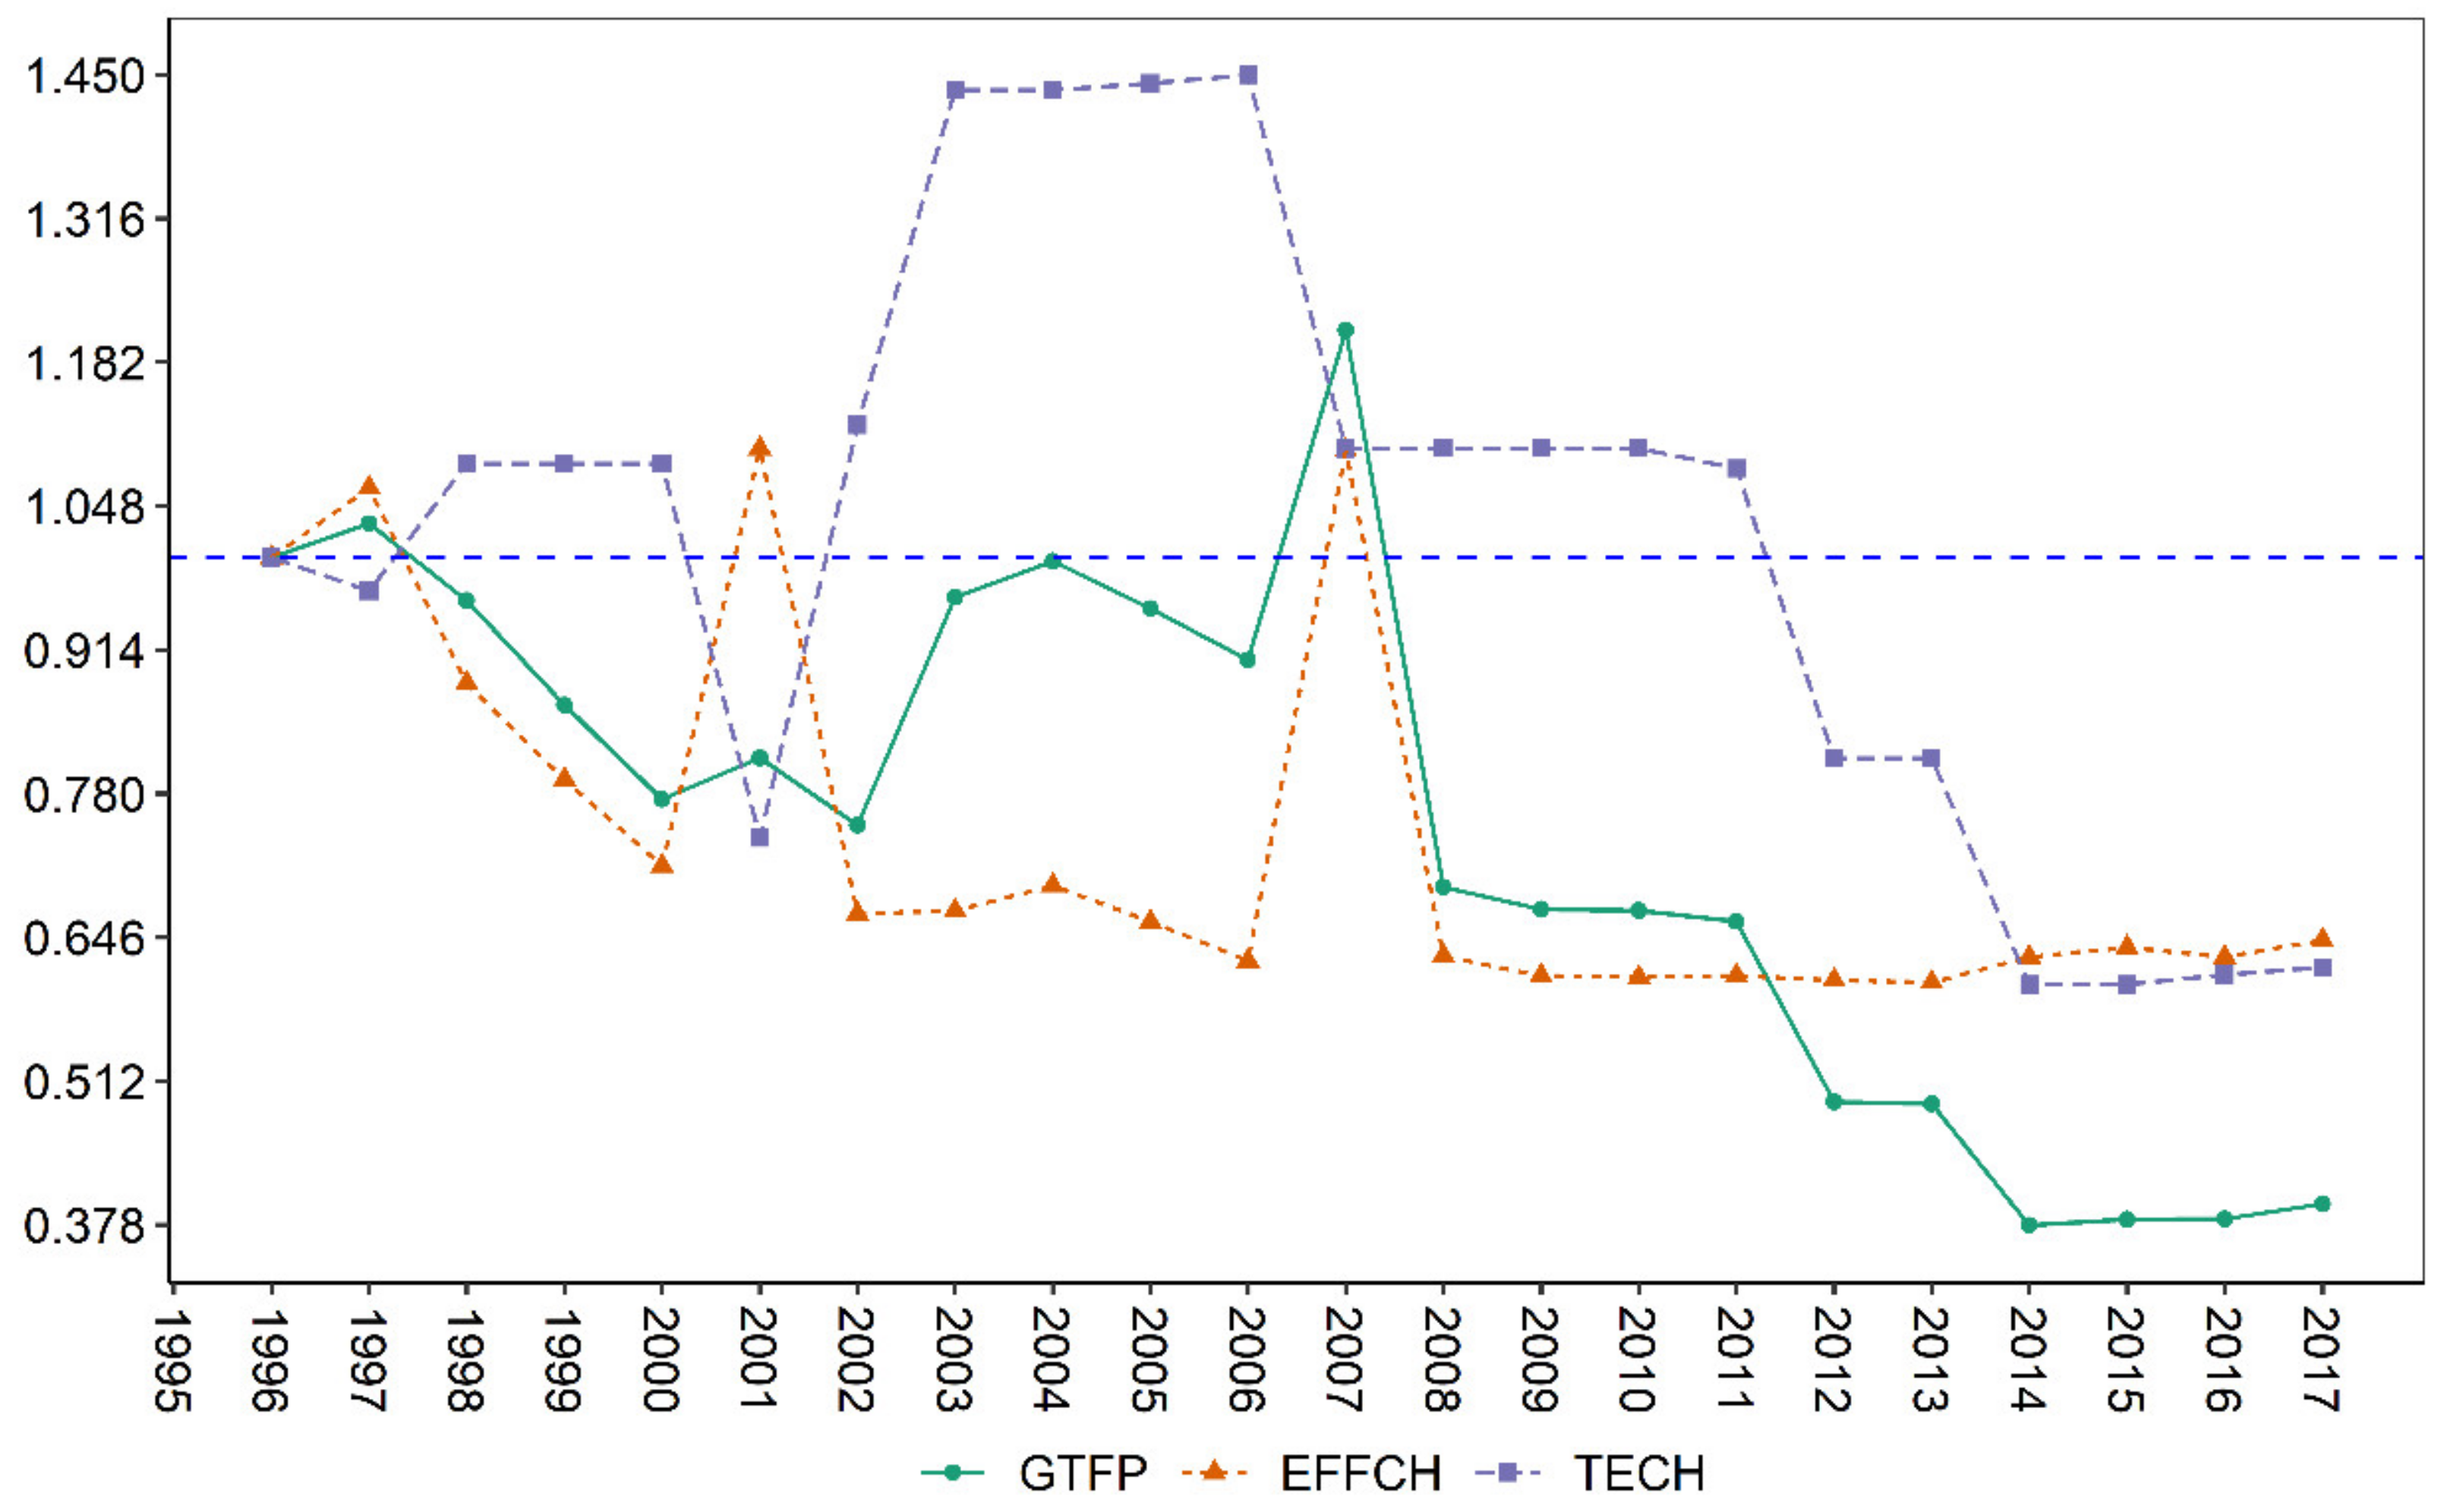
4.3. Spatial Comparison of AGTFP and Its Source Decomposition in Tongren City

The spatiotemporal evolution of agricultural GTFP and its source decomposition in Tongren City from 1996 to 2017 are charted in Figure 4. From the general trend of change in the chart, the fluctuation range of agricultural GTFP in Tongren City shows obvious differences. From 1997 to 2000, the agricultural GTFP in Tongren City showed a significant downward trend due to the significant decrease in agricultural technology utilization efficiency and the decline of agricultural technology. During 2002–2007, there was a big difference between the agricultural GTFP in Tongren City and the change of agricultural technology utilization efficiency and agricultural-technology progress. During this period, the agricultural GTFP may have been on the rise because of the rapid progress of agricultural technology, and in 2007 the agricultural GTFP reached the highest value. During the period from 2007 to 2017, agricultural GTFP declined due to the retrogression of agricultural technology and the slow growth of agricultural technology utilization efficiency.
The ranked changes in agricultural GTFP between Tongren City and the other cities of Guizhou Province in 1997 and 2017, respectively, are listed Table 2, which can reflect the spatial and temporal changes of agricultural GTFP in each city over 20 years (1997–2017). It can be clearly seen from Table 2 that the top three agricultural GTFP in 1997 were Qiannan, Tongren, and Qiandongnan, and the bottom three were Zunyi, Liupanshui, and Anshun. In 2017, the top three agricultural GTFP were Liupanshui, Qiannan, and Qianxinan, while the bottom three were Tongren, Zunyi, and Anshun. Obviously, compared with the other seven cities, the agricultural GTFP of Tongren City fell from second place in 1997 to eighth place in 2017, dropping six places. Significant spatiotemporal changes in the agricultural GTFP of Tongren City took place in the 20-year period of 1997–2017.
Table 3 shows the comparison of agricultural GTFP and its source decomposition between Tongren City and other cities in Guizhou Province. From the perspective of TFP, the TFP level of Tongren City ranks first among cities, followed by Liupanshui City. From the two decomposition indicators of agricultural technology utilization efficiency change and agricultural technology progress, the ranking of Tongren City is not ideal, at the lowest position among the cities, which also leads to the relatively low level of agricultural GTFP in Tongren compared with other cities.

5. Empirical Results and Analysis

5.1. Descriptive Statistics

The descriptive statistical analysis of agricultural GTFP and its influencing variables are demonstrated in Table 4. From the statistical results of the mean, standard deviation, minimum value, lower quartile, median, upper quartile, and maximum value of the sample data, on the whole, the distribution of most variables is relatively concentrated and the degree of dispersion is small. However, it is also found that the dispersion of mechanical input (m) and technological innovation (patent) is high, the gap between the mean and median is large, and the standard deviation is also large, which shows that there are some differences between the two variables of mechanical input (m) and technological innovation level (patent) in the sample data.

5.2. Empirical Analysis

The estimation results of the empirical model of agricultural GTFP are summarized in Table 5. From the impact of various variables on agricultural GTFP, the three variables of urbanization rate (RUP), economic development level (PGDP), and technological innovation level (patent) have passed the significance level test of 5%, 1%, and 5%, respectively, and the directions are positive, and the coefficients are 0.1922, 0.2478, and 0.677,0 respectively, which means that the urbanization rate (RUP), economic development level, (PGDP) and the improvement of technological innovation level (patent) can significantly promote the increase of agricultural GTFP; in particular, the improvement of technological innovation level (patent) can significantly and rapidly improve agricultural GTFP. At the same time, the population density (DP) also passed the significance level test of 1%, and the coefficient is −0.0715, which is negative, indicating that the larger the urban population density (DP), the less conducive it is to promoting the rise of agricultural GTFP. From the impact of various variables on the level of agricultural technological progress, the urbanization rate (RUP) and economic development level (PGDP) have passed the significance level test of 1% and 5%, respectively, and the directions are positive, and the coefficients are 0.2875 and 0.1243, respectively, which shows that under other unchanged conditions, the urbanization rate (RUP) and economic development level (PGDP) have a significant positive role in promoting the improvement of the level of agricultural technological progress. Similarly, the population density (−0.0491) passed the significance level test of 1%, which will significantly restrict the improvement of agricultural technology progress. From the impact of various variables on the change of agricultural technology utilization efficiency, economic development level (PGDP), technological innovation level (patent), population density (DP), and environmental regulation (ER) all passed the significance level test of 5%, but the direction of economic development level (0.1250) and technological innovation level (0.7794) is positive, and the direction of population density (−0.0221) and environmental regulation (−3.6215) is negative; this shows that under the condition that other conditions are not affected, the improvement of economic development level (PGDP) and technological innovation level (patent) can help to improve the agricultural technology utilization efficiency. The greater the population density (DP) and the higher the intensity of environmental regulation (ER), the more it will hinder the rise of agricultural technology utilization efficiency.

6. Conclusions and Implications

Many scholars have conducted in-depth studies on the problems, level measure-ments, and route choices of the growth of agriculture. However, there have been few studies on how to promote agricultural green growth from the perspective of agricultural modernization, and how to combine green agricultural GDP with agricultural GTFP and its source decomposition. To address this research inadequacy, in this paper, we focus on the time and space comparison of green agricultural GDP, agricultural GTFP, and their source decomposition, and summarize and discuss the key factors affecting agricultural GTFP. On the basis of the above analyses, the research findings are summarized as follows: Firstly, for the period of 1996–2017 in Tongren City, overall, the GDP for traditional agriculture, total resource loss costs, and green agricultural GDP all showed an increase, and the ratio of green agricultural GDP to traditional agricultural GDP slightly decreased from 0.9508 in 1996 to 0.9468 in 2017; among them, the highest ratio was 0.9543 in 2008 and the lowest ratio was 0.9120 in 2005. Comparatively speaking, the share of green agricultural output of Tongren City is high at all prefecture levels throughout the province, and the momentum of green agricultural development continues to be favorable. Secondly, the dispersion degree of input variables, such as agricultural fertilizers, agricultural machinery, and agricultural land is relatively high, and the data distribution of the TN in agricultural output variables has certain differences. The changes in agricultural input variables and agricultural output variables jointly affect the amplitude of the fluctuation of agricultural GTFP and its source decomposition. Comprehensive variables such as the application amount of agricultural fertilizers, emission of TP, TN, COD, agricultural mechanization, and planting area of crops will directly affect the agricultural ecological environment, and then affect agricultural GTFP. Thirdly, the agricultural TFP and the agricultural GTFP in Tongren showed an unbalanced and unstable pattern, and the gap showed an increasing trend after 2011, which may be affected by factors such as agricultural labor input, capital input, and agricultural output–input and other factors. There are large spatiotemporal differences between the change of agricultural GTFP and agricultural technology utilization efficiency and agricultural technology progress in Tongren City, which are vulnerable to the fluctuation of agricultural technology utilization efficiency and agricultural technology progress. Fourthly, compared with the existing literature, a lot of existing literature mainly focuses on the measurement of agricultural GTFP to agricultural green growth, but there is lack of agricultural GTFP and its source decomposition to measure agricultural green growth. This paper focuses on the impact of various variables on agricultural GTFP, agricultural technology utilization efficiency, and agricultural technology progress, and accordingly pays attention to agricultural green growth. The increase in population urbanization rate can significantly promote the increase in agricultural GTFP and agricultural technology progress, but it restricts the improvement of agricultural technology utilization efficiency. Hypothesis 1 has been verified: The higher the level of economic development, the more significant the increase in agricultural GTFP, the increase in agricultural technology utilization efficiency, and agricultural technology progress. Hypothesis 2 has been verified: The greater the population density, the easier it is to hinder the increase of agricultural GTFP, the improvement of agricultural technology utilization efficiency, and agricultural technology progress. Hypothesis 3 has been verified: The intensity of environmental regulation is negatively correlated with agricultural GTFP and the agricultural technology utilization efficiency, but it will promote agricultural technology progress to some extent. Hypothesis 4 has been verified: It is noteworthy that some literature shows that the impact of environmental reg-ulation intensity on green total factor productivity is significant, but the impact of environmental regulation intensity on agricultural GTFP has not passed the significance test in this paper, which indicates that to a certain extent, the environmental policies of the research area can not effectively promote the sustainable growth of agricultural GTFP. Therefore, special attention should be paid to the relationship between environmental policy and agricultural green growth. The increase in technology innovation level can significantly improve agricultural GTFP and agricultural technology utilization efficiency. Hypothesis 5 has been verified: Foreign direct investment is negatively and not significantly related to agricultural GTFP, agricultural technology utilization efficiency, and agricultural technology progress. Hypothesis 6 has been verified: It should also be mentioned that some literature has proven that there is a significant positive relationship between FDI and agricultural GTFP in the central areas of China. However, objectively speaking, in this paper, FDI has not significantly promoted the improvement of agricultural GTFP, which is related to the fact that the research area of this paper belongs to the mountainous areas in Western China. Relatively speaking, compared with the eastern and central regions, the international trade environment and foreign investment environment in the western mountainous areas are relatively lagging behind. Therefore, the next step is to adjust the foreign trade structure according to local conditions and form a foreign trade environment conducive to agricultural green growth.
Based on the above findings, the policy implications of this research are significant. First of all, attention should be paid to protecting the agricultural ecological environment, implementing action plans for agricultural green development, improving and perfecting the criteria and standards for agricultural green growth, strictly controlling agricultural fertilizer applications and emissions of TP, TN, and COD, taking advances in biochemical technology and agricultural machinery technology as the inexhaustible drive force for promoting agricultural green growth, agricultural GTFP, promoting agricultural technology utilization efficiency and the agricultural technology progress synchronously, increasing the experimental demonstration of agricultural science and technology, and promoting the improvement of scientific and technological innovation levels of green agricultural. Secondly, adhering to conservation of agricultural lands and renovation of agricultural machinery, developing multifunctional and composite agricultural machinery facilities and equipment suitable for operation in mountainous and dam areas as soon as possible, and improving the utilization rate, conversion rate and productivity of water conservancy irrigation systems and agricultural machinery and equipment operation. We will promote the design of public service policies and support measures to favor agricultural and rural farmers, accelerate the completion of the shortcomings of rural public infrastructure construction, and improve the equalization and quality of rural public services. Furthermore, there is a significant relationship between population urbanization rate, economic development level, technology innovation level, population density and agricultural GTFP. On the one hand, while promoting the improvement of economic development level, we should coordinate the urbanization process, enhance the supporting role of the technological innovation level, and control the negative impact caused by rapid population growth. On the other hand, the relationship between economic development and green development should be well-coordinated in an overall way, and appropriate incentives and restraint mechanisms should be established. According to the different characteristics of different stages of development, the intensity of environmental regulation can be flexibly regulated and foreign direct investment can be actively guided so as to improve the agricultural GTFP.

Author Contributions

T.H. and B.X. conceived and designed the research question. T.H. constructed the models and wrote the paper. B.X. reviewed and edited the manuscript. All authors have read and agreed to the published version of the manuscript.

Funding

This research was funded by the Major Research Project on the Education Reform development of Guizhou, China (grant no.: ZD202102), the Humanities and Social Sciences Research Project of Guizhou Provincial Department of Education (grant no.: 2022ZX010), the Research Project on Major Decision-Making Issues of the CPC Tongren Municipal Committee (grant no.: 2021009), and the Science and Technology Plan Project of Tongren (grant no.: TSKY No,83 in 2020).

Institutional Review Board Statement

Not applicable.

Informed Consent Statement

Not applicable.

Data Availability Statement

The data presented in this study are available within the article.

Acknowledgments

The authors are grateful to the anonymous referees who provided valuable comments and suggestions to significantly improve the quality of the paper. We gratefully acknowledge the financial support from the Major Research Project on the Education Reform development of Guizhou, China (grant no.: ZD202102), the Humanities and Social Sciences Research Project of Guizhou Provincial Department of Education (grant no.: 2022ZX010), the Research Project on Major Decision-Making Issues of the CPC Tongren Municipal Committee (grant no.: 2021009), and the Science and Technology Plan Project of Tongren (grant no.: TSKY No,83 in 2020).

Conflicts of Interest

The authors declare no conflict of interest. There is no professional or other personal interest of any nature or kind in any product, service, and/or company that could be construed as influencing the position presented in, or the review of, the manuscript entitled.

References

  1. Guo, H.; Li, S. Environmental Regulation, Special Effect and Agricultural Green Development. R D Manag. 2022, 34, 54–67. [Google Scholar]
  2. Yu, F.; Lin, S. Theoretical Explanation and Realization Path of Agricultural Green Development under the Targets of Carbon Peaking and Carbon Neutrality. Soc. Sci. Guangdong 2022, 2, 24–32. [Google Scholar]
  3. Liu, Y.; Ou, Y.; Cai, H. Evaluation of China’s Agricultural Green TFP and Its Spatiotemporal Evolution Characteristics. J. Quant. Tech. Econ. 2021, 38, 39–56. [Google Scholar]
  4. Peng, C.; Liu, H. Agriculture and Rural Modernization during the 14th Five-Year Plan Period: The Situation, Problems and Countermeasure. Reform 2020, 2, 20–29. [Google Scholar]
  5. Gao, Q.; Ceng, H. Strategic Focus and Policy Orientation of Agricultural and Rural Modernization during the 14th Five-Year Plan Period. Acad. J. Zhongzhou 2020, 12, 1–8. [Google Scholar]
  6. Feng, D.; Xu, T. The Historical Retrospect and Logical Evolution of China’s Agricultural Green Development. Issues Agric. Econ. 2021, 10, 90–99. [Google Scholar]
  7. Ye, X.; Cheng, Y.; Subject Team of Rural Economy Research Department of Development Research Center of the State Council. The Connotation and Evaluation System of Agricultural and Rural Modernization in the New Development Stage. Reform 2021, 9, 1–15. [Google Scholar]
  8. Zhong, Z.; Xie, D.; Cha, Z. Strategic Orientation and Key Policies of China’s Agricultural and Rural Modernization during “14th Five-Year Plan”. Jianghai Acad. J. 2021, 2, 113–119. [Google Scholar]
  9. The Central Committee of the Communist Party of China. Compilation of No. 1 Documents of the CPC Central Committee and the State Council on the Work of “Agriculture, Rural Areas and Farmers” (1982–2014); People’s Publishing House: Beijing, China, 2014. [Google Scholar]
  10. The CPC Central Committee and the State Council issued several opinions on strengthening reform and innovation and accelerating agricultural modernization. Bull. State Counc. People’s Repub. China 2015, 5, 6–14.
  11. Several opinions of the CPC Central Committee and the State Council on implementing the new concept of development, accelerating agricultural modernization and achieving the goal of building a moderately prosperous society in all respects. Bull. State Counc. People’s Repub. China 2016, 6, 7–17.
  12. The People’s Daily. Opinions of the CPC Central Committee and the State Council on Deepening the Supply Side Structural Reform of Agriculture and Accelerating the Cultivation of New Drivers of Agricultural and Rural Development; The People’s Daily: Beijing, China, 2017. [Google Scholar]
  13. The People’s Daily. Opinions of the CPC Central Committee and the State Council on Implementing the Rural Revitalization Strategy; The People’s Daily: Beijing, China, 2018. [Google Scholar]
  14. Several opinions of the CPC Central Committee and the State Council on adhering to the priority development of agriculture and rural areas and doing a good job in the work of “agriculture, rural areas and farmers”. Bull. State Counc. People’s Repub. China 2019, 7, 25–33.
  15. The People’s Daily. Opinions of the CPC Central Committee and the State Council on Grasping the Key Work in the Field of “Agriculture, Rural Areas and Farmers” to Ensure the Realization of a Moderately Prosperous Society in All Respects on Schedule; The People’s Daily: Beijing, China, 2020. [Google Scholar]
  16. The People’s Daily. Opinions of the CPC Central Committee and the State Council on Comprehensively Promoting Rural Revitalization and Accelerating Agricultural and Rural Modernization; The People’s Daily: Beijing, China, 2021. [Google Scholar]
  17. The People’s Daily. Opinions of the CPC Central Committee and the State Council on Doing a Good Job in the Key Work of Comprehensively Promoting Rural Revitalization in 2022; The People’s Daily: Beijing, China, 2022. [Google Scholar]
  18. Schultz, T.W. Transforming Traditional Agriculture; The Commercial Press: Beijing, China, 2021; p. 14175. [Google Scholar]
  19. Yin, X.; Jia, X.; Li, D. The empact of agricultural industrial agglomeration on green totalfactor productivity: Based on the perspective of spatial spillover effect. Chin. J. Agric. Resour. Reg. Plan. 2022, 1–11. Available online: https://kns.cnki.net/kcms/detail/11.3513.S.20220129.1448.016.html (accessed on 1 January 2022).
  20. Gao, M.; Zhang, Z. Positioning and Policy Suggestions of China’s Agricultural Green Development under the Targets of Carbon Peaking and Carbon Neutrality. J. Huazhong Agric. Univ. (Soc. Sci. Ed.) 2022, 1, 24–31. [Google Scholar]
  21. Huang, Q.; Jiang, S.; Cao, Z. Empirical Analysis about the Influence and Dynamic Transformation of Human Capital on Agricultural Modernization. China Popul. Resour. Environ. 2016, 26, 93–101. [Google Scholar]
  22. Thomas, D.; Adegbola-Patrice, Y.; Adegbola, C.; Daudu, C.; Issa, F.; Kamau, G.; Kergna, A.O.; Mose, L.; Ndirpaya, Y.; Fatunbi, O.; et al. Mechanization, digitalization, and rural youth-Stakeholder perceptions on three mega-topics for agricultural transformation in four African countries. Glob. Food Secur. 2022, 32, 100616. [Google Scholar]
  23. Long, Q.; Lu, H.; Gao, Q.; Lu, H. Household-owned farm machinery vs. outsourced machinery services: The impact of agricultural mechanization on the land leasing behavior of relatively large-scale farmers in China. Land Use Policy 2022, 115, 106008. [Google Scholar]
  24. Ma, W.; Zhu, Z.; Zhou, X. Agricultural mechanization and cropland abandonment in rural China. Appl. Econ. Lett. 2022, 29, 526–533. [Google Scholar]
  25. Tian, X.; Li, W.; Li, R. The Environmental Effects of Agricultural Mechanization: Evidence from Agricultural Machinery Purchase Subsidy Policy. Chin. Rural. Econ. 2021, 9, 95–109. [Google Scholar]
  26. Zhang, Z. Some Important Problems and Measures of Farmland Construction Suitable for Mechanization in Hilly and Mountainous Areas During the 14th Five-year Plan Period. Chin. Rural. Econ. 2020, 11, 13–28. [Google Scholar]
  27. Huang, Q.; Hu, J.; Chen, X. Environmental regulation and green all element productivity: Dilemma or win win? China Popul. Resour. Environ. 2018, 28, 140–149. [Google Scholar]
  28. Ming, C. Establishing and Empirical Analysis of Green Growth Evaluation Indicator System for China’s Agriculture. J. Tech. Econ. Manag. 2021, 9, 108–113. [Google Scholar]
  29. Qiu, W.; Zhong, Z.; Tian, W. Spatial and temporal patterns and influencing factors for agricultural green growth in the Yangtze River Economic Belt. Chin. J. Eco-Agric. 2020, 28, 764–774. [Google Scholar]
  30. Huang, T.; Lu, D.; Yang, J. Comprehensive Evaluation and Spatio-temporal Variation Analysis of Cutivated Land in Provincial Area Based on GIS—A Case Study in Guizhou Province. Res. Soil Water Conserv. 2017, 24, 253–257. [Google Scholar]
  31. Du, Y.; Pan, C.; Song, S. Evaluation on the Development Degree of China’s Agricultural Modernization—Based on the Calculation and Grading of Agricultural Statistics in Different Regions at Provincial Level. J. Agrotech. Econ. 2018, 3, 79–89. [Google Scholar]
  32. Liu, Y.; Li, H.; Ma, H. Evaluation of Agricultural Modernization of State Farms: Based on Entropy Weight Method and TOPSIS Method. Issues Agric. Econ. 2021, 2, 107–116. [Google Scholar]
  33. Tian, Y.; Huang, J.; An, M. Evaluation on the Efficiency of Agricultural Modernization under the Rural Revitalization Strategy: Based on the Combined Analysis of Super-efficiency DEA and Comprehensive Entropy Method. Issues Agric. Econ. 2021, 3, 100–113. [Google Scholar]
  34. Staniszewski, J.; Łukasz, K. Do Structures Matter in the Process of Sustainable Intensification? A Case Study of Agriculture in the European Union Countries. Agriculture 2022, 12, 334. [Google Scholar] [CrossRef]
  35. Guo, L.; Zhao, S.; Song, Y.; Tang, M.; Li, H. Green Finance, Chemical Fertilizer Use and Carbon Emissions from Agricultural Production. Agriculture 2022, 12, 313. [Google Scholar] [CrossRef]
  36. Development Economics Editorial Group. Economics of Development; Higher Education Press: Beijing, China, 2019; p. 438. [Google Scholar]
  37. Wei, H.; Cui, K. Building the Chinese Road to Agricultural Powerhouses: Basic Logic, Process Judgment, and Strategic Support. Chin. Rural. Econ. 2022, 1, 2–23. [Google Scholar]
  38. Huang, T.; Huang, Q.; Hu, J. The influence of pilot identification on the economic benefit of Family Farm—Empirical Test based on PSM Method and Multiple Logit Model. World Agric. 2020, 9, 56–64. [Google Scholar]
  39. Hu, J.-F.; Wang, Z.; Lian, Y.-H.; Huang, Q. Environmental Regulation, Foreign Direct Investment and Green Technological Progress-Evidence from Chinese Manufacturing Industries. Int. J. Environ. Res. Public Health 2018, 15, 221. [Google Scholar] [CrossRef] [Green Version]
  40. Hu, J.-F.; Wang, Z.; Huang, Q.-H. Factor allocation structure and green-biased technological progress in Chinese agriculture. Econ. Res.-Ekon. Istraz. 2021, 34, 2034–2058. [Google Scholar] [CrossRef]
  41. Chen, Y.; Zhuang, P.; Peng, J. The Impact on Agriculture Economy High-quality Development of Trade Openness: From the Perspective of Agricultural Green Total Factor Productivity. Ecol. Econ. 2021, 37, 105–114. [Google Scholar]
  42. Hu, J.; Pan, X.; Huang, Q. Quantity or quality? The impacts of environmental regulation on firms’innovation–Quasi-natural experiment based on China’s carbon emissions trading pilot. Technol. Forecast. Soc. Chang. 2020, 158, 120122. [Google Scholar] [CrossRef]
Figure 1. Changing in the ratio of AGGDP to AGDP between Tongren City and Guizhou Province (excluding Tongren City).
Agriculture 12 01067 g001
Figure 2. Comparison of the ratio of AGGDP to AGDP between Tongren City and other cities and prefectures in Guizhou Province.
Agriculture 12 01067 g002
Figure 3. Changing of ATFP and AGTFP in Tongren City.
Agriculture 12 01067 g003
Figure 4. Spatial evolution of AGTFP and its source decomposition in Tongren City.
Agriculture 12 01067 g004
Table 1. Changing of AGGDP and AGDP in Tongren City.
YearAGDPSLCTNELTPELCODELTRLCAGGDPAGGDP/AGDP
199616.9208 0.5968 0.2136 0.0201 0.0025 0.8330 16.0878 0.9508
199716.5444 0.5877 0.2241 0.0125 0.0023 0.8266 15.7178 0.9500
199816.6979 0.5879 0.2139 0.0116 0.0024 0.8158 15.8821 0.9511
199916.3922 0.5757 0.2026 0.0112 0.0025 0.7920 15.6002 0.9517
200016.0434 0.5603 0.2019 0.0112 0.0026 0.7759 15.2675 0.9516
200115.5334 0.5702 0.2063 0.0118 0.0028 0.7912 14.7422 0.9491
200216.2659 0.5617 0.2066 0.0117 0.0027 0.7826 15.4833 0.9519
200316.8760 0.5925 0.2304 0.0129 0.0030 0.8387 16.0373 0.9503
200418.1378 0.8441 0.2265 0.0136 0.0045 1.0887 17.0491 0.9400
200518.0375 1.2897 0.2744 0.0167 0.0067 1.5875 16.4500 0.9120
200618.4189 0.6776 0.2000 0.0133 0.0035 0.8944 17.5245 0.9514
200720.5163 0.6996 0.2665 0.0161 0.0045 0.9868 19.5294 0.9519
200822.1622 0.7342 0.2598 0.0156 0.0039 1.0136 21.1486 0.9543
200922.6401 0.7823 0.3328 0.0195 0.0067 1.1412 21.4989 0.9496
201026.1626 0.8643 0.3709 0.0211 0.0076 1.2638 24.8988 0.9517
201127.4759 1.2208 0.4900 0.0292 0.0090 1.7491 25.7268 0.9363
201228.8445 1.0762 0.4767 0.0262 0.0092 1.5882 27.2562 0.9449
201329.5752 1.1931 0.5323 0.0288 0.0099 1.7640 27.8112 0.9404
201435.6093 1.2753 0.5819 0.0333 0.0053 1.8958 33.7135 0.9468
201525.2883 1.0108 0.4792 0.0272 0.0042 1.5214 23.7668 0.9398
201625.6443 0.9857 0.4764 0.0281 0.0043 1.4945 24.1497 0.9417
201724.6884 1.0061 0.4327 0.0274 0.0043 1.4704 23.2180 0.9404
Table 2. Ranking changes of AGTFP between Tongren City and other cities and prefectures in Guizhou Province.
CityRank_1997Rank_2017Rank_ChangeGTFP_Change
Qiannan1216.4400
Tongren286−3.0200
Qiandongnan3522.1300
Guiyang4402.1800
Qianxinan53−23.7900
Anshun6600.5400
Liupanshui71−67.5200
Zunyi87−1−1.3800
Table 3. Comparison of AGTFP and its source decomposition between Tongren City and other cities and prefectures in Guizhou Province.
CityTFPGTFPEFFCHTECH
Qiannan0.87881.48130.85771.7437
Qiandongnan0.77181.31000.92741.4160
Liupanshui1.05081.22981.12001.1014
Guiyang0.32731.14161.12681.0280
Qianxinan0.96351.12430.92881.2302
Anshun0.72970.97730.86211.1452
Zunyi0.82270.80820.74761.0999
Tongren1.26360.74730.73511.0184
Table 4. Descriptive statistics of variables.
StatisticNMeanSt. Dev.MinPctl (25)MedianPctl (75)Max
Y16817.1710.5774.9349.23414.36520.92966.574
TN1689919.5935058.7054214.726898.7537978.48510,193.0127,836.39
TP168300.855142.50983.672210.087273.936333.535896.104
COD16811.3189.1554.666.447.5199.7244.905
L16847,6167.1287,699.8223,720251,340422,883.3520,496.81,302,150
N168157.38954.25417.454125.701161.823211.583213.344
M1681,428,948951,713.9195,000635,947.21,206,554191,17254,575,300
F16879,052.740,066.3929,42656,100.565,843.579,780.8227,310
GTFP1680.7580.2440.3430.610.6820.8631.599
RUP16833.48312.52711.36926.77631.79137.53886.06
PGDP1680.310.3020.0550.1140.2060.3881.632
PD168273.102136.1350238.3263.4321.61148
ER168326.21870.858223272294398455
Patent1686234.5717693.6477749862674835125,315
FDI168105.79168.73548.82867.38973.166110.285308.889
Table 5. Estimation results of measurement model.
VariableLnGTFPLnTCLnEC
(1)(2)(3)
RUP0.1922 **0.2875 ***−0.0957
(0.0964)(0.0781)(0.0948)
PGDP0.2478 ***0.1243 **0.1250 **
(0.0596)(0.0483)(0.0586)
DP−0.0715 ***−0.0491 ***−0.0221 **
(0.0103)(0.0083)(0.0101)
ER−2.54840.4443−3.6215 **
(1.7738)(1.4372)(1.7446)
Patent0.6770 **0.08140.7794 **
(0.3329)(0.2697)(0.3274)
FDI−0.411−0.2275−0.3442
(0.3733)(0.3025)(0.3672)
Constant10.6337−2.648916.1535 **
(6.9970)(5.6691)(6.8816)
YearYesYesYes
CityYesYesYes
N168168168
R20.54440.52660.3057
Note: The parentheses are the robust standard error values. Among them: **, ***, respectively, indicate that the parameters are estimated to pass the statistical significance test at 5% and 1%.
Publisher’s Note: MDPI stays neutral with regard to jurisdictional claims in published maps and institutional affiliations.

