Article

Optimizing Nitrogen Application for Chinese Ratoon Rice Based on Yield and Reactive Nitrogen Loss

1
College of Agriculture, Yangtze University, Jingzhou 434025, China
2
Engineering Research Center of Ecology and Agricultural Use of Wet Land, Ministry of Education, Jingzhou 434025, China
3
College of Tropical Crops, Hainan University, Haikou 570228, China
4
Jiangsu Institute of Agricultural Sciences in Coastal Region, Yancheng 224002, China
5
College of Life Science, Yangtze University, Jingzhou 434025, China
*
Author to whom correspondence should be addressed.
Agriculture 2022, 12(7), 1064; https://doi.org/10.3390/agriculture12071064
Submission received: 15 June 2022 / Revised: 11 July 2022 / Accepted: 13 July 2022 / Published: 20 July 2022
(This article belongs to the Special Issue Innovative Conservation Cropping Systems and Practices)

Abstract

:
Ratoon rice (RR) has been regarded as a labor-saving and beneficial production system. Nitrogen (N) surplus and reactive N losses (Nr losses) are effective environmental indicators used to evaluate the performance of N management. Few studies have assessed N surplus and Nr losses for Chinese RR. In this study, Chinese RR planting areas were divided into South China (SC), the southern part of East China (SEC), Central China (CC), the northern part of East China (NEC), and Southwest China (SW). N surplus and Nr losses were also calculated based on 782 studies using a quadratic model under optimized N management for the highest yield (OPT-yield), the highest N-use efficiency (NUE) (OPT-NUE), and the highest grain N uptake (OPT-N uptake). The RR yields in the five regions ranged from 9.98 to 13.59 t ha−1. The high-yield record was observed in SEC, while the low-yield record was observed in NEC. The highest and the lowest Nr losses were found in NEC and SC, respectively. N surplus was reduced, while the yield was maintained in SEC, CC, NEC, and SW under OPT-yield and OPT-N uptake, and N surplus and Nr losses were reduced in the five regions when targeting the highest NUE. Farmers should be encouraged to plant RR in SEC and CC. RR was also a good choice when N management measures were conducted in three other regions. To achieve a win–win situation for both yield and the environment, OPT-yield could serve to improve the N management of current conventional practices.

1. Introduction

With the world population increasing, rice production needs to reach 519.50 million tonnes in order to meet the world population’s demand for rice in 2022 [1], and China is not exempt from this. Rice is a staple food for more than 65% of Chinese people, and it is a subsistence crop for rice farmers and consumers in Chinese rural areas lacking resources. About 20% more rice needs to be produced by 2030 to meet domestic demands if rice consumption per capita is to be kept at the present level in China [2]. Therefore, it is imperative to increase rice yield per hectare in the limited planting area. Ratoon rice (RR) is a kind of rice that can be harvested twice in one crop; dormant sprouts that survive on rice stubble germinate into ears and can then be harvested for another season (ratoon crop) after the harvest of the first crop (main crop). Two harvests and a higher multiple cropping index can be realized using this rice farming system [3]. Grain yield in the RR system is higher than that in middle-season rice, and the net energy ratio and the economic profit in the RR system are higher than those in double-season rice [4].
Nitrogen (N) is the main nutrient used to boost the growth and development of crops. The use of N fertilizer is necessary to obtain high crop yields [5]. Farmers usually input ample N fertilizer to ensure higher grain yields. The data released by the National Bureau of Statics in 2021 showed that the consumption of N fertilizer applied to crops in China was 51.91 Tg (1 Tg = 1012 g) [6], accounting for about 45.66% of the world’s total N fertilizer consumption (113.70 Tg, International Fertilizer Industry) [7]. However, too much N does not increase the yield [8] but rather increases serious environmental pollution, including CH4 and N2O emissions in the RR system [9]. Therefore, increasing or maintaining the yield with a low input of N fertilizers has become a critical consideration for ensuring sustainability in RR production. To minimize environmental pollution, China achieved zero growth in using chemical fertilizers by 2020 [10]. For this purpose, N management practices that could sustain high yield and minimize Nr losses needed to be established. Many optimized N management (OPT) strategies can increase the yield and reduce Nr losses in RR systems, for example, special fertilizer for bud promotion [11] and optimal N application using a quadratic equation on yield and N application [12]. Besides N management, water-saving irrigation, such as alternative wetting and drying irrigation, has been found to be a promising option to mitigate environmental Nr losses while reducing irrigation water input in RR fields [9]. However, few studies have been conducted to assess environmental effects under different N applications in the RR cropping system.
Of the many indicators used to assess N management, N-use efficiency (NUE) and N surplus may be helpful in policymaking. The efficiency of all the N inputs transferring to harvested crop N is defined as NUE, and it is consistent with the definition used by Zhang et al. [13]. The difference between N input and harvested N output is defined as N surplus [14,15]. This helps provide guidelines for improvements in nutrient management within a specified boundary [16]. N surplus has been widely used as an indicator for N management by various countries and organizations [13], for example, the mineral accounting system in the Netherlands [17] and intensive farming in Denmark [18]. Several case studies have considered the effects of N surplus analyses in different systems, for example, understanding seasonal N dynamics in the maize–wheat double-cropping system [19] and determining the appropriate N rate and topdressing N ratio in rice–wheat rotation [20]. These studies have contributed to the efficient agricultural N management and helped in reducing Nr losses while maintaining or improving crop yields.
However, few studies have been conducted to assess the rice yield and the environmental load in different Chinese RR planting areas after optimal N application [8,13]. This study collected data from 782 studies on the RR system covering 16 provinces in China to quantify N surplus and Nr losses in the RR system. The aim was (1) to answer which region should be encouraged to develop RR by comparing yields, Nr losses, and NUE in five Chinese RR regions, and (2) to establish a model to simulate the N surplus and Nr losses under OPT for the highest yield, the highest NUE, and the highest grain N uptake.

2. Materials and Methods

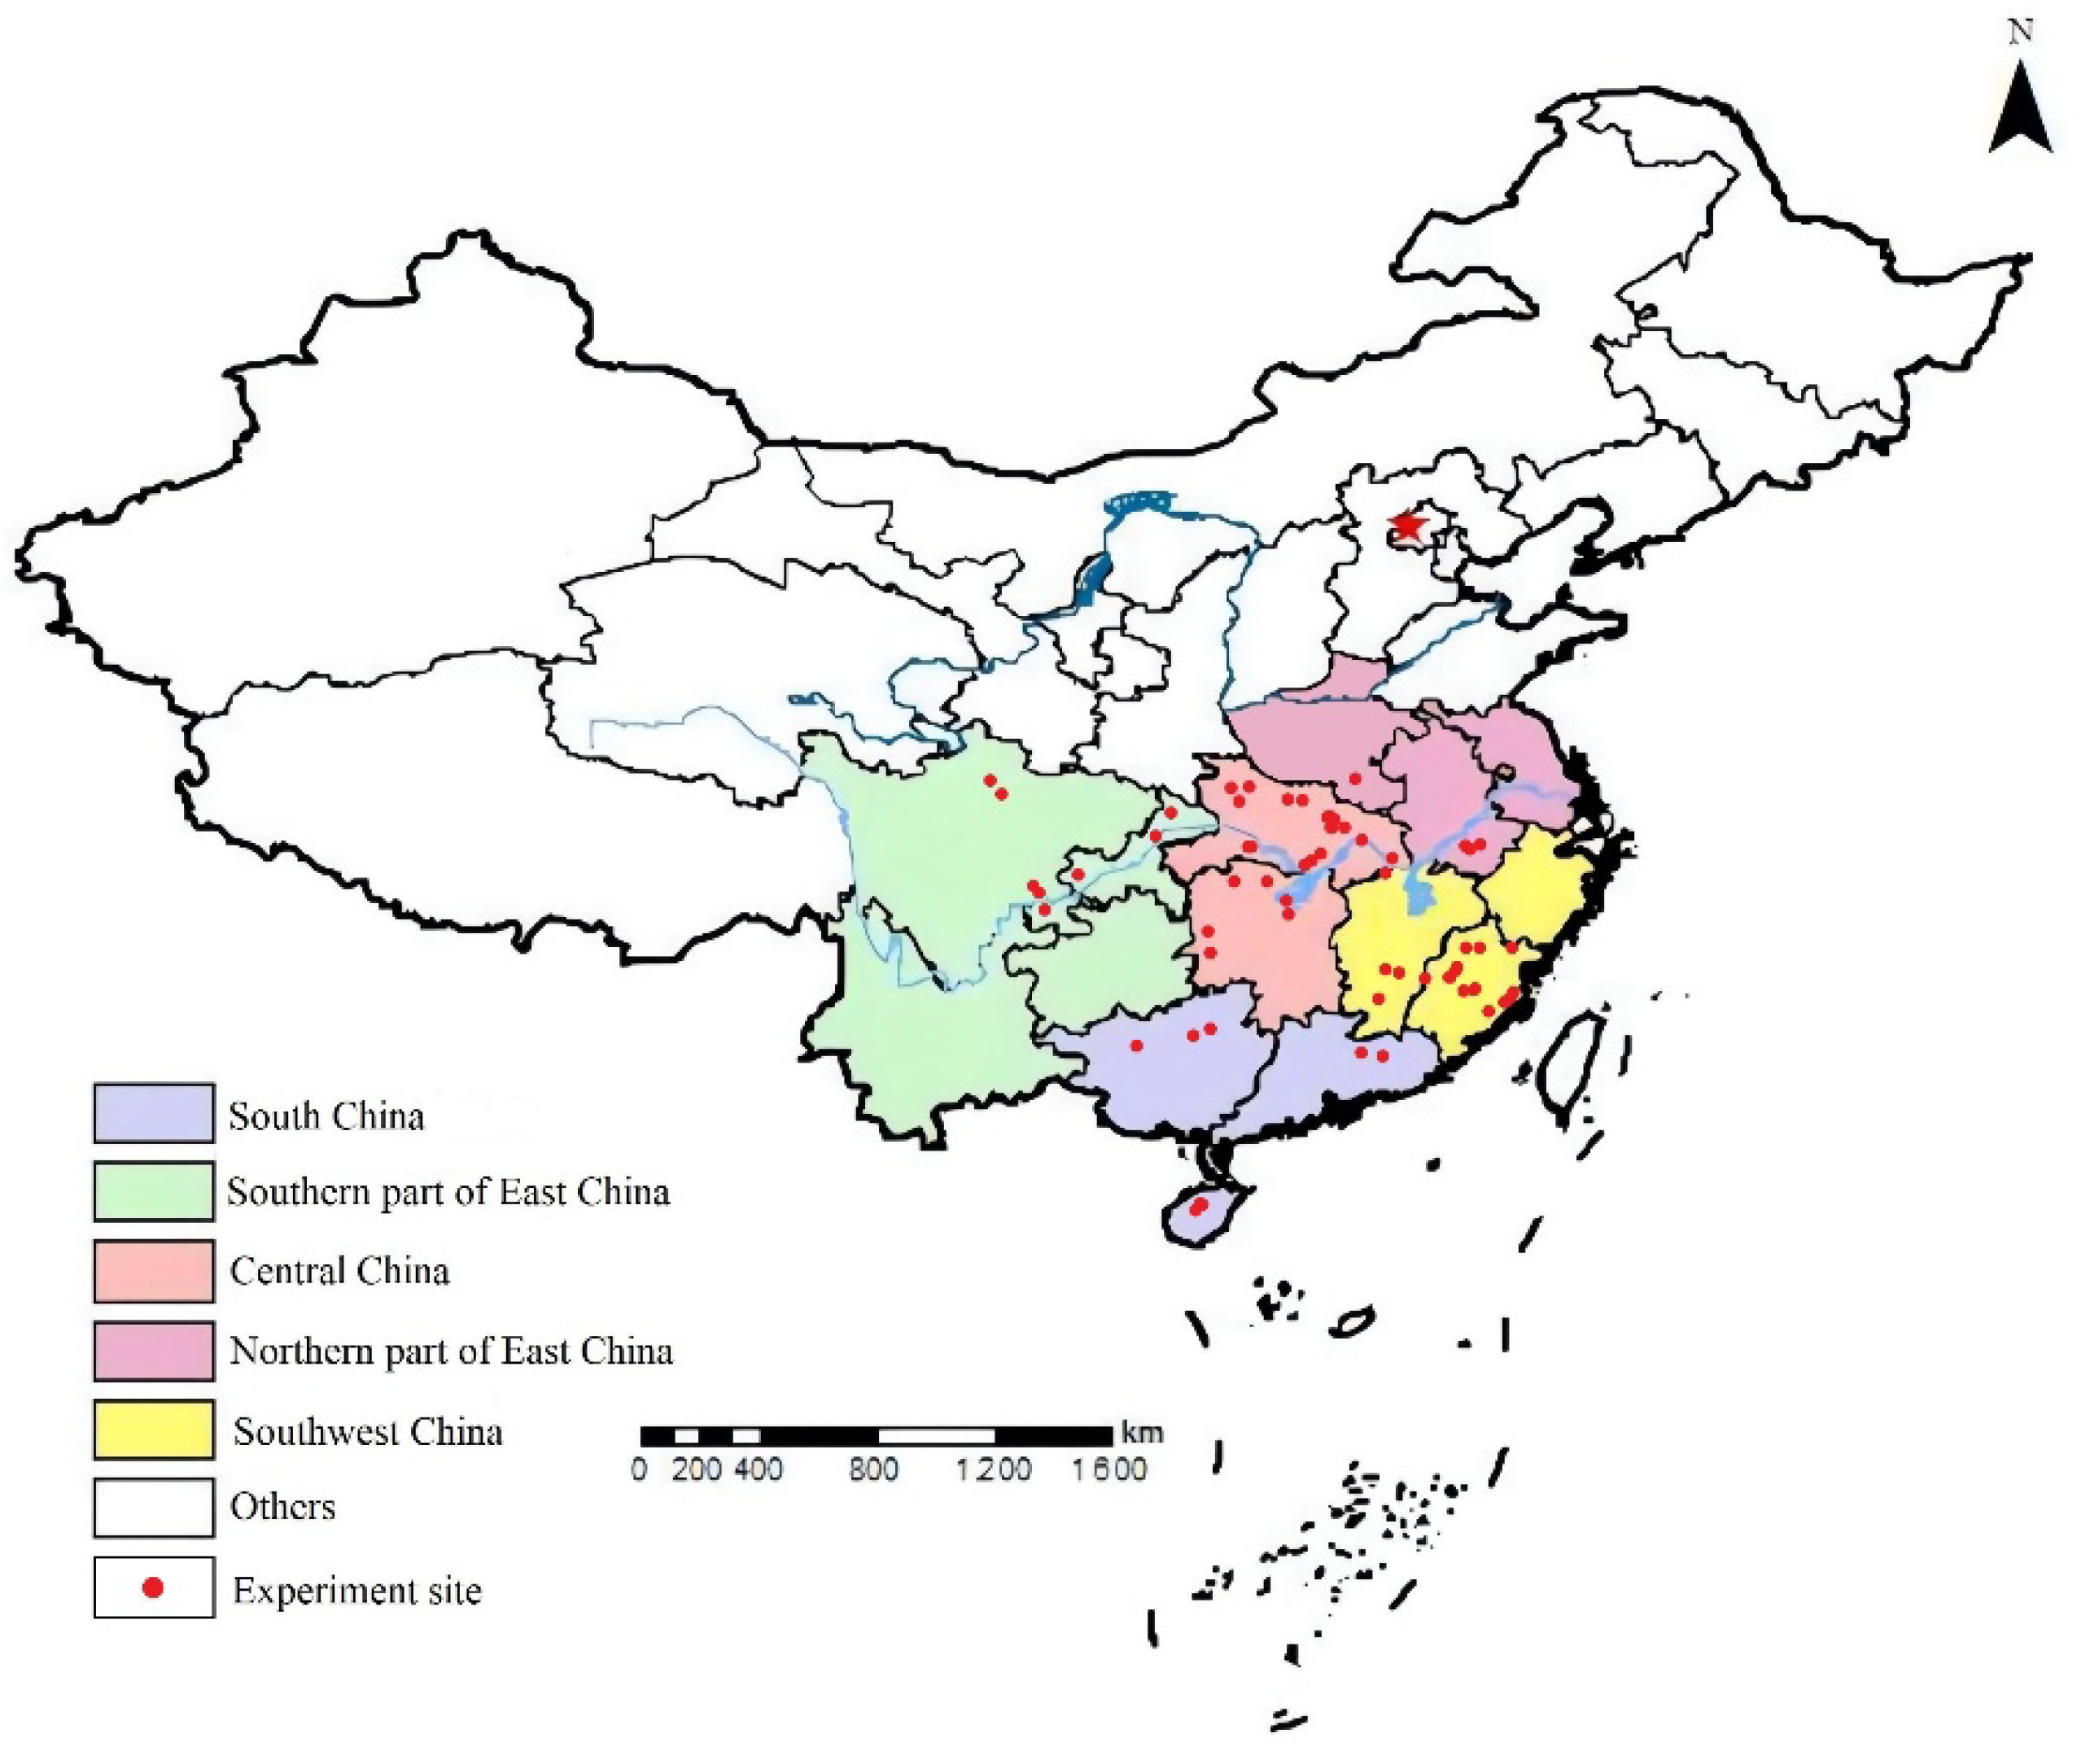
2.1. Main Cropping Regions

According to the requirements of temperature, light, and water for RR growth, the critical meteorological indexes of suitable and unsuitable planting areas of RR were determined using the principal component analysis [21]. Then, the suitable RR planting zones in China were divided into 5 climatic ecological zones and 13 regions (Figure 1 and Table S1 in Supplementary Information). They were named South China (SC), the southern part of East China (SEC), Central China (CC), the northern part of East China (NEC), Southwest China (SW), and Others (Figure 1). For “Others”, no data were available; therefore, these areas, which included Beijing, Tibet, Qinghai, Hong Kong, and Macao, were not included in this study [21].

2.2. Data Source

We searched for peer-reviewed publications published between 2005 and 2020 on RR via Science Direct, Springer Journals, the Web of Science, and the China National Knowledge Infrastructure using the search terms ratoon rice, nitrogen fertilizers, and yield. All studies that met the following criteria were included: (1) the crops in all studies were RR; (2) the start and end years of the experiment were available; (3) the amount of N fertilizer applied to the main crop and the ratoon crop of RR in the experiment was stated; (4) the amount of N absorbed and taken away by crops or the crop yield of the ratoon crop and the main crop was given; and (5) the detailed location of the experiment sites was given. A total of 782 studies fit the criteria and were included in this study, comprising over 72 experiments conducted in 16 provinces throughout China. If the same data appeared in multiple publications, they were entered into the study only once.

2.3. Data Calculation

2.3.1. Calculation of N-Use Efficiency and N Stored in Soil

The main external N inputs to the RR system in China included fertilizer N, atmospheric N deposition, biological N fixation, seed N, and N from irrigation water (irrigation N). The internal N cycle of the soil and a small amount of N input were not taken into account (straw returning to the field, soil organic matter humification, and mineralization). At the same time, NUE and N surplus were calculated. Since 2000, under the strict prohibition of the government and economic incentives, it has been assumed that all the straw returns to the soil [13,22,23]. Irrigation N has been considered for N surplus calculation in some studies, e.g., in greenhouse vegetables in the North China Plain (water-deficient area) [24]. However, RR is usually planted in an area with abundant rain (Figure 1 [21]), where both the amount of irrigation water and its N content are minor. Thus, irrigation N was not considered in this study.
The N partial factor productivity (PFPN) and NUE were calculated using the following equation [13,25]:
PFPN = Yield N fer
NUE = N har N fer + N dep + N fix
where Nhar is the grain N uptake, kg ha−1; N uptake by grain was calculated by multiplying yield (kg ha−1) by the N content of the grain (%). Nfer, Ndep, and Nfix represent the N input from fertilization, atmospheric deposition, and non-symbiotic N fixation, respectively (kg ha−1). Details about the calculation of Nhar, Ndep, and Nfix can be found in Tables S2–S4.
NΔsoil was calculated as follows [26,27]:
N Δ soil = N fer + N dep + N fix + N seedling   N har N nit N vol N lea N run
where NΔsoil is the N stored in soil kg ha−1. Nfer, Ndep, Nfix, and Nseeding represent the N input from fertilization, atmospheric deposition, biological fixation, and seedlings, respectively (kg ha−1). Nhar is the N in harvested grain, kg ha−1. Nvol, Nlea, and Nrun represent the N output from NH3 volatilization, N leaching, and N runoff, respectively (kg ha−1). Nnit represents the N output from denitrification losses, which was estimated to be 21.6% of N fertilizer based on the mean value calculated from the published literature [28,29,30,31]. Details about the calculation of Nseeding, Nvol, Nlea, and Nrun can be found in Tables S3 and S4.

2.3.2. Calculation of Nr Losses and N Surplus

Nr losses include NH3 volatilization, N2O, nitrate leaching, and runoff, but N2 is not harmful to the environment, and, hence, it was not counted in the Nr losses [13] where crop seeds absorb only a small proportion of the total nutrient input [32]. Nr losses and N surplus were calculated as follows:
N r   losses   =   N nit + N vol + N lea + N run
N sur =   N fer + N dep + N fix N har
where Nnit, Nvol, Nlea, and Nrun represent the N input from nitrification or denitrification loss, NH3 volatilization, N leaching, and N runoff, respectively (kg ha−1). Nfer, Ndep, Nfix, and Nhar represent the N input from fertilization, atmospheric deposition, non-symbiotic N fixation, and grain N uptake, respectively (kg ha−1), and grain N uptake was calculated by multiplying the dry matter content (kg ha−1) by the N content of the grain (%). Details about the calculation of N uptake can be found in Table S2.

2.3.3. Optimized N Based on the Highest Yield, Highest NUE, and Grain N Uptake

Grain N uptake was calculated by multiplying the dry matter content (kg ha−1) by the N content of the grain (%) [33]. Table S2 presents the details about the calculation of N uptake. The effect of N application on crop yield is divided into two stages: one is yield increase and the other is yield stabilization or even reduction with the increased N fertilization rate [34]. The diminishing marginal effect of N on yield can be observed empirically, which is mainly because of the cumulative effect of various physiological processes during plant growth [35]. Thus, a quadratic model was used to calculate the optimal N applications [36]. The optimal N application was calculated when the inflection point of the curve was met, following which the maximum yield was obtained. This method was used to calculate the optimal N application under the highest NUE (Table S6) and grain N uptake (Table S7) [33]. Therefore, the optimal N applications for the highest yield, the highest NUE, and the highest grain N uptake were defined as OPT-yield, OPT-NUE, and OPT-N uptake in this study, respectively. The un-optimized N management was defined as Un-OPT. To make the N application more in line with farmers’ field management, outliers that exceeded three times of the average value were eliminated.

2.3.4. Data Analysis

Excel 2010 (Microsoft., Redmond, WA, USA) was used for data processing. SPSS 26.0 (IBM Corp., Chicago, IL, USA) was used for one-way ANOVA, and Arc Gis 10.0 (ESRI Inc., Redlands, CA, USA) and Excel 2010 was used for drawing.

3. Results

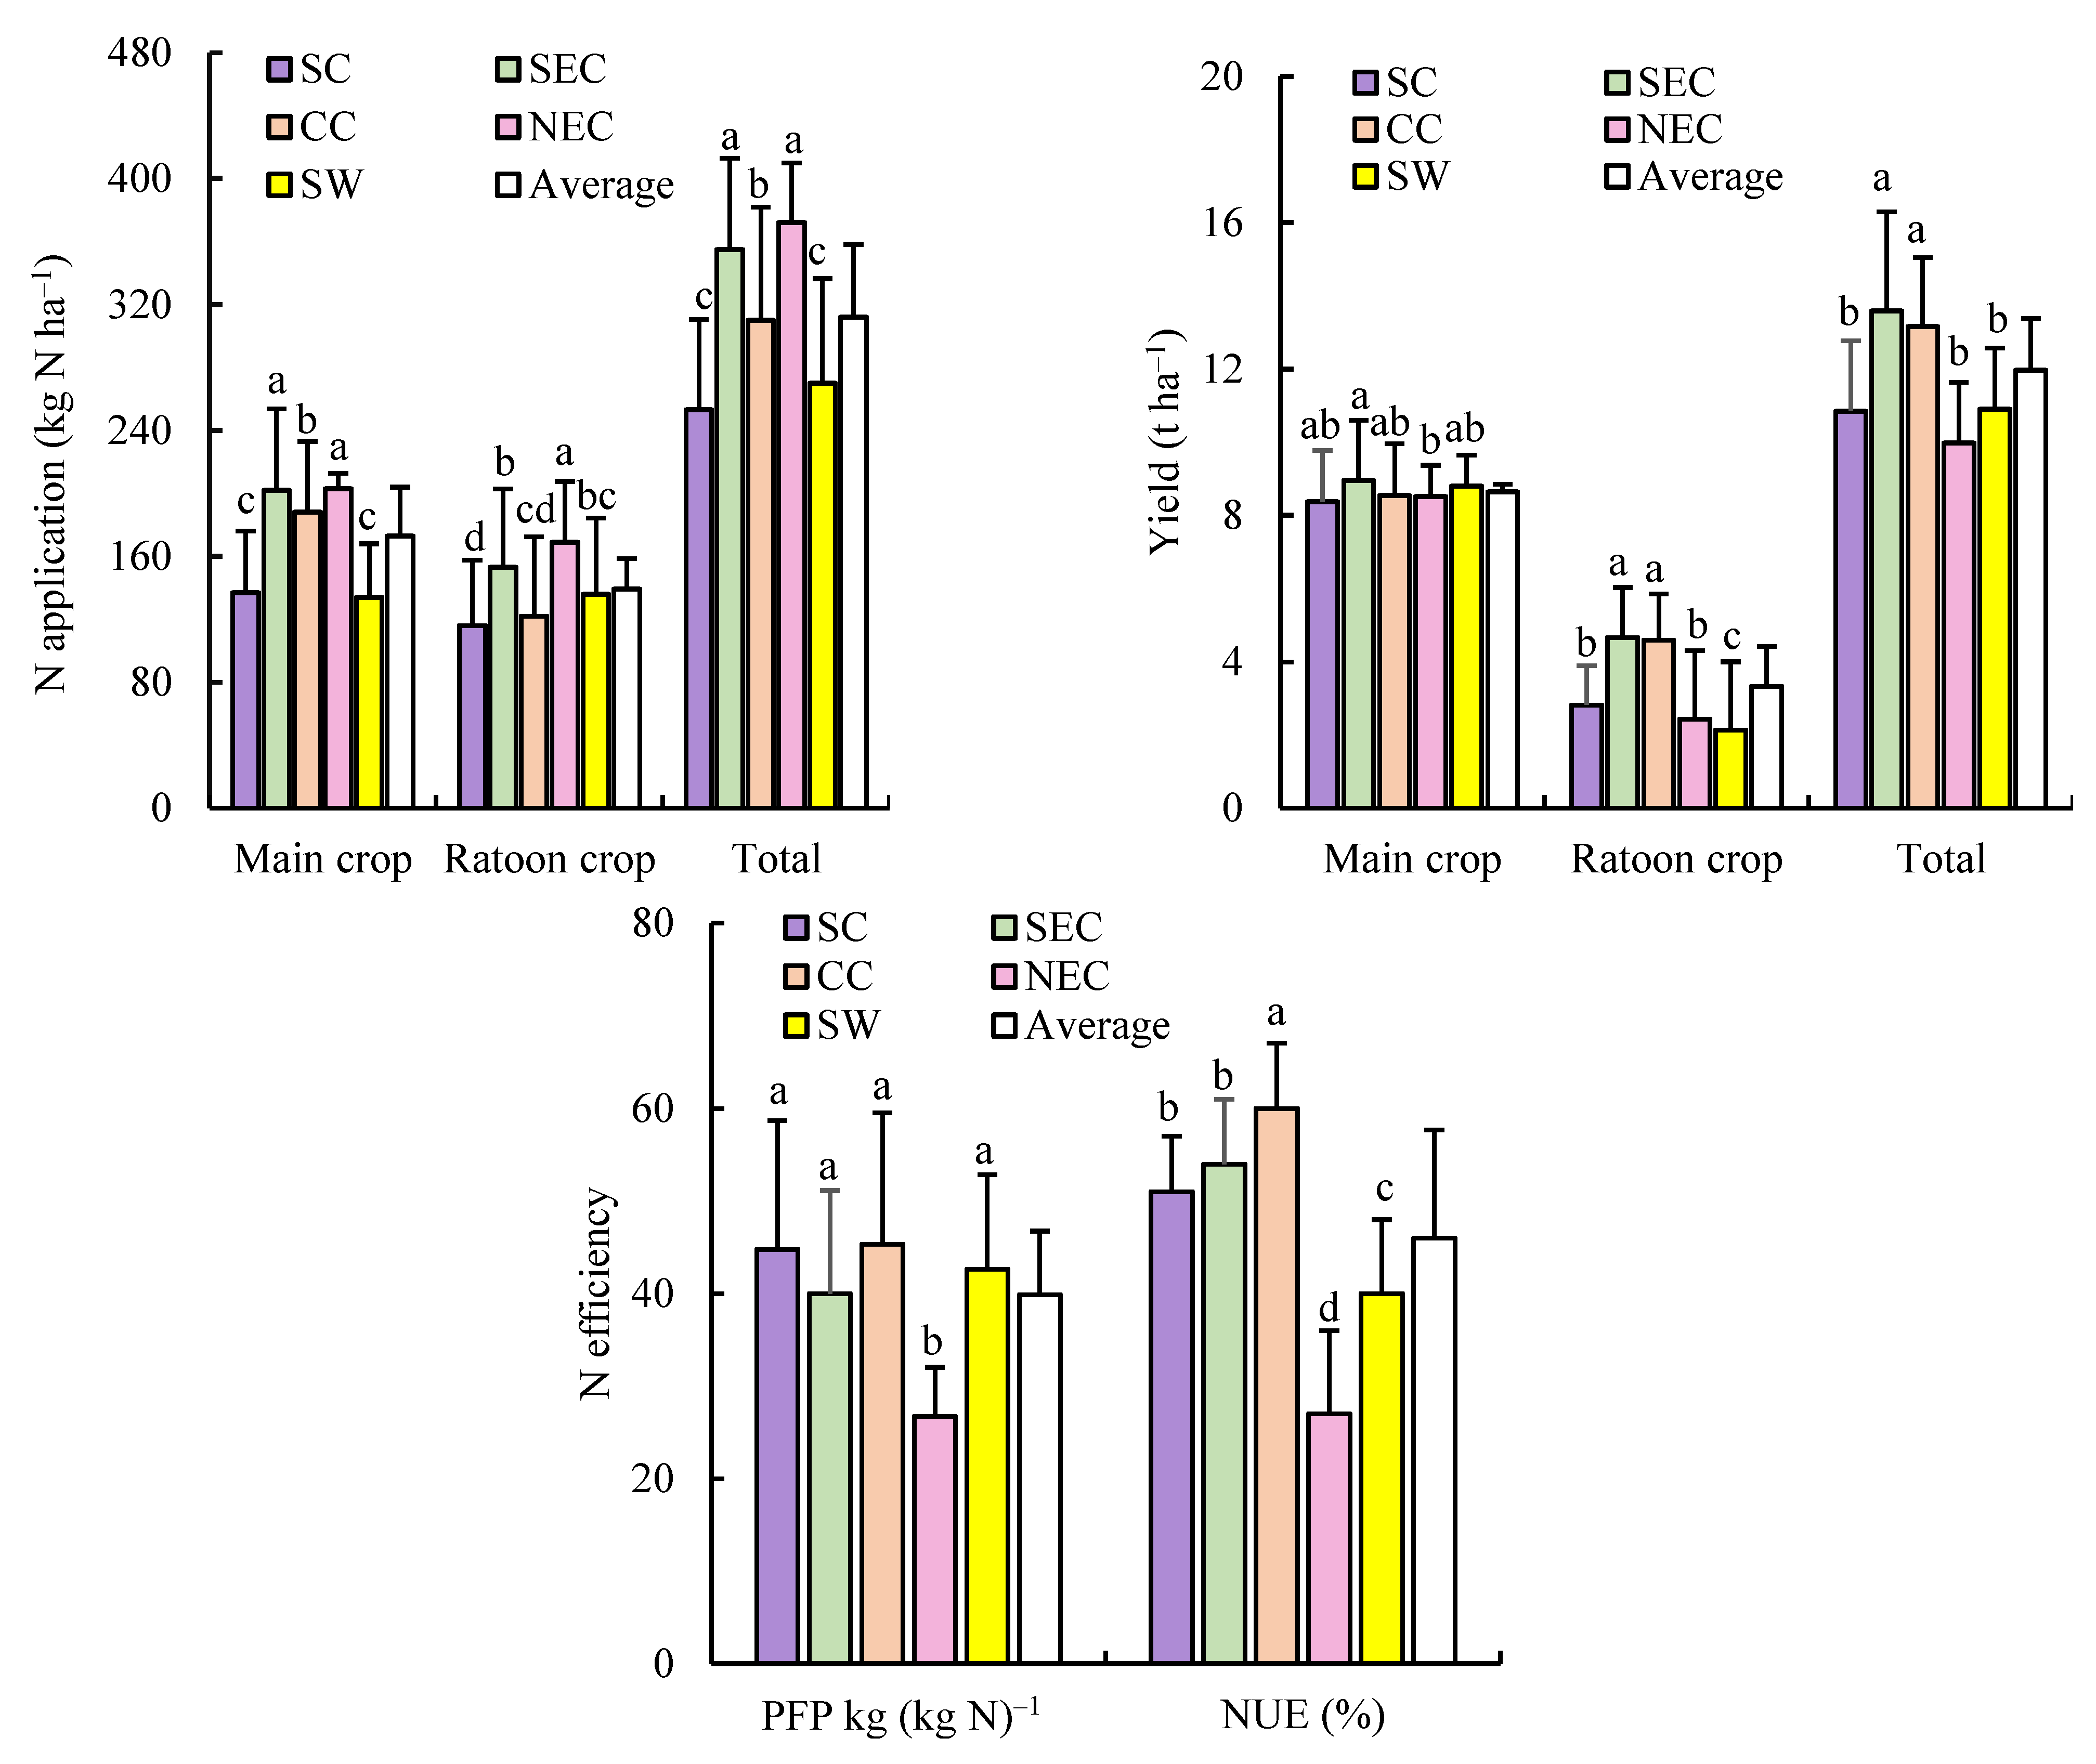
3.1. Comparison of N Application, Yields, and NUE in Different Regions

The results show that N application to the main crop was the highest in SEC (Figure 2). N application to the ratoon crop was the highest in NEC, indicating that a large amount of N fertilizer was used to obtain a high yield. The yield of the main crop in SEC was the highest (8.95 t ha−1), and the yields of the ratoon crop in SEC and CC (4.66 and 4.60 t ha−1) were higher than those in other regions (p < 0.05) (Figure 2). Total yield was defined as the sum of the yields of the main crop and the ratoon crop. The total yields in SEC and CC were significantly higher than those in SC, NEC, and SW, and the total yield in NEC was the lowest. The PFPN was the lowest in NEC, and the NUE in CC was 60%, which was 11−122% higher than that in the other four regions (Figure 2).

3.2. N Stored in the Soil in Different Regions

N fertilizer is the main source of N input. The highest amount of N fertilizer was used in NEC, followed by SEC (Table 1). CC and NEC had the largest N deposition. Grain N in CC accounted for 60.81% of the total N output, while that in NEC accounted for only 43.80%. Besides grain N, NEC had the largest denitrification N loss and ammonia volatilization. SEC had the largest N output due to the largest crop uptake (57.21%). The NEC region showed the highest Nr losses, and the SC region showed the lowest Nr losses. Apparent N stored in the soil (NΔsoil) of SE, SEC, and CC was 20, 24, and 12 kg N ha−1, respectively, while that of NEC and SW was 131 and 82 kg N ha−1, respectively. The results indicate that the N input was close to the N output in planting areas, such as SE, SEC, and CC.

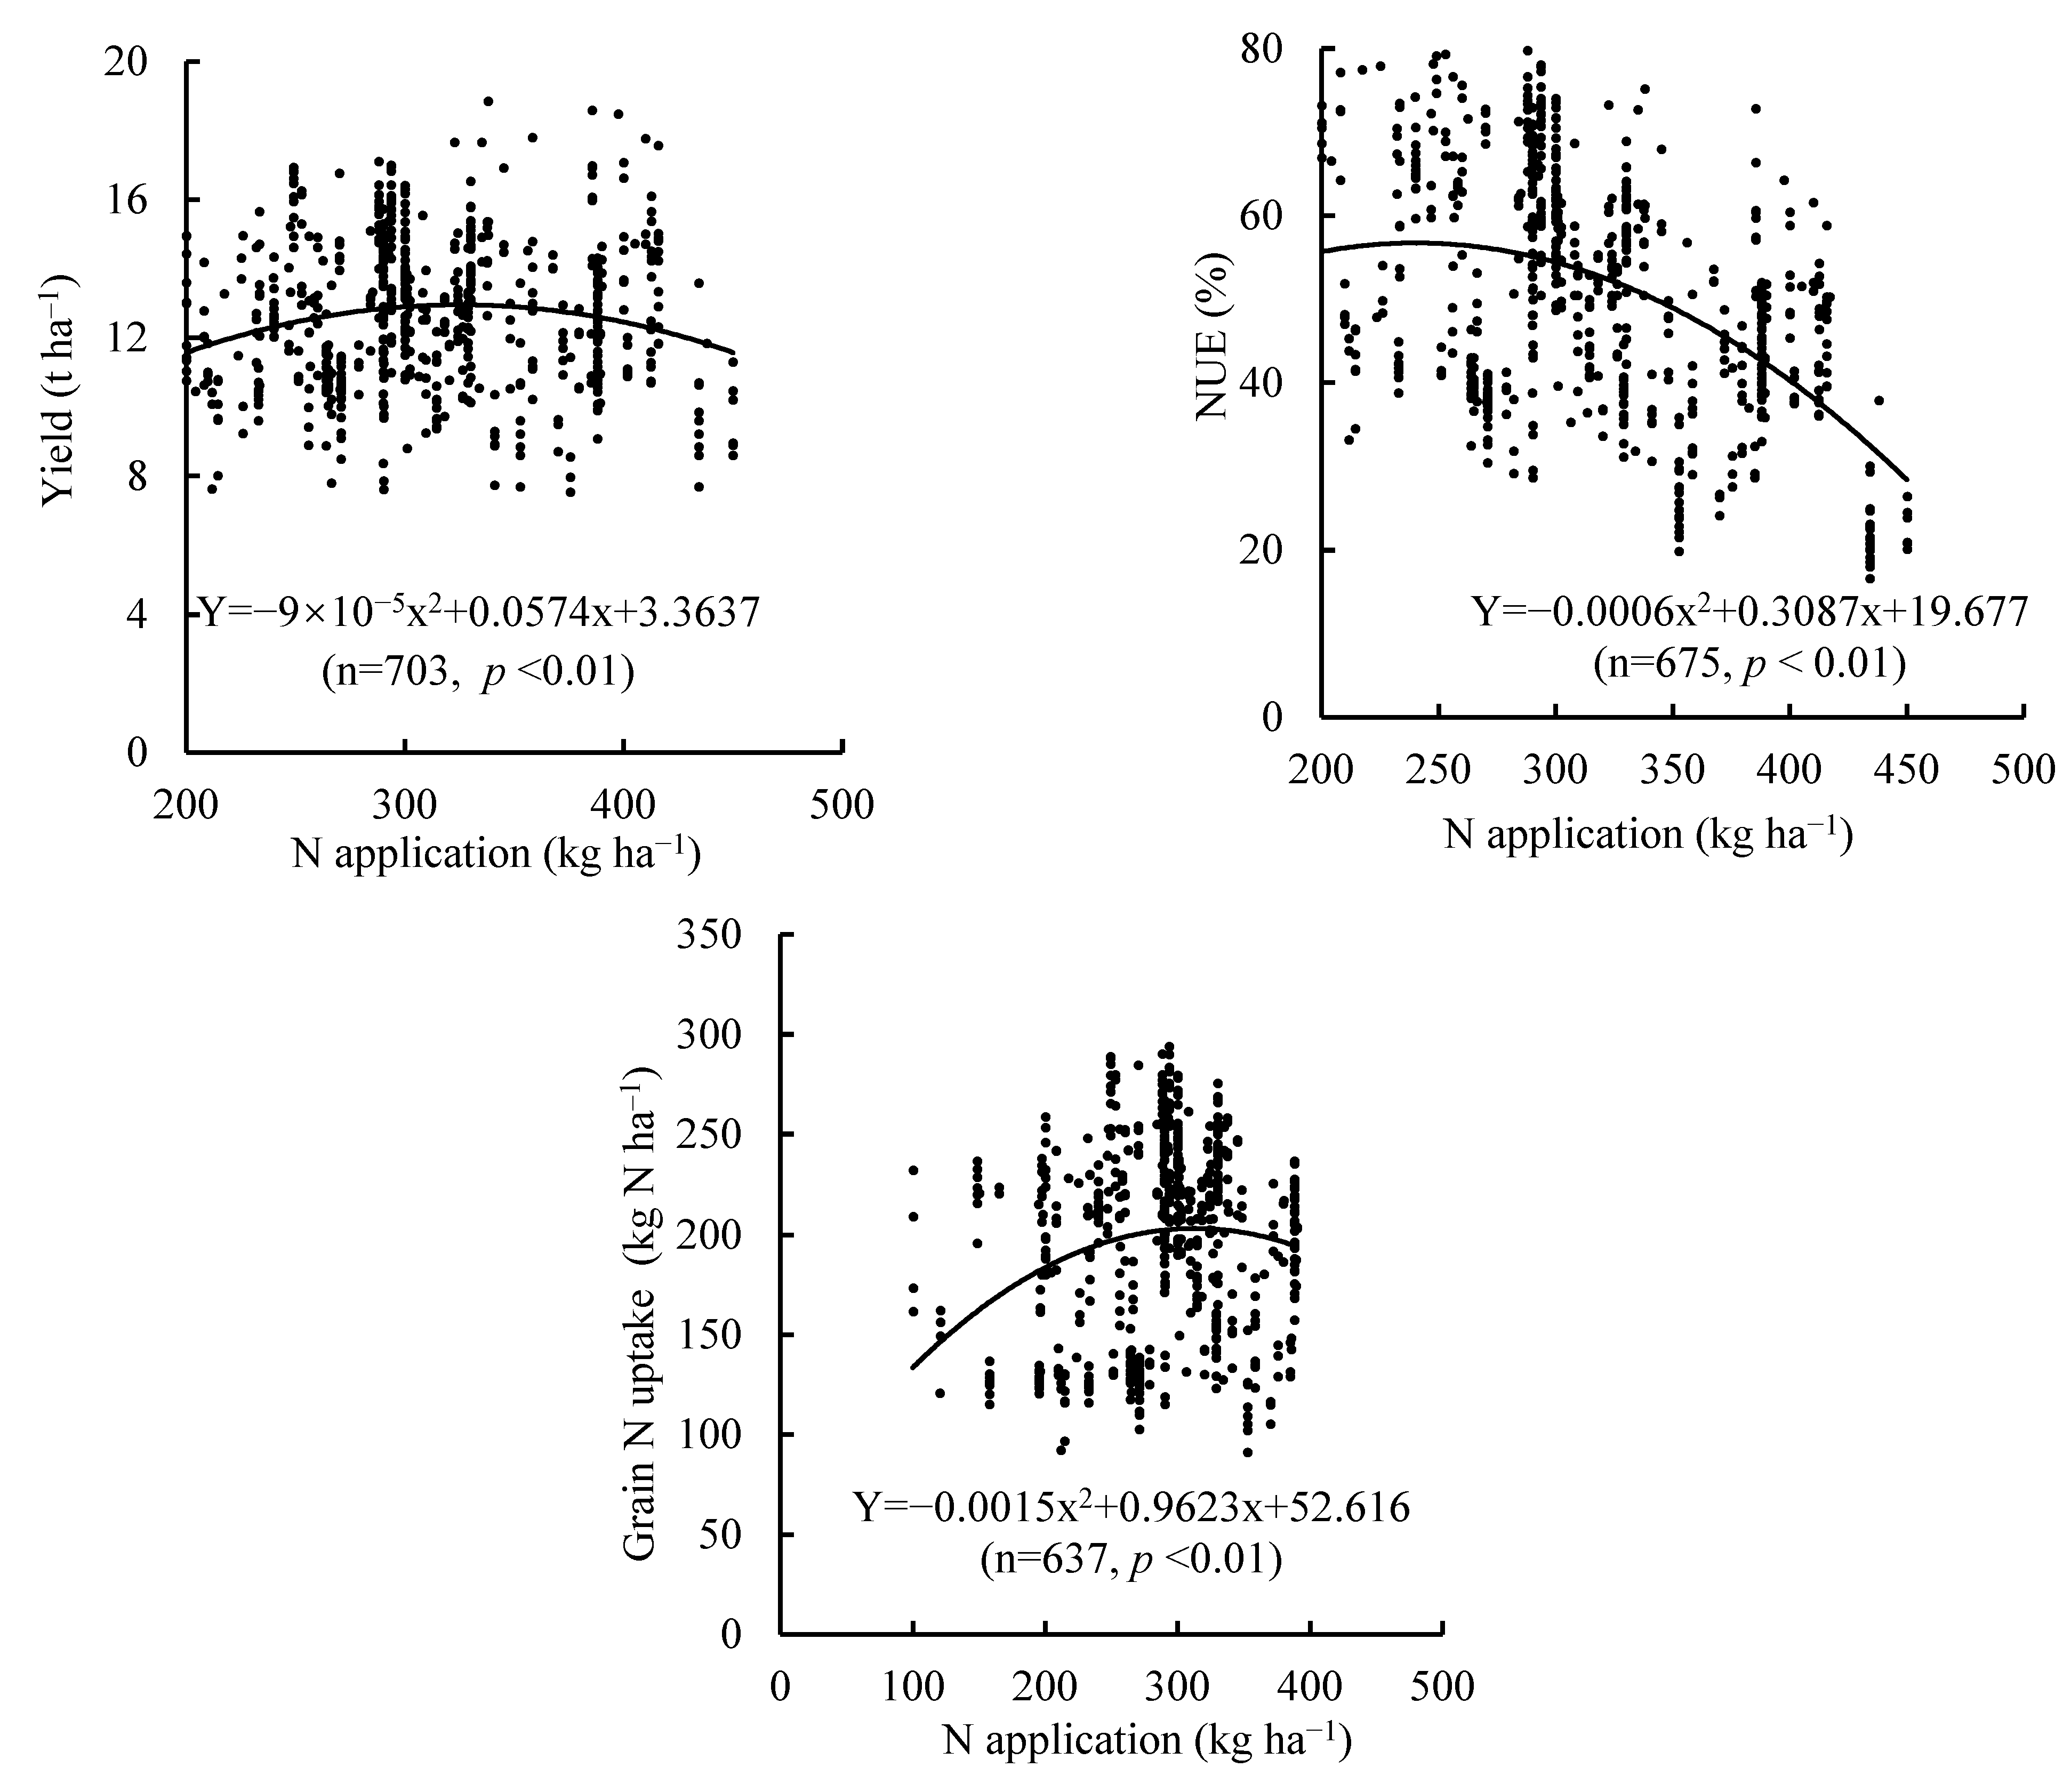
3.3. Correlation between N Application and Yield, NUE, and Grain N Uptake

As shown in Figure 3, the results indicate that the yield was significantly related to N application. When other conditions were constant, the yield first increased and then gradually decreased with the increased N application, with a turning point (the optimal N application). The equation Y = −9 × 10−5x2 + 0.0574x + 3.3637 (p < 0.01) can express the relationship between yield and N application. Therefore, the RR yield attained the highest point (12.87 t ha−1) when the N application rate was 319 kg ha−1. Below a specific N application rate, NUE decreased when the N application rate exceeded 257 kg N ha−1 based on the relationship equation between NUE and N application (Y = −0.0006x2 + 0.3087x + 19.677, p < 0.01). Therefore, NUE reached the highest point (59%) when the N application rate was 257 kg ha−1. Grain N uptake generally increased with N application (Figure 2). Generally, grain N uptake showed a significant correlation with N application, which could be described using a quadratic equation (Y = −0.0015x2 + 0.9623x + 52.616, p < 0.01). Moreover, the yield, NUE, and grain N uptake demonstrated a close relationship with N application in five typical Chinese RR regions (Tables S5–S7).

3.4. Performance under Optimized N Managements (OPTs) and Un-OPT Practice

The results show that the optimal N application was different in the five regions under the same indicator (Table 2). The yields of OPT and Un-OPT were 11.08–13.51 t ha−1 and 9.98–13.16 t ha−1, respectively. The RR yield of OPT was 11% higher than that of Un-OPT. Compared with Un-OPT, the N surpluses of SEC, CC, NEC, and SW were reduced by 2–72 kg N ha−1 and 27–98 kg N ha−1 under OPT-yield and OPT-N uptake, respectively. After OPT-NUE, NUE was 22% higher than that of Un-OPT, and N surplus and Nr losses were also reduced in the five regions. Expressing Nr losses on a yield-scaled basis provides an indication of Nr losses per ton of grain yield. The average yield-scaled Nr losses for Un-OPT (12.35 kg N t−1) were 6%, 24%, and 4% higher than those for OPT-yield, OPT-NUE, and OPT-N uptake, respectively.

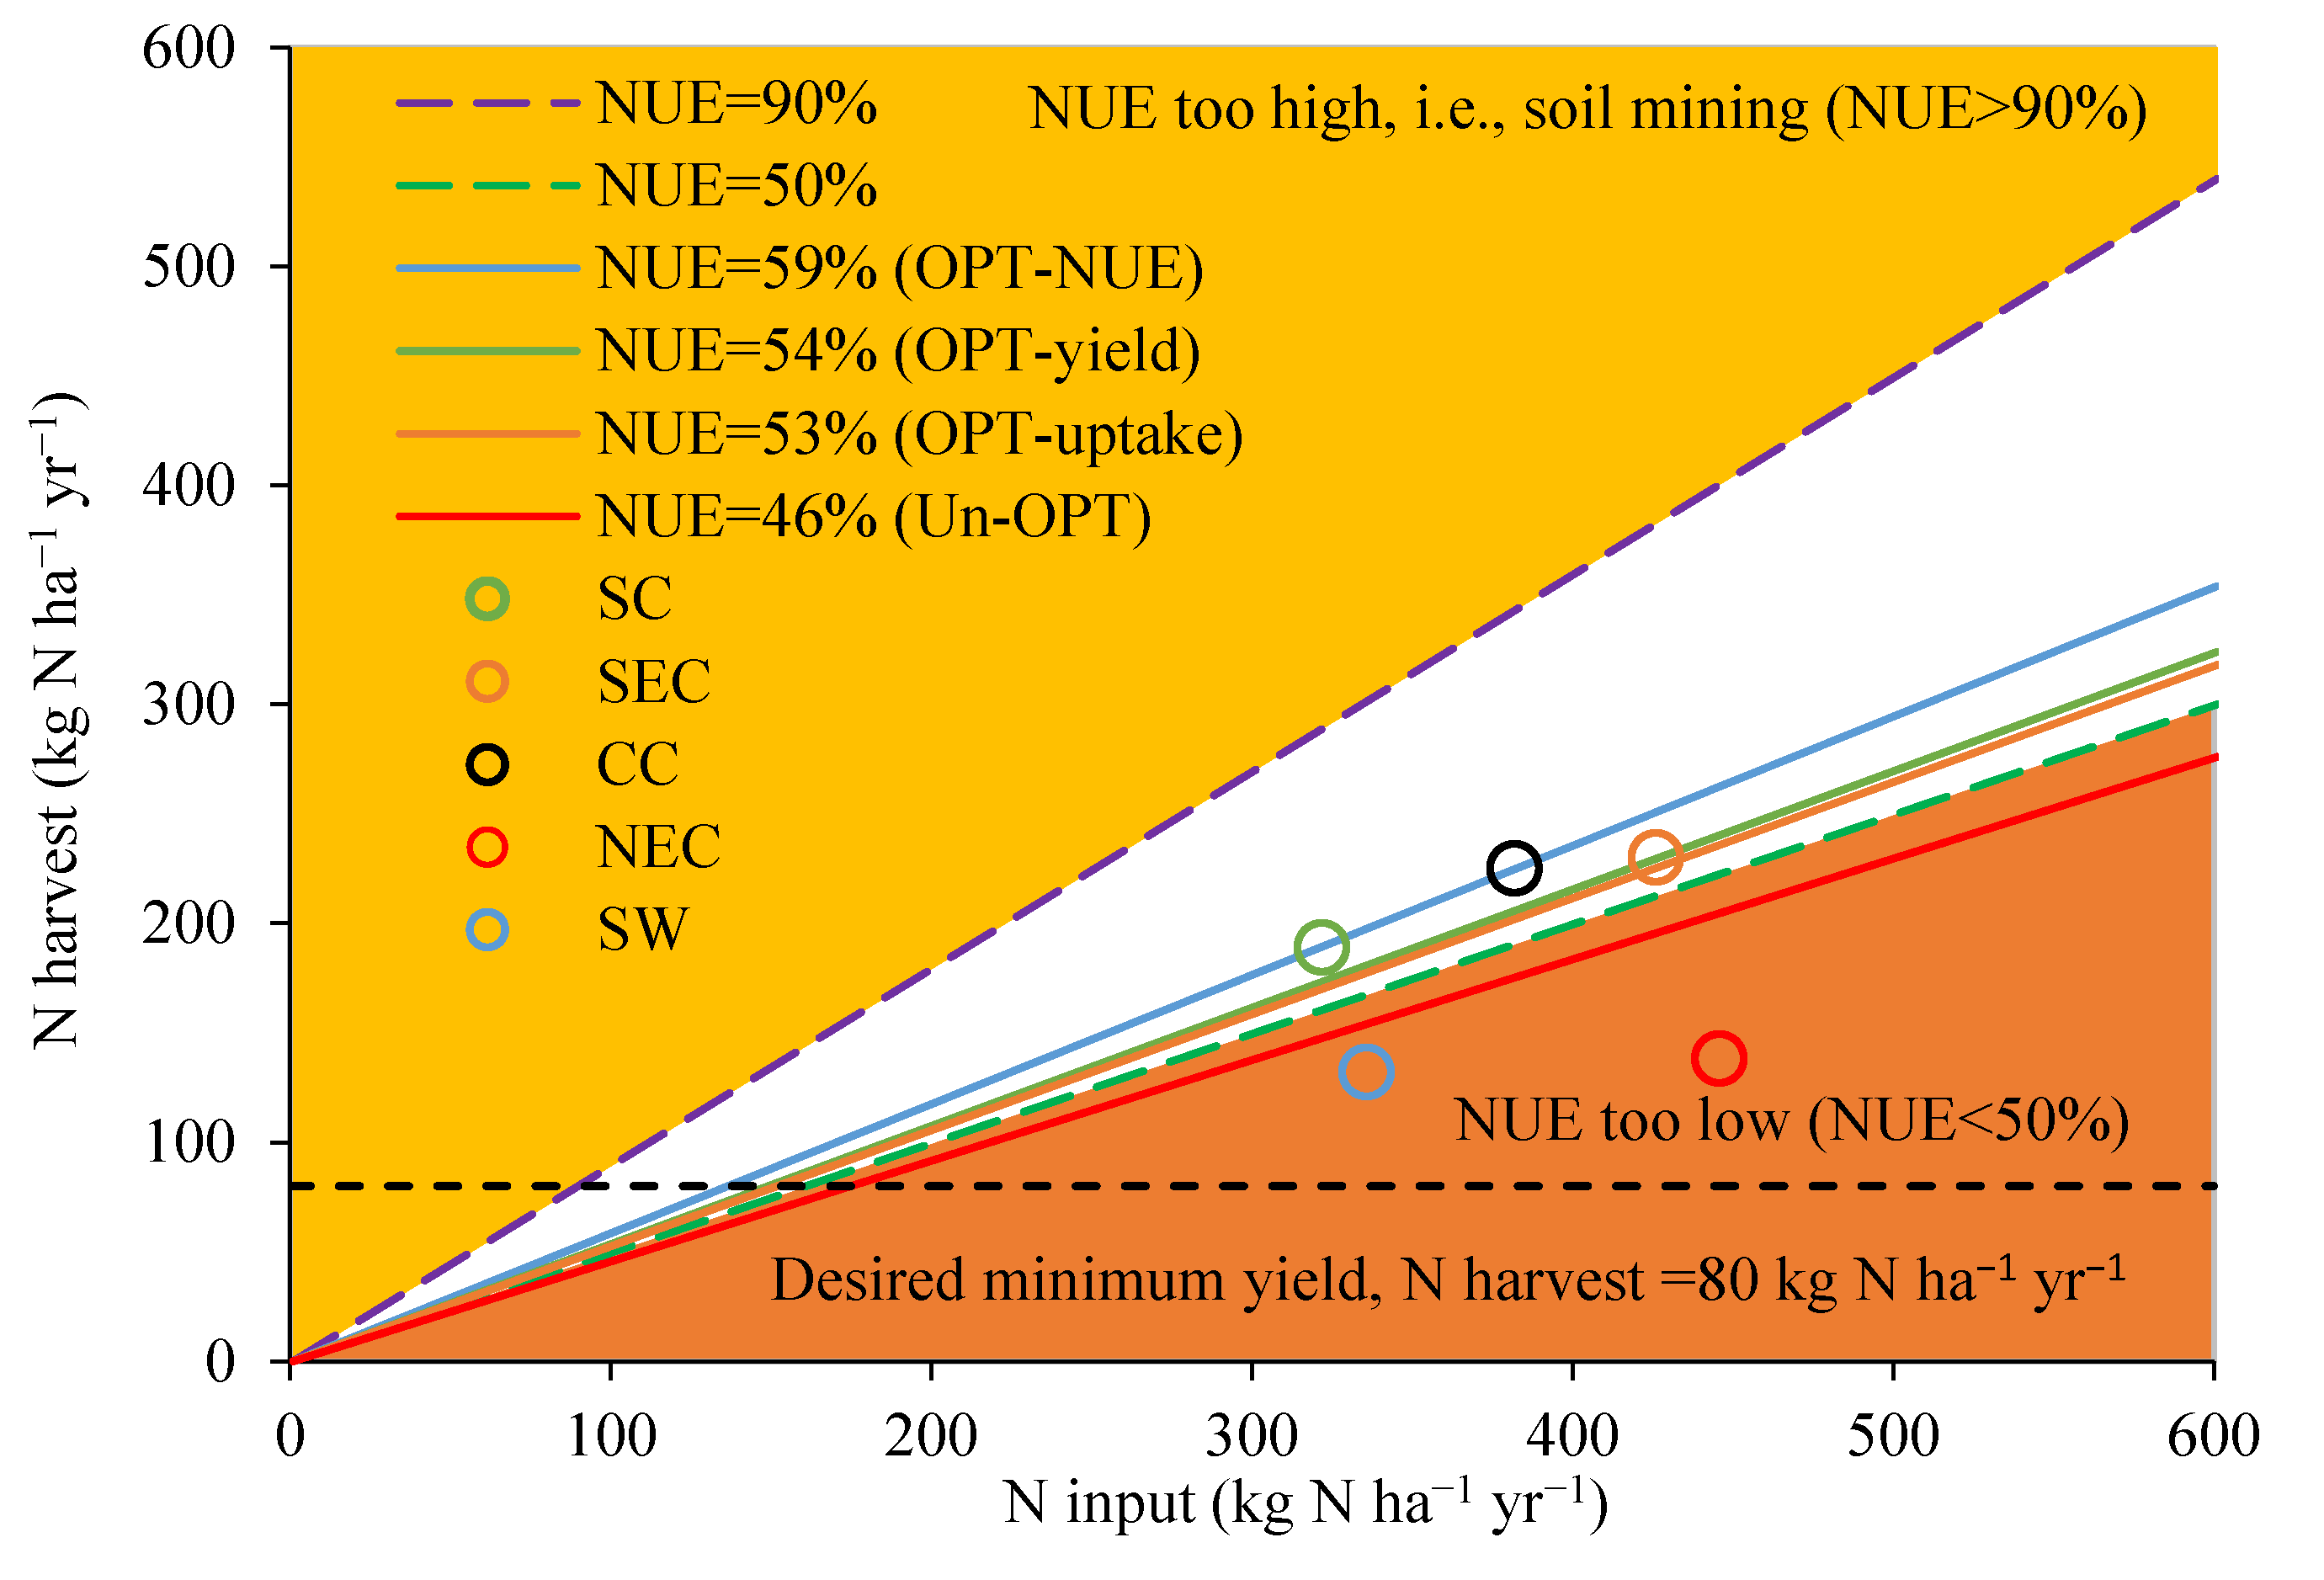
3.5. Assessment of N Management

The N input and harvested N of RR in China under OPT-yield, OPT-NUE, OPT-uptake, and Un-OPT are shown in Figure 4, and the desirable ranges for NUE (50–90%) that were suggested by the EU Nitrogen Expert Panel [35] are also shown in Figure 4. The N inputs of SEC and NEC under Un-OPT were exceeded by 400 kg N ha−1yr−1, but the N harvest in SEC was 40% higher than that in NEC. The N harvest of RR under OPT-yield, OPT-NUE, OPT-uptake, and Un-OPT were above the minimum productivity level (80 kg N ha−1 yr−1) suggested by the EU Nitrogen Expert Panel [35], especially for the N harvest values in CC, which were much higher. The NUE values for OPT-yield, OPT-NUE, and OPT-N uptake were 17%, 28%, and 15% higher than those for Un-OPT, respectively, and the NUE values of RR under OPT-yield and OPT-uptake were within the desirable ranges (50–90%), showing that a high yield (high N harvest) was obtained together with a desirable NUE level.

4. Discussion

4.1. Yield, NUE, Nr Losses, and N Surplus in Main RR Production Areas in China

Dense planting has been recommended as a promising practice to achieve higher grain yields [38,39]. Fujian is the main RR planting area in SEC. SEC had the highest yield (13.59 t ha−1) at a higher planting density (27.15 × 10⁴ hills ha−1), followed by CC (13.16 t ha−1; 25.33 × 10⁴ hills ha−1) (Table S8), indicating that SEC and CC were dominant in RR-growing areas.
There are several reasons for a low yield, and the specific reason in different planting areas was different, i.e., Sichuan, Guangxi, and Anhui provinces. The largest planting area of RR is Sichuan province in China [39], but it had a low RR yield (10.91 t ha −1). The reasons for this are as follows: (i) the altitude in Sichuan rice planting areas is 200–800 m [40], and RR yield decreased when the altitude exceeded 350 m [41]; (ii) the average planting density was 21.65 × 10⁴ hills ha1 (Table S8), which resulted in low effective panicles and RR yield [39]; (iii) a high incidence of rice disease (e.g., sheath blight) decreased RR yield [39]. The low RR yield in Guangxi province was mainly caused by the frequently high temperature [42]. In Anhui province, rainstorms, floods, drought, hail, and typhoon disasters are frequent, causing serious losses to agricultural production [43].
Nr losses in the five regions ranged from 113 to 177 kg N ha−1 (average 146 kg N ha−1). SC had the lowest Nr losses (113 kg N ha−1), and NEC had the highest Nr losses (177 kg N ha−1) (Table 1), which are higher than those of double-season rice under OPT in the Taihu region in China (102 kg N ha−1) in the study conducted by Ju et al. [44]. The NUE of RR ranged from 27% to 60% (Figure 2), and the highest NUE was in CC (60%), which is close to that of the Chinese double-cropping system (68%) under OPT proposed by Zhang et al. [13]. Moreover, the average NUE was 47%, which is lower than the average predicted NUE (60%) of rice for 2050 [45], indicating that N application needs to be optimized for RR.

4.2. NUE and N Surplus under Three Optimal N Application Rates

Many methods (i.e., integrated soil–crop system management [46], response curves of N application and yield [47], and N balance management [48]) were used to determine the best N application amount, and the most common method was the recommended method based on the effective function of N application [12]. The relationship between yield and N application at specific locations or different scales has been examined in many studies [49,50], which include quadratic equations, quadratic-plus-plateau models, square roots, and exponential equations. The quadratic equation has been the method most commonly used to calculate the optimal N application in China [33,51]. The quadratic model between N application rate and yield (Table S5), NUE (Table S6), and crop N uptake (Table S7) can be established. Then, obvious inflection points and mutation points can be used to determine the optimal N application under different indicators. We can determine the minimum amount of N application needed to ensure a certain yield or gain [12,33,34]. The quadratic model recommended an optimal N application for RR of 319 kg ha−1 in order to obtain the highest yield (12.78 t ha−1) under OPT-yield in this study (Table 2), which is lower than that in the study conducted by Cao et al. [8] (13.67 t ha−1) under the optimal N application rate. This difference is mainly due to the fact that the quadratic model was selected in this study while the linear-plus-plateau model was used in the study of Cao et al. [8]. The theoretical optimal N surplus under the highest yield was 180 kg N ha−1, which is higher than the N surplus benchmark (120 kg N ha−1) determined by Zhang et al. [13]. This difference is mainly due to the fact that the crops researched were different. RR was studied in this study, while all the main Chinese rice-based systems (rice, double rice, rape-rice, and wheat-rice) were used in the study conducted by Zhang et al. [13], and different crops have different N surplus benchmarks. The highest NUE could be achieved with the lowest N application in this study (Table 2), which is consistent with the findings of Zhang et al. [12]. The highest NUE (59%) for Chinese RR estimated in our study was lower than the NUE (64%) for the rice–rice system proposed by Zhang et al. [13]. Crop N uptake was supposed to be an indicator for estimating the N utilization rate [52]. The N application rate under the highest grain N uptake was higher than that under the highest yield and NUE, and this result is similar to that of Zhang et al. [33].
The NUE of RR in China based on different indicators ranges from 53% to 59% (Table 2); this is close to the mean NUE target for 2050 suggested by Zhang et al. [45], in which higher NUE targets were set for rice (60%). N surplus (133–183 kg N ha−1) (Table 3) based on different indicators in this study was higher than the average surplus target of all main grain crops in China (65 kg N ha−1) and the worldwide average value for 2050 (53 kg N ha−1) [45] (Table 3). The biggest differences between our study and that conducted by Zhang et al. [45] was based on data. First, the data of different crops were used in the study conducted by Zhang et al. [45], while the data of only RR in the five main RR regions were used in this study. Second, the data from the Food and Agriculture Organization (FAO) and International Fertilizer Industry Association (IFA) statistical databases were used by Zhang et al. [45], while data from on-farm experiments were obtained in this study (Table 3).

4.3. Policy Suggestions

Farms from some developed countries (e.g., the Netherlands and Europe) have achieved lower Nr losses than those under the fertilization plan [52], suggesting that our N surplus could be further reduced. The amount of N fertilizer needs to be reduced while the yield is maintained or improved in order to achieve the proposed N surplus for RR. The required improvements could be expressed as the full adoption of the “4R” of nutrient stewardship (right source, right rate, right time, and right place) [54]. Enhanced-efficiency fertilizers (e.g., controlled-release urea) can significantly increase rice yields by 26%, and reduce NH3 volatilization (23–62%) and N surface runoff losses (8–58%) [55,56]. The rice nutrient expert system has been used to provide the correct N fertilizer amount based on the yield response of rice in the previous season, and it recommend a more accurate amount of N fertilization for rice [57]. For RR, the N fertilizer used in the first season had a significant effect on the yield of the main crop but little effect on the yield of the ratoon crop [8], while the N fertilizer used for bud promotion and seed promotion had significant effects on the yield of ratoon crops [58]. Therefore, the fertilization time should be precise. The deep placement of urea can better match the N demand of rice plants and effectively minimize NH3 volatilization compared with broadcast [58,59]. New irrigation technology (e.g., dry–wet alternate irrigation) [60] and moldboard plowing with direct seeding [61] have also been found to realize higher yields with lower Nr losses, and they should also be used for RR. In addition, pest, weed, and disease control technologies also help farmers achieve high RR yields, for example, validamycin to eliminate pests (sheath blight) in RR, special herbicides to remove weeds (echinochloa crusgalli) in RR, and isoprothiolane to control disease (rice blast) in RR [21,39].

5. Conclusions

SEC and CC are the dominant regions for RR with higher yields and lower Nr losses. Hence, policy incentives should be implemented in these two regions for food security and environmental protection. Appropriate N surplus (180 kg N ha−1) and NUE (54%) values under OPT-yield can not only increase yield but also reduce Nr losses. The “4R” of nutrient stewardship can be fully adopted to achieve N surplus in different regions under OPT-yield when the sustainable development of RR is encouraged in China.

Supplementary Materials

https://www.mdpi.com/article/10.3390/agriculture12071064/s1. References [13,21,42,43,62,63,64,65,66,67] are cited in the Supplementary Materials. Table S1: Information of zone, province and experiment sites; Table S2: Protein and nitrogen content of grain for ratoon rice in five areas of China; Table S3: Nutrient source (atmospheric deposition, biological fixation of nitrogen and rice seeding) into cropland; Table S4: Models for calculating reactive nitrogen (Nr) loss; Table S5: Relationship between N application and yield for RR in five areas of China; Table S6: Relationship between N application and NUE for RR in five areas of China; Table S7: Relationship between N application and grain N uptake for RR in five areas of China; Table S8: The accumulated temperature and planting density in different province.

Author Contributions

R.H.: conceptualization, methodology, writing—original draft, data curation, and writing—review and editing. Z.D.: validation and supervision. T.L.: conceptualization, methodology, and writing—review and editing. D.Z.: methodology. Y.T.: investigation and software. Y.C.: investigation. J.H.: supervision, funding acquisition, conceptualization, methodology, and validation. All authors have read and agreed to the published version of the manuscript.

Funding

This work is supported by the Engineering Research Center of Ecology and Agricultural Use of Wetland, the Ministry of Education (KF202109), and the Hubei special fund for agricultural science and technology innovation (2018skjcx01).

Institutional Review Board Statement

Not applicable.

Informed Consent Statement

Not applicable.

Data Availability Statement

The data that support the findings of this study are available from the corresponding author upon reasonable request.

Acknowledgments

We acknowledge the very helpful comments by C. Zhang (College of Tropical Crops, Hainan University) for the revision of this manuscript.

Conflicts of Interest

The authors declare that they have no known competing financial interests or personal relationships that could have appeared to influence the work reported in this paper.

References

  1. Food Agriculture Organization of the United Nations. Food Outlook Biannual Report on Global Food Markets. 2022. Available online: https://www.fao.org/giews/reports/food-outlook/en/ (accessed on 7 July 2022).
  2. Peng, S.; Tang, Q.; Zou, Y. Current status and challenges of rice production in China. Plant Prod. Sci. 2008, 12, 3–8. [Google Scholar] [CrossRef] [Green Version]
  3. Liu, K.; Qin, J.; Zhang, B.; Zhao, Y. Physiological traits, yields and nitrogen translocation of ratoon rice in response to differ-ent cultivations and planting periods. Afr. J. Agric. Res. 2012, 7, 2539–2545. [Google Scholar] [CrossRef]
  4. Yuan, S.; Cassman, K.G.; Huang, J.; Peng, S.; Grassini, P. Can ratoon cropping improve resource use efficiencies and profit-ability of rice in central China? Field Crops Res. 2019, 234, 66–72. [Google Scholar] [CrossRef]
  5. Grafton, R.Q.; Williams, J.; Jiang, Q. Food and water gaps to 2050: Preliminary results from the global food and water system (GFWS) platform. Food Secur. 2015, 7, 209–220. [Google Scholar] [CrossRef] [Green Version]
  6. National Bureau of Statics. 2021. Available online: https://data.stats.gov.cn/easyquery.htm?cn=C01 (accessed on 7 July 2022).
  7. International Fertilizer Industry. 2021. Available online: https://fertilizer.org/public (accessed on 7 July 2022).
  8. Cao, Y.X.; Zhu, J.Q.; Hou, J. Yield gap of ratoon rice and their influence factors in China. Sci. Agric. Sin. 2020, 53, 707–719. [Google Scholar] [CrossRef]
  9. Zhang, L.; Xu, H.Q.; Li, L.L.; Chen, Y.W.; Zheng, H.B.; Tang, Q.Y.; Tang, J.W. Comparative study on CH4 emission from ratoon rice and double-cropping rice fields. Sci. Agric. Sin. 2019, 52, 2101–2113. [Google Scholar]
  10. Jin, S.Q.; Fang, Z. Zero growth of chemical fertilizer and pesticide use: China’s objectives, progress and challenges. J. Resour. Ecol. 2018, 9, 50–58. [Google Scholar] [CrossRef]
  11. Yang, D.; Peng, S.; Zheng, C.; Xiang, H.; Wang, F. Effects of nitrogen fertilization for bud initiation and tiller growth on yield and quality of rice ratoon crop in central China. Field Crops Res. 2021, 272, 108286. [Google Scholar] [CrossRef]
  12. Zhang, Y.T.; Wang, H.Y.; Lei, Q.L.; Zhang, J.Z.; Zhai, L.M.; Ren, T.Z.; Liu, H.B. Recommended methods for optimal nitro-gen application rate. Sci. Agric. Sin. 2018, 51, 117–127. [Google Scholar] [CrossRef]
  13. Zhang, C.; Ju, X.; Powlson, D.; Oenema, O.; Smith, P. Nitrogen surplus benchmarks for controlling n pollution in the main cropping systems of China. Environ. Sci. Technol. 2019, 53, 6678–6687. [Google Scholar] [CrossRef]
  14. Oenema, O.; Kros, H.; Vries, W.D. Approaches and uncertainties in nutrient budgets: Implications for nutrient management and environmental policies. Eur. J. Agron. 2003, 20, 3–16. [Google Scholar] [CrossRef]
  15. Schr Der, J.J.; Scholefield, D.; Cabral, F.; Hofman, G. The effects of nutrient losses from agriculture on ground and surface water quality: The position of science in developing indicators for regulation. Environ. Sci. Policy 2004, 7, 15–23. [Google Scholar] [CrossRef]
  16. Notaris, C.D.; Rasmussen, J.; Sørensen, P.; Olesen, J.E. Nitrogen leaching: A crop rotation perspective on the effect of N surplus, field management and use of catch crops. Agric. Ecosyst. Environ. 2018, 255, 1–11. [Google Scholar] [CrossRef]
  17. Oenema, O.; Van Liere, L.; Schoumans, O. Effects of lowering nitrogen and phosphorus surpluses in agriculture on the quality of groundwater and surface water in the Netherlands. J. Hydrol. 2005, 304, 289–301. [Google Scholar] [CrossRef]
  18. Hansen, B.; Thorling, L.; Dalgaard, T.; Erlandsen, M. Trend reversal of nitrate in Danish groundwater—A reflection of agricultural practices and nitrogen surpluses since 1950. Environ. Sci. Technol. 2011, 45, 228–234. [Google Scholar] [CrossRef]
  19. Hartmann, T.E.; Yue, S.; Schulz, R.; Chen, X.; Zhang, F.; Müller, T. Nitrogen dynamics, apparent mineralization and balance calculations in a maize–wheat double cropping system of the North China Plain. Field Crops Res. 2014, 160, 22–30. [Google Scholar] [CrossRef]
  20. Shi, Z.; Li, D.; Jing, Q.; Cai, J.; Jiang, D.; Cao, W.; Dai, T. Effects of nitrogen applications on soil nitrogen balance and nitro-gen utilization of winter wheat in a rice–wheat rotation. Field Crops Res. 2012, 127, 241–247. [Google Scholar] [CrossRef]
  21. Shi, N.P.; Jiao, S.C. Ratoon Rice Cultivation in China; China Agriculture Press: Beijing, China, 1999. [Google Scholar]
  22. Han, D.; Wiesmeier, M.; Conant, R.T.; Kühnel, A.; Sun, Z.; Knabner, I.K.; Hou, R.; Cong, P.; Liang, R.; Ouyang, Z. Large soil organic carbon increase due to improved agronomic management in the North China Plain from 1980s to 2010s. Glob. Chang. Biol. 2018, 24, 987–1000. [Google Scholar] [CrossRef]
  23. Zhao, Y.; Wang, M.; Hu, S.; Zhang, X.; Shi, X. Economics- and policy-driven organic carbon input enhancement dominates soil organic carbon accumulation in Chinese croplands. Proc. Natl. Acad. Sci. USA 2018, 115, 4045. [Google Scholar] [CrossRef] [Green Version]
  24. Ju, X.T.; Kou, C.L.; Zhang, F.S.; Christie, P. Nitrogen balance and groundwater nitrate contamination: Comparison among three intensive cropping systems on the North China Plain. Environ. Pollut. 2006, 143, 117–125. [Google Scholar] [CrossRef] [Green Version]
  25. Liu, X.Y.; He, P.; Jin, J.Y.; Zhou, W.; Sulewski, G.; Phillips, S. Yield gaps, indigenous nutrient supply, and nutrient use efficien-cy of wheat in China. Agron. J. 2011, 103, 1452–1463. [Google Scholar] [CrossRef] [Green Version]
  26. Ding, W.; Lei, H.; Xu, C.; Ke, H.; Li, H. Characteristics and spatial distribution of apparent nitrogen balance in the green-house vegetable cropping system in China. J. Agric. Resour. Environ. 2020, 37, 353–360. [Google Scholar] [CrossRef]
  27. Wang, J.G.; Lin, S.; Li, B.G. Nitrogen cycling and management strategies in Chinese agriculture. Sci. Agric. Sin. 2016, 49, 503–517. [Google Scholar] [CrossRef]
  28. Zhao, X.; Zhou, Y.; Wang, S.; Xing, G.; Shi, W.; Xu, R.; Zhu, Z. Nitrogen balance in a highly fertilized rice–wheat double-cropping system in southern China. Soil Sci. Soc. Am. J. 2012, 76, 1068. [Google Scholar] [CrossRef]
  29. Li, X.B.; Xia, L.L.; Yan, X.Y. Application of membrane inlet mass spectrometry to directly quantify denitrification in flooded rice paddy soil. Biol. Fertil. Soils 2014, 50, 891–900. [Google Scholar] [CrossRef]
  30. Xu, Y.B.; Cai, Z.C. Nitrogenous gas products of denitrification in subtropical soils. Ecol. Environ. Sci. 2014, 23, 932–937. [Google Scholar] [CrossRef]
  31. Dash, C.J.; Sarangi, A.; Singh, D.K.; Singh, A.K.; Adhikary, P.P. Prediction of root zone water and nitrogen balance in an irrigated rice field using a simulation model. Paddy Water Environ. 2015, 13, 281–290. [Google Scholar] [CrossRef]
  32. Yu, H.; Li, T.; Zhang, X. Nutrient budget and soil nutrient status in greenhouse system. Agric. Sci. China 2010, 9, 871–879. [Google Scholar] [CrossRef]
  33. Zhang, Y.; Wang, H.; Lei, Q.; Luo, J.; Liu, H. Optimizing the nitrogen application rate for maize and wheat based on yield and environment on the Northern China Plain. Total Environ. 2018, 618, 1173–1183. [Google Scholar] [CrossRef]
  34. Xia, Y.; Yan, X. Ecologically optimal nitrogen application rates for rice cropping in the Taihu Lake region of China. Sustain. Sci. 2012, 7, 33–44. [Google Scholar] [CrossRef]
  35. Mortensen, J.R.; Beattie, B.R. Does choice of response function matter in setting maximum allowable N-application rates in Danish agriculture. Cardon Res. Pap. 2005, 1. Available online: http://ag.arizona.edu/arec/pubs/researchpapers/2005-01mortensenbeattie.pdf (accessed on 7 July 2022).
  36. Yan, L.I.; Yi, C.; Wu, C.; Xu, T.; Ji, X. Determination of optimum nitrogen application rates in Zhejiang Province, China, based on rice yields and ecological security. J. Integr. Agr. 2015, 14, 2426–2433. [Google Scholar]
  37. Panel, E.N.E. Nitrogen Use Efficiency (NUE) an Indicator for the Utilization of Nitrogen in Food Systems; Wageningen University, Alterra: Wageningen, The Netherlands, 2015. [Google Scholar]
  38. Yang, G.; Wang, X.; Nabi, F.; Wang, H.; Zhao, C.; Peng, Y.; Ma, J.; Hu, Y. Optimizing planting density and impact of panicle types on grain yield and microclimatic response index of hybrid rice (Oryza sativa L.). Int. J. Plant Prod. 2021, 15, 447–457. [Google Scholar] [CrossRef]
  39. Xu, F.X.; Xiong, H.; Zhang, L.; Zhu, Y.C.; Jiang, P.; Guo, X.Y.; Liu, M. Progress in research of yield formation of ratooning rice and its high-yielding key regulation technologies. Sci. Agric. Sin. 2015, 48, 1702–1717. [Google Scholar] [CrossRef]
  40. Deng, G.W.; Qing, Q.T.; Xu, J.X.; Sun, J. Integrated meteorological disaster risk regionalization of rice in Sichuan province. Chin. J. Eco-Agric. 2020, 28, 621–630. [Google Scholar] [CrossRef]
  41. Fang, W.; Luo, W.Z.; Zhang, J.G.; Xiong, H.; Jiang, S.H.; Xu, S.H. Study on the ecological conditions and regional adaptability of ratooning rice in Sichuan province. Southwest China. J. Agric. Sci. 1994, 17, 15–18. [Google Scholar] [CrossRef]
  42. Feng, L.Z. High Temperature Risk and Its Possible Effects on Rice Yield under Climate Change. Master’s Thesis, Chinese Academy of Agricultural Sciences, Beijing, China, 2015. [Google Scholar] [CrossRef]
  43. Xu, X.W.; Sun, M.Y.; Fang, Y.Y.; He, X.Q.; Xue, F.; Fu, W.; Mao, M. Impact of climatic change on rice pro-duction and response strategies in Anhui province. J. Agro-Environ. Sci. 2011, 30, 1755–1763. [Google Scholar] [CrossRef]
  44. Ju, X.T.; Xing, G.X.; Chen, X.P.; Zhang, S.L.; Zhang, L.J.; Liu, X.J.; Cui, Z.L.; Yin, B.; Christie, P.; Zhu, Z.L. Reducing envi-ronmental risk by improving N management in intensive Chinese agricultural systems. Proc. Natl. Acad. Sci. USA 2009, 106, 3041–3046. [Google Scholar] [CrossRef] [Green Version]
  45. Zhang, X.; Davidson, E.A.; Mauzerall, D.L.; Searchinger, T.D.; Dumas, P.; Shen, Y. Managing nitrogen for sustainable de-velopment. Nature 2015, 528, 51–59. [Google Scholar] [CrossRef] [Green Version]
  46. Chen, X.; Cui, Z.; Vitousek, P.M.; Cassman, K.G.; Matson, P.A.; Bai, J.; Meng, Q.; Hou, P.; Yue, S.; Römheld, V. Integrated soil–crop system management for food security. Proc. Natl. Acad. Sci. USA 2011, 108, 6399–6404. [Google Scholar] [CrossRef] [Green Version]
  47. Cui, Z.; Chen, X.; Zhang, F. Development of regional nitrogen rate guidelines for intensive cropping systems in China. Agron. J. 2013, 105, 1411–1416. [Google Scholar] [CrossRef]
  48. Ju, X. Improvement and validation of theoretical N rate (TNR)-discussing the methods for N fertilizer recommendation. Acta Pedol. Sin. 2015, 52, 249–261. [Google Scholar] [CrossRef]
  49. Valkama, E.; Salo, T.; Esala, M.; Turtola, E. Nitrogen balances and yields of spring cereals as affected by nitrogen fertiliza-tion in northern conditions: A meta-analysis. Agric. Ecosyst. Environ. 2013, 164, 1–13. [Google Scholar] [CrossRef]
  50. Gaudin, A.C.; Janovicek, K.; Deen, B.; Hooker, D.C. Wheat improves nitrogen use efficiency of maize and soybean-based cropping systems. Agric. Ecosyst. Environ. 2015, 210, 1–10. [Google Scholar] [CrossRef]
  51. Liu, H.; Wang, Z.; Yu, R.; Li, F.; Li, K.; Cao, H.; Yang, N.; Li, M.; Dai, J.; Zan, Y. Optimal nitrogen input for higher efficiency and lower environmental impacts of winter wheat production in China. Agric. Ecosyst. Environ. 2016, 224, 1–11. [Google Scholar] [CrossRef]
  52. Pantoja, J.L.; Woli, K.P.; Sawyer, J.E.; Barker, D.W. Corn nitrogen fertilization requirement and corn–soybean productivity with a rye cover crop. Soil Sci. Soc. Am. J. 2015, 79, 1482–1495. [Google Scholar] [CrossRef] [Green Version]
  53. Hanegraaf, M.C.; den Boer, D.J. Perspectives and limitations of the Dutch minerals accounting system (MINAS). Eur. J. Agron. 2003, 20, 25–31. [Google Scholar] [CrossRef]
  54. Johnston, A.M.; Bruulsema, T.W. 4R nutrient stewardship for improved nutrient use efficiency. Procedia Eng. 2014, 83, 365–370. [Google Scholar] [CrossRef] [Green Version]
  55. Zhang, S.; Shen, T.; Yang, Y.; Li, Y.C.; Wan, Y.; Zhang, M.; Tang, Y.; Allen, S.C. Controlled-release urea reduced nitrogen leaching and improved nitrogen use efficiency and yield of direct-seeded rice. J. Environ. Manag. 2018, 220, 191–197. [Google Scholar] [CrossRef]
  56. Li, P.; Lu, J.; Wang, Y.; Wang, S.; Hussain, S.; Ren, T.; Cong, R.; Li, X. Nitrogen losses, use efficiency, and productivity of early rice under controlled-release urea. Agric. Ecosyst. Environ. 2018, 251, 78–87. [Google Scholar] [CrossRef]
  57. Xu, X.; He, P.; Yang, F.; Ma, J.; Pampolino, M.F.; Johnston, A.M.; Zhou, W. Methodology of fertilizer recommendation based on yield response and agronomic efficiency for rice in China. Field. Crop. Res. 2017, 206, 33–42. [Google Scholar] [CrossRef]
  58. Wang, Y.C. Effects of Nitrogen Management on Yield Formation of Ratoon Rice and the Related Mechanism. Ph.D. Thesis, Huazhong Agricultural University, Wuhan, China, 2019. [Google Scholar] [CrossRef]
  59. Yao, Y.; Zhang, M.; Tian, Y.; Zhao, M.; Zhang, B.; Zhao, M.; Zeng, K.; Yin, B. Urea deep placement for minimizing NH3 loss in an intensive rice cropping system. Field Crops Res. 2018, 218, 254–266. [Google Scholar] [CrossRef]
  60. Zhang, L.; Jiang, P.; Gou, X.; Zhou, X.; Zhu, Y.; Liu, M.; Xiong, H.; Xu, F. Integrated water and nitrogen management practices to enhance yield and environmental goals in rice–ratoon rice systems. Agron. J. 2019, 111, 2821–2831. [Google Scholar] [CrossRef]
  61. Asenso, E.; Zhang, L.; Tang, L.; Issaka, F.; Tian, K.; Li, J.; Hu, L. Moldboard plowing with direct seeding improves soil prop-erties and sustainable productivity in ratoon rice farmland in Southern China. Sustainability 2019, 11, 6499. [Google Scholar] [CrossRef] [Green Version]
  62. Xu, W.; Luo, X.; Pan, Y.; Zhang, L.; Tang, A.; Shen, J.; Zhang, Y.; Li, K.; Wu, Q.; Yang, D. Quantifying atmospheric nitrogen deposition through a nationwide monitoring network across China. Atmos. Chem. Phys. 2015, 15, 12345–12360. [Google Scholar] [CrossRef] [Green Version]
  63. Bouwman, L.; Goldewijk, K.K.; Van, D.H.K.W.; Beusen, A.H.W.; Van Vuuren, D.P.; Willems, J.; Rufino, M.C.; Stehfest, E. Exploring global changes in nitrogen and phosphorus cycles in agriculture induced by livestock production over the 1900–2050 period. Proc. Natl. Acad. Sci. USA 2013, 110, 20882–21195. [Google Scholar] [CrossRef] [Green Version]
  64. Si, G.H.; Yuan, J.F.; Peng, C.L.; Xia, X.G.; Cheng, J.P.; Xu, X.Y.; Jia, P.A.; Xie, Y.Y.; Zhou, J.X. Nitrogen and phosphorus cycling characteristics and balance of the integrated rice-crayfish system. Chin. J. Eco-Agric. 2019, 27, 1309–1318. [Google Scholar]
  65. Cui, Z.L.; Zhang, H.Y.; Chen, X.; Zhang, C.C.; Ma, W.Q.; Huang, C.D.; Zhang, W.F.; Mi, G.H.; Miao, Y.X.; Li, X.L.; et al. Pursuing sustainable productivity with millions of smallholder farmers. Nature 2018, 555, 363–366. [Google Scholar] [CrossRef]
  66. Song, K.F.; Zhang, G.B.; Xu, H.; Ma, J. A review of research on influencing factors and sustainability of ratoon rice cultivation in China. Acta Pedol. Sin. 2020, 57, 1365–1377. [Google Scholar] [CrossRef]
  67. Feng, D.Q.; Liu, X.C.; Liu, C.Z.; Lu, Z.W.; Wang, S.G.; Li, B.Y. Analysis and practice of climate suitability of ratoon rice in South area of Henan. Shandong Agric. Sci. 2012, 44, 41–44. [Google Scholar]
Figure 1. Experiment sites and main regions for RR cultivation in China. ★ indicates Beijing.
Agriculture 12 01064 g001
Figure 2. Estimation of yield, N application, and N efficiency of RR in different regions Values are means ± SD of three replicates. Different lowercase letters on bars indicate significant differences at p < 0.05.
Agriculture 12 01064 g002
Figure 3. Relationship between N application and yield, NUE, and grain N uptake.
Agriculture 12 01064 g003
Figure 4. Comparison of N input and N harvest under different N managements of RR in China. N harvest indicates grain N uptake; N input includes fertilizer N, N deposition, biological N fixation, and seed N; the yellow and orange parts indicate high-NUE and low-NUE areas (data from Zhang C [13]); open circles denote data under Un-OPT in the five RR planting areas of China. The desirable ranges NUE = 90% and NUE = 50%, and the desired minimum yield level (N harvest = 80 kg ha−1yr−1) were suggested by the EU Nitrogen Expert Panel (EU Nitrogen Expert Panel 2015 [37]).
Agriculture 12 01064 g004
Table 1. Estimation of the seasonal N stored (NΔsoil) in soil in RR system in five areas in China.
ItemsSources
(kg N ha−1)
SC
(n = 44)
SEC
(n = 147)
CC
(n = 382)
NEC
(n = 33)
SW
(n = 157)
InputN fertilizer253 ± 57 c355 ± 78 a310 ± 72 b371 ± 42 a270 ± 66 c
Deposition4143474738
Biological fixation2525252525
Seedling33333
Sum322426382446336
OutputGrain N uptake189 ± 33 c230 ± 45 a225 ± 45 a138 ± 17 d132 ± 14 b
Denitrification loss55 ± 12 c77 ± 17 a67 ± 18 b80 ± 8 a58 ± 14 c
NH3 volatilization48 ± 10 c73 ± 21 a61 ±17 b74 ± 8 a51 ± 11 c
N leaching5 ± 1 c8 ± 4 a6 ± 2 b8 ± 1 a6 ± 1 c
N runoff6 ± 1 c15 ± 9 a11 ± 4 b15 ± 2 a7 ± 2 c
Sum302402370315254
Nr losses 113173145177122
NΔsoil 20241213182
Note: Deposition indicates atmospheric N deposition, and biological fixation indicates biological N fixation. Different letters indicate significant difference among treatments in the same site (p < 0.05); “±” followed by the standard deviation.
Table 2. Yield, NUE, N surplus, and yield-scaled Nr loss responses to three optimal N applications in China.
ZoneOptimal N Application (kg ha−1)Yield
(t ha−1)
NUE
(%)
N Surplus
(kg N ha−1)
Nr Losses (kg N ha−1)Yield-Scaled Nr Losses
(kg N t−1)
NH3N2OL&RTotal
OPT-yieldSC28911.235018154 62 13 12911.50
SEC25213.086610850 54 14 1189.01
CC30513.516014760 66 16 14310.57
NEC39513.233132278 85 23 18714.12
SW27911.083921152 60 13 12611.37
China31912.875418063 69 17 15011.62
OPT-NUESC1588.88628932 34 8 748.35
SEC19510.49659338 42 11 928.72
CC15910.09736031 34 10 757.45
NEC39011.043928377 84 23 18416.70
SW1676.754712933 36 8 7811.54
China25712.075913351 56 14 1209.95
OPT-N uptakeSC29812.045217756 64 13 13311.05
SEC28413.826412856 61 15 1339.61
CC28514.016512256 62 15 1339.52
NEC39314.074923778 85 23 18613.21
SW2808.263921253 60 12 12515.17
China32112.695318364 69 18 15011.86
Un-OPTSC 10.855015648 55 11 11410.49
SEC 13.035418062 68 17 14811.33
CC 13.166014961 67 17 14511.03
NEC 9.982733574 80 21 17517.57
SW 10.984021253 60 12 12511.41
China 11.604620661 66 17 14312.35
Note: Nr losses denote reactive N losses, NH3 indicates NH3 volatilization, N2O indicates denitrification losses, L&R indicates the sum of N leaching and N runoff, and yield-scaled Nr losses indicate Nr losses/yield.
Table 3. Comparison of N surplus benchmarks between China and other countries/regions.
RegionsN Surplus
(kg N ha−1)
CropsReferencesNotes
The Netherlands80Arable land[53]N surplus benchmarks in 2003
Europe80All cropland[37]Overall mean N surplus benchmark
World53Rice[45]N surplus benchmarks for 2050
China65All cropland[45]N surplus benchmarks for China in 2050
China120Rice, rice–rice[45]N surplus benchmarks
China180Ratoon riceThis studyAverage N surplus for the highest yield
China138Ratoon riceThis studyAverage N surplus for the highest NUE
China183Ratoon riceThis studyAverage N surplus for the highest grain N uptake
Publisher’s Note: MDPI stays neutral with regard to jurisdictional claims in published maps and institutional affiliations.

