Article

Simulation and Experimental Study of a Split High-Speed Precision Seeding System

1
College of Mechanical and Electrical Engineering, Shihezi University, Shihezi 832003, China
2
Xinjiang Production and Construction Corps, Key Laboratory of Modern Agricultural Machinery, Shihezi 832000, China
*
Author to whom correspondence should be addressed.
Agriculture 2022, 12(7), 1037; https://doi.org/10.3390/agriculture12071037
Submission received: 6 June 2022 / Revised: 12 July 2022 / Accepted: 13 July 2022 / Published: 16 July 2022

Abstract

:
According to the agronomic requirements of cotton precision seeding, the researchers designed a split seeding system to achieve high-speed precision seeding on the membrane. The 3D models used in the simulation process were created using Solidworks. They used the built-in Flow Simulation plug-in in SolidWorks to simulate the flow field in the drum and to grasp the air velocity and pressure changes. The CFD-DEM (computational fluid dynamics and discrete element method) coupling method was used to simulate the positive pressure airflow to transport the seeds, so as to grasp the movement of the seeds in the seed tube. EDEM (engineering discrete element modeling) was used to simulate the seeding process of the hole seeder, to understand the movement speed and trajectory of the seeds inside the hole seeder, and to analyze the reasons for missed seeding and reseeding. A three-factor, five-stage quadratic rotation orthogonal combination test was designed using Design-expert 13.0 software. This test evaluates the performance of a split seeding system by establishing a response surface for the seed rate, using the hole seeder speed, negative pressure, and hole diameter as test factors. The optimal parameter combination is obtained by optimizing the regression equation, which is further verified by bench tests. Under the hole seeding speed of 47.98 r/min, the negative pressure of 1.96 kPa and the hole diameter of 3.5 mm, the precision seeding system achieved a single seed rate of 90.9% and a missed seed rate of 4.3%. The verification test results are consistent with the optimization results, which meet the agronomic requirements of high-speed precision film seeding. This research provides a better technical solution for the application development of a precision seeder.

1. Introduction

The quality of sowing has a massive impact on yield per unit area, and precision sowing is the production trend today, saving seed usage, reducing operator labor and improving land utilization, increasing yields and incomes, and generating substantial economic benefits [1,2]. Researchers worldwide are working to improve seeder efficiency, ensure operational reliability, and reduce production costs [3,4,5].
Precision sowing in inland cotton producing areas in northwest China is relatively mature, enabling precise planting of cotton seeds in a certain quantity and location. Compared with conventional sowing, precision sowing can save more than 60% of seeds and increase the cotton yield by 5–10% [6]. Innovations in precision agriculture will increase efficiency and reduce input costs, and the application of precision seeders will increase yield and quality [7]. These are all thanks to the advancement and development of cotton planting technology. Small and medium-sized seeds are characterized by non-food crops with an average diameter of less than 7 mm, mainly including canola, wheat, alfalfa, cotton, ginseng, and cereals. Once the missed seeding cannot be found in time, a large area of missed seeding will inevitably occur. Especially for the wide and high-speed planter with high operating speed and high seeding width, it is time-consuming and laborious to supplement the seedlings manually in the later stage [8]. Improving the quality of crop planting for small and medium-sized seeds is the industry trend of precision seeding in the future.
Zhang et al. [9] innovated the structure of the negative pressure chamber inside the seed meter to make the internal negative pressure more stable. The authors used CFD (computational fluid dynamics) to simulate the conical suction orifice structure’s flow field and demonstrated the structure’s rationality. The bench test results show that the seed metering system has a pass rate of 91.32%, a resowing rate of 4.51%, and a leakage rate of 4.17% at a speed of 28.56 r/min and negative pressure of 4.40 kPa, meeting the demand for precision sowing. Bagherpour [10] designed a suction drum-type chickpea precision seeder and conducted three experimental studies on seedbed belt speed, vacuum pressure, seed hole diameter, and other test factors. The author finally found that the best operational performance was achieved with a vacuum pressure of 6 kPa, a seedbed belt speed of 2.5 km/h, and a seed hole diameter of 4 mm, with a pass rate of 84.5%, a missed seed rate of 10%, and a reseeding rate of 5.5%.
Li et al. [11] carried out CFD simulations of a self-designed suction measurement device to investigate the relationship between the drag and suction models for highly spherical seeds and found that changes in air velocity gradient and pressure gradient were the leading causes of suction variation. The soybean, pea, and Panax ginseng seeds were also used for bench validation experiments. Abdolahzare et al. [12] investigated the law of the effect of air-suction seed rower advance speed and vacuum pressure on seed spacing uniformity. The seed drop trajectory was collected experimentally for different combinations of advanced speed and vacuum pressure of the seed rower. The equation of seed movement trajectory was established. The difference between the mean and actual mean of seed drop speed was calculated to be within 5% by comparing laboratory tests and field trials. Hu et al. [13] conducted numerical simulations of the two-phase flow within the distribution head based on CFD-DEM, (computational fluid dynamics and discrete element method)and the results showed that the streamlined design of the structure could reduce the frequency of collision between the seed and the tube wall, reduce excessive seed dwell, and improve the distribution performance.
Lei et al. [14] simulated the seed-tube interaction mechanism in a centralized seed distribution system by DEM. (discrete element method) The simulation results showed that tube diameter and seed drop height could affect seed distribution and that collision and bouncing can change the trajectory of seed movement, resulting in reduced seed velocity and poorer sowing uniformity. Gao et al. [15] used a venturi with unique adsorption and no increase in energy consumption for pressure changes in their design to study the new air-assisted dosing seed delivery system using a coupled CFD-DEM approach. The flow behavior of the seed particles and the airflow field in this system were analyzed in detail. The influence of different variables related to the venturi and operation was investigated.
Guzman et al. [16] used CFD-DEM to simulate the pneumatic transport of seeds in the dispenser tube in an air seeder. They performed an in-depth analysis of seed-boundary collisions, seed contact forces, and the number of seed collisions as a function of air velocity. Liu et al. [17] analyzed the influence of soybean diameter and suitable working speed on the operational performance of the seed measuring device through EDEM virtual simulation software in order to solve the problem of the small range of suitable sowing size of the seeding plate and designed a precision sowing device with a wide range of application.
Despite much research on precision seeding, most precision seeders are in the experimental stage of research and there is still some distance from practical application [18,19,20]. In order to improve the stability of the precision seeder during high-speed operation and reduce the effect of vibration on the seed filler during high-speed operation, using a split seeding system is a good solution. In this study, the parts of the seeding system were modeled by using Solidworks 2020. Flow Simulation was used to analyze the internal flow field of the seeding drum; a coupled CFD-DEM simulation was used to simulate the transport process of the seed transporting tube; an EDEM 2018 simulation was used to simulate the movement of the seed in the hole seeder. Through the use of each part of the simulation software to grasp the movement law of cotton seeds, the seeding performance of the split seeding system was analyzed. Design-expert 13.0 was used to design a central combination of experimental schemes, evaluate the indexes by response surfaces, optimize the parameters to find the optimal solution, and verify it by comparison with bench tests. This paper can provide important assumptions for the design of a precision seeding system and demonstrate the feasibility and reliability of the split seeding system.

2. Materials and Methods

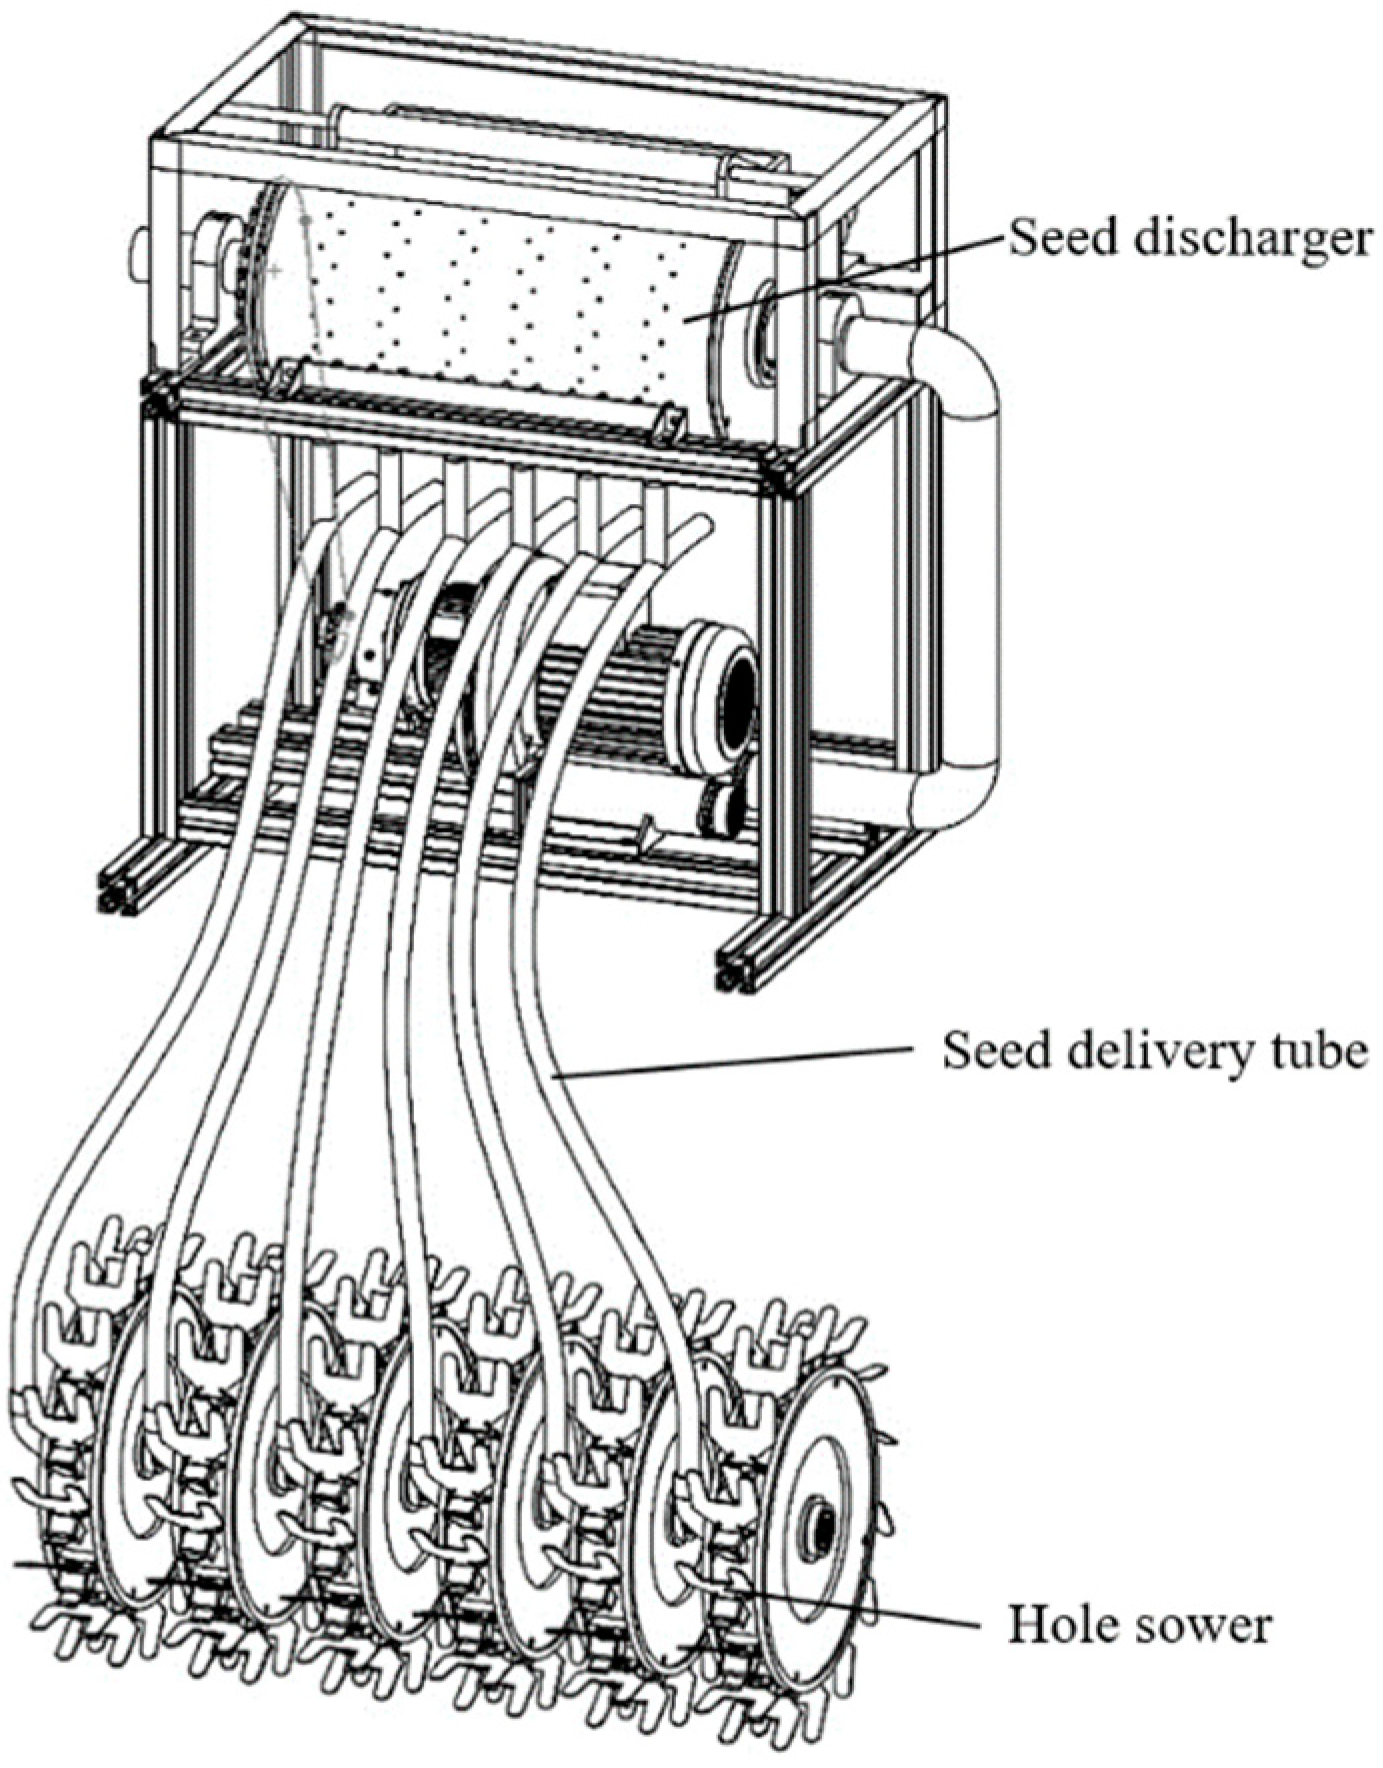
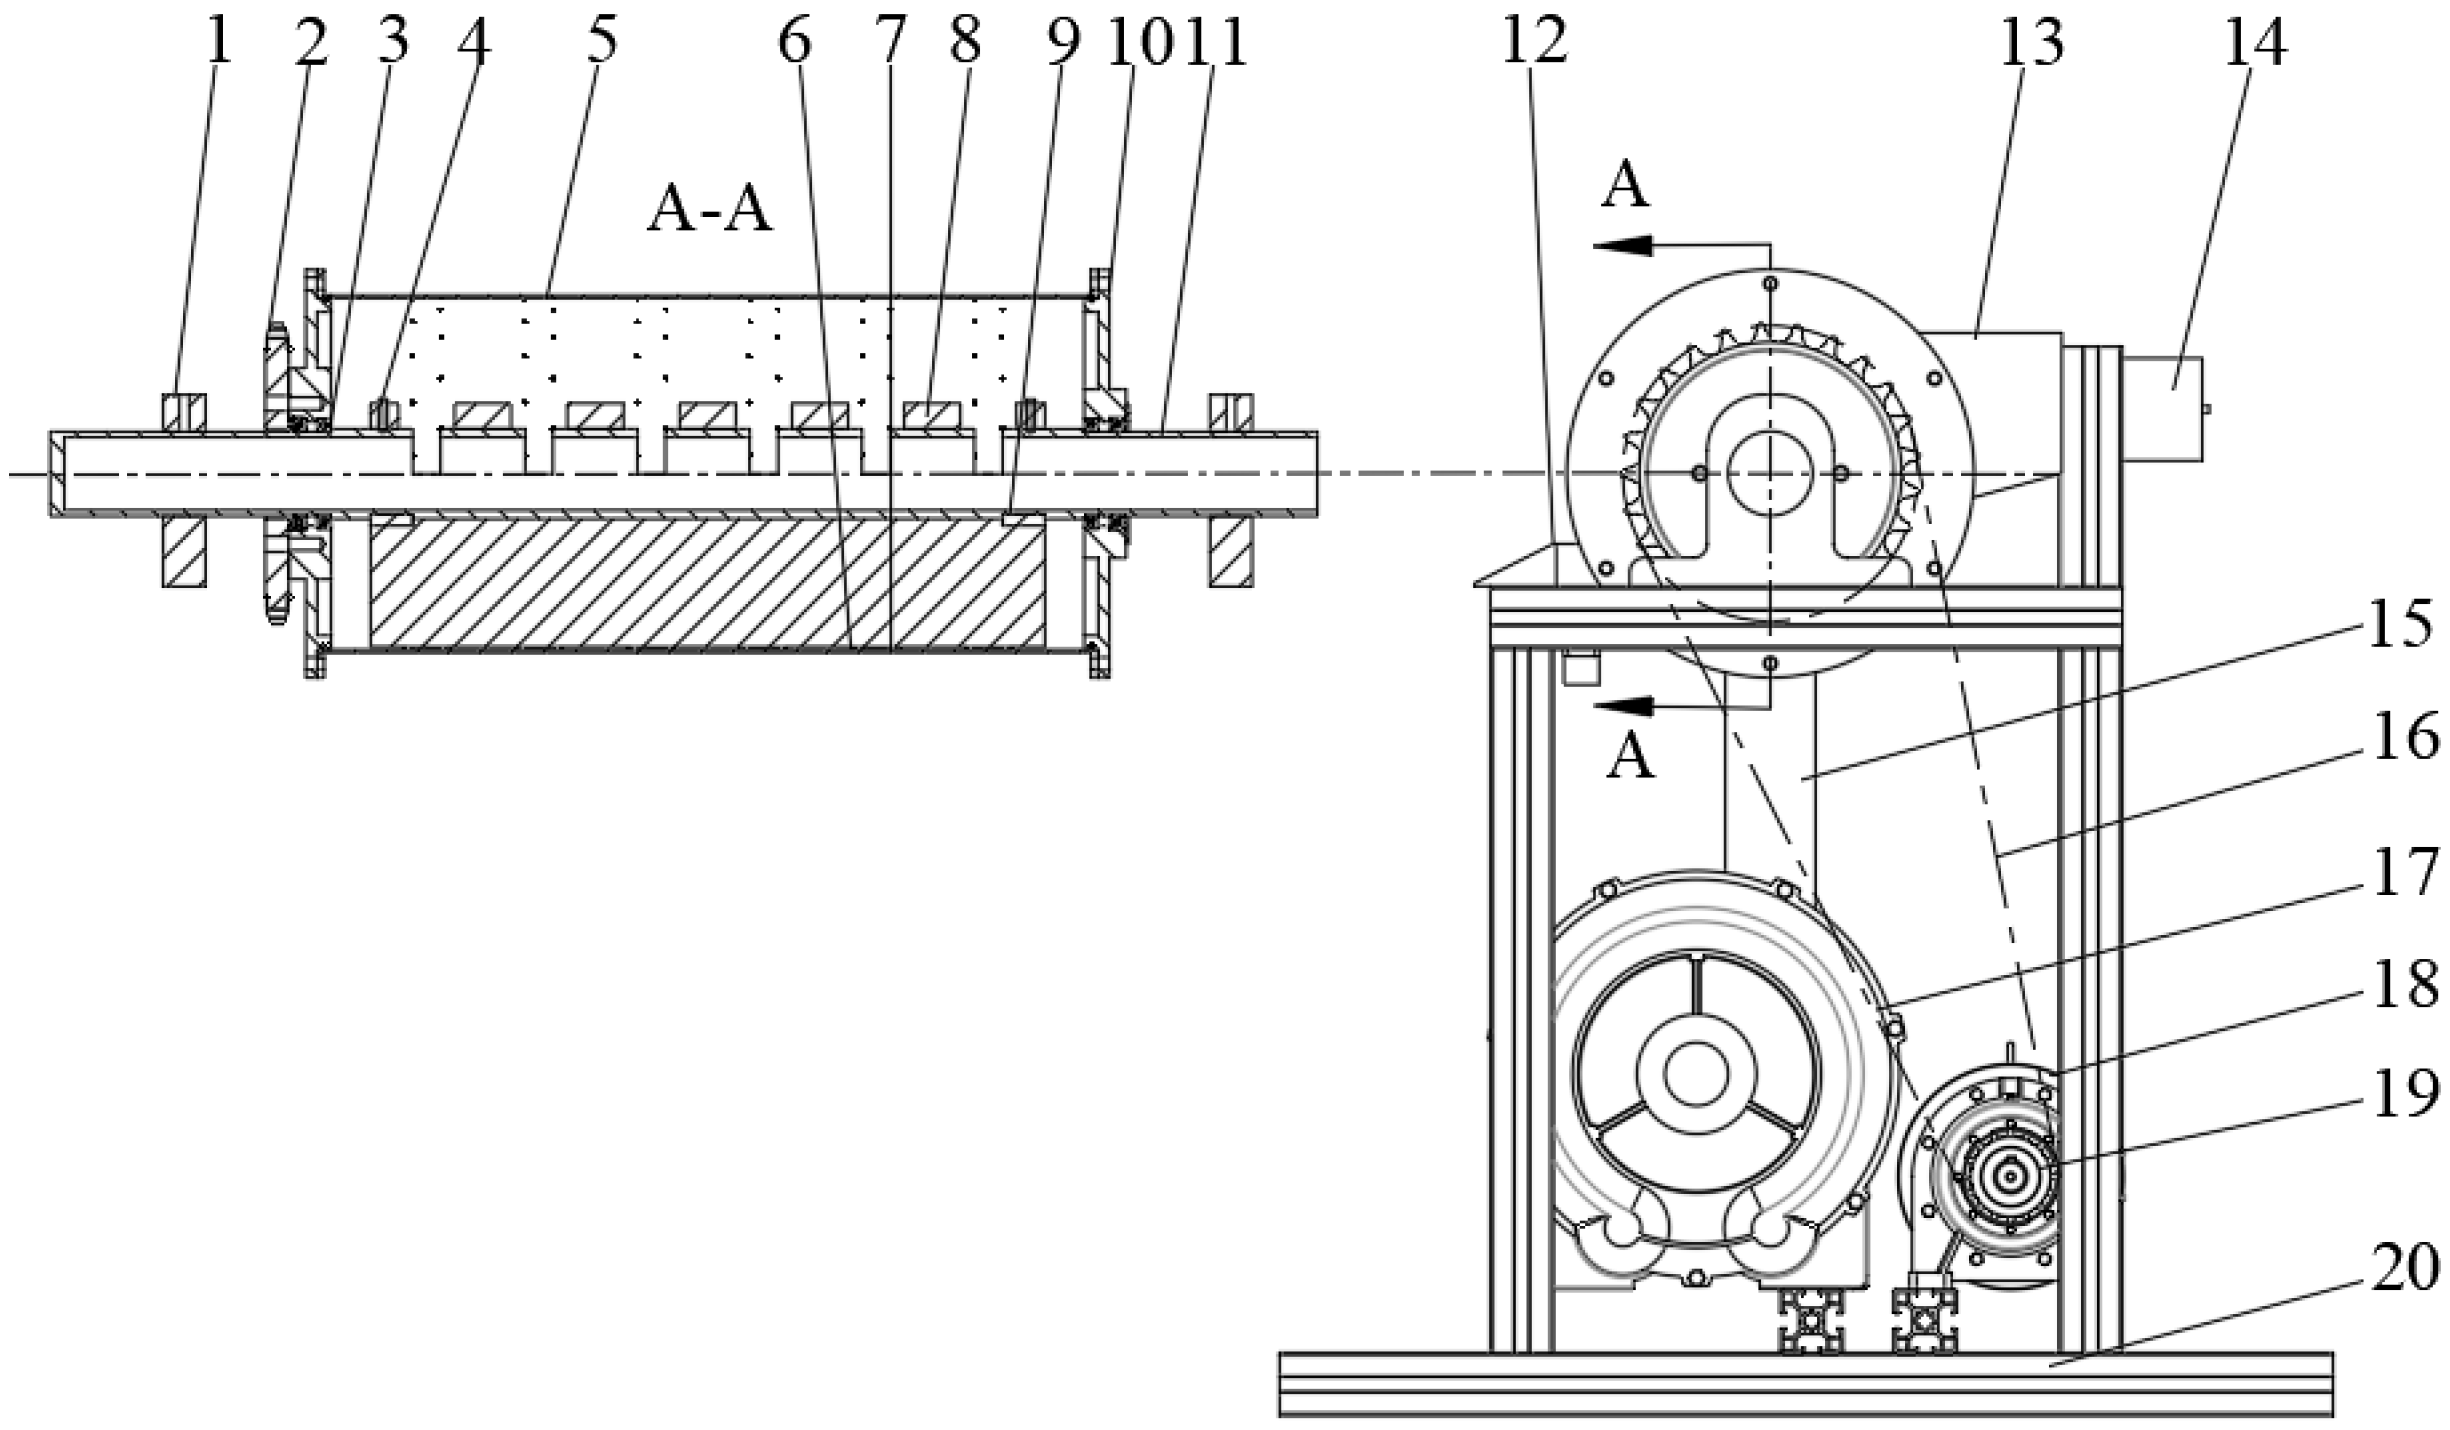
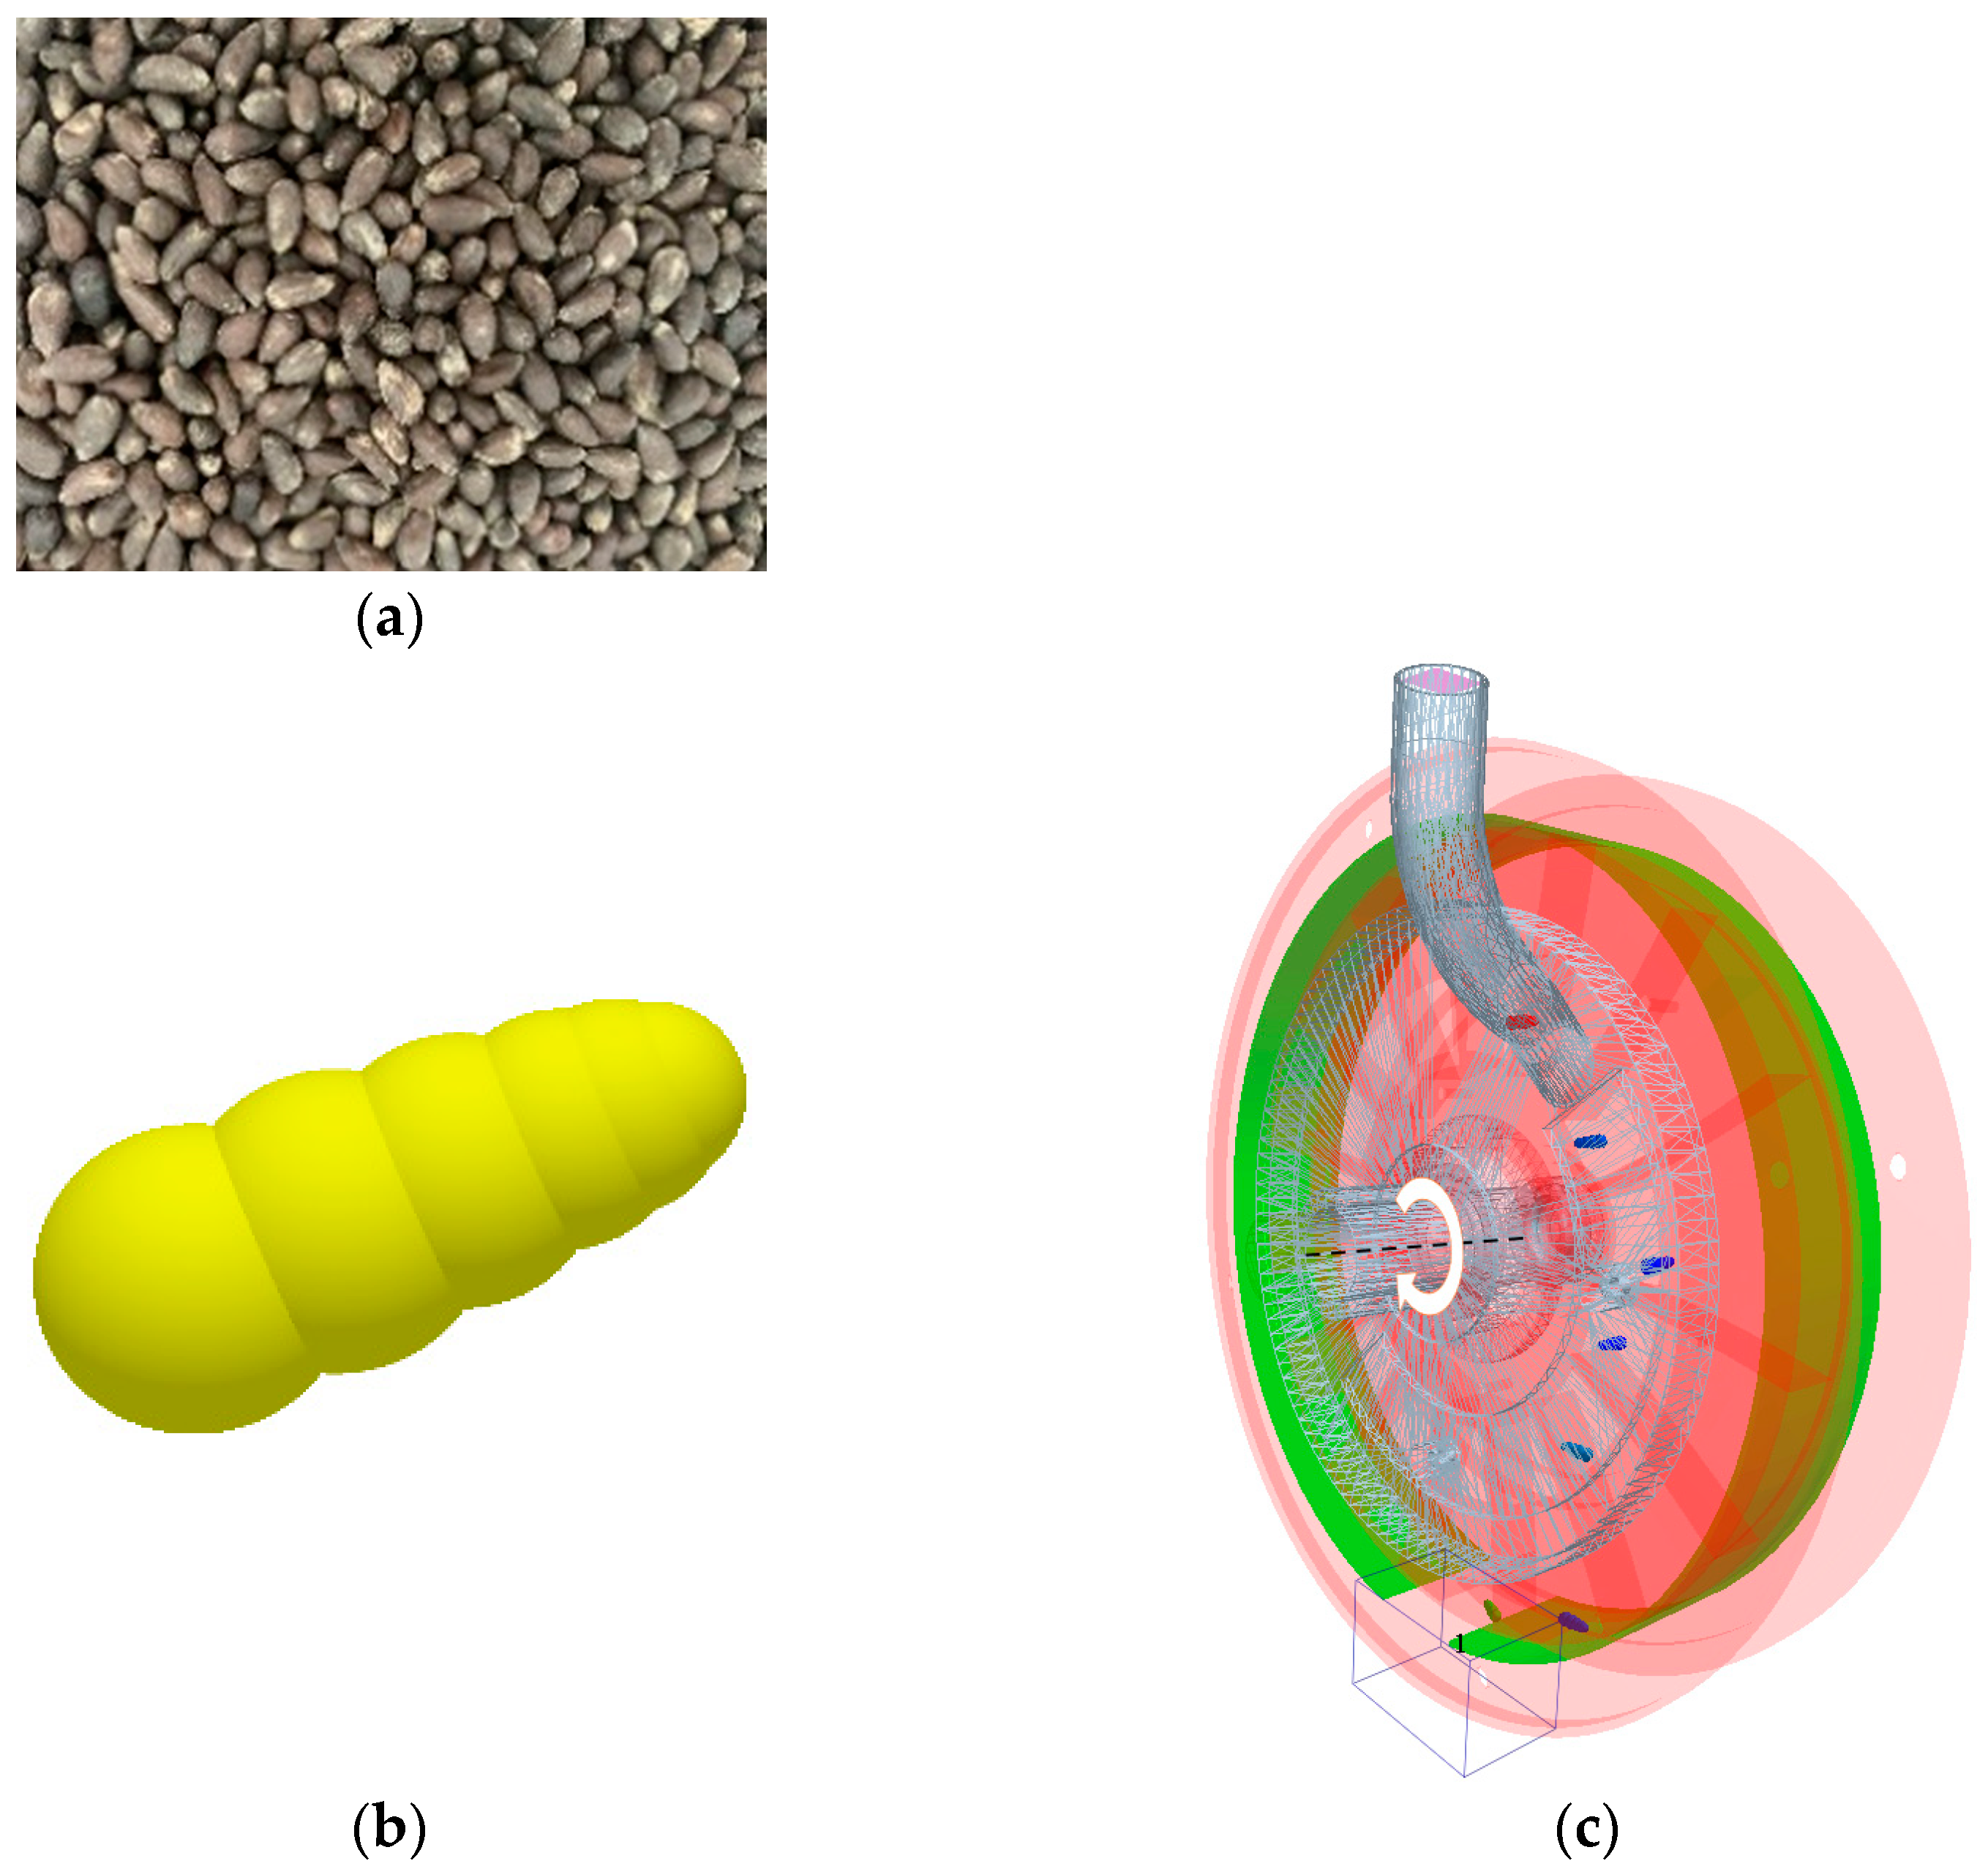
2.1. Overall Structure of the Split Seeding System

Based on the agronomic requirements of cotton sowing in Xinjiang, the research team proposed a split seeding system, i.e., the seeder is separated from the hole sower, and the seed is transported through a seed delivery tube [21,22,23]. The seeder drum is 550 mm long and 250 mm in diameter, with 40 holes per column, staggered and spaced 480 mm apart, and each column has a hole seeder through a seed tube 600 mm long and 20 mm inner diameter. The hole sower has 15 holes a week, broken into holes and seeded through the duckbill at a spacing of 10.5 cm. The split system has a high-frequency seed pick-up by the hole sower, fast seed transport by the seed delivery tube with positive air pressure and a matching speed ratio between the hole sower and the seed rower, thus achieving high-frequency, high-speed precision sowing. Specifically as shown in Figure 1.

2.2. Working Principle of Each Part

The seed dispenser part of the split seed dispersal system is mainly used for high-frequency precision seed extraction, and its structure is shown in Figure 2. The two ends of the air-absorbing drum are sealed by the end caps through bolts, forming a closed space inside. The whirlpool fan is connected to one end of the opposing pressure shaft employing a wire hose, and the other end of the opposing pressure shaft is set up as a closed structure. Through the holes in the negative pressure shaft, the air inside the drum is sucked to form a negative pressure, and the pressure difference between the inside and outside of the holes in the drum makes it possible to absorb the seeds. A speed-reducing motor rotates the roller through a chain drive, and the holes in the roller take the seed from the seedbox. Moreover, when it reaches the seed feeding area, it alternately enters the same seed feeding opening by inertia and gravity to complete the precise seed discharge.
The seed delivery tube of the split seeding system is loaded with positive airflow and connected at the upper end to the seed drop [24]. After the seed has fallen through the seed feeder and into the tube, the seed is quickly transported by the airflow to the seed inlet of the hole sower. This reduces the friction and collision between the seed and the tube wall and reduces the uncertainty of movement during transport compared to the free fall of the seed by gravity alone.
The structure of the hole sower is shown in Figure 3. The seed enters the interior of the hole sower at a certain initial speed and at certain time intervals. It enters the adjacent chamber under the rotation of the seed-dividing disc. The seed stopper and seed guard protect the seed from running out of the seed-dividing compartment during the rotation. As the seed-carrying chamber rotates below, the seed falls by gravity through the gap in the retaining ring into the duckbill, breaking the membrane to form the cavity. The seed enters the seed cavity to complete the sowing [25].

2.3. Simulation of the Seed Dispenser Flow Field

Air-absorbing seed dispensers are designed to extract seeds using suction at negative pressure; so, it is essential to understand how the flow field inside the air chamber changes to improve its performance. The air chamber structure, negative pressure, aperture and speed of the hole sower all affect the flow field, which is not visible to us, and the most common method is to study the airflow pattern through flow field simulation.

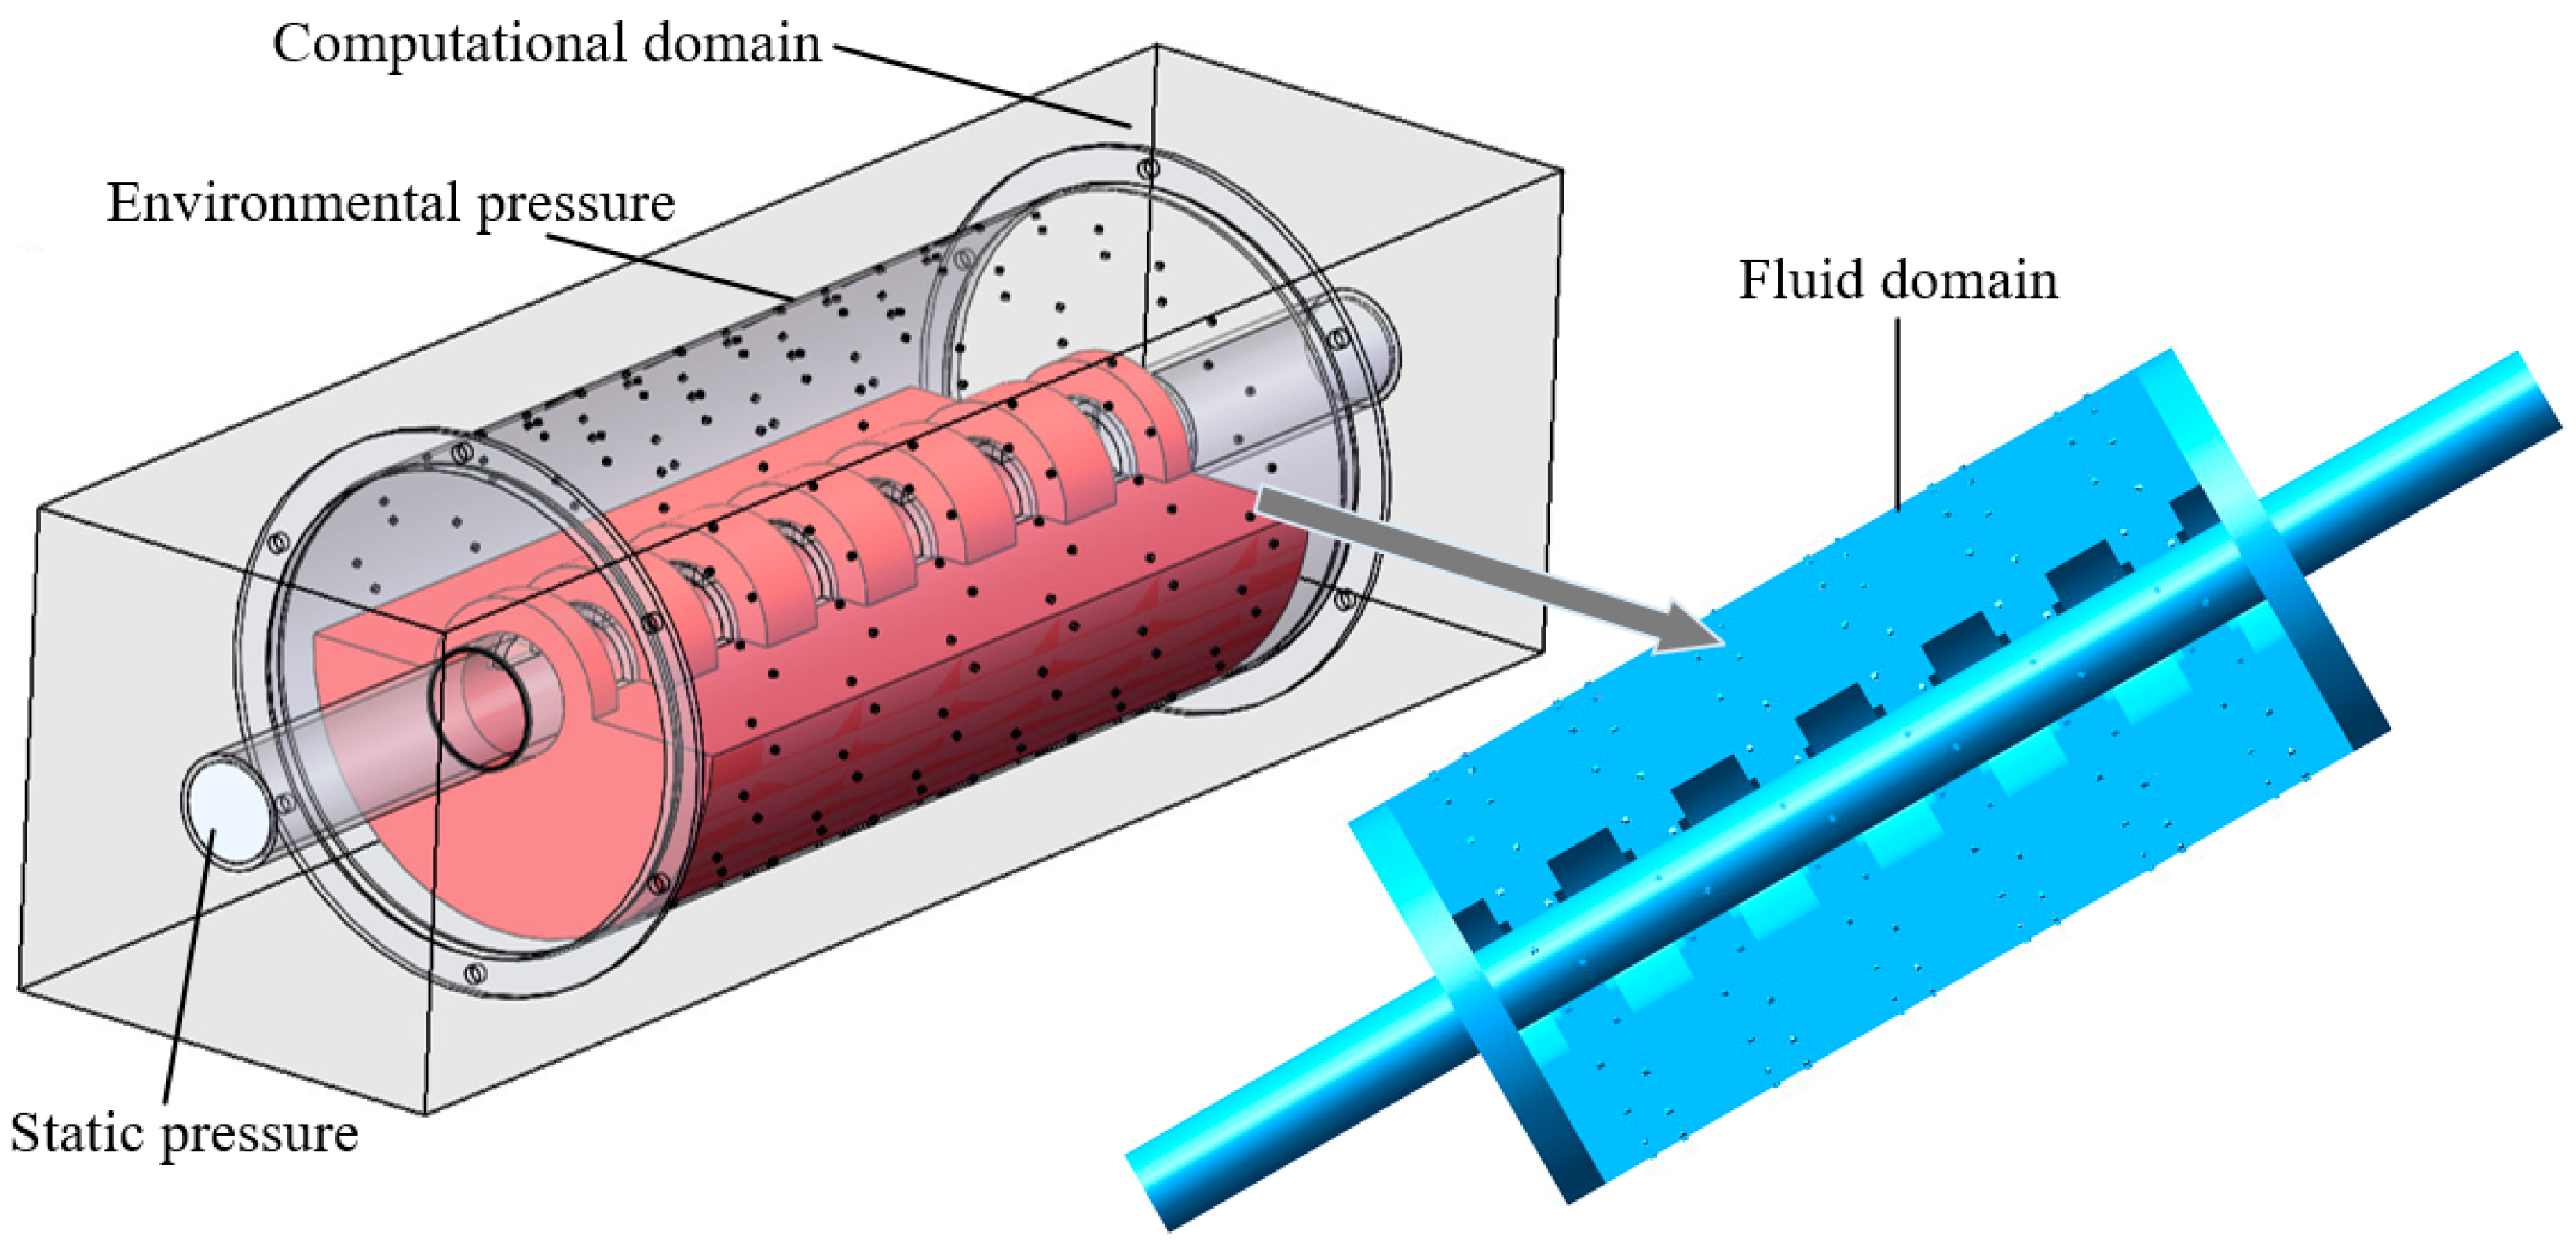
2.3.1. Seed Discharger Simulation Model and Parameter Settings

This study uses Solidworks for 3D modelling and its built-in plug-in Flow Simulation for flow field simulation. The model is seamlessly integrated between the two, and the flow field results change accordingly when the model is changed, thus providing timely feedback. The fluid flow follows three basic control equations. The fluid inside the drum is incompressible, the flow field is turbulent and flows isothermally at room temperature, and the tensor form of the control equations is expressed as follows.
Continuity equation.
ρ t + x ( ρ v x ) + y ( ρ v y ) + z ( ρ v z ) = 0
Momentum equation.
t ( ρ u i ) + x j ( ρ u i u j ) = p x i + x j ( μ u i x j ρ u i u j ¯ ) + S i
Standard k-ε turbulent transport equation.
{ t ( ρ k ) + x i ( ρ k u i ) = x j ( ( μ + μ t σ k ) k x j ) + G k + G b ρ ε Y M + S k t ( ρ ε ) + x i ( ρ ε u i ) = x j ( ( μ + μ t σ ε ) ε x j ) + C 1 ε ε k ( G k + C 3 ε G b ) C 2 ε ρ ε 2 k + S ε
where ρ is a constant; t is an instantaneous time; vx, vy, vz are the velocity components of the fluid mass along the three-dimensional coordinate axis, respectively; μt is the turbulent viscosity, depending on the flow state; u is the fluid time-averaged velocity; p is the static pressure; k is the turbulent energy, and ε is the turbulent dissipation rate, both k and ε are fundamental unknowns; Gk is the generation phase of turbulent energy k due to the mean velocity gradient; Gb is the buoyancy force due to the generating phase of k due to buoyancy, and YM represents the contribution of pulsational expansion incompressible turbulence; C, C and C are empirical constants; σk and σε are the Prandtl numbers corresponding to the turbulent energy k and dissipation rate ε, respectively; Si, Sk, and St are custom source phases.
The flow field simulation sets the outer surface of the drum as the ambient pressure inlet, and the negative pressure shaft outlet as the static pressure outlet, the simplified model is shown in Figure 4 [26,27,28]. The negative pressure value is the difference between ambient and static pressure; the ambient pressure is the standard atmospheric pressure, 101,325 Pa.

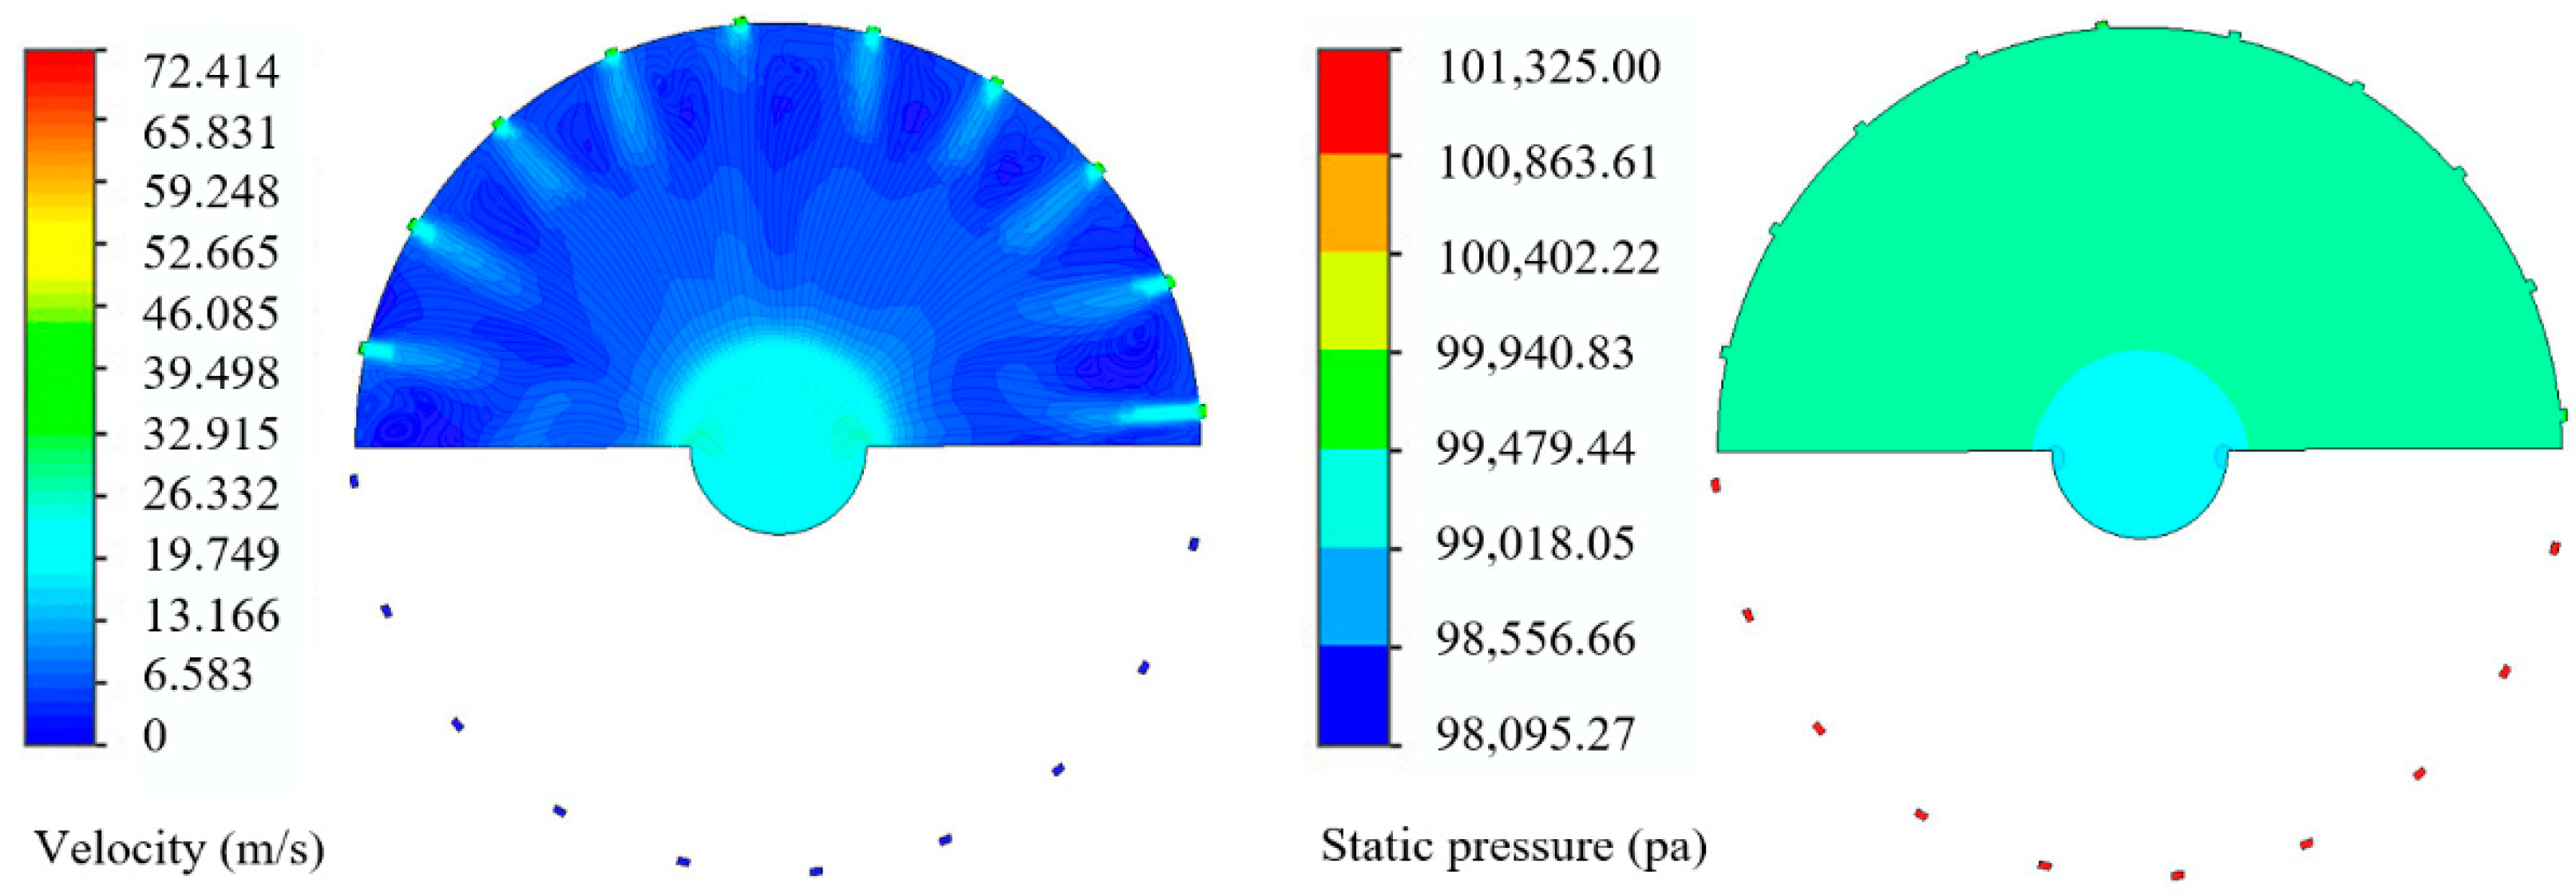
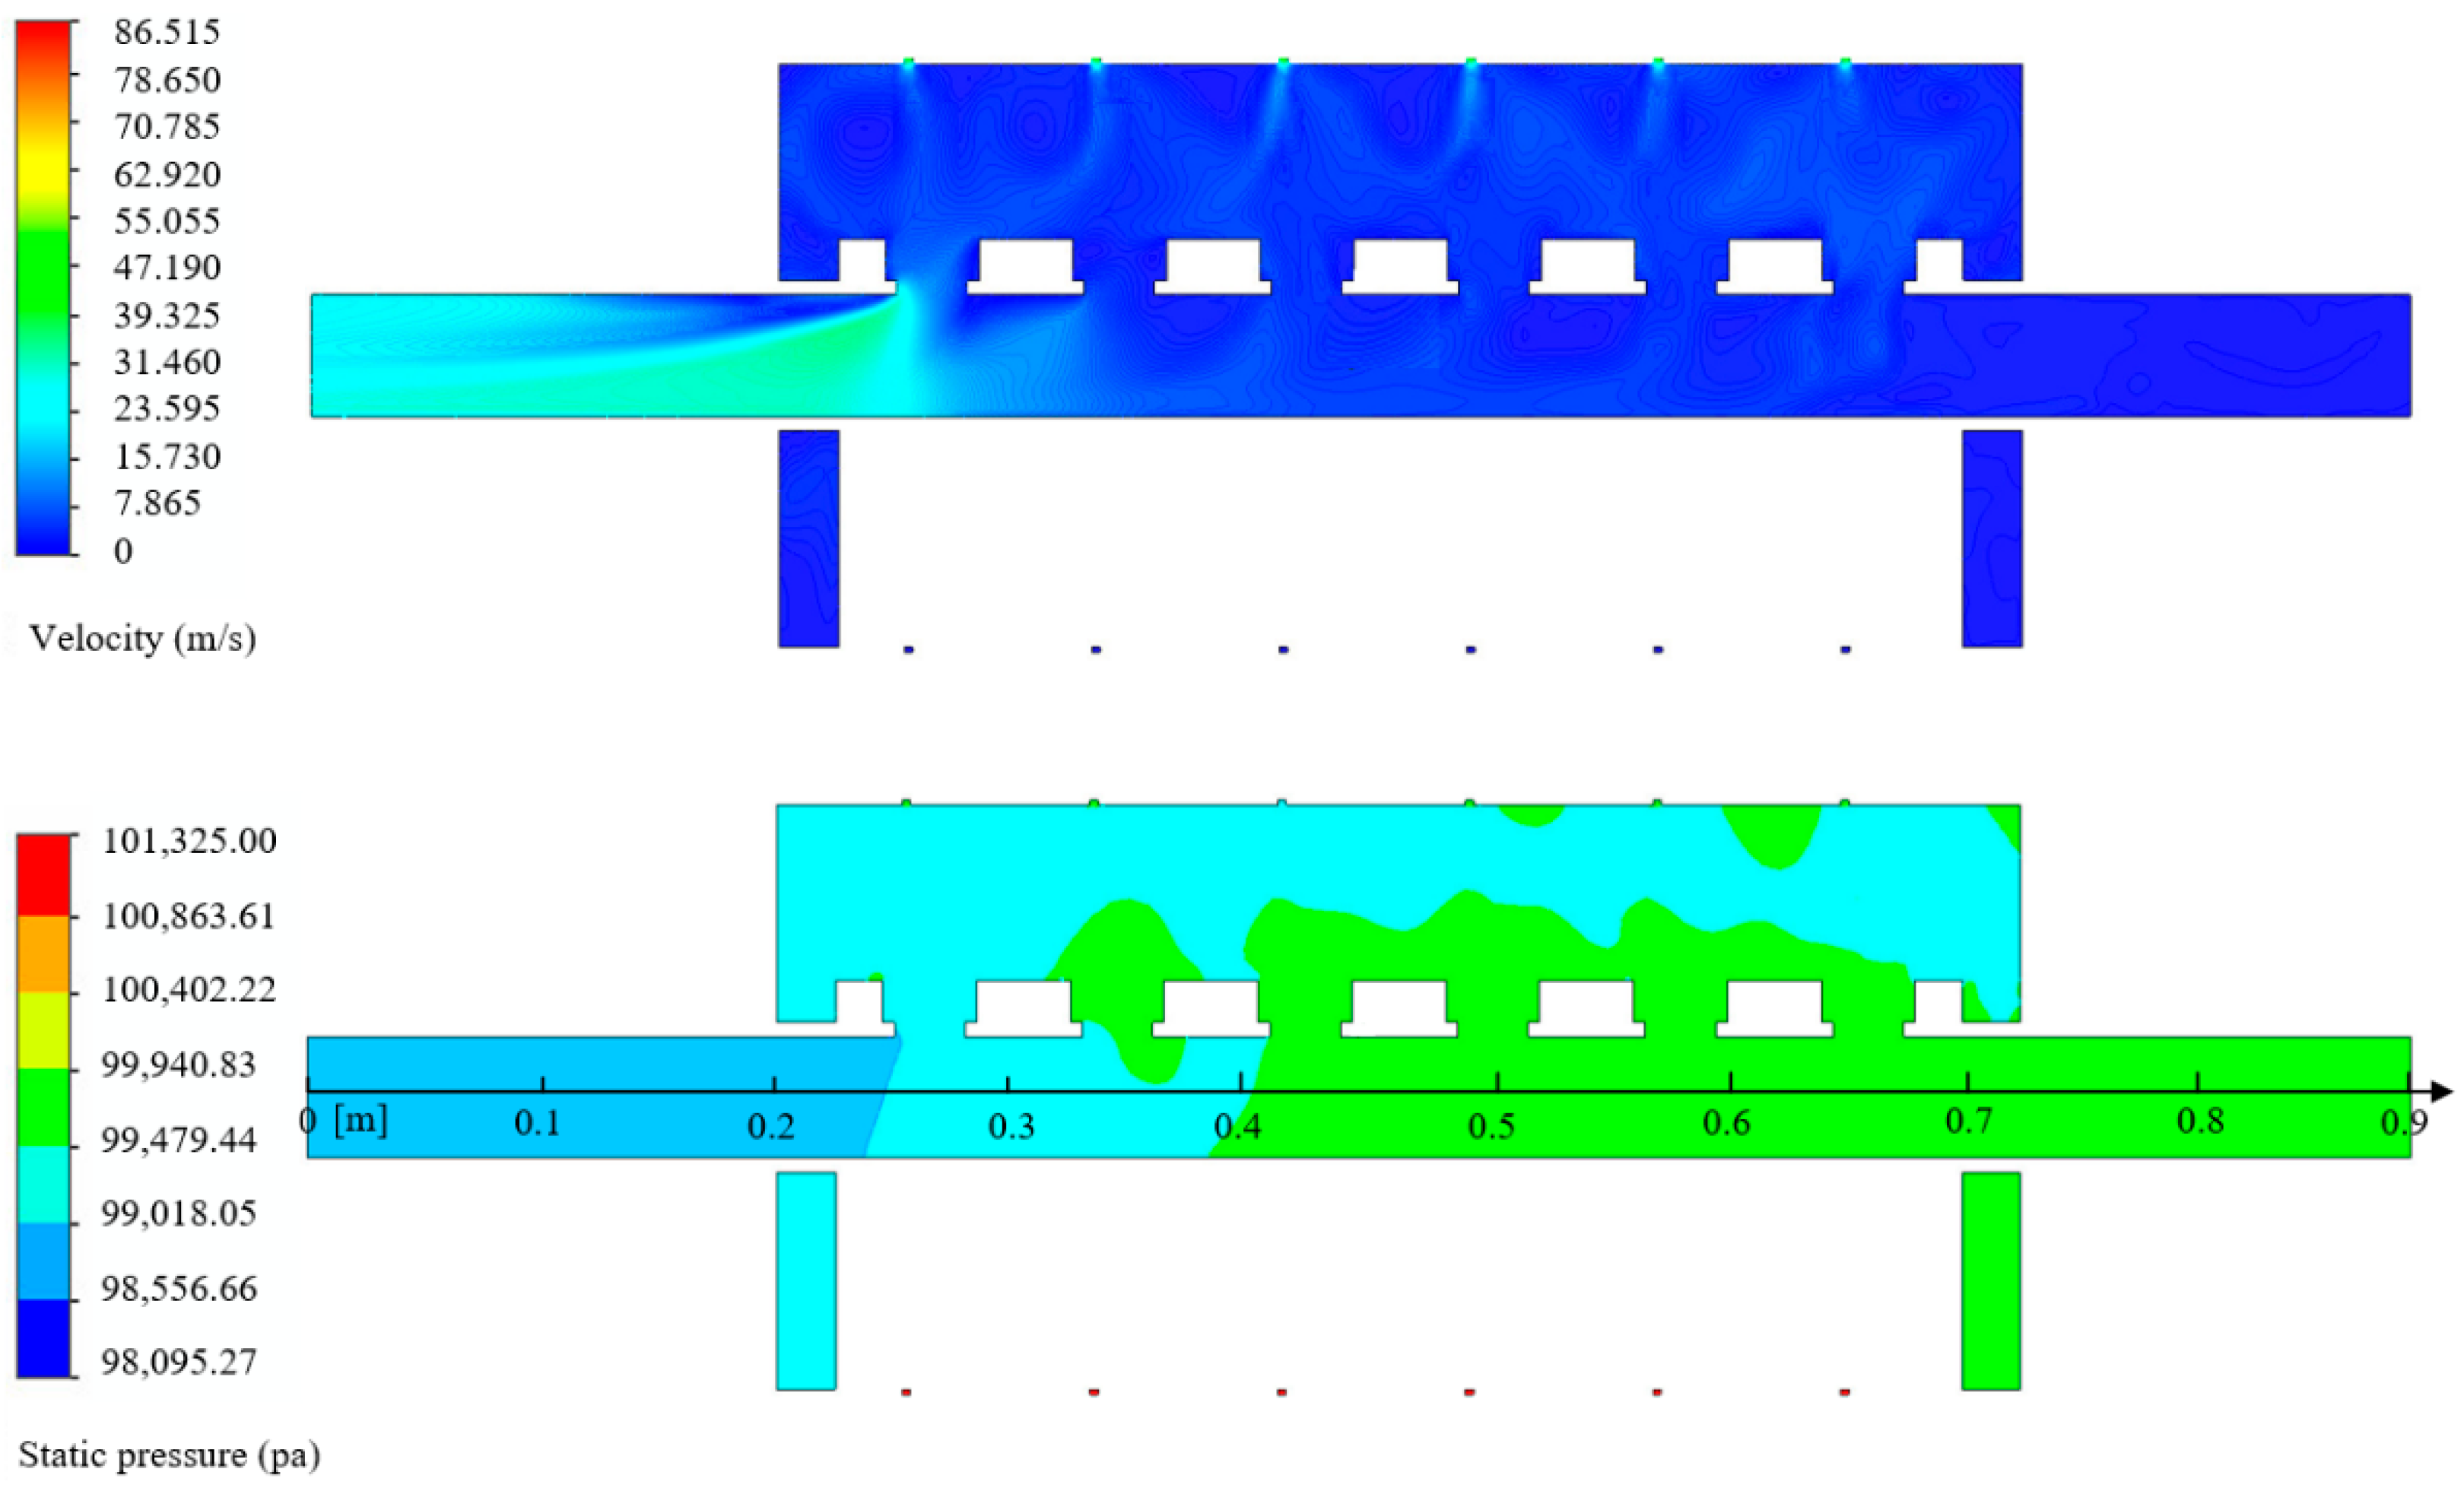
2.3.2. Simulation Results and Analysis of the Seed Dispenser

The negative pressure inside the roller and the roller type aperture affect the seed filling effect. In order to find a certain rule, the pressure and velocity clouds were obtained under the conditions of 3.5 mm aperture and 2.43 kPa negative pressure, as shown in Figure 5 and Figure 6.
Figure 5 shows the section nearest to the exit end of the negative pressure shaft, which has 20 holes. As the fluid domain is only in the upper part of the drum, the holes are numbered clockwise 1–10 in the upper part of the pressure cloud to facilitate the comparison of subsequent simulation results. As can be seen from the velocity cloud diagram of the longitudinal section, the velocity is higher near the negative pressure axis and the typed hole. The airflow velocity is lower at the rest of the locations. The type holes are evenly distributed along the circumference of the drum, and the radial velocity gradient changes significantly. Vortices are easily formed between the holes in the vicinity of the drum wall, but the holes are not easily affected by vortices. The closer the distance to the shaft, the higher the negative pressure value, and the further away from the negative pressure value, the lower the value. By comparing the airflow velocity at the exact position of the holes at different cross-sections, it is found that the difference in velocity is not apparent, and the velocity distribution clouds at the nearest and farthest sections from the outlet are the same as the pressure distribution clouds.
Figure 6 shows a cross-sectional view of the flow field in the vertical direction during drum operation. As the negative pressure axis has six openings, a one-dimensional coordinate system is established on the negative pressure axis of the pressure cloud diagram, using the end of the static pressure outlet axis as the origin. From the cross-sectional velocity cloud, it can be seen that the airflow velocity is higher from the shaft end to the first opening on the negative pressure axis, higher at the hole, and lower at the rest of the locations. The velocity gradient varies significantly at the holes on the rollers. The velocity gradient varies significantly on the negative pressure axis and not significantly at the remaining locations. The pressure drop along the negative pressure axis is noticeable; the negative pressure at the upper part of the flow field space and near the static pressure outlet is more significant than that away from the static pressure outlet, except for the first opening on the negative pressure axis where the negative pressure value is higher, the negative pressure values at the other openings are more minor.

2.4. Coupled Simulation of Seed Transport in the Seed Transfer Tube

In order to verify that the loading of the seed delivery tube with positive airflow can lead to rapid seed transport and reduce the uncertainty in the free fall process by gravity, a coupled CFD-DEM method was used to carry out a feasibility simulation [29,30]. In the test, the wind pressure was set to 400 Pa, the inner diameter of the seed delivery tube was 22 mm, and the initial velocity of the particles at the seed inlet was 0.2 m/s. The simulation time step in EDEM was set to 1 × 10⁻⁵ s with a storage time of 0.01 s, while the corresponding simulation time step in Fluent was set to 5 × 10⁻⁴ s with a storage time of every 200 timesteps. The generation time gap of the cotton seed particles was set to be a uniform standard amount. The time interval between the generation of individual seed particles was consistent with forming a more uniform seed flow. A total of 20 cotton seed particles were generated within the specified time.

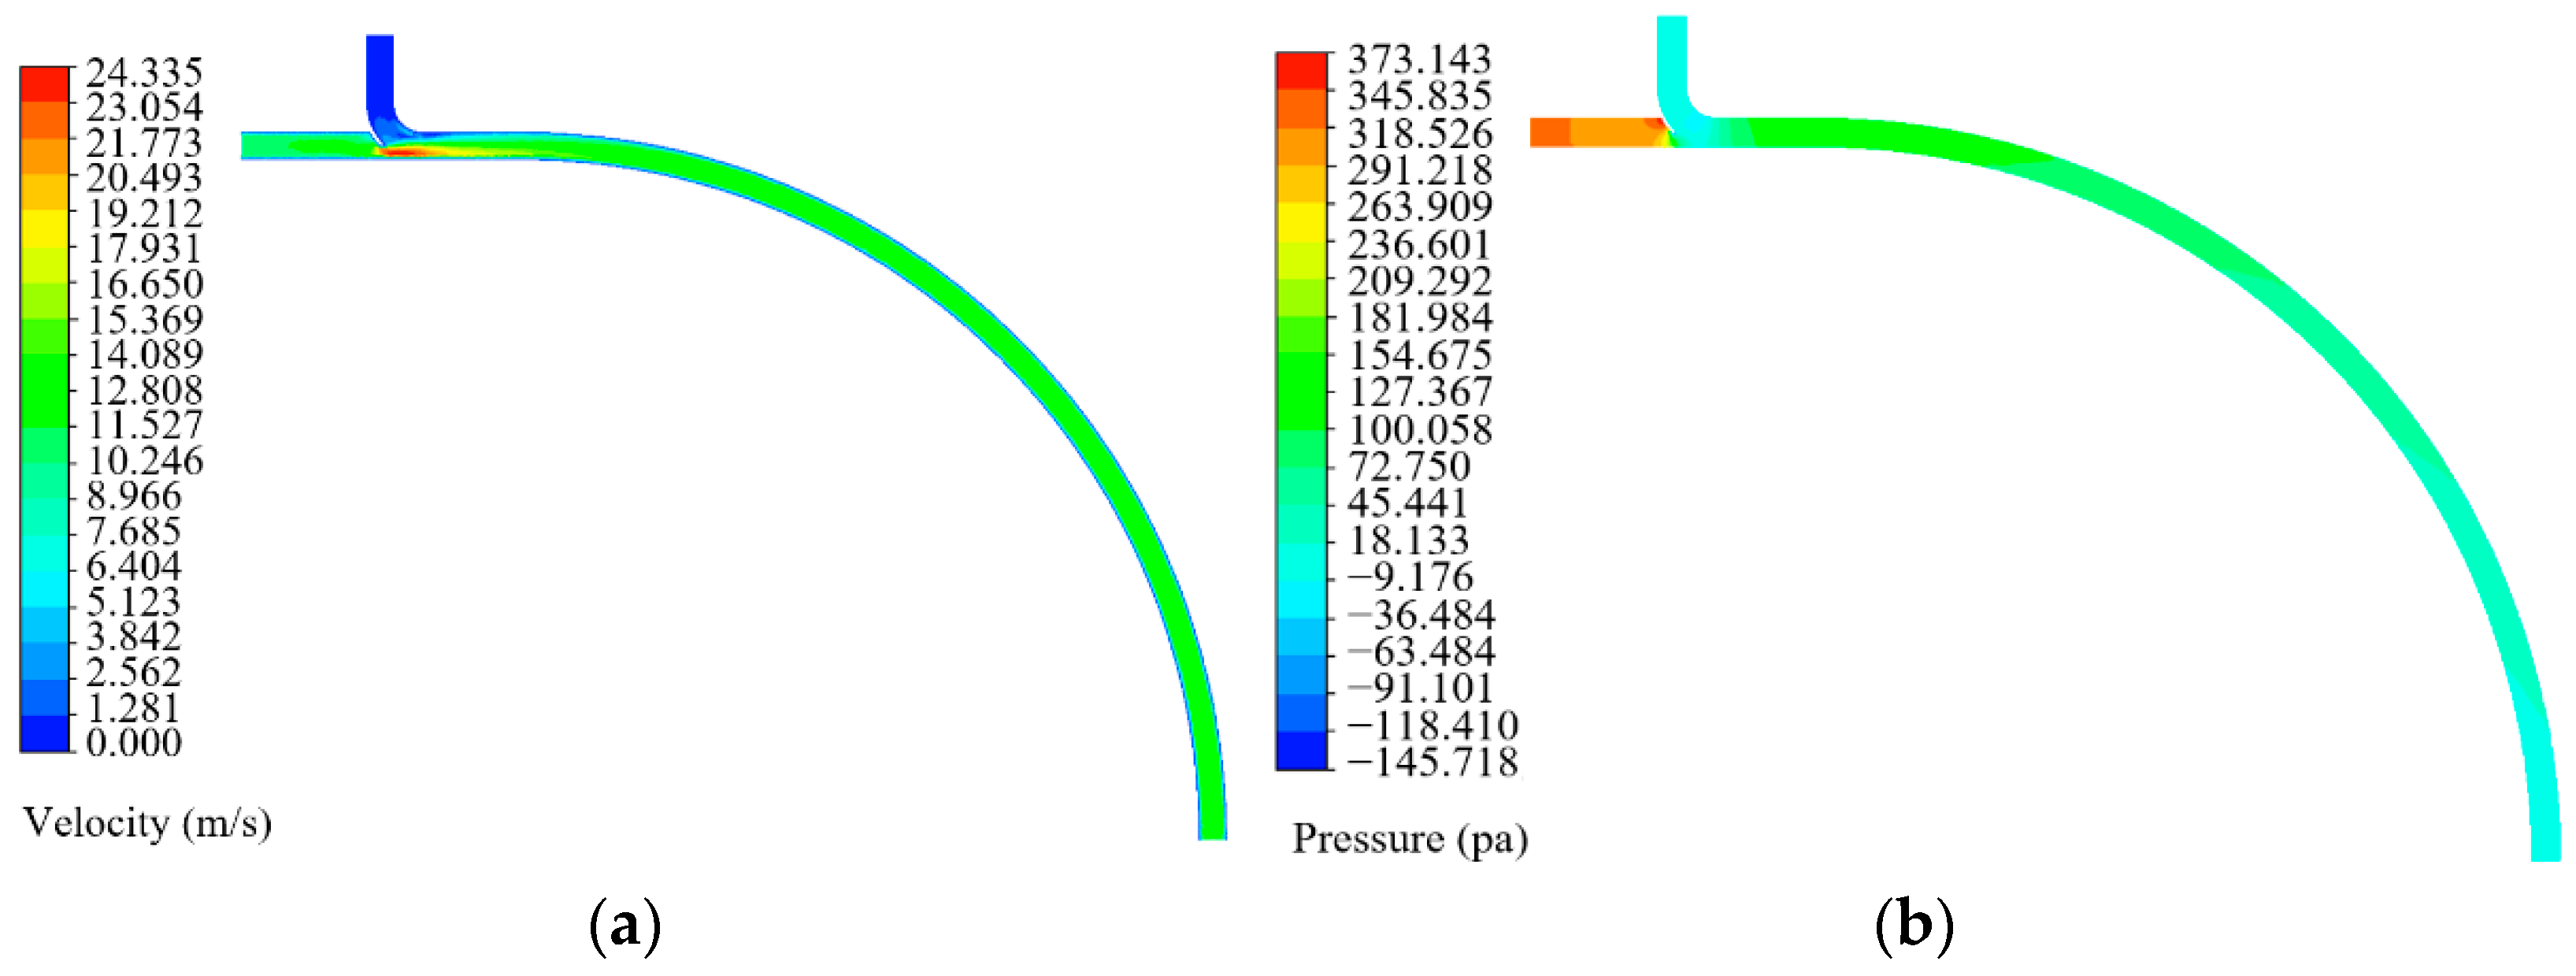
2.4.1. Simulation Analysis of the Flow Field of the Seed Delivery Tube

We use Fluent 18.0 (2018, ANSYS, Pittsburgh, PA, USA) to analyze the flow field of seed delivery tube, one end of the seed delivery tube is loaded with positive pressure airflow, and its velocity and pressure clouds are shown in Figure 7. Figure 7a is a cloud diagram of the flow field velocity in the seed tube, showing the distribution of air velocity. It can be seen from the figure that when the air enters the seed feeding pipe from the inlet, the speed is about 12 m/s. At the protruding flare, the air velocity increases sharply to about 20 m/s due to the reduction of the pipe diameter. Above the vertical pipe is the outlet end, and the initial velocity is zero. With the air flow at the protruding flare, the air flow rate of the vertical pipe section increases gradually, and together it flows to the other outlet of the seed feeding pipe. The air flow direction of the vertical pipe section is downward, and the flow rate is low, which is suitable for cotton seeds with a certain initial speed to enter the inside of the seed feeding pipe from above, by relying on their own weight. As the air penetrates into the pipe after passing through the flared opening, the air distribution becomes more uniform, the flow velocity gradually decreases, and the flow velocity in the central area of the pipe is greater than that in the pipe wall area [31]. Figure 7b is a cloud map of the pressure distribution of the seed pipe, with a positive pressure of 400 Pa. It can be seen from the figure that the air has a high pressure when it enters the seed tube, and then decreases slightly. There is a small negative pressure in the vertical pipe section, and the pressure value is negative, which is conducive to the fall of cotton seeds. As the airflow goes deep into the seed tube, a pressure drop occurs along the way, the pressure value changes from positive to negative, and there is a small negative pressure at the outlet.

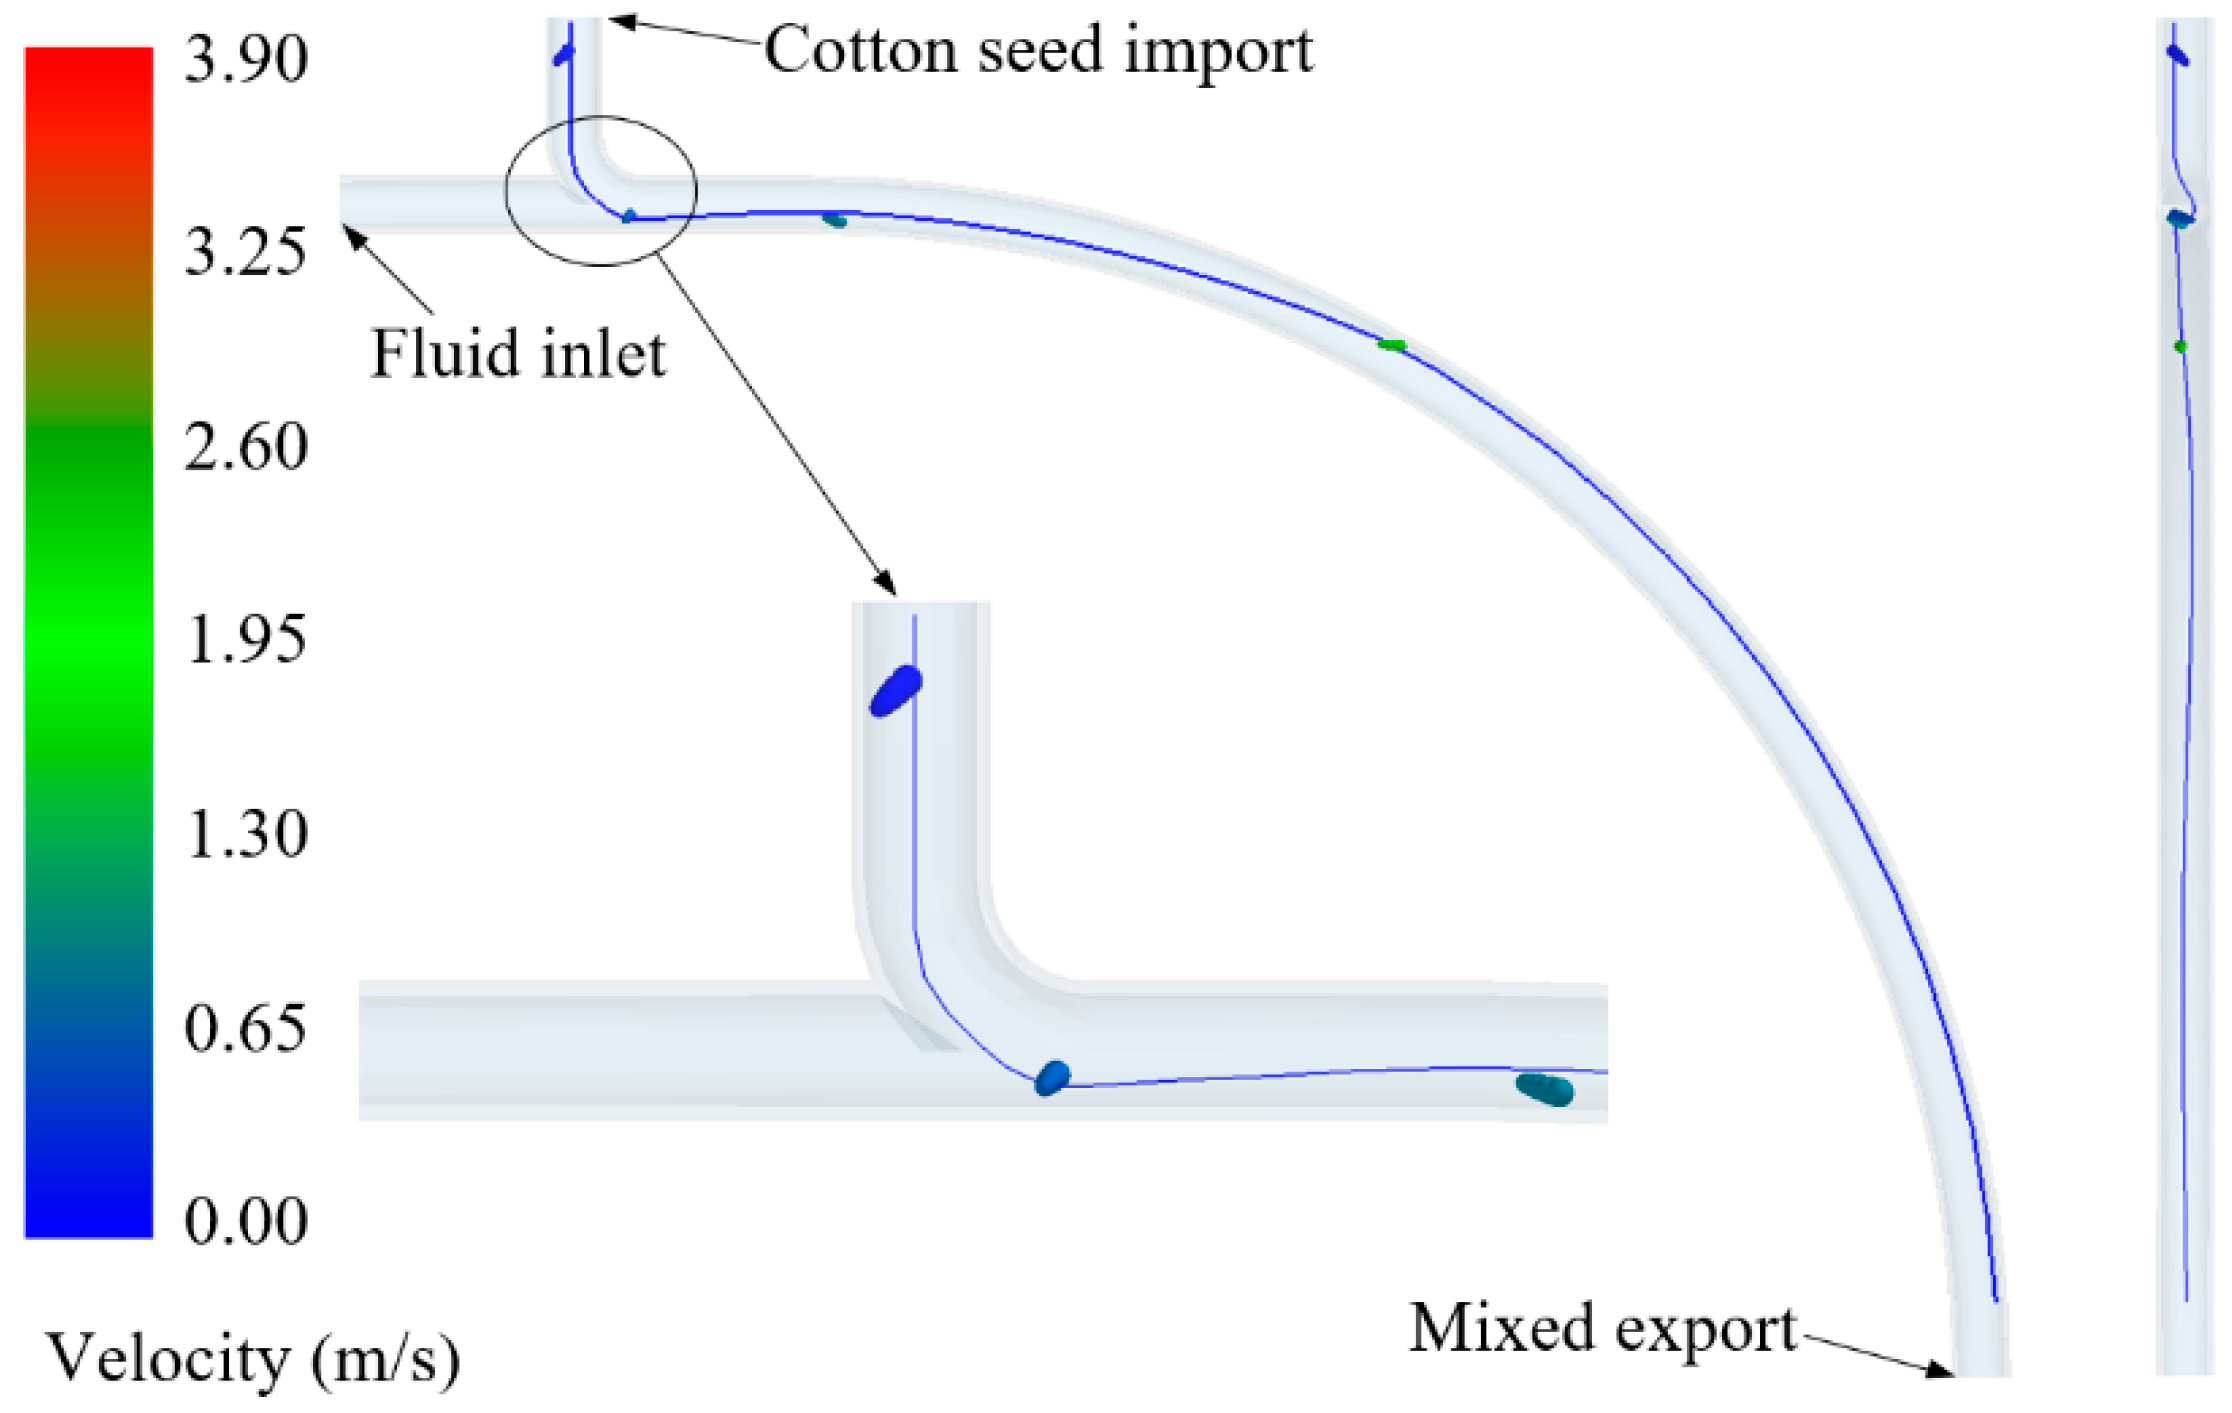
2.4.2. Simulation Analysis of Cotton Seed Transport

The simulation of the transport of cotton seed particles in the seed transport tube is shown in Figure 8. It shows the whole process of cotton seeds from entering the seeding tube to discharging, and the shape of the seeding tube has a high degree of fit with the movement trajectory. Cotton seeds are generated from the upper pellet factory and enter the vertical pipe section at a certain initial speed, and the vertical pipe section is linear motion. In the flaring area, the movement trajectory of the cotton seed takes a big turn, and this area is also where each cotton seed must pass. The dual action of the structure and airflow at the flared mouth changes the movement trajectory of the cotton seed. When the cotton seed enters the strong flow field, the air blowing force accelerates it along one side of the seed pipe in the horizontal direction, and then collides with the other side of the pipe wall, and then is thrown out along the other side of the seed pipe. This is the outlet for airflow and the cotton seed mix. The number of collisions of cotton seeds in the transfer tube is less, and the rolling friction and sliding friction are the main ones when they are in contact with the wall.
The total simulation time is 2 s, 10 particles are generated per second, the interval time is the same, and at most one particle is generated each time. Figure 9 shows the selected No. 4 cotton seed particles, that is, the fourth cotton seed generated in the simulation process, and analyzes its moving speed and force in the seed pipe. The force of cotton seeds in the seed pipe is a comprehensive effect, including gravity, air resistance, airflow force, support force when colliding with the seed pipe, rolling friction, sliding friction, and so on. The comprehensive force of the cotton seed in the vertical pipe is about 0.0011 N, and the comprehensive force of the cotton seed is about 0.0018 N in the mixing area of the cotton seed and the air flow in the seed feeding pipe. After the cotton seeds are formed, the initial speed of downward movement is 0.2 m/s, and then, the vertical pipe section accelerates, and the speed fluctuates in the flaring area. After that, the speed increases sharply under the action of the comprehensive external force, and the speed reaches the maximum value at the exit.
Figure 10 shows the movement states of No. 4 cotton seed particles in the seed tube at different times. Figure 10a shows that when t = 0.49 s, the speed of cotton seeds in the vertical pipe section of the seeding pipe increases to the maximum, and the speed value is 1.08 m/s. Figure 10b shows that when t = 0.54 s, the cotton seed moves from the vertical tube to the horizontal tube, colliding with the bottom of the tube, and the force is 0.049 N at this time. Figure 10c shows that when t = 0.68 s, the speed of cotton seeds in the horizontal pipe section increases to the maximum, and the speed is 3.01 m/s without contacting the pipe wall at this time. Figure 10d shows that when t = 0.69 s, the cotton seed contacts the other side of the pipe wall at a high speed, and then, the speed is slightly reduced to 2.95 m/s. Figure 10e shows that when t = 0.72 s, the cotton seed and the pipe wall are in contact with each other in a large area. At this time, the force is 0.003 N, and the force before and after the contact shows a small fluctuation. Figure 10f shows that when t = 0.79 s, the cotton seed contacts the pipe wall at a high speed, and the force is 0.017 N at this time. Figure 10g shows that when t = 0.84 s, the speed of cotton seeds in the vertical pipe section of the outlet area increases to the maximum, and the speed value is 3.79 m/s.
When the same simulation model is loaded with different air-positive pressures, the speed of cotton seeds at the outlet is obtained. When the positive air blowing pressure loaded at the inlet end of the seed feeding pipe is larger, the speed of cotton seeds at the outlet end is larger, and vice versa. When the loaded positive pressure is very small, the effect of the airflow speed on the cotton seeds is very weak, the migration trajectory of the cotton seeds in the seeding pipe will only follow one side of the seeding pipe, and the spacing between the cotton seeds will be reduced, and even the front and rear will be reduced. The particles will come into contact and be thrown at the outlet at the same time, so the positive pressure of the loaded air blowing should not be too small.

2.5. Simulation of the Hole Seeder and Analysis of the Seed Dispersal Process

As the hole seeder is a solid structure, it is impossible to observe the seeds’ trajectory inside the hole seeder. The simulation of the model using EDEM provides a clear picture of the movement of the seeds inside the hole seeder and the speed of the seeds at any given position at any given time [32,33,34].

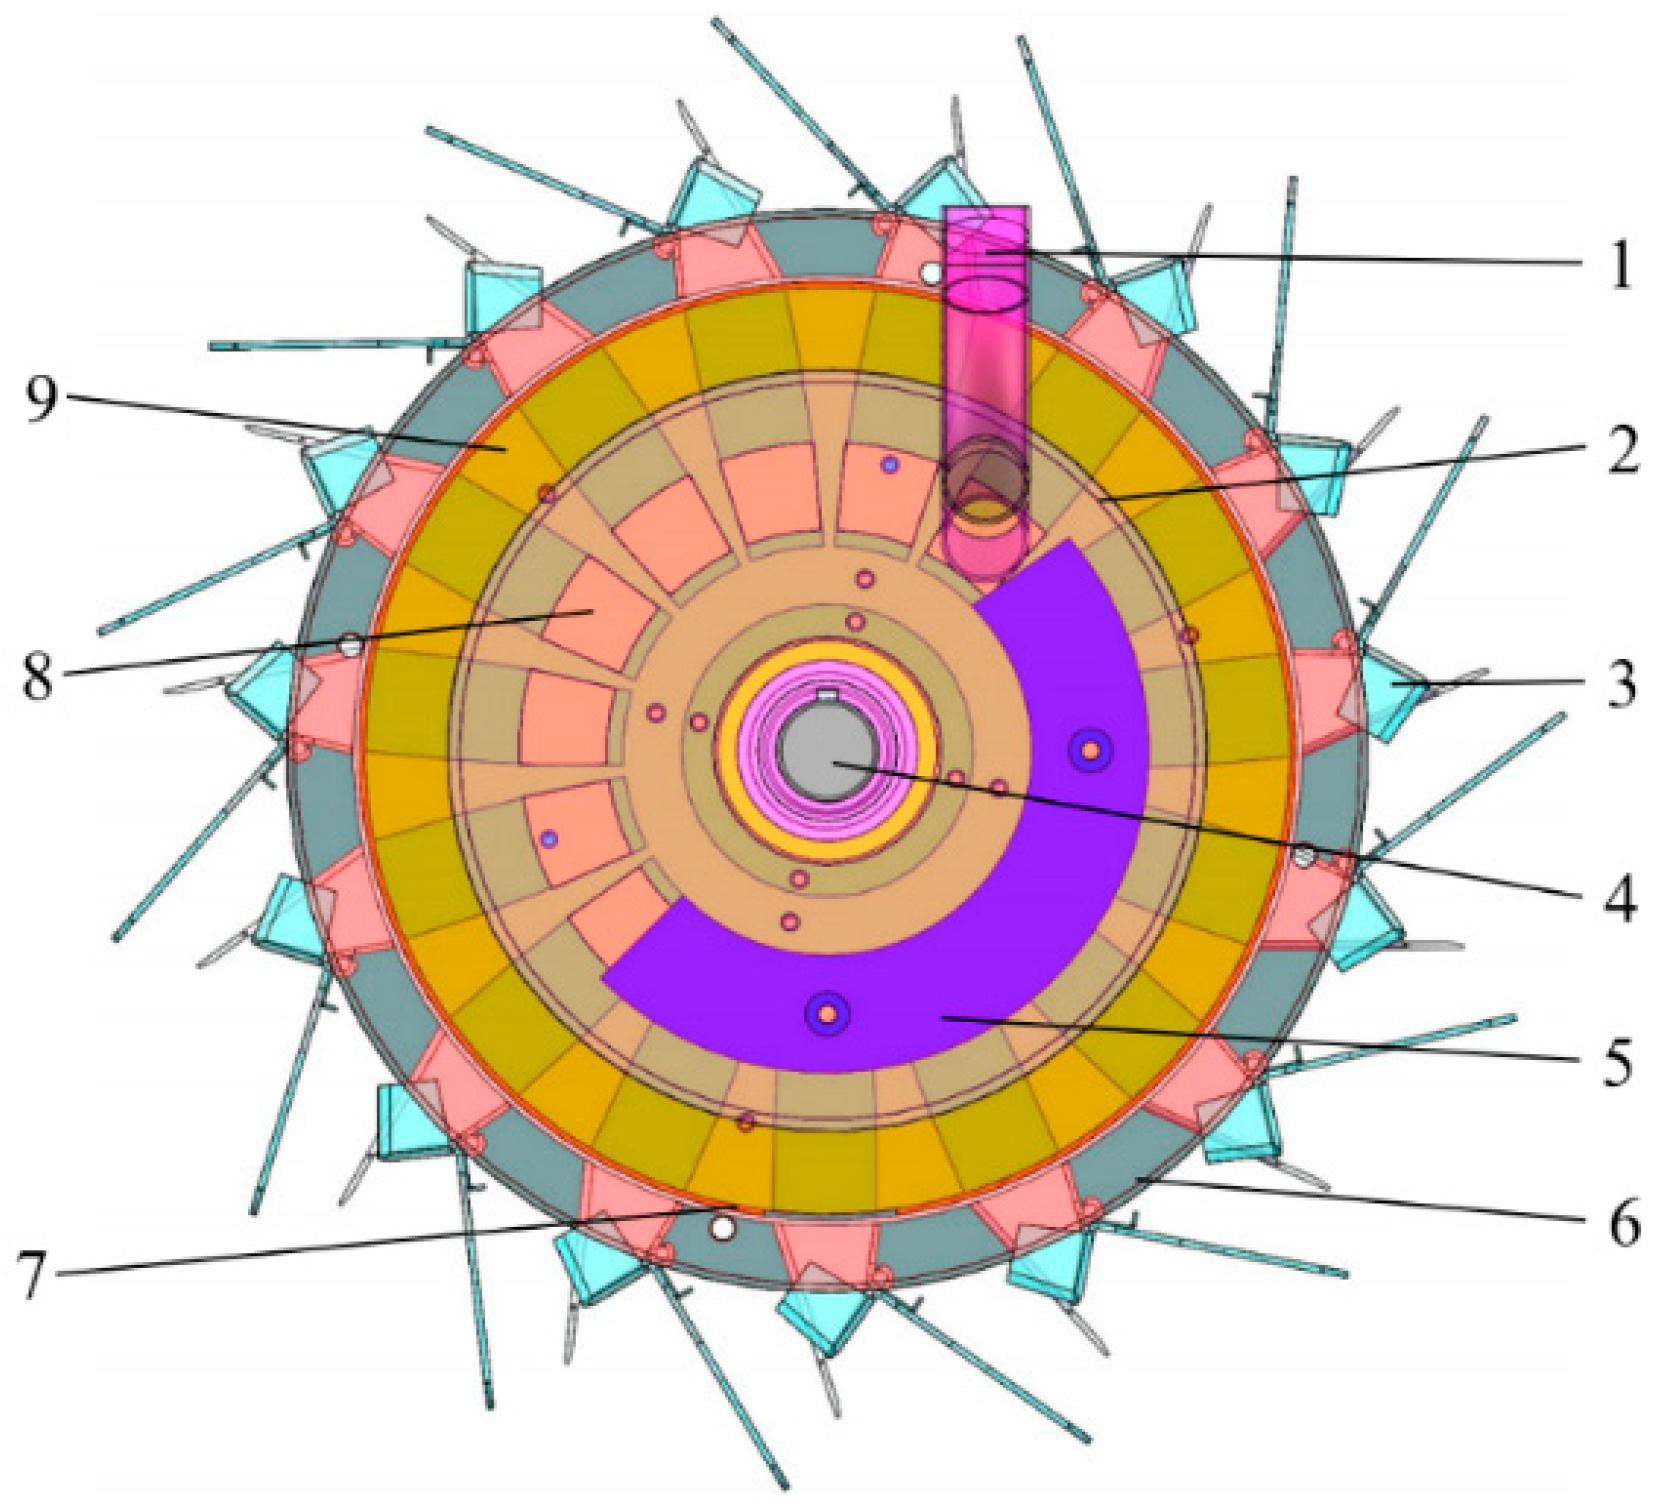
2.5.1. Modeling and Parameterization of the Hole Seeder

The construction of discrete element particles is essential in the simulation. It is important to create similar models with a high degree of similarity in size and shape to bring the simulation results closer to reality. The actual cotton seed is shown in Figure 11a. The lint-free cotton seed is an ellipsoid at one end and a cone at the other. The seed model is created using the Creator module in EDEM software, (EDEM Academic 2018, DEM Solutions Limited, Edinburgh, UK) and seven spheres are aggregated into one seed using the spherical aggregation method, as shown in Figure 11b. A 3D model of the cavity seeder was created in Solidworks. The hole sower model was simplified by removing the duckbill and non-essential parts, saving it as a STEP file and importing it into EDEM, as shown in Figure 11c.
The material and contact parameters required for the simulation are shown in Table 1 [35]. The pellet plant was set up directly above the secondary seeding opening. It produced cotton seed pellets at fixed intervals, with the seeding interval coinciding with the rotation of the seeding disc to ensure that adjacent seeds entered the adjacent compartment, and the initial seeding speed was set at 3 m/s. A transparent inoculum box below the hole sower was used to count the cotton seed pellets, replace the duckbill, and evaluate operational performance.
The simulation set the cavity seeder speed to 40 r/min, corresponding to a forward speed of 3.96 km/h. The seed was set to an initial speed of 3 m/s. The fixed time step was set to 10.0078% of the Rayleigh time step, the target save time interval was 0.01 s, and the mesh size was 2Rmin, i.e., 1.7 mm.

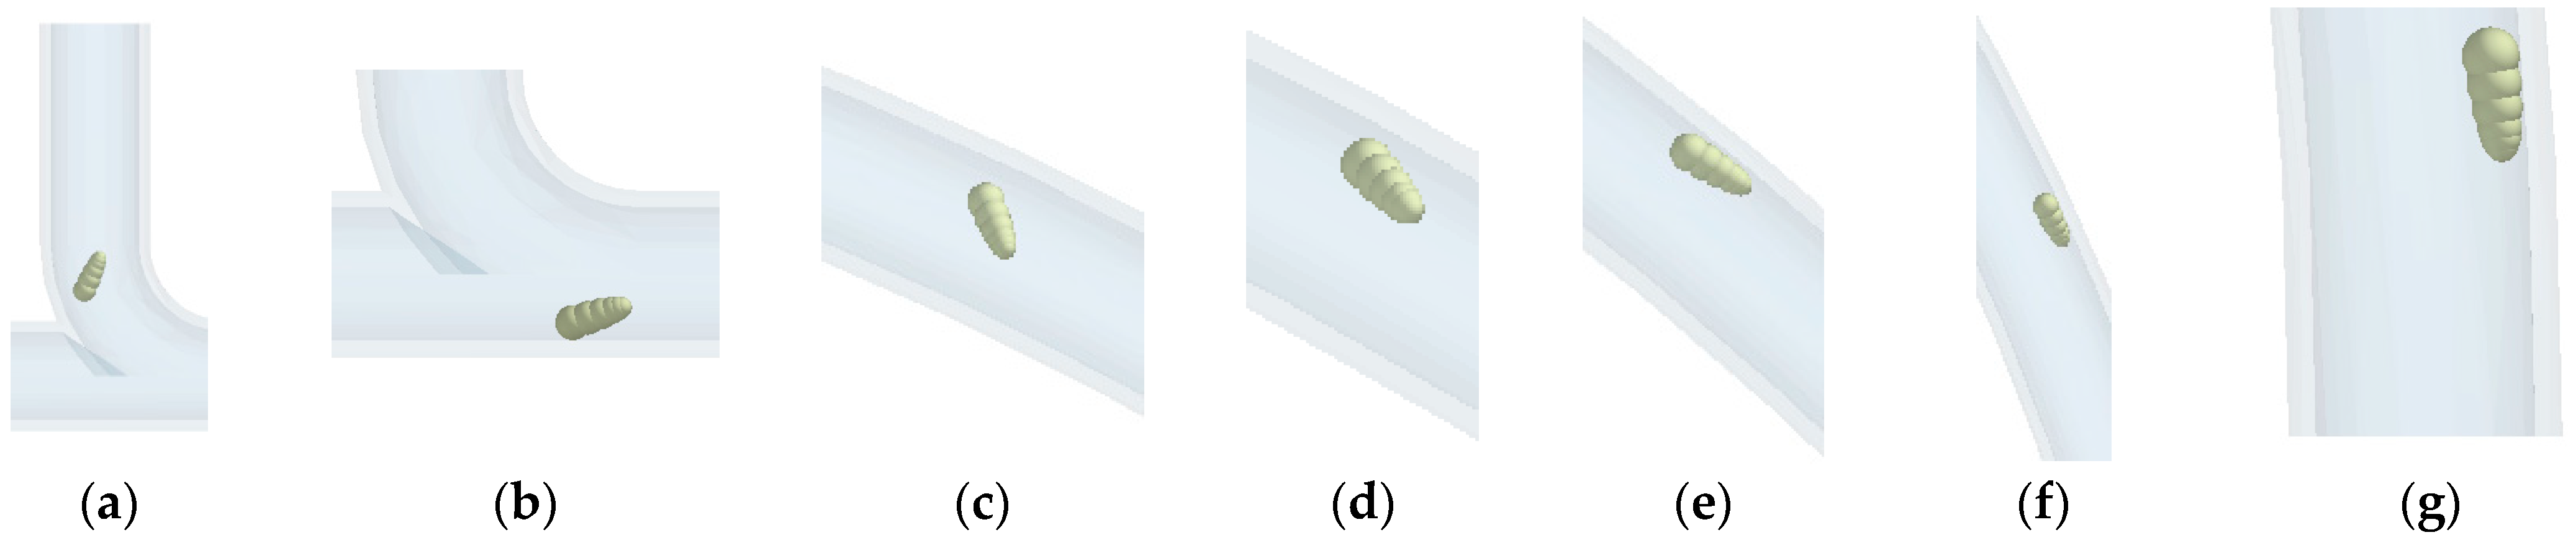
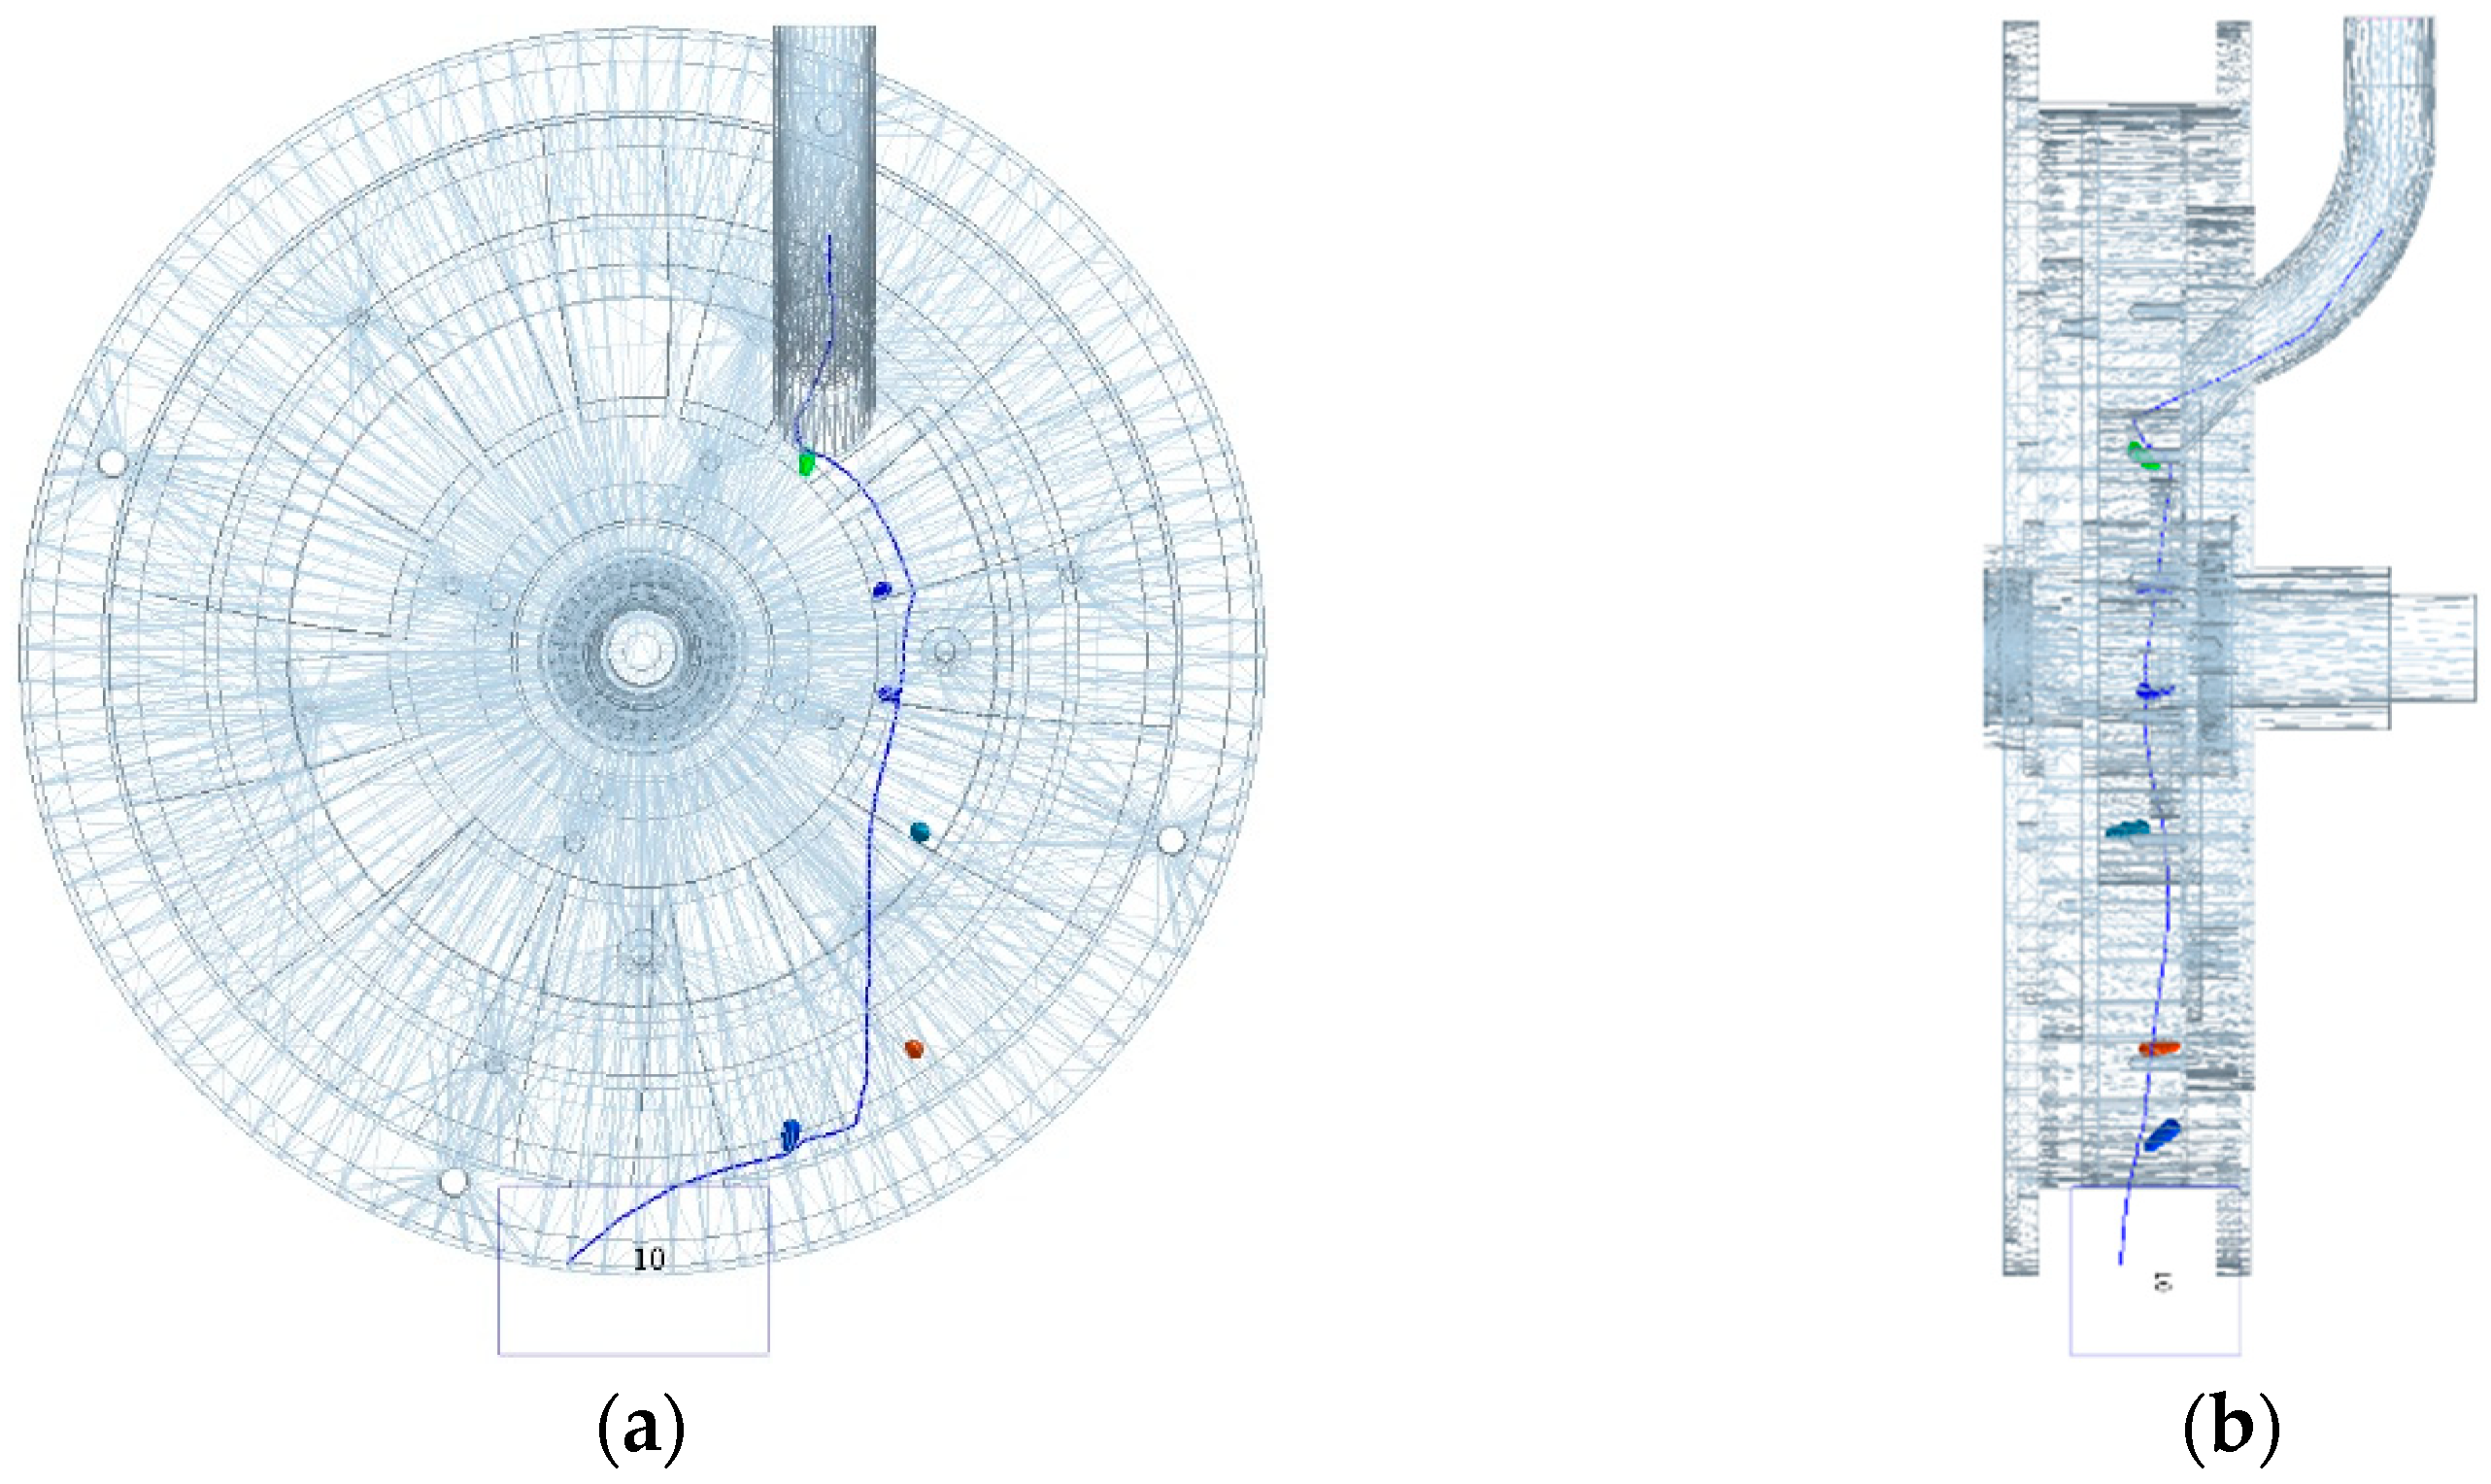
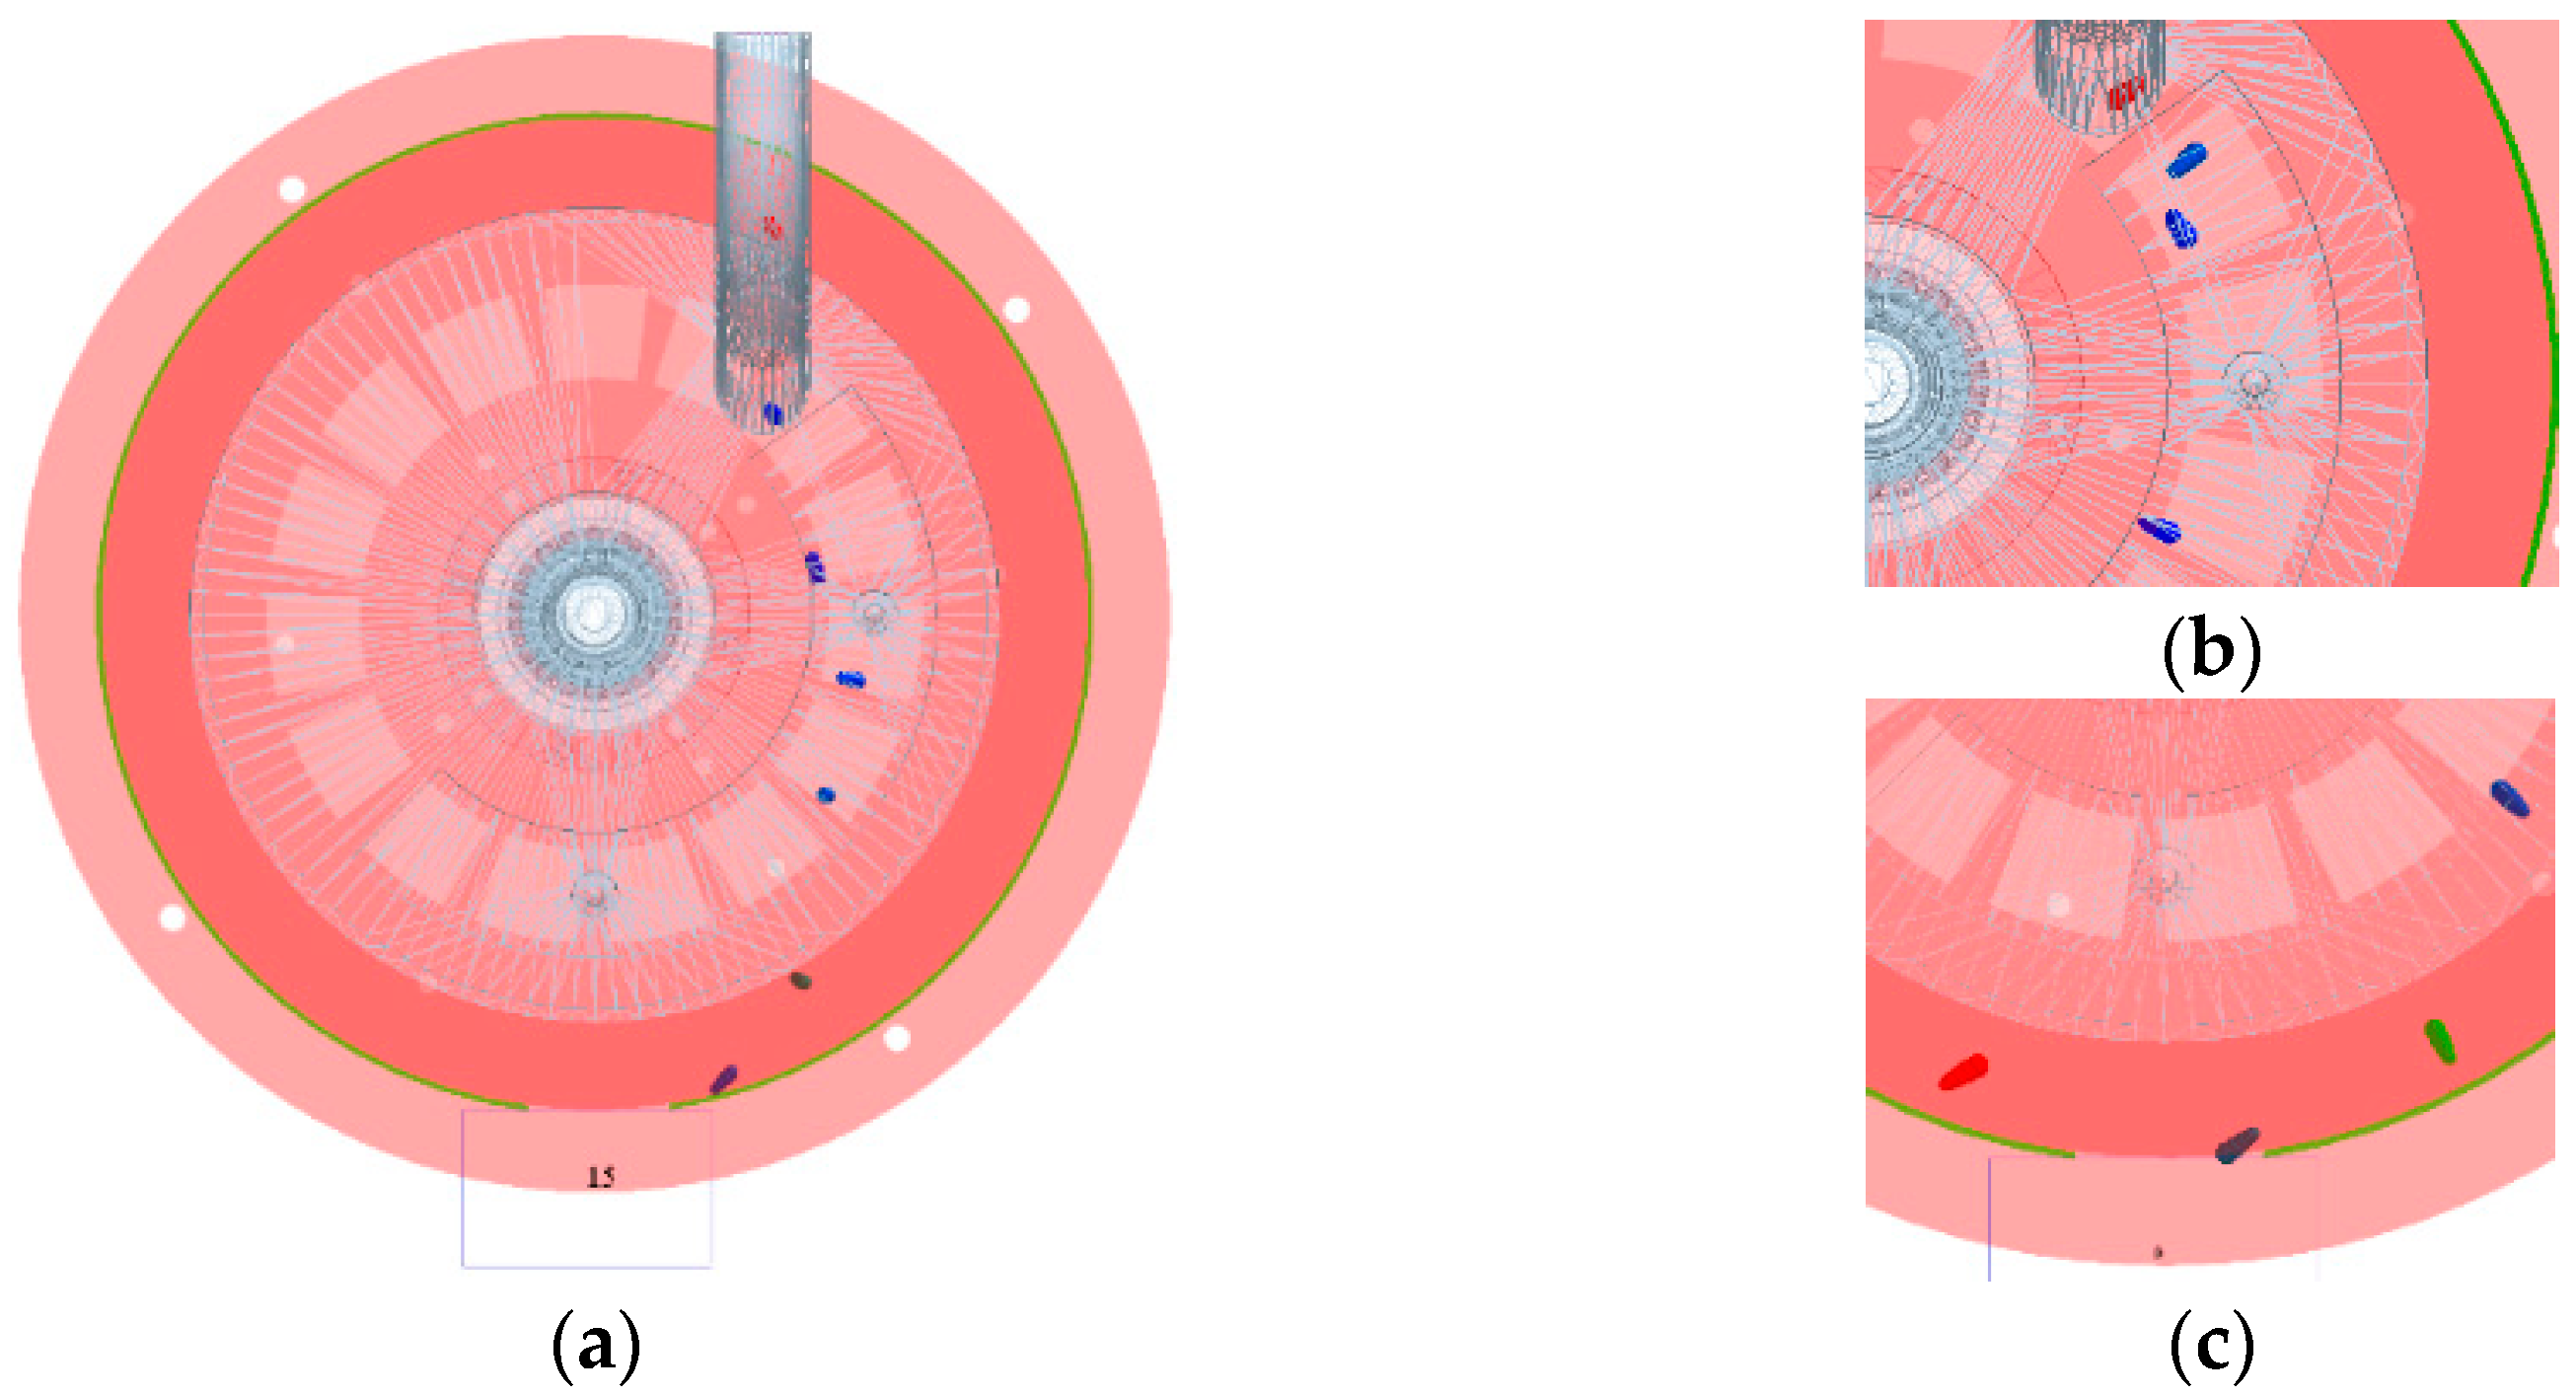
2.5.2. Seed Transport Trajectory Analysis

In order to understand how the seeds move inside the hole sower, the Analyst module was selected in EDEM, and Manual Selection was added to Set up; the cross cursor was used to select seed number 10 as the object of study in the model and Stream All Steps was checked to show the entire trajectory curve, as shown in Figure 12 [36]. If the seeds enter the seed guide smoothly, the seeds are first positioned close to the inner ring of the seed compartment when the compartment carrying the seeds is rotated from above to horizontal; when the compartment carrying the seeds is rotated from horizontal to below, the seeds move along the side plate of the compartment from the inner ring to the outer ring; the seeds moving to the outer ring collide with the retaining ring and are then carried by the side plate on the other side of the compartment to the gap in the retaining ring. The side plate then carries the seed on the other side of the divider to the gap in the retaining ring [37].

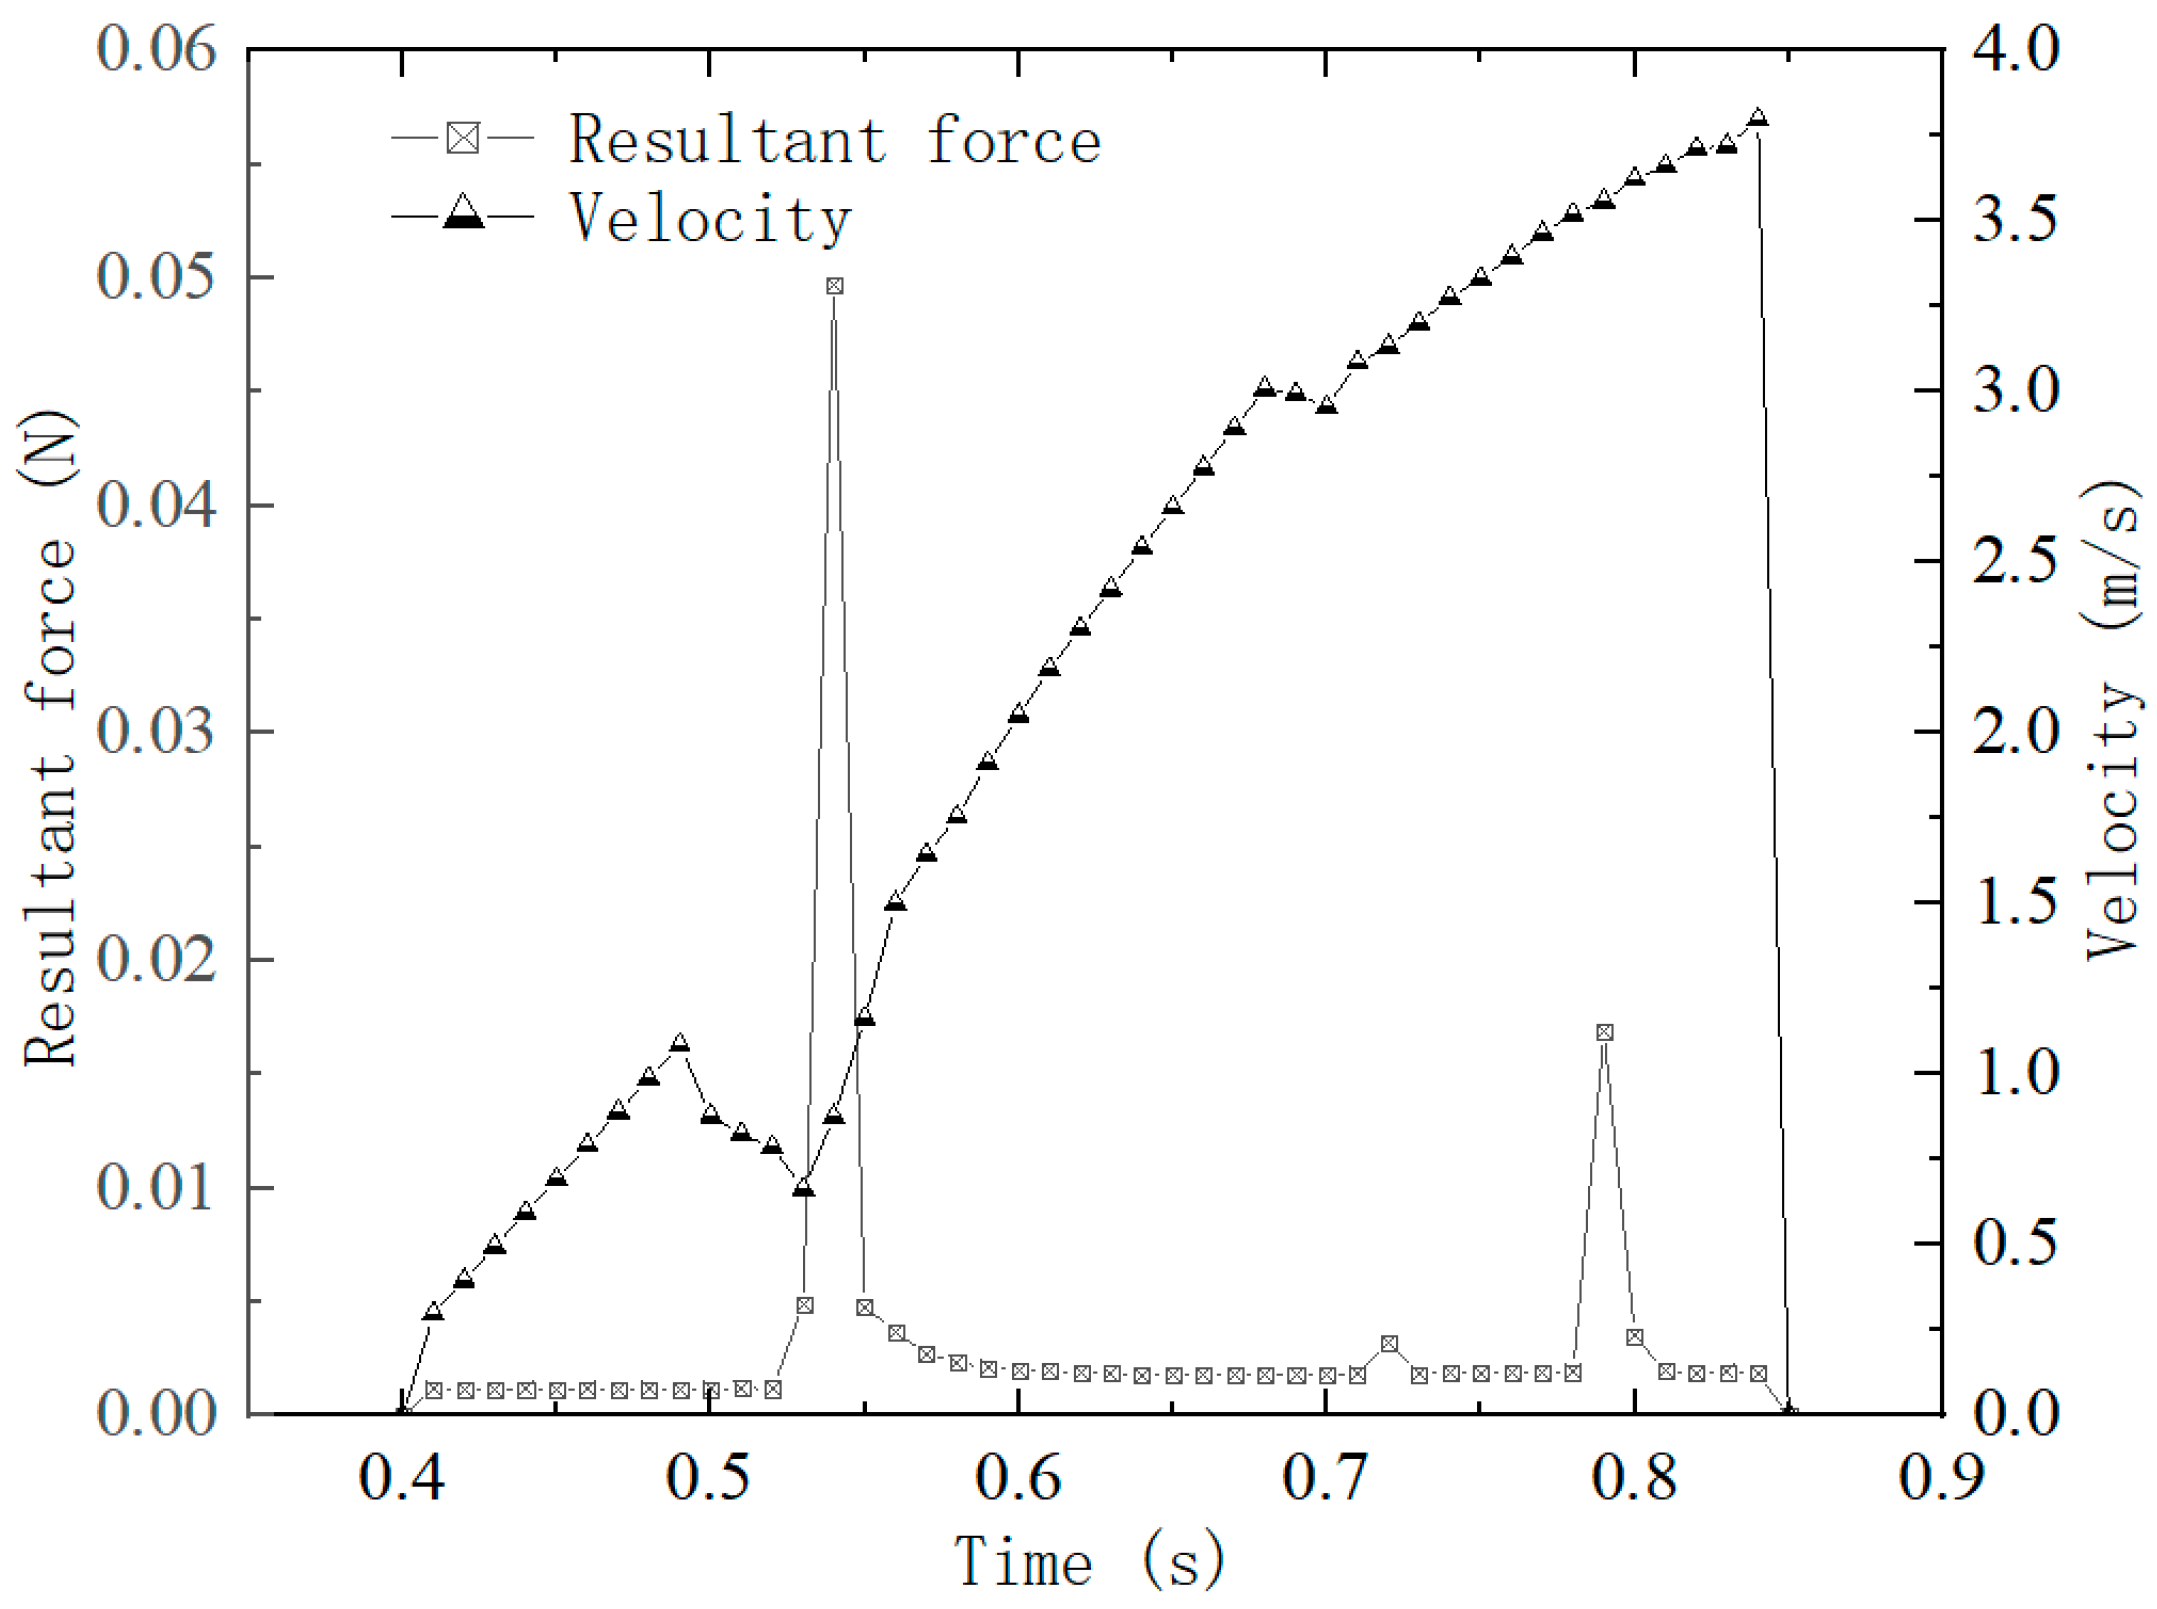
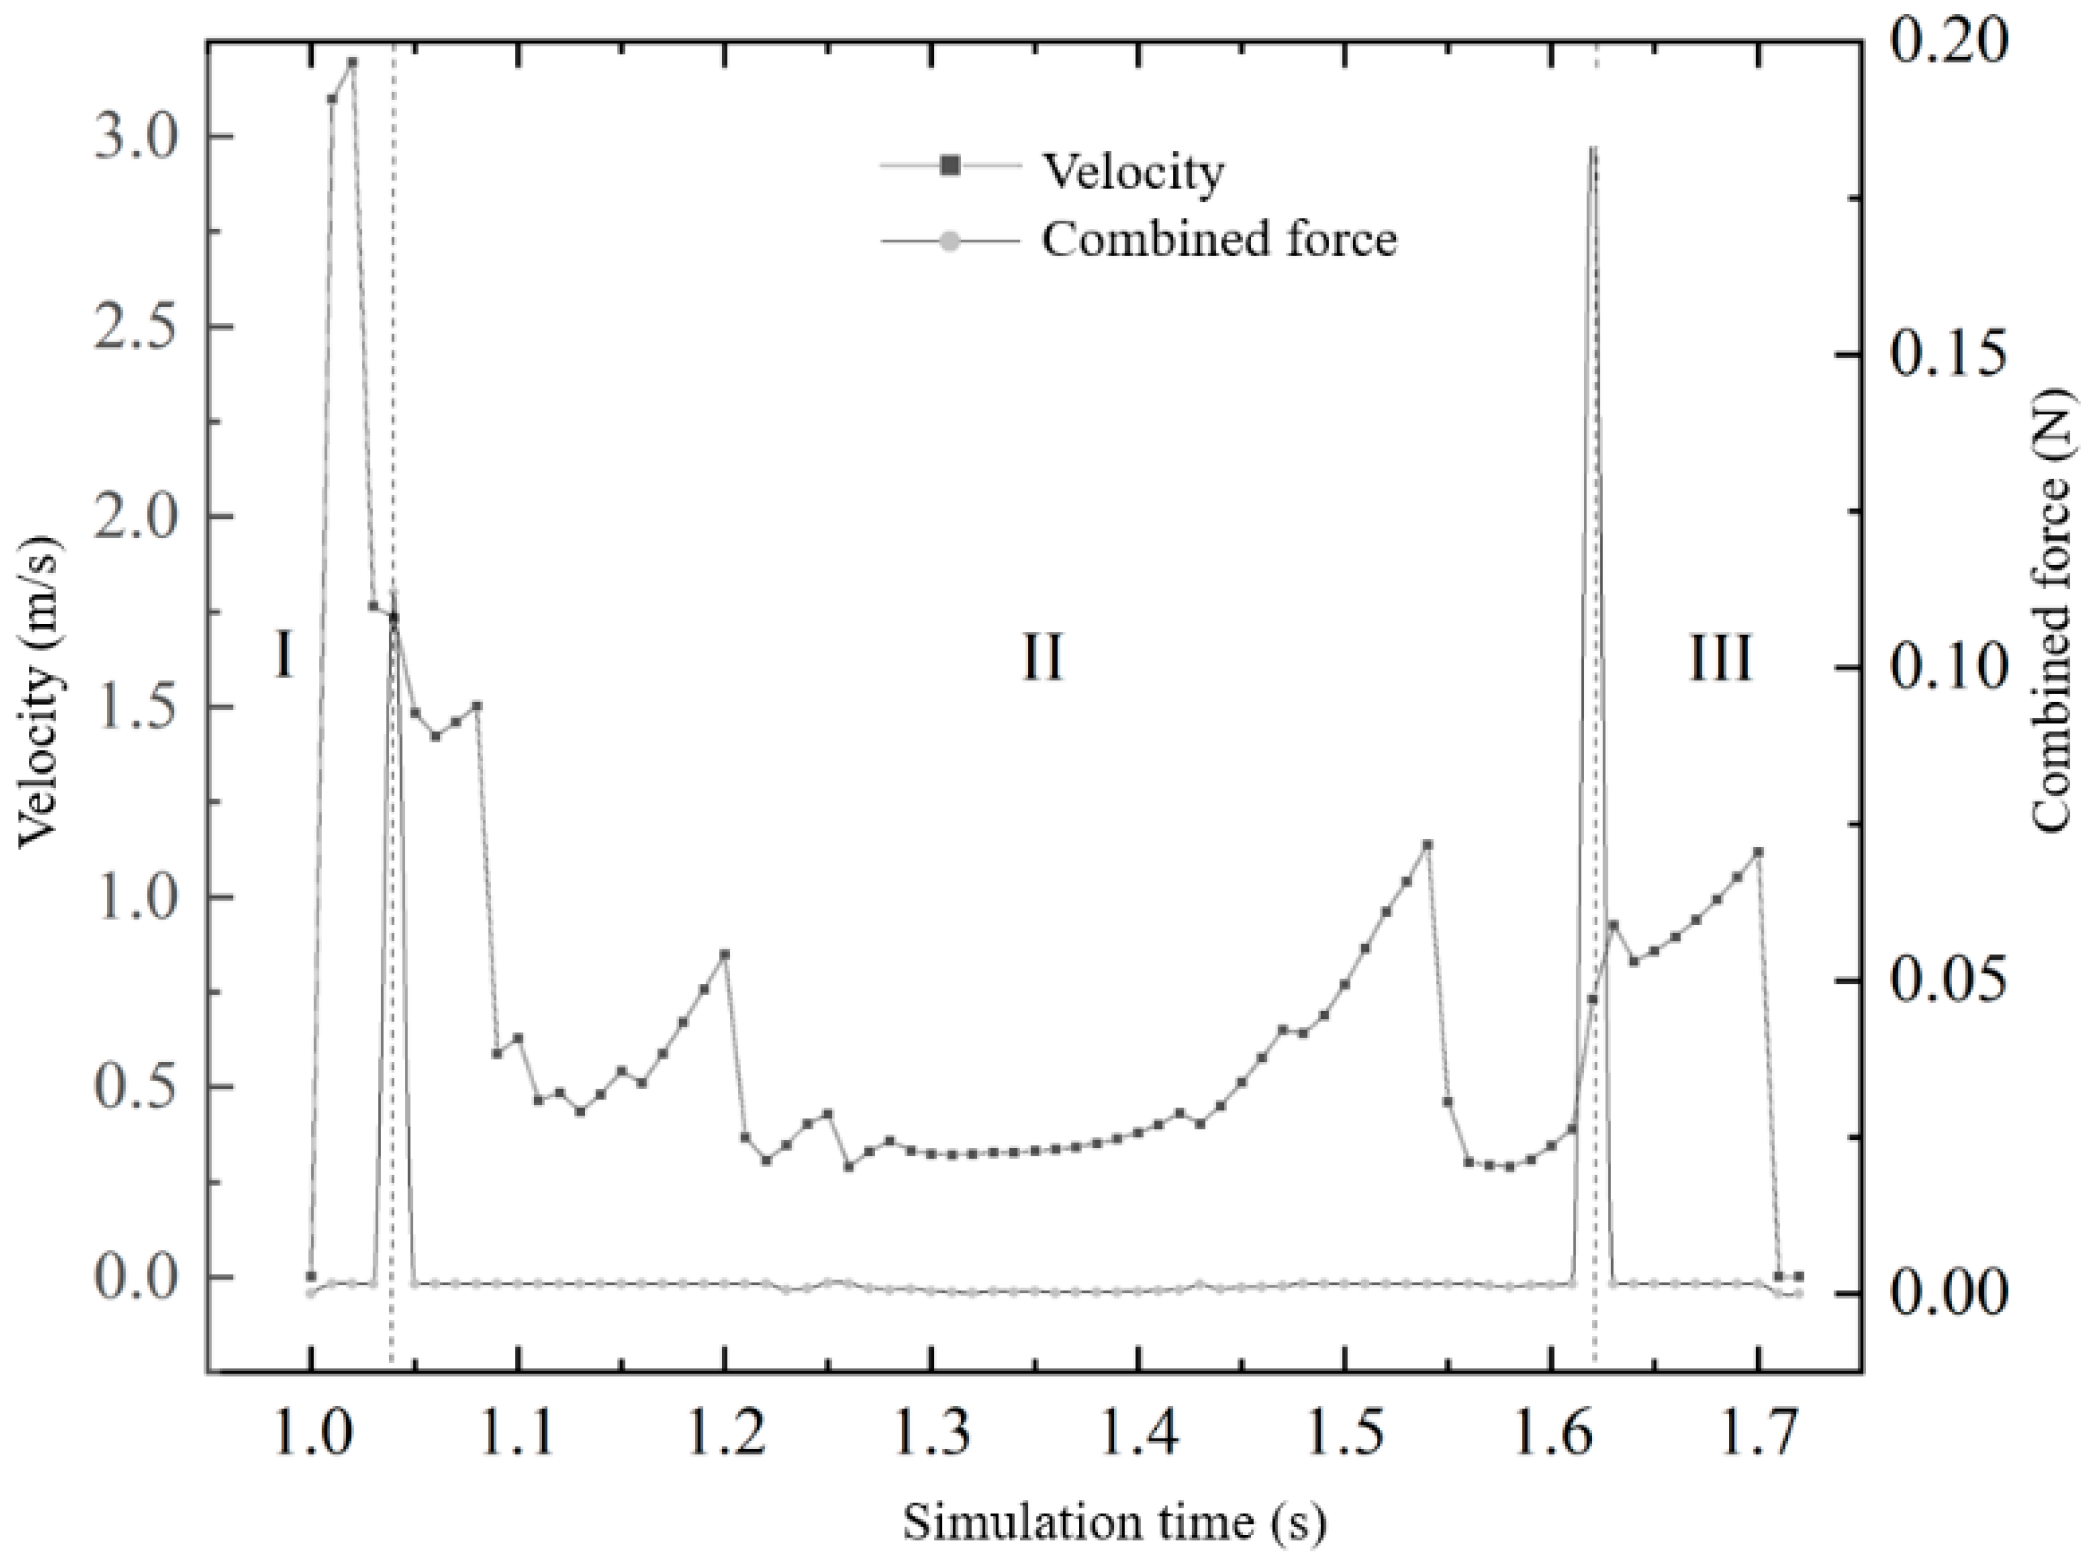
2.5.3. Analysis of the Combined Seed Force and Velocity Variation

The whole process from seed generation to discharge is shown in Figure 13, divided into three stages: seed drop zone I, seed follow zone II, and seed discharge zone III. The interval 1–1.04 s is the first stage. Since the initial speed of the generated seeds is set to be fast, the seeds are only under the action of gravity (0.0016 N), and quickly enter the hole seeder through the seed guide port, and the seeds collide violently with the bottom plate of the seeding grid. After that, the speed decreased sharply, from 3.1 m/s to 1.7 m/s and then to 0.6 m/s, and the resultant force was 0.11 N, which showed a sudden state in the figure. The interval 1.05–1.61 s is the second stage, the seed speed is at a low level, when the seeding disc rotates from the top to the horizontal, the seeds collide and rub slightly with the side plate of the seeding grid, and the speed increases slightly and then decreases, so the resultant force fluctuates slightly at this stage, and the speed of the seeds in the seeding grid gradually increases to 1.1 m/s when the seeding disc rotates from the horizontal to the bottom, and decreases to 0.3 m/s when it reaches the bottom. The interval 1.61–1.7 s is the third stage. At this time, the speed is at a low level. The seeds are accelerated to 0.9 m/s by the side plate of the sorting grid, and the resultant force is 0.18 N, and the seeds are discharged from the gap of the retaining ring. After the seeds are separated from the hole seeder, they are accelerated to 1.11 m/s under the action of gravity, and the seeding trajectory is similar to the horizontal throwing motion.

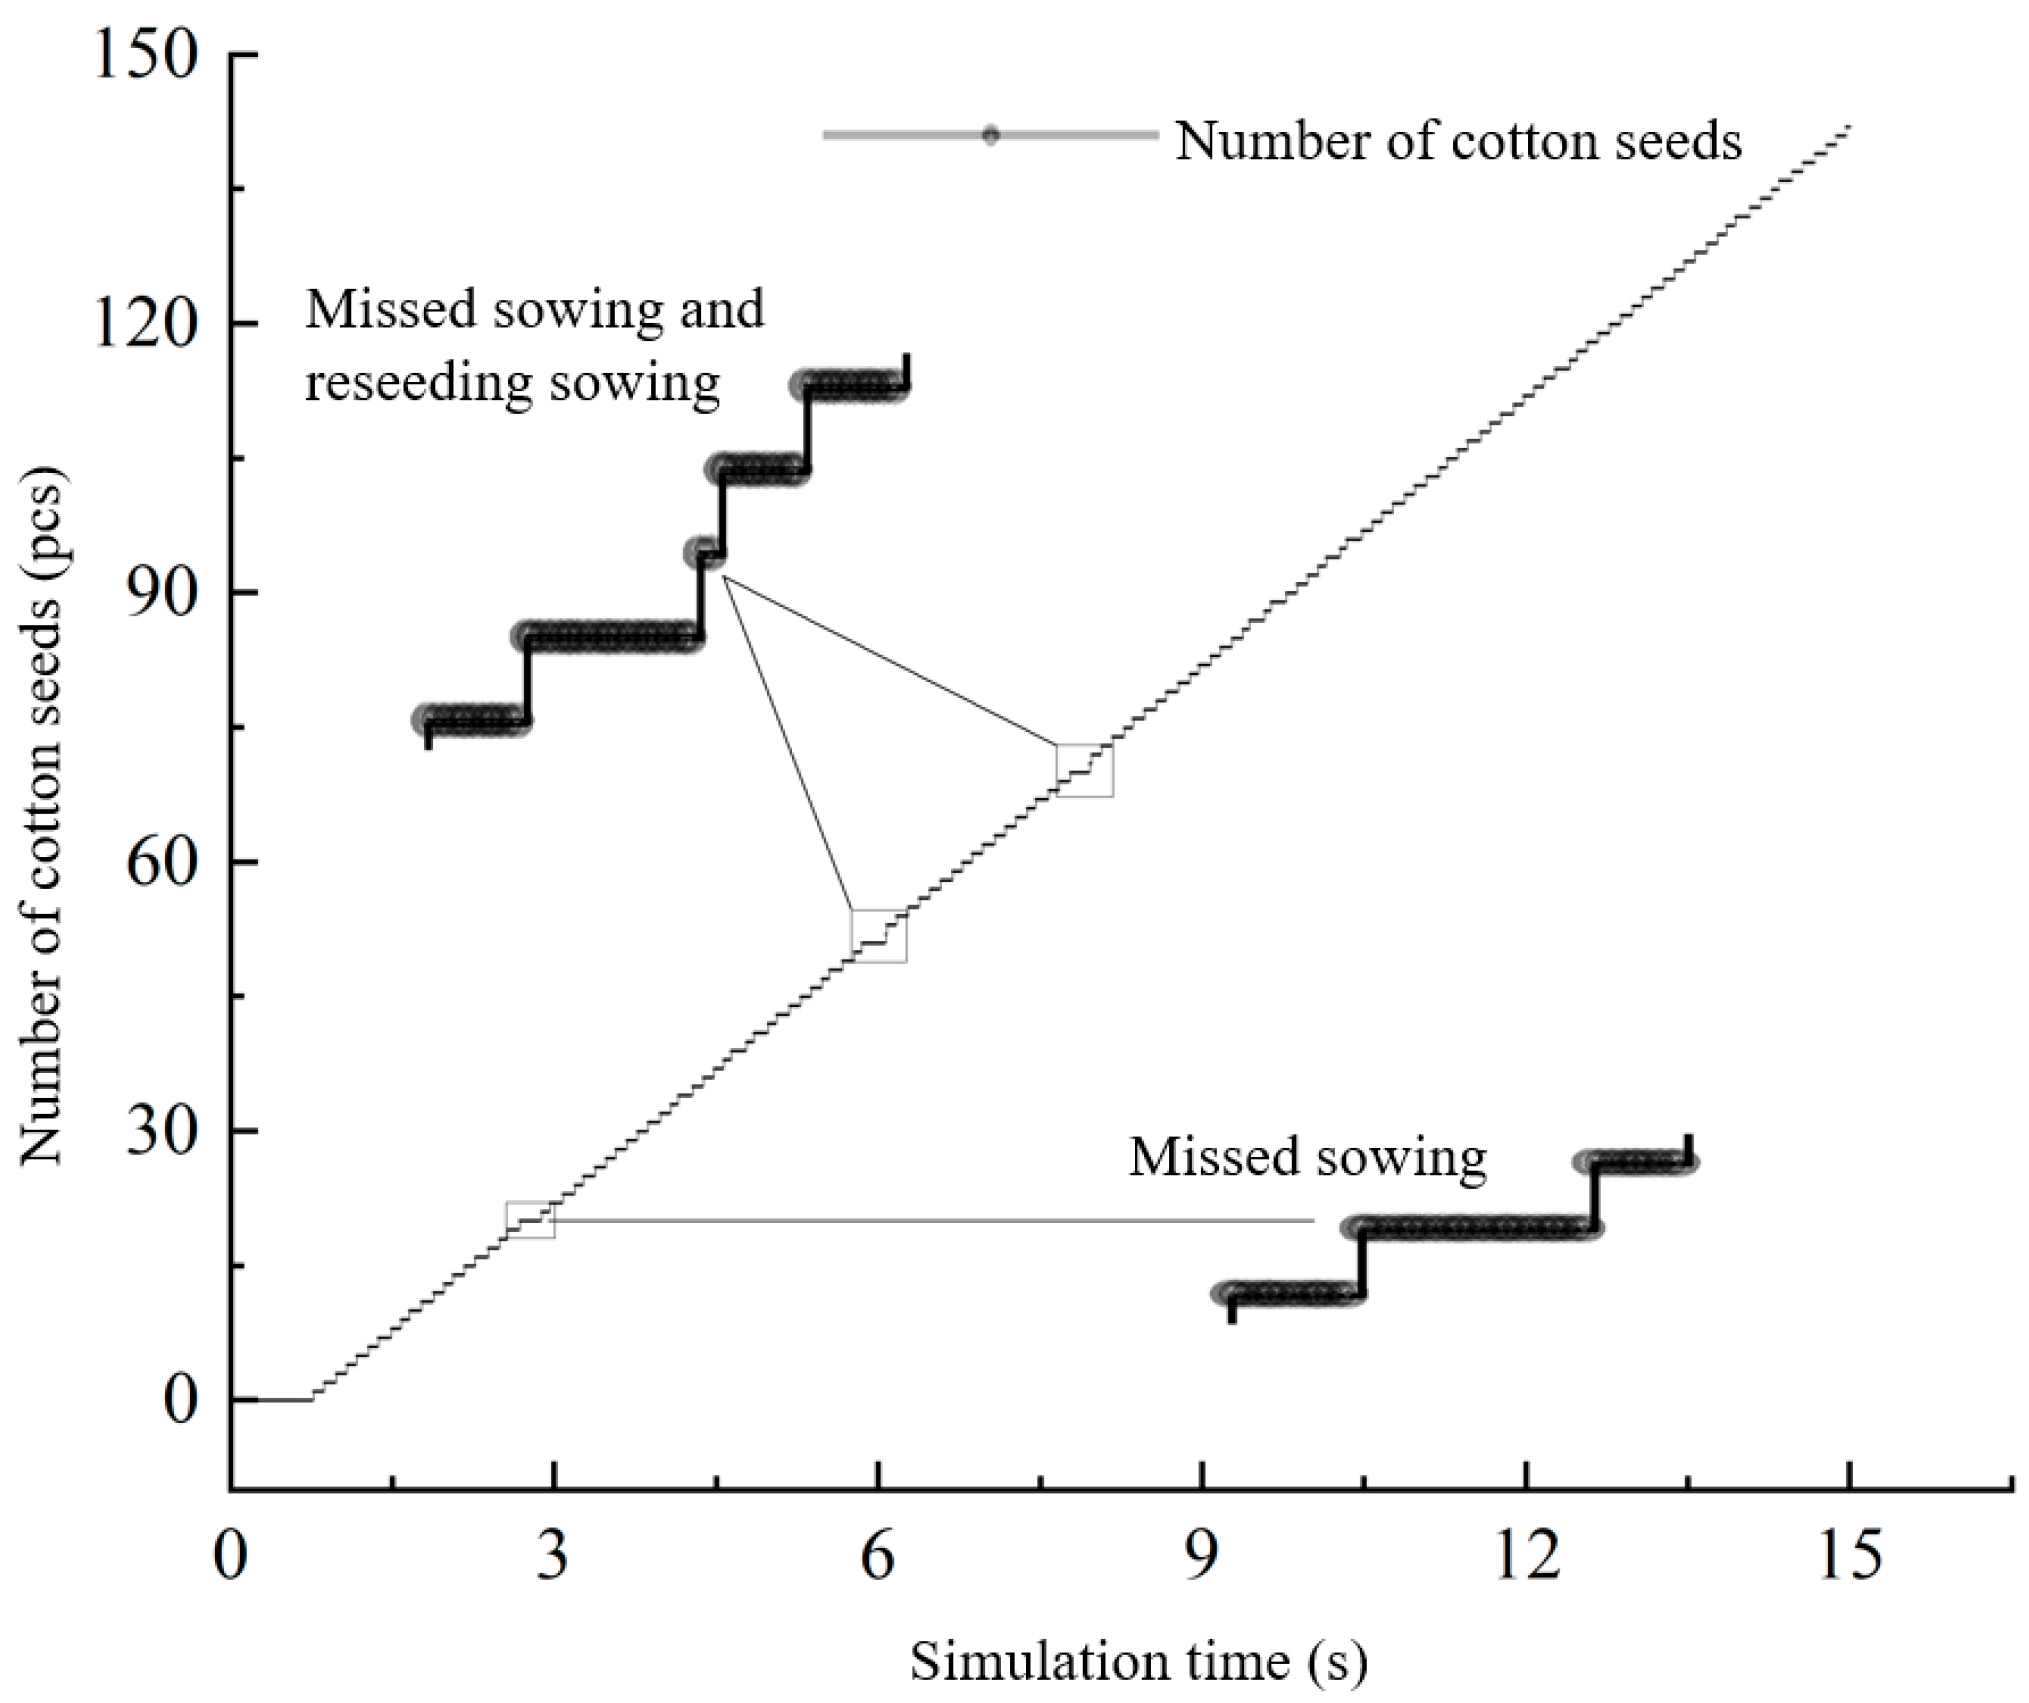
2.5.4. Seeding Performance Analysis
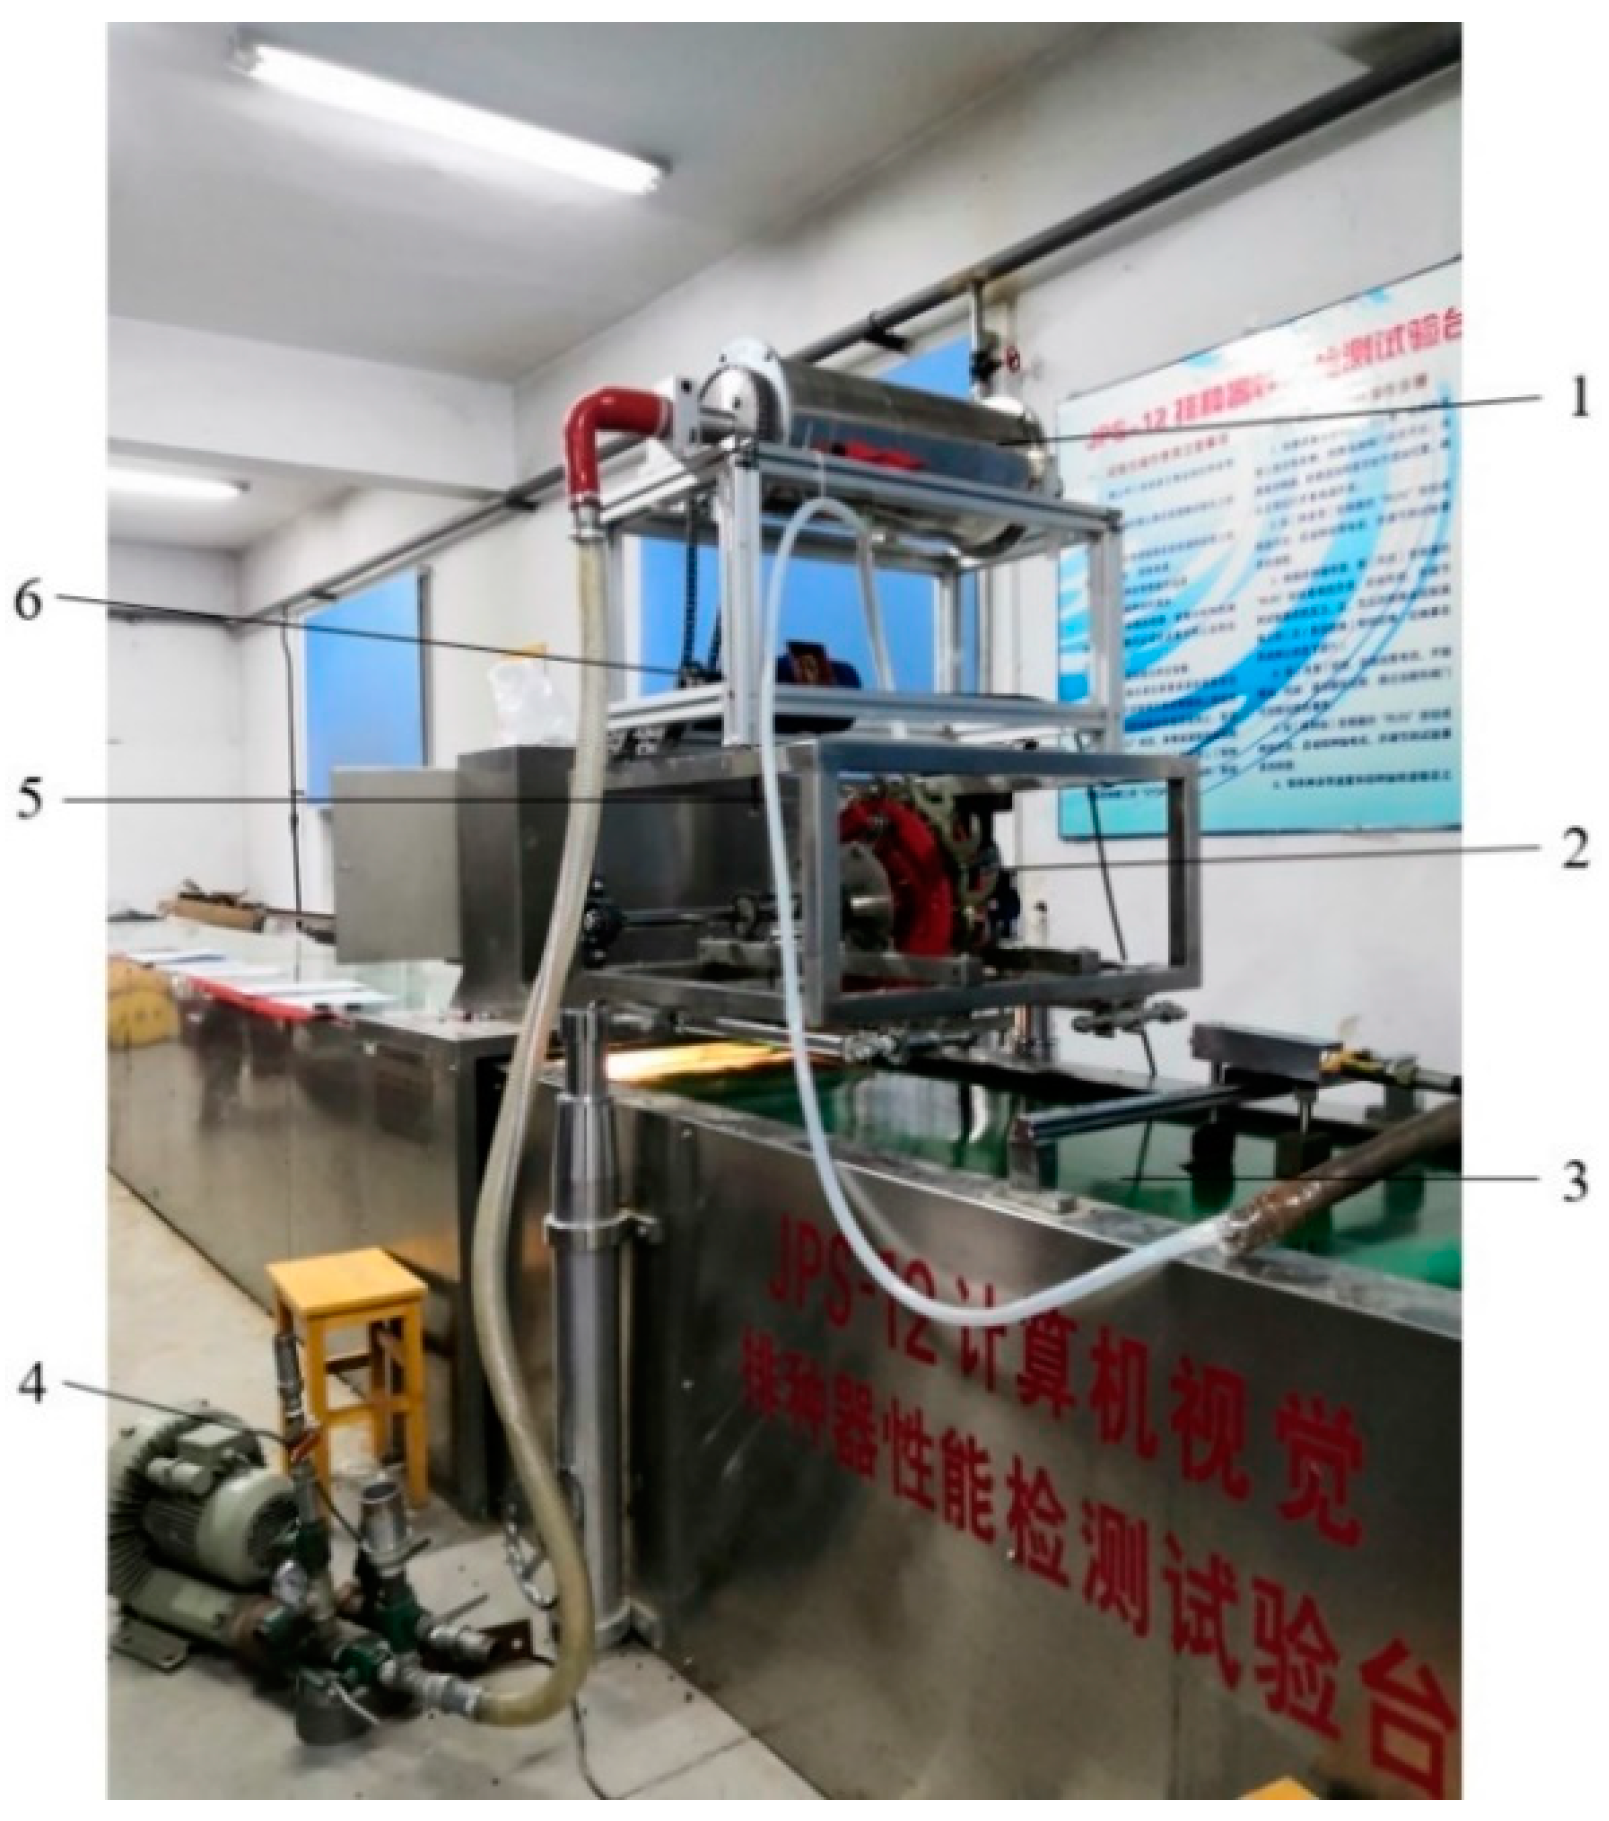
One seed per hole is a requirement for precision sowing, and missed seeds and replanting can reduce the compliance rate. As shown in Figure 14, the seed distribution in each compartment of the hole sower can be observed to get a clear picture of the seeding results. This moment is t = 6 s; there is the phenomenon of omission and resowing; resowing occurs when the omission generally also occurs; the reason is that if the last seed and the seed compartment bottom plate collision rebound back into the seed mouth, and the next seed at the same time falls into the same seed compartment, then the former seed compartment will have no seed. The latter seed compartment will have two seeds. This is because if a seed is rotated with the seed divider to the notch in the retaining ring before it collides with the ring and bounces back larger and skips the notch, no seed will be discharged at the current moment. This seed goes into the next weekly cycle with the seed divider, and the newly produced seed enters this divider, and only resowing occurs at the point of rotation to the gap in the retaining ring. In addition, the simulation does not show any successive omissions or resowing, which indicates that the simulation parameters are reliable [38].
In order to analyze the simulation results, a Grid Bin Group of suitable size was set up at the notch of the retaining ring under the hole sower, and the number of seeds discharged from this area was recorded throughout the simulation.
As shown in Figure 15, the graph is a horizontal line at 0–0.76 s, at this time, no seeds have entered the gap of the retaining ring, and the number of seeds discharged after that increases along a linear step. During the simulation process, the speed of the hole seeder is constant, which means that the time for each sub-grid to pass through the gap area is the same. Further analysis of the partial enlarged image shows that the short horizontal line rises after that, indicating that single cotton seeds are discharged from the sorting grid within this time range; the long horizontal line rises after that, indicating that no seeds are discharged from the gap in the sorting grid within this time range. At this time, the phenomenon of missing seeding occurs; after the long horizontal line, it jumps up in a short time, indicating that no seeds are discharged from the previous sub-seed grid within the time range, and more than one seed is discharged from the gap in the latter sub-seed grid, and reseeding occurs at this time. In the figure, there is only a missed broadcast at 2.78 s, and at 6 s and 7.9 s, both missed broadcasts and replays occur, and the rest of the time is qualified. Based on this, the seeding performance can be accurately described, and the missed seeding index, qualified index, and replaying index under various simulation conditions can be obtained.

2.6. Bench Test

The bench test simulates the field operation in the laboratory, and the data obtained can be used to guide the field test.

2.6.1. Test Conditions

The bench test was carried out in the performance testing laboratory of the seed metering device of Shihezi University, and the experimental research was carried out using the JPS-12 type seed metering device (Harbin Autobona Technology Co., Ltd., Harbin, China)performance-testing test bench, as shown in Figure 16. The test device is a self-made air-suction drum-type precision seed metering device. The cotton seed Xinluzao No. 48, after delinting and coating, is selected, and the cotton seed without breakage, is manually screened. The moisture content is less than 5.6%, and the thousand-grain weight is 95 g. The natural angle of repose is 37°, the sliding friction angle is 20.5°.
The power of the seed metering drum is provided by the BWD09-23-0.37 variable frequency reducer. The reducer power is 0.37 kw, the voltage is three-phase 380 V, the input speed is 1400 r/min, and the reduction ratio is 23. Through calculation, the output speed is 0–61 r/min. The power of the frequency converter is 0.75 kw, the input end of the power supply is connected with 220 V two-phase electricity, and the output end is connected with a 380 V three-phase asynchronous motor. The speed of the reduction motor is adjusted through the frequency converter, and then, the speed is reduced through the chain drive. Finally, the purpose of controlling the speed of the drum is achieved. The hole sower speed is matched to the drum speed ratio, and the hole sower speed is adjusted directly by the test stand.
The vacuum inside the metering drum is provided by the high-pressure vortex fan, which connects the negative pressure shaft through the steel wire hose and sucks air. The product is Asiba HG-2200S, with a power of 2.2 kw, a voltage of 380 V, a maximum wind pressure of 36 kPa, a maximum suction pressure of 33 kPa, a flow of 318 m3/h, a motor speed of 2980 r/min, and a rated frequency of 50 Hz. A Delixi 2.2 kw heavy-duty frequency converter is used for control. The input end is connected to 380 V power supply, and the output end is connected to the fan. By adjusting the frequency of the frequency converter, the fan can obtain different speeds, so that there are different negative pressures inside the drum. In this experiment, the negative pressure is detected by a GM520 intelligent digital differential pressure gauge (the pressure measurement range is ±35 kPa), the hose length is 0.3 m, and an L-shaped pitot tube is used. After the seed metering device operates stably for a period of time, the negative pressure inside the drum can be known from the displayed value.

2.6.2. Selection of Test Factors and Evaluation Indicators

According to the theoretical analysis and single-factor test, the influencing factors were determined as follows: speed of the hole sower 36.31~59.45 r/min, negative pressure 1.59~3.27 kPa, hole diameter 3.0~4.0 mm. The evaluation indexes were selected with reference to GB-T6973-2005, and 250 consecutive holes discharged during the stable operation were recorded as one group. The single grain rate and missed seeding rate were selected as evaluation indicators, and each indicator was calculated as shown in Equations (4) and (5) [39].
Y 1 = n 1 / N × 100 %
Y 0 = n 0 / N × 100 %
where n1 is the number of 1 seed in 1 hole; n0 is the number of 0 seeds in 1 hole; and N is the number of holes per group tested, 250.

2.6.3. Central Composite Design

A three-factor, five-level quadratic rotation orthogonal center combination test protocol was used, with speed of the hole sower, negative pressure, and aperture as the test factors and X1, X2, and X3 as the factor coding values. A total of 250 holes were continuously discharged when the split seeding system was in stable operation, and the average value was taken as the test result of the group by repeating the test three times. The single seed and missed seed rates were used as the evaluation index. The test factor level codes are shown in Table 2, and the test program results are shown in Table 3.

3. Results and Discussion

3.1. Analysis of Test Results

The ANOVA of the regression equation was carried out according to Table 4, and the results of the experiment were analyzed using Design Expert 13 to establish quadratic polynomial regression equations between the single grain rate Y1 and missed sowing rate Y0, the test factor codes as shown in Equations (6) and (7), respectively [28].
Y 1 = 89.94 + 1.10 X 1 1.43 X 2 + 0.4057 X 3 0.3625 X 1 X 2 0.5375 X 1 X 3 1.01 X 2 X 3 1.94 X 1 2 1.01 X 2 2 1.43 X 3 2
Y 0 = 5.55 1.58 X 1 + 0.5888 X 2 0.2193 X 3 + 0.1625 X 1 X 2 + 1.49 X 1 X 3 + 1.84 X 2 X 3 + 1.14 X 1 2 + 0.7161 X 2 2 + 0.9283 X 3 2
R2 is a crucial evaluation indicator for determining the linear fit of linear regression. The coefficient of determination for the single grain rate equation was 0.96, indicating that X1, X2, and X3 caused 96% of the variation in Y1; the coefficient of determination for the emission rate equation was 0.85, indicating that X1, X2, and X3 caused 85% of the variation in Y0; so, the actual values of the regression equation were highly correlated with the predicted values. The ANOVA results showed that the main order of influence on the single grain rate was negative pressure > speed of the hole sower > aperture; the primary influence on the missed seeding rate was speed of the hole sower > negative pressure > aperture.
The P-value was used to determine the significance of the regression parameters. The ANOVA table of the regression equation showed that the regression phase coefficients X1, X2, X2X3, X12, X22, and X32 had a highly significant effect on the single seed rate (p < 0.01), while X3, X1X2, and X1X3 did not have a significant effect on the single seed rate (p < 0.05). The regression phase coefficients X1 and X2X3 had a highly significant effect (p < 0.01), X1X3, X12, and X32 had a significant effect (0.05 > p < 0.01), and X2, X3, X1X2, and X22 had a non-significant effect (p > 0.05) on the rate of missed sowing. The equations can be simplified to Equations (8) and (9) after removing the non-significant phase from the model.
Y 1 = 89.94 + 1.10 X 1 1.43 X 2 1.01 X 2 X 3 1.94 X 1 2 1.01 X 2 2 1.43 X 3 2
Y 0 = 5.55 1.58 X 1 + 1.49 X 1 X 3 + 1.84 X 2 X 3 + 1.14 X 1 2 + 0.7161 X 2 2 + 0.9283 X 3 2

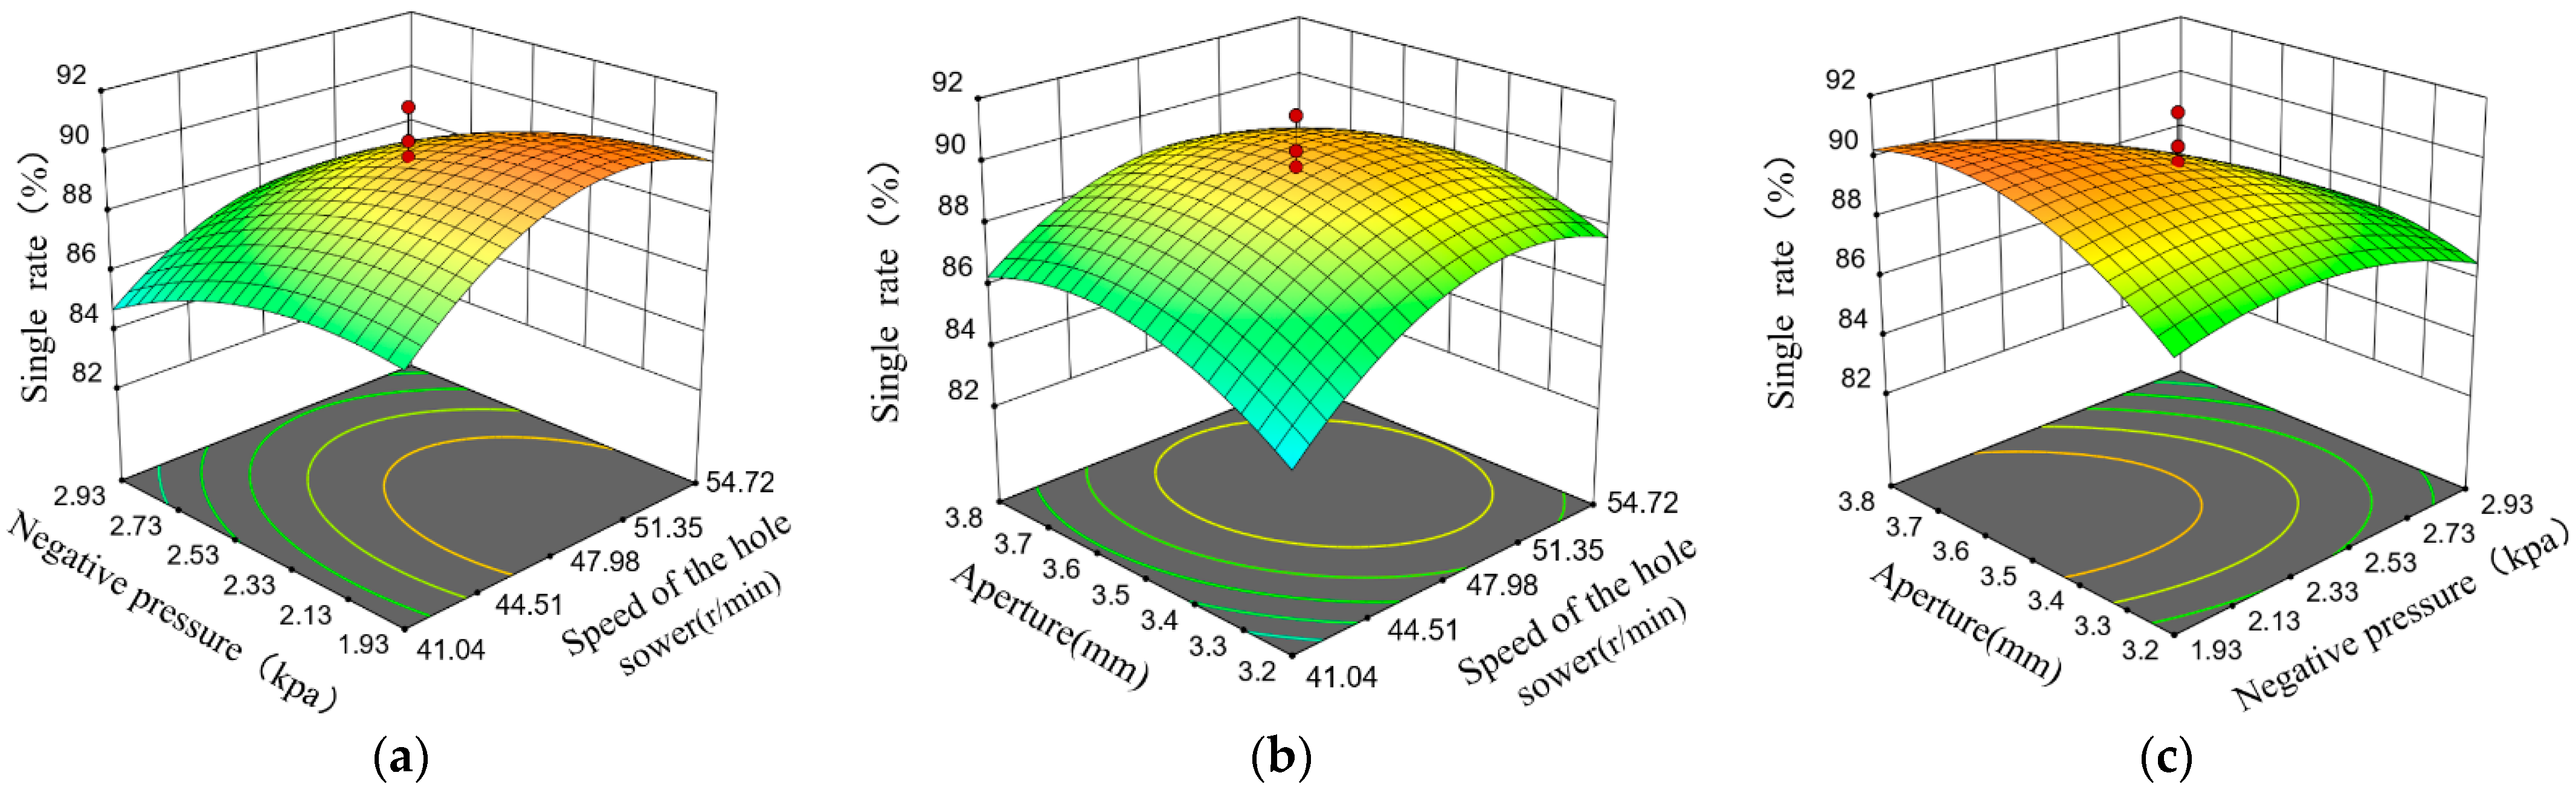
3.2. Analysis of the Impact of Experimental Factors on Evaluation Indicators

The response surface provides a clear picture of the relationship between the test factors and seed dispersal performance evaluation indicators. Using Design-expert 13, the effects of sower speed, negative pressure, and hole diameter on the single seed rate and the missed seed rate can be obtained. As shown in Figure 15, the effect of each test factor on the seed rate is then analyzed [40,41].
The response surfaces for hole size 3.5 mm, hole sower speed, and negative pressure on seed rate are shown in Figure 17a. The seeding rate decreases with increasing negative pressure when the speed of the cavity seeder is at the central level. When the negative pressure is at a central level, the seed rate increases and then decreases as the cultipacker increases, with the cultipacker speed being too high for the seed to be discharged properly through the gap.
The response of hole seeder speed and aperture size to seed rate at a negative pressure of 2.43 kPa is shown in Figure 17b. When the hole diameter exceeds 3.5 mm, the adsorption force increases due to the increase in the diameter of the suction hole, which increases the number of seeds adsorbed and reduces the seed rate. When the aperture diameter is at the central level, the seed rate increases and decreases as the hole sower’s speed increases. When the speed of the hole sower is lower than the speed of the drum, each hole stays in the seed filling area for a longer period and the chances of multiple seeds being adsorbed in the hole increase.
The surface of the response of negative pressure and aperture size to seed rate at 47.98 r/min is shown in Figure 17c. When the pore diameter exceeds 3.5 mm, the diameter of the suction pore increases, the adsorption force decreases, and the number of seeds adsorbed in a single pore decreases even if the adsorption force is too small, resulting in no seeds being taken. When the pore diameter is at the central level, the seed rate decreases significantly with increasing negative pressure because the adsorption force of each pore type increases and the probability of multiple seeds per pore increases.

3.3. Parameter Optimization and Verification

In order to find the best combination of parameters generated by the interaction factors, the multi-objective optimization of the regression model of seed dispersal performance was solved with the maximum single seed rate and the minimum missed seed rate of the seed disperser as evaluation indicators, with the constraints shown in Equation (10) [42].
{ max Y 1 min Y 0 s . t . { 54.72   r / min X 1 41.04   r / min 2.93   kpa X 2 1.93   kpa 3.8   mm X 3 3.2   mm
At a speed of the hole sower of 49.84 r/min, a negative pressure of 1.96 kPa and an aperture diameter of 3.61 mm, the seed rower had a single seed rate of 90.8% and a missed seed rate of 4.7%. To verify the correctness of the optimization results, five repeatability tests were carried out at a speed of the hole sower of 49.84 r/min, a negative pressure of 1.96 kPa, and an aperture diameter of 3.5 mm to take the average values, resulting in a 90.9% single seed rate and a 4.3% miss rate for the seeder. The results of the validation tests show that the optimization results are credible.

3.4. Discussion

The results show that the simulation model of the split seeding system established in this paper can predict the running performance of each part of the device at work, and this research can provide important theoretical and method support for the design and parameter optimization of agricultural machinery and equipment. This paper innovatively proposes a split seeding system for high-speed operation under film, which is very different from previous research. The hole seeding device is used for seeding under high-speed membrane, and after the two are separated, the cotton seeds are effectively transported through the seeding pipe, which can avoid the impact of ground vibration on the drum seeding. In addition, Wang et al. [43] designed a hill-drop pneumatic central cylinder direct-seeding machine for seeding ten rows at a time. The results show that the optimal parameters are 2.0 kPa vacuum, 2.0 mm diameter of straight hole, and 30 r/min of drum rotation speed. The probability of each hole (2 ± 1) is 95.3%, and the probability of missing seeding is 2.0%. Wang et al. [44] designed a built-in gas-assisted high-speed precision corn seed meter. The results show that under the conditions of forward speed of 13.1 km/h and negative pressure of 4.75 kPa, the qualified index of seed spacing is 91.18%, and the coefficient of variation of seed spacing is 12.32%. Lei et al. [30] used the DEM-CFD coupling method to numerically study the gas-solid flow in the seed metering device of the gas-assisted centralized seed metering system. They performed a comprehensive analysis. All kinds of precision seed metering devices are in the research and development stage, because the problems faced by different research groups are different. The overall goal of our research group is to study the split seeding system for high-speed sowing of cotton seeds under the film in Xinjiang. There is a division of labor and cooperation among members. Some members study the seeding roller, some members study the positive pressure air-conveying cotton seeds, and some members study the hole seeding. The limitation is that the whole split seeding system cannot be simulated as a whole. Each part is an ideal state when it is studied separately. In future research, we will try to carry out the co-simulation of the whole to make it closer to the actual working condition.
In this study, we propose a split seeding system and verify it in various aspects through simulation and experiment to prove the feasibility as well as reliability of this precision seeding system. Previous studies have only conducted experimental studies on various parts, such as air-suction roller seed discharger, air-assisted seed centralized metering supply system, and hole sower, but no scholars have ever formed this whole into a sowing system.

4. Conclusions

In the study, a split seeding system was proposed based on the agronomic requirements for precision sowing of cotton on film in Xinjiang. By studying the components, high-speed precision sowing of cotton seeds was achieved. The main research findings are as follows.
The internal roller and the adiabatic block of the seed sower are increased to reduce the energy consumption of the fan; the staggered arrangement of the holes improves the operating speed; the changes in the gas chamber inside the roller are grasped through the flow field simulation; the gas flow velocity is higher at the negative pressure axis and the type holes, and the values of the flow velocity and the pressure are closer for the type holes at different positions in the same column.
The coupled CFD-DEM method was used to simulate the feasibility of transporting cotton seeds through the seed transfer tube. It was verified that the seed transport tube was loaded with positive pressure airflow, which could reduce the uncertainty of movement during the seed transport process, and the seeds collided less with the tube wall under the action of airflow, and the movement trajectory had a better fit with the shape of the seed transport tube on the whole.
The EDEM simulation of the hole seeder model was used to understand the velocity and trajectory of the seed in the hole seeder. Analysis of missed and re-seeded seeding of the hole seeder according to the simulation process was performed. The larger the initial velocity of the seed entering the hole sower, the higher the rotation speed of the hole sower and the lower the single seed rate.
The split seeding system was validated in bench tests. A three-factor, five-level quadratic rotating orthogonal center combination experimental design was carried out using the hole sower speed, negative pressure, and aperture diameter as test factors, and regression equations for the single grain rate and missed seeding rate were established. Response surface analysis was used to analyze the variation in the influence of the interaction factors on the evaluation indicators. The optimal combination of parameters was obtained using the Optimization module of Design-Expert13 software. The hole spreader had a speed of 49.84 r/min, a negative pressure of 1.96 kpa and an aperture diameter of 3.61 mm. The researchers finally chose a 3.5 mm aperture drum for validation and obtained a 90.9% single grain rate, and 4.3% missed seeding. This is generally consistent with the optimized results and meets the agronomic requirements for precision sowing.
In the future, we will carry out a simulation study of the split seeding system as a whole. If the test conditions are met, the whole split seeding system will be installed on the planter for field trials to verify the operational performance in the field environment, hoping to provide some reference for the research development of precision sowing.

Author Contributions

Conceptualization, B.L. and X.N.; methodology, S.L.; software, B.L.; validation, B.L., Q.Q. and K.L.; formal analysis, Q.Q.; investigation, S.L.; resources, X.N.; data curation, K.L.; writing—original draft preparation, B.L.; writing—review and editing, B.L. and X.N.; visualization, S.L.; supervision, X.N.; project administration, X.N. and S.L.; funding acquisition, X.N. All authors have read and agreed to the published version of the manuscript.

Funding

This research was supported by grants from the National Natural Science Foundation of China (Grant No. 52065056).

Institutional Review Board Statement

Not applicable.

Informed Consent Statement

Not applicable.

Data Availability Statement

All relevant data presented in the article are kept at the request of the institution and are therefore not available online. However, all data used in this manuscript are available from the corresponding authors.

Conflicts of Interest

The authors declare no conflict of interest.

References

  1. Dun, G.; Mao, N.; Gao, Z.; Wu, X.; Liu, W.; Zhou, C. Model construction of soybean average diameter and hole parameters of seed-metering wheel based on DEM. Int. J. Agric. Biol. Eng. 2021, 14, 101–110. [Google Scholar] [CrossRef]
  2. Han, D.; Zhang, D.; Jing, H.; Yang, L.; Cui, T.; Ding, Y.; Wang, Z.; Wang, Y.; Zhang, T. DEM-CFD coupling simulation and optimization of an inside-filling air-blowing maize precision seed-metering device. Comput. Electron. Agric. 2018, 150, 426–438. [Google Scholar] [CrossRef]
  3. Bourges, G.; Medina, M. Air-seeds flow analysis in a distributor head of an “air drill” seeder. In Proceedings of the 1st International Symposium on CFD Applications in Agriculture 1008, Valencia, Spain, 9–10 July 2012; pp. 259–264. [Google Scholar]
  4. Hu, M.; Xia, J.; Zhou, Y.; Luo, C.; Zhou, M.; Liu, Z. Measurement and Calibration of the Discrete Element Parameters of Coated Delinted Cotton Seeds. Agriculture 2022, 12, 286. [Google Scholar] [CrossRef]
  5. Huang, X.; Zhang, S.; Luo, C.; Li, W.; Liao, Y. Design and Experimentation of an Aerial Seeding System for Rapeseed Based on an Air-Assisted Centralized Metering Device and a Multi-Rotor Crop Protection UAV. Appl. Sci. 2020, 10, 8854. [Google Scholar] [CrossRef]
  6. Lu, F.; Chi, B.-J.; Dong, H.-Z. Cotton cultivation technology with Chinese characteristics has driven the 70-year development of cotton production in China. J. Integr. Agric. 2022, 21, 597–609. [Google Scholar]
  7. Tejaswi, T.; Talekar, N. Appraisal of precision farming: A review. Pharma Inov. J. 2022, 11, 232–234. [Google Scholar]
  8. Ding, Y.; Wang, K.; Liu, X.; Liu, W.; Chen, L.; Liu, W.; Du, C. Research progress on sowing detection technology of small and medium-sized seeds. Trans. Chin. Soc. Agric. Eng. 2021, 37, 30–41. [Google Scholar] [CrossRef]
  9. Zhang, K.; Zhang, L.; Ding, Y.; Liu, X.; Zhao, X. Design and Test of Air-Suction Pepper Seed Metering Device Based on Air Supply and Quantitative Seed Supply. INMATEH Agric. Eng. 2021, 64, 345–354. [Google Scholar] [CrossRef]
  10. Bagherpour, H. Modeling and evaluation of a vacuum-cylinder precision seeder for chickpea seeds. Agric. Eng. Int. CIGR J. 2019, 21, 75–82. [Google Scholar]
  11. Li, J.; Lai, Q.; Zhang, H.; Zhang, Z.; Zhao, J.; Wang, T. Suction force on high-sphericity seeds in an air-suction seed-metering device. Biosyst. Eng. 2021, 211, 125–140. [Google Scholar] [CrossRef]
  12. Abdolahzare, Z.; Abdanan Mehdizadeh, S. Real time laboratory and field monitoring of the effect of the operational parameters on seed falling speed and trajectory of pneumatic planter. Comput. Electron. Agric. 2018, 145, 187–198. [Google Scholar] [CrossRef]
  13. Hu, H.; Zhou, Z.; Wu, W.; Yang, W.; Li, T.; Chang, C.; Ren, W.; Lei, X. Distribution characteristics and parameter optimisation of an air-assisted centralised seed-metering device for rapeseed using a CFD-DEM coupled simulation. Biosyst. Eng. 2021, 208, 246–259. [Google Scholar] [CrossRef]
  14. Lei, X.; Hu, H.; Wu, W.; Liu, H.; Liu, L.; Yang, W.; Zhou, Z.; Ren, W. Seed motion characteristics and seeding performance of a centralised seed metering system for rapeseed investigated by DEM simulation and bench testing. Biosyst. Eng. 2021, 203, 22–33. [Google Scholar] [CrossRef]
  15. Gao, X.; Zhou, Z.; Xu, Y.; Yu, Y.; Su, Y.; Cui, T. Numerical simulation of particle motion characteristics in quantitative seed feeding system. Powder Technol. 2020, 367, 643–658. [Google Scholar] [CrossRef]
  16. Guzman, L.; Chen, Y.; Landry, H. Coupled CFD-DEM Simulation of Seed Flow in an Air Seeder Distributor Tube. Processes 2020, 8, 1597. [Google Scholar] [CrossRef]
  17. Hongxin, L.; Lifeng, G.; Lulu, F.; Shifa, T. Study on multi-size seed-metering device for vertical plate soybean precision planter. Int. J. Agric. Biol. Eng. 2015, 8, 1–8. [Google Scholar]
  18. Wang, C.; Li, H.; He, J.; Wang, Q.; Lu, C.; Yang, H. Optimization Design of a Pneumatic Wheat-Shooting Device Based on Numerical Simulation and Field Test in Rice–Wheat Rotation Areas. Agriculture 2022, 12, 56. [Google Scholar] [CrossRef]
  19. Wang, Y.; Li, H.; Wang, Q.; He, J.; Lu, C.; Yang, Q.; Liu, P. Experiment and Parameters Optimization of Seed Distributor of Mechanical Wheat Shooting Seed-Metering Device. INMATEH Agric. Eng. 2021, 63, 29–40. [Google Scholar] [CrossRef]
  20. Xiong, D.; Wu, M.; Xie, W.; Liu, R.; Luo, H. Design and Experimental Study of the General Mechanical Pneumatic Combined Seed Metering Device. Appl. Sci. 2021, 11, 7223. [Google Scholar] [CrossRef]
  21. Yatskul, A.; Lemiere, J.-P. Establishing the conveying parameters required for the air-seeders. Biosyst. Eng. 2018, 166, 1–12. [Google Scholar] [CrossRef]
  22. Yazgi, A.; Degirmencioglu, A. Measurement of seed spacing uniformity performance of a precision metering unit as function of the number of holes on vacuum plate. Measurement 2014, 56, 128–135. [Google Scholar] [CrossRef]
  23. Yazgi, A.; Demİr, V.; DeĞİRmencİOĞLu, A. Comparison of computational fluid dynamics-based simulations and visualized seed trajectories in different seed tubes. Turk. J. Agric. For. 2020, 44, 599–611. [Google Scholar] [CrossRef]
  24. Lei, X.; Wu, W.; Chang, C.; Li, T.; Zhou, Z.; Guo, J.; Zhu, P.; Hu, J.; Cheng, H.; Zhou, W.; et al. Seeding Performance Caused by Inclination Angle in a Centralized Seed-Metering Device for Rapeseed. Agriculture 2022, 12, 590. [Google Scholar] [CrossRef]
  25. Chen, Y.; Cheng, Y.; Chen, J.; Zheng, Z.; Hu, C.; Cao, J. Design and Experiment of the Buckwheat Hill-Drop Planter Hole Forming Device. Agriculture 2021, 11, 85. [Google Scholar] [CrossRef]
  26. Gorobets, V.; Trokhaniak, V.; Masiuk, M.; Spodyniuk, N.; Blesnyuk, O.; Marchishina, Y. Cfd Modeling of Aerodynamic Flow in a Wind Turbine with Vertical Rotational Axis and Wind Flow Concentrator. INMATEH Agric. Eng. 2021, 64, 159–166. [Google Scholar] [CrossRef]
  27. Jiajia, Y.; Yitao, L.; Jinling, C.; Song, Y.; Qingxi, L. Simulation analysis and match experiment on negative and positive pressures of pneumatic precision metering device for rapeseed. Int. J. Agric. Biol. Eng. 2014, 7, 1–12. [Google Scholar]
  28. Liu, Z.; Meng, Z.; Han, J.; Zhuang, Y.; Yin, X.; Chen, Y. Effect of Seed Filling and Releasing Angles on the Performance of Compound Vacuum Seed Metering Device. INMATEH Agric. Eng. 2021, 65, 153–162. [Google Scholar] [CrossRef]
  29. Hai, N.T.; Chosa, T.; Tojo, S.; Thi-Hien, N. Application of a Similarity Measure Using Fuzzy Sets to Select the Optimal Plan for an Air-Assisted Rice Seeder. Appl. Sci. 2021, 11, 6715. [Google Scholar] [CrossRef]
  30. Lei, X.; Liao, Y.; Liao, Q. Simulation of seed motion in seed feeding device with DEM-CFD coupling approach for rapeseed and wheat. Comput. Electron. Agric. 2016, 131, 29–39. [Google Scholar] [CrossRef]
  31. Mudarisov, S.; Badretdinov, I.; Rakhimov, Z.; Lukmanov, R.; Nurullin, E. Numerical simulation of two-phase “Air-Seed” flow in the distribution system of the grain seeder. Comput. Electron. Agric. 2020, 168, 105151. [Google Scholar] [CrossRef]
  32. Li, H.; Zeng, S.; Luo, X.; Fang, L.; Liang, Z.; Yang, W. Design, DEM Simulation, and Field Experiments of a Novel Precision Seeder for Dry Direct-Seeded Rice with Film Mulching. Agriculture 2021, 11, 378. [Google Scholar] [CrossRef]
  33. Shen, H.; Zhang, J.; Chen, X.; Dong, J.; Huang, Y.; Shi, J. Development of a guiding-groove precision metering device for high-speed planting of soybean. Trans. ASABE 2021, 64, 1113–1122. [Google Scholar] [CrossRef]
  34. Zhang, X.; Zhu, D.; Xue, K.; Li, L.; Zhu, J.; Zhang, S.; Liao, J. Parameter Optimization and Experiment of Slider-Hole-Wheel Seed-Metering Device Based on Discrete Element Method. INMATEH Agric. Eng. 2021, 65, 410–420. [Google Scholar] [CrossRef]
  35. Bai, S.; Yuan, Y.; Niu, K.; Zhou, L.; Zhao, B.; Wei, L.; Liu, L.; Xiong, S.; Shi, Z.; Ma, Y.; et al. Simulation Parameter Calibration and Experimental Study of a Discrete Element Model of Cotton Precision Seed Metering. Agriculture 2022, 12, 870. [Google Scholar] [CrossRef]
  36. Xing, H.; Zang, Y.; Wang, M.Z.; Luo, W.X.; Zhang, H.M.; Ma, X.Y.; Fang, Y.L. Design and Experimental Analysis of a Stirring Device for a Pneumatic Precision Rice Seed Metering Device. Trans. ASABE 2020, 63, 799–808. [Google Scholar] [CrossRef]
  37. Gao, X.; Cui, T.; Zhou, Z.; Yu, Y.; Xu, Y.; Zhang, D.; Song, W. DEM study of particle motion in novel high-speed seed metering device. Adv. Powder Technol. 2021, 32, 1438–1449. [Google Scholar] [CrossRef]
  38. Cheng, Q.; Wang, J.; Liu, K.; Chao, J.; Liu, D. Design of Rice Straw Fiber Crusher and Evaluation of Fiber Quality. Agriculture 2022, 12, 729. [Google Scholar] [CrossRef]
  39. Guo, H.; Cao, Y.; Song, W.; Zhang, J.; Wang, C.; Wang, C.; Yang, F.; Zhu, L. Design and Simulation of a Garlic Seed Metering Mechanism. Agriculture 2021, 11, 1239. [Google Scholar] [CrossRef]
  40. Lai, Q.; Sun, K.; Yu, Q.; Qin, W. Design and experiment of a six-row air-blowing centralized precision seed-metering device for Panax notoginseng. Int. J. Agric. Biol. Eng. 2020, 13, 111–122. [Google Scholar] [CrossRef]
  41. Li, B.; Ahmad, R.; Qi, X.; Li, H.; Nyambura, S.M.; Wang, J.; Chen, X.; Li, S. Design Evaluation and Performance Analysis of a Double-Row Pneumatic Precision Metering Device for Brassica chinensis. Sustainability 2021, 13, 1374. [Google Scholar] [CrossRef]
  42. Liquan, T.; Yongsen, X.; Zhao, D.; Zhan, S. Design and Performance Test of Direct Seed Metering Device for Rice Hill. INMATEH Agric. Eng. 2021, 64, 257–268. [Google Scholar] [CrossRef]
  43. Wang, B.; Luo, X.; Wang, Z.; Zheng, L.; Zhang, M.; Dai, Y.; Xing, H. Design and field evaluation of hill-drop pneumatic central cylinder direct-seeding machine for hybrid rice. Int. J. Agric. Biol. Eng. 2018, 11, 33–40. [Google Scholar] [CrossRef]
  44. Wang, J.; Qi, X.; Xu, C.; Wang, Z.; Jiang, Y.; Tang, H. Design Evaluation and Performance Analysis of the Inside-Filling Air-Assisted High-Speed Precision Maize Seed-Metering Device. Sustainability 2021, 13, 5483. [Google Scholar] [CrossRef]
Figure 1. Split seeding system.
Agriculture 12 01037 g001
Figure 2. Schematic diagram of the air-absorbing staggered roller type precision seed discharger structure. 1. Fixed support; 2. Large sprocket; 3. Bearing; 4. Fastening screw; 5. Drum; 6. Absolute pressure block; 7. Spring; 8. Inner drum; 9. Standard flat key; 10. End cover; 11. Negative pressure shaft; 12. Seed thrower; 13. Seedbox; 14. Bin wall vibrator; 15. Steel wire hose; 16. Chain; 17. Whirlpool fan; 18. Reducer motor; 19. Small sprocket; 20. Machine frame. A-A. The cross-sectional view of the seeding drum.
Agriculture 12 01037 g002
Figure 3. Structure diagram of the hole sower. 1. Seed guide; 2. Fixed disc; 3. Duckbill; 4. Shaft; 5. Seed guard; 6. Moving disc; 7. Retaining ring; 8. Seed divider; 9. Seed stopper.
Agriculture 12 01037 g003
Figure 4. Simulation model of the flow field of a seed dispenser.
Agriculture 12 01037 g004
Figure 5. Velocity and pressure clouds in a longitudinal section.
Agriculture 12 01037 g005
Figure 6. Cross-sectional velocity and pressure clouds.
Agriculture 12 01037 g006
Figure 7. Simulation of the flow field of the seed delivery pipe. (a) Velocity distribution cloud; (b) Pressure distribution cloud.
Agriculture 12 01037 g007
Figure 8. Simulation of the transport of cotton seed particles.
Agriculture 12 01037 g008
Figure 9. Changes in force and speed of cotton seeds.
Agriculture 12 01037 g009
Figure 10. Movement state of cotton seeds at special moments. (a) t = 0.49 s; (b) t = 0.54 s; (c) t = 0.68 s; (d) t = 0.69 s; (e) t = 0.72 s; (f) t = 0.79 s; (g) t = 0.84 s.
Agriculture 12 01037 g010
Figure 11. Cotton seed and hole sower simulation model. (a) Physical cotton seed pellets; (b) Cotton seed simulation model; (c) Simulation model of a hole sower.
Agriculture 12 01037 g011
Figure 12. Seed trajectory diagram. (a) Main view; (b) Left view.
Agriculture 12 01037 g012
Figure 13. The plot of the seed-combined force and velocity variation.
Agriculture 12 01037 g013
Figure 14. Seed discharge process for hole sowers. (a) The phenomenon of single grain precision sowing. (b) The phenomenon of resowing. (c) The phenomenon of omission of sowing.
Agriculture 12 01037 g014
Figure 15. Seeding performance analysis curve.
Agriculture 12 01037 g015
Figure 16. Bench test of a split seeding system. 1. Seed discharger; 2. Hole sower; 3. Seed belt; 4. High-pressure whirlwind fans; 5. Positive pressure seed delivery tubes; 6. Gear motor.
Agriculture 12 01037 g016
Figure 17. Effect of interaction factors on single grain rate. (a) Effect of hole sower speed and negative pressure on seed rate; (b) Effect of hole sower speed and aperture size on seed rate; (c) Effect of negative pressure and aperture size on the seed rate.
Agriculture 12 01037 g017
Table 1. Parameters used in the DEM simulations.
ParametersValue
Poisson’s ratio of cotton seed0.25
Shear modulus of cotton seed (Pa)1.0 × 10⁶
The density of cotton seed (kg/m3)664.6
Collision recovery coefficient between cotton seed and cotton seed0.3
Coefficient of static friction between cotton seed and cotton seed0.56
Coefficient of rolling friction between cotton seed and cotton seed0.15
Poisson’s ratio of ABS0.5
Shear modulus of ABS (Pa)1.77 × 10⁶
The density of ABS (kg/m3)1180
Collision recovery coefficient between ABS and cotton seed0.6
Coefficient of static friction between ABS and cotton seed0.48
Coefficient of rolling friction between ABS and cotton seed0.1
Poisson’s ratio of steel0.28
Shear modulus of steel (Pa)8.2 × 10¹⁰
The density of steel (kg/m3)7890
Collision recovery coefficient between steel and cotton seed0.52
Coefficient of static friction between steel and cotton seed0.5
Coefficient of rolling friction between steel and cotton seed0.1
Gravitational acceleration (m/s2)9.8
Fixed time step (s)7.51 × 10⁻⁶
Total simulation time (s)15
Table 2. Factor level codes.
Code ValueTest Factors
Speed of the Hole Sower X1/(r/min)Negative Pressure
X2/(kPa)
Aperture X3/(mm)
−1.68236.311.593.0
−141.041.933.2
047.982.433.5
154.722.933.8
1.68259.453.274.0
Table 3. Combined test protocol and results for secondary rotation orthogonal centers.
Test Serial NumberTest FactorsEvaluation Indicators
X1X2X3Single Grain Rate y1/%Missed Seeding Rate y0/%
100−1.68285.67.2
2−1−1−183.213.6
31−1−187.57.9
4−11−183.49.9
511−185.26.0
60−1.682089.25.4
7−1.6820082.312.2
800089.17.5
900089.87.0
1000089.65.4
1100088.86.9
1200090.44.1
1300089.95.1
1400091.54.5
1500089.05.7
1600090.44.0
171.6820086.53.7
1801.682084.98.1
19−1−1188.05.5
201−1189.16.9
21−11183.110.3
2211183.811.2
23001.68286.17.5
Table 4. Analysis of variance for regression equations.
Source of VarianceSingle Grain RateMissed Seeding Rate
Sum of SquaresFreedomF-Valuep-ValueSum of SquaresFreedomF-Valuep-Value
Model165.42932.05<0.0001 **126.4295.890.0022 **
X116.40128.590.0001 **34.05114.320.0023 **
X227.93148.71<0.0001 **4.7311.990.1823
X32.2513.920.06930.657010.27550.6085
X1 × 21.0511.830.19880.211210.08860.7707
X1 × 32.3114.030.065917.7017.420.0174 *
X2 × 38.20114.300.0023 **27.01111.330.0051 **
X1260.001104.63<0.0001 **20.6618.670.0114 *
X2216.09128.060.0001 **8.1513.420.0874
X3232.52156.71<0.0001 **13.6915.740.0323 *
Residual7.4513 31.0013
Misfit1.6750.46360.793617.4352.050.1745
Error5.788 13.588
Sum172.8722 157.4222
Note: * indicates significant difference (p < 0.05), ** indicates highly significant difference (p < 0.01).
Publisher’s Note: MDPI stays neutral with regard to jurisdictional claims in published maps and institutional affiliations.

