Article

Improving Wheat Yield Prediction Accuracy Using LSTM-RF Framework Based on UAV Thermal Infrared and Multispectral Imagery

1
Agricultural Information Institute, Chinese Academy of Agricultural Sciences, Beijing 100081, China
2
Biosystems Dynamics and Exchanges, Gembloux Agro-Bio Tech, TERRA Teaching and Research Centre, University of Liège, 5030 Gembloux, Belgium
3
Melbourne Institute of Technology, The Argus, 288 La Trobe St., Melbourne, VIC 3000, Australia
4
School of Computer Science and Technology, Harbin Institute of Technology, Harbin 150001, China
5
Henan Key Laboratory of Water-Saving Agriculture, Farmland Irrigation Research Institute, Chinese Academy of Agricultural Sciences, Xinxiang 453002, China
*
Authors to whom correspondence should be addressed.
Agriculture 2022, 12(6), 892; https://doi.org/10.3390/agriculture12060892
Submission received: 4 June 2022 / Revised: 14 June 2022 / Accepted: 18 June 2022 / Published: 20 June 2022

Abstract

:
Yield prediction is of great significance in agricultural production. Remote sensing technology based on unmanned aerial vehicles (UAVs) offers the capacity of non-intrusive crop yield prediction with low cost and high throughput. In this study, a winter wheat field experiment with three levels of irrigation (T1 = 240 mm, T2 = 190 mm, T3 = 145 mm) was conducted in Henan province. Multispectral vegetation indices (VIs) and canopy water stress indices (CWSI) were obtained using an UAV equipped with multispectral and thermal infrared cameras. A framework combining a long short-term memory neural network and random forest (LSTM-RF) was proposed for predicting wheat yield using VIs and CWSI from multi-growth stages as predictors. Validation results showed that the R2 of 0.61 and the RMSE value of 878.98 kg/ha was achieved in predicting grain yield using LSTM. LSTM-RF model obtained better prediction results compared to the LSTM with n R2 of 0.78 and RMSE of 684.1 kg/ha, which is equivalent to a 22% reduction in RMSE. The results showed that LSTM-RF considered both the time-series characteristics of the winter wheat growth process and the non-linear characteristics between remote sensing data and crop yield data, providing an alternative for accurate yield prediction in modern agricultural management.

1. Introduction

Wheat is one of the major food crops worldwide. In the context of global food crisis and climate change, accurate wheat yield prediction is of great importance for the development of precision agriculture. The traditional method for obtaining yield is performed after maturity. Alternatively, other important traits such as biomass, leaf area index and plant height can be used to make a preliminary assessment of yield before maturity. These pre-harvest methods for obtaining yield are time consuming, costly, and inefficient.
Remote sensing enables non-intrusive prediction of crop yields before maturity, as traditional remote sensing methods rely on satellite platforms. Data from satellite-based sensors have been successfully used for yield estimation at farm, national and global levels [1,2]. Unmanned aerial vehicle (UAV) remote sensing technology can provide a fast and non-intrusive view of crop growth status, water stress, and thus yield prediction. Various types of sensors are mounted on UAVs to collect crop canopy information, including multispectral, thermal infrared, RGB and hyperspectral cameras [3]. Data from these sensors have been successfully applied in the assessment of yield, biomass, leaf area index and chlorophyll content in maize, wheat, and rice [4,5,6,7,8,9]. However, most studies have only used data from individual sensors to infer crop parameters, neglecting the advantages of combining multiple sensors. For example, the fusion of features from multispectral, RGB and thermal imagery resulted in a significant improvement in yield prediction accuracy for soybeans [10]. Yang et al. [11]. obtained better performance by using RGB and multispectral images from a UAV than a VI-based regression model for rice grain yield estimation at the ripening stage. A similar situation also occurred for maize leaf area index (LAI) assessment [12]. The high accuracy of multi-sensor data fusion is due to the fact that multiple pieces of information, such as canopy reflectance, structure and temperature, all contribute in a unique and complementary way to plant trait prediction [10].
With the rapid development of sensors, the volume of data acquired has become larger, requiring powerful tools to establish relationships between remote sensing data and actual plant parameters. Machine learning algorithms have developed rapidly in recent years and are widely used in precision agriculture for the evaluation of crop parameters with desirable model performance [13,14,15,16]. Random forest (RF) is an integrated tree-based algorithm that achieves high prediction accuracy in the evaluation of parameters such as crop chlorophyll and biomass [17,18]. RF is an ideal tool for assessing ground parameters in precision agriculture and it obtained higher predictive accuracy exceeding that of support vector machine (SVM) and artificial neural network (ANN) in assessing crop biomass [19]. As a deep learning algorithm, LSTM is also widely used for crop parameter evaluation [20,21,22]. The long short-term memory (LSTM) model represents a deep network structure to incorporating crop growth processes, which has been proven to accommodate different types and representations of data, recognize sequential patterns over long time spans, and capture complex nonlinear relationships [23]. Haider et al. [23] focused on developing an accurate wheat production forecasting model using the Long Short-Term Memory (LSTM) neural networks. It achieved better performance in terms of forecasting, and revealed that while the wheat production will gradually increase in the next ten years, the production-to-consumption ratio will continue to fall, posing threats to the overall economy. Huiren et al. [24] developed an LSTM model to estimate wheat yield in the Guanzhong Plain by integrating meteorological data and two remotely sensed indices, vegetation temperature condition index (VTCI), and leaf area index (LAI) at the main growth stages. It was proved that the LSTM model outperformed BPNN and SVM, since its recurrent neural network structure that can incorporate nonlinear relationships between multi-features inputs and yield.
At present, most grain crop yield prediction has strong correlations with critical growing seasons. It produces various prediction errors by using data acquired from different growth stages. However, the yield of wheat is not only related to a certain growth stage. For example, water shortage at the heading stage will affect the ear length, and water shortage at the grain-filling stage will affect the plumpness of kernels. Linchao et al. [25] considered four main growth periods: T1: planting–tillering (Sep–Nov); T2: tillering–jointing (Oct–Mar); T3: jointing–heading (Mar–Apr); T4: heading–maturity (May–Jun). It was found that NIRv from jointing to heading was the most important predictor in determining yield. If we know the growth status of wheat in the early stage, it will help predict the yield of wheat with higher accuracy. To achieve this, this paper uses the long short-term memory network (LSTM) to extract the characteristics of wheat vegetation indices at different growth stages with sequential information. The specific objectives of our study were (1) to evaluate the potential of UAV-based multispectral and thermal infrared data fusion for wheat yield prediction, and (2) to develop an LSTM-RF model to enhance yield prediction accuracy.

2. Materials and Methods

2.1. Research Location and Experimental Design

The research area is located in Xinxiang (35.20° N, 113.80° E), Henan province, China. The research area has a warm temperate continental monsoon climate, with an average annual temperature of about 14 °C and an average annual rainfall of about 573.4 mm, which is suitable for winter wheat growing. In this experiment, a trial field was sown on 10 October with winter wheat (Triticum aestivum L.) and divided into 180 test plots, each measuring 8 m long and 1.4 m wide. The winter wheat was subjected to three irrigation levels: conventional irrigation (240 mm), moderate irrigation (190 mm) and mild irrigation (145 mm). For each irrigation treatment, 30 varieties were considered with two replications in a randomized block. Irrigation was performed by a large movable sprinkler. The irrigation period and detailed irrigation volumes for each treatment are shown in Table 1. Wheat was harvested after maturity on 2 June. The grains were dried until the moisture content was below 12.5% and then weighed.

2.2. UAV-Based Data Acquisition and Processing

UAV flights were carried out at heading, flowering, and grain-filling stages in clear and cloudless days between 10:00 and 14:00. Two remote sensing datasets were acquired using multispectral and thermal sensors installed on a M210 quadrotor UAV (DJI, Shenzhen, China) (Figure 1). Multispectral images were collected using a Rededge MX multispectral camera (Micasense, Inc., Seattle, DC, USA), capturing blue (centered at 475 nm), green (560 nm), red (668 nm), red-edge (717 nm) and near-infrared (842 nm) spectral channels with bandwidths of 20, 20, 10, 10, and 40 nm, respectively. Thermal images were obtained using a Zenmuse XT2 thermal infrared camera (DJI, Shenzhen, China) with wavelength range of 7.5–13.5 μm. In the experimental field, 18 ground control points (GCPs) were set up with black and white boards evenly distributed in the 180 plots. Orthographic images from the DJI’s ground station are used to plan the route. The side and front overlap of the route are 80% and 85%, respectively.
The methodological flowchart for data process was presented in Figure 2. The photogrammetric processing of the acquired UAV images was conducted in Pix4Dmapper photogrammetric software (Pix4D S.A., Lausanne, Switzerland). After the aerial triangulation of the UAV images, the geometric processing was optimized in Pix4Dmapper using the coordinates of the GCPs. After correction, the digital number (DN) values of the multispectral and thermal images were converted to reflectance and temperature, respectively. To extract the reflectance and temperature for each plot, the orthomosaic images were segmented into 180 polygon shapes with assigned IDs defining the plots. Polygon shape generation and information extraction are completed in QGIS 3.1.0.

2.3. Selection of Spectral Indices

Spectral indices have been proven to be closely related to the physiological and biochemical parameters of crops in previous literature. In this study, we selected 7 vegetation indices to estimate wheat yield (Table 2).

2.4. Regression Technology

In this paper, the LSTM-RF estimation model was constructed to predict winter wheat yield. The model used a two-layer long short-term memory network to extract primary features and secondary features from the input vegetation indices information, then these features were fed into a random forest regressor to predict the crop yield.

2.4.1. Long Short-Term Memory Network

For one long short-term memory cell (Figure 3), at a given time t, there are three inputs: the input value of the network at the current time x t , the output value of the long short-term memory cell of the last time h t 1 , and the last unit state c t 1 . It has two outputs: the output value h t and the state information c t at the current time.
LSTM is implemented in three steps [26]. The first step of LSTM is to determine what information can be passed through the cell state. This decision is controlled by the “Forget Gate” layer through the sigmoid function, which passes or partially passes based on the previous moment’s output, as shown by Equation (1).
f t = σ W f · h t 1 , x t + b f  
The second step is to generate new information that we need to update. This step consists of two parts, with Equation (2) representing an “input gate” layer that uses sigmoid to determine which values to update, and Equation (3) representing a hyperbolic tangent layer that generates new candidate values and adds them up to get the updated values.
i t = σ W i · h t 1 , x t + b i  
C ˜ t = t a n h W c · h t 1 , x t + b c
The two steps above are the process of discarding unwanted information and adding new information as shown in Equation (4):
C t = f t C t 1 + i t C ˜ t  
The final step is to determine the output of the model, firstly through the sigmoid layer to get an initial output, as shown in Equation (5), and then using a hyperbolic tangent layer to scale the values to between −1 and 1, and then multiplied pair by pair with the sigmoid output to obtain the output of the model, as shown in Equation (6).
o t = σ W o · h t 1 , x t + b o  
h t = o t tan h C t  

2.4.2. Random Forest Regressor

Random forest regressor is insensitive to multiple collinearities, and its results are relatively robust to incomplete or unbalanced data. It can predict well the effects of up to several thousand explanatory variables, and is regarded one of the best algorithms.
In this paper, the Classification and Regression Tree (CART) decision tree was used as the base learner in the random forest, as shown in Figure 4. Next, T rounds of training were carried out on the model through random sampling and random selection of features, and then T weak learners were summed up to obtain the final learner. Self-sampling method was adopted, in other words, sampling with return, and the number of samples taken in each round of training was equal to the total number of samples. Because of return sampling, some samples may be repeatedly chosen, while others may not be chosen. The selection of features was also by random selection of a fixed number of features to train the model. In this way, the weak learners were not completely independent of each other, yet the correlation was small, which can increase the overall generalization ability of the model.
Here is a summary of the flow of the random forest algorithm:
(a)
Draw a random bootstrap sample of size n (randomly choose n samples from the training set with replacement).
(1)
Grow a decision tree from the bootstrap sample. At each node:
(2)
At each node, randomly select d features without replacement.
(b)
Split the node using the feature that provides the best split according to the objective function, for instance, using the MSE criterion.
(c)
Repeat the steps (a) and (b) k times
(d)
The predicted target variable is calculated as the average prediction over all decision trees.

2.4.3. LSTM-RF

In this study, we tried to predict wheat yield with more reliable results through two processes: extracting the feature of vegetation indices using a two-layer LSTM and predicting wheat yield using the random forest algorithm. Figure 5 presents a brief description of LSTM-RF used in this paper. A three-layered LSTM-RF neural network model was developed. Its first two layers have three LSTM cells, respectively. A dense layer was added to train the LSTM network; once trained, the first two LSTM layers is used to extract features from input variables (Figure 4), and these features are sent to the random forest regressor to carry out the prediction.
One of the critical issues is to select appropriate input variables. The idea is to choose the combination of multispectral variables that are highly correlated with winter wheat yield. Previous studies have shown that it is better to predict wheat yield by considering the data of multiple growth stages [1]. This paper selected the multispectral data of heading, flowering, and grain-filling stages as input variables. In this section, to prove the effectiveness of the proposed method, we measure the objective performance through LSTM algorithm in a comparative experiment. To this end, we compare the performance of wheat yield prediction with LSTM and LSTM-RF.

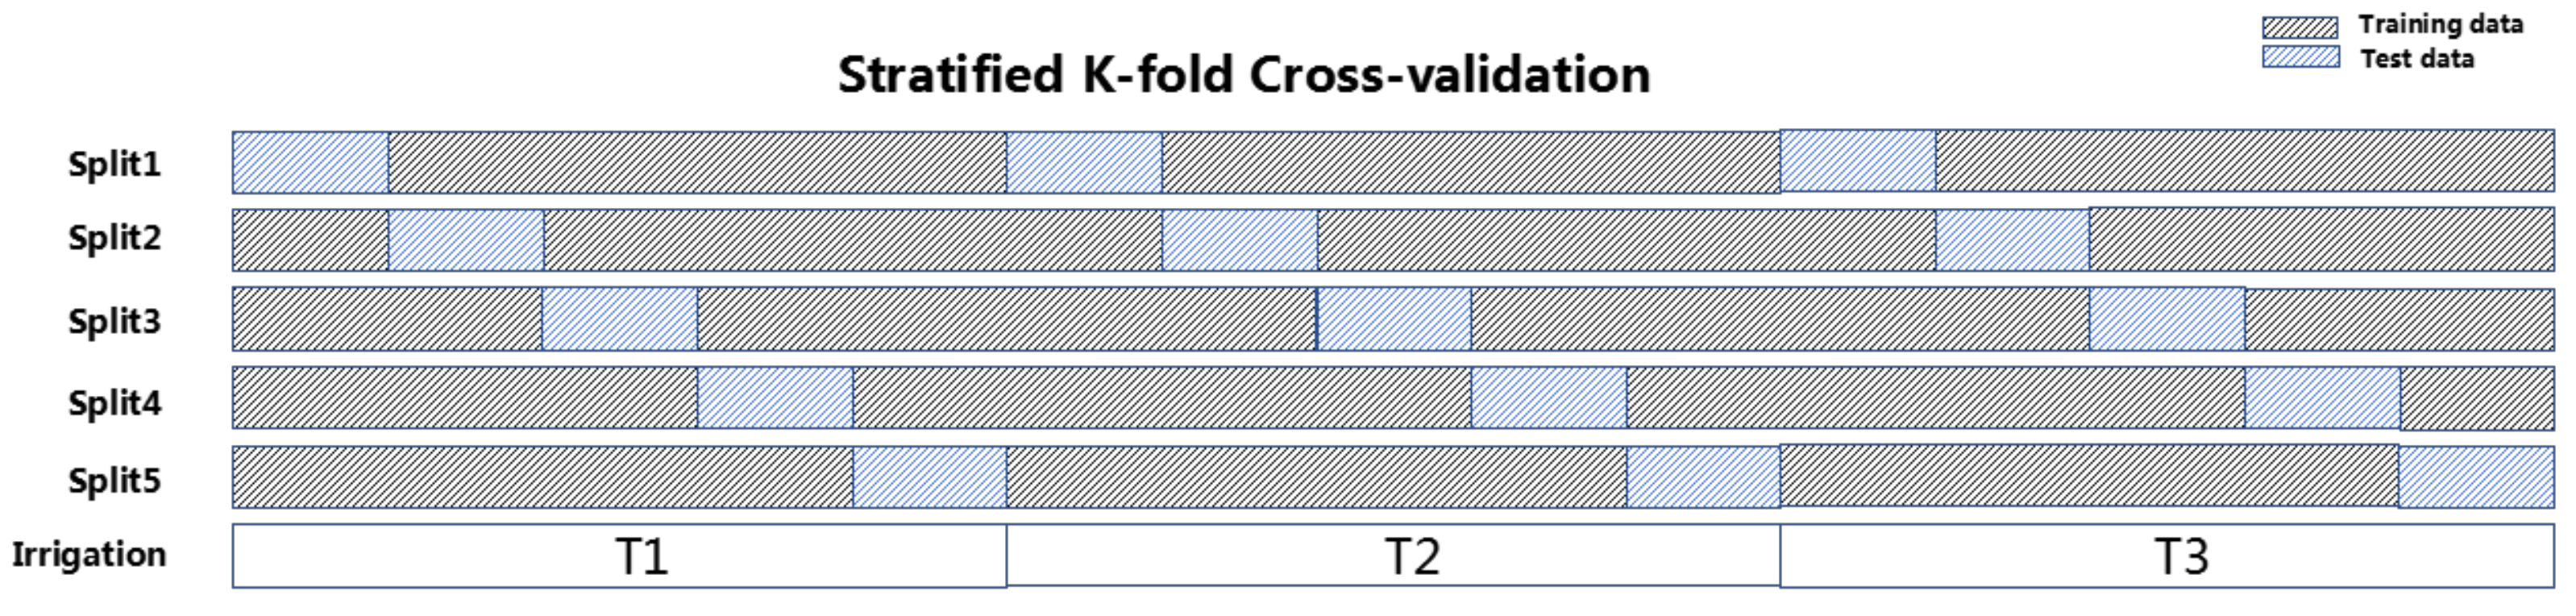
2.5. Model Validation

Considering the small number of samples, a stratified K-fold cross-validation was used as the model validation technique to generalize an independent and balanced dataset. In general, in the stratified K-fold cross-validation, the original dataset was divided into three parts according to the different irrigation treatments as shown in Figure 6, then each part was partitioned into K sub-datasets. Each time, a single sub-dataset was retained for validation and the remaining (K − 1) sub-datasets were used for training. This process repeats K times, and the errors for each time are estimated.
To avoid over-fitting, a stratified 5-fold cross-validation technique was applied to the original dataset and the mean squared error (MSE) was the calculated evaluation criterion. The stratified 5-fold cross-validation was performed repeatedly, and during the training phase, different values for the training technique’s parameters were used in concert with different network architectures. Furthermore, the training ended with the best values for the number of hidden nodes and training parameters. With these done, the network was finally trained using all the data, with the best number of hidden nodes and training parameters.

2.6. Statistical Analysis

To check the goodness of yield prediction, coefficient of determination ( R 2 ), root mean square error (RMSE) and mean absolute error (MAE) were calculated to evaluate the performance of prediction models in this study. The formulas for calculating these accuracy parameters are shown in Equations (7)–(9):
R 2 = 1 i = 1 n ( y i y ˆ i ) 2 i = 1 n ( y i y ¯ ) 2
RMSE = 1 n i = 1 n ( y i y ˆ i ) 2
MAE = 1 n i = 1 n | y i y ˆ i |
where n denotes the number of samples, y i and y ˆ i denote the actual and the predicted grain yields of sample i, respectively, and y ¯ is the mean of the measured grain yield.

3. Results

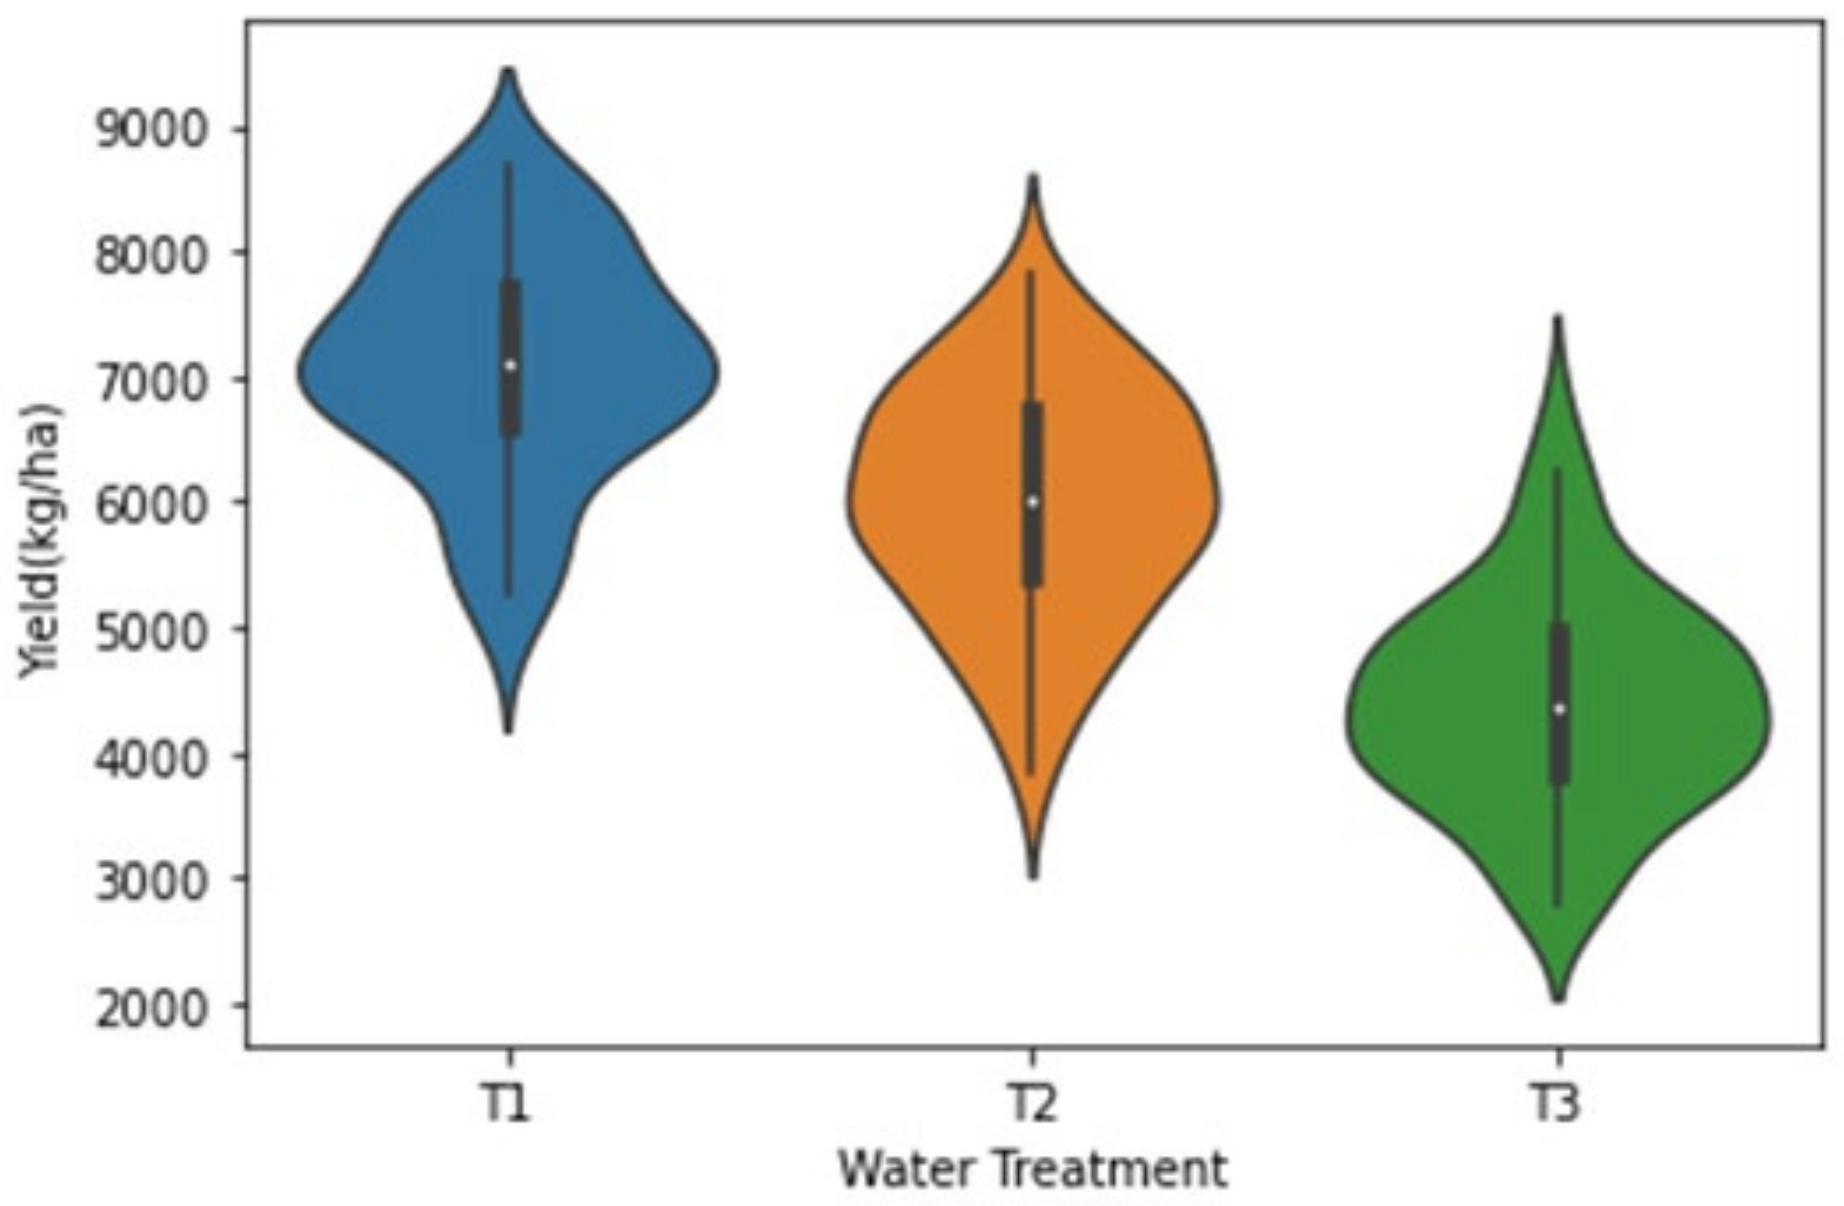
3.1. Statistical Description of Grain Yield

The yield was normally distributed for all treatments and the mean value of yield increased with increasing amount of irrigation (Figure 7).

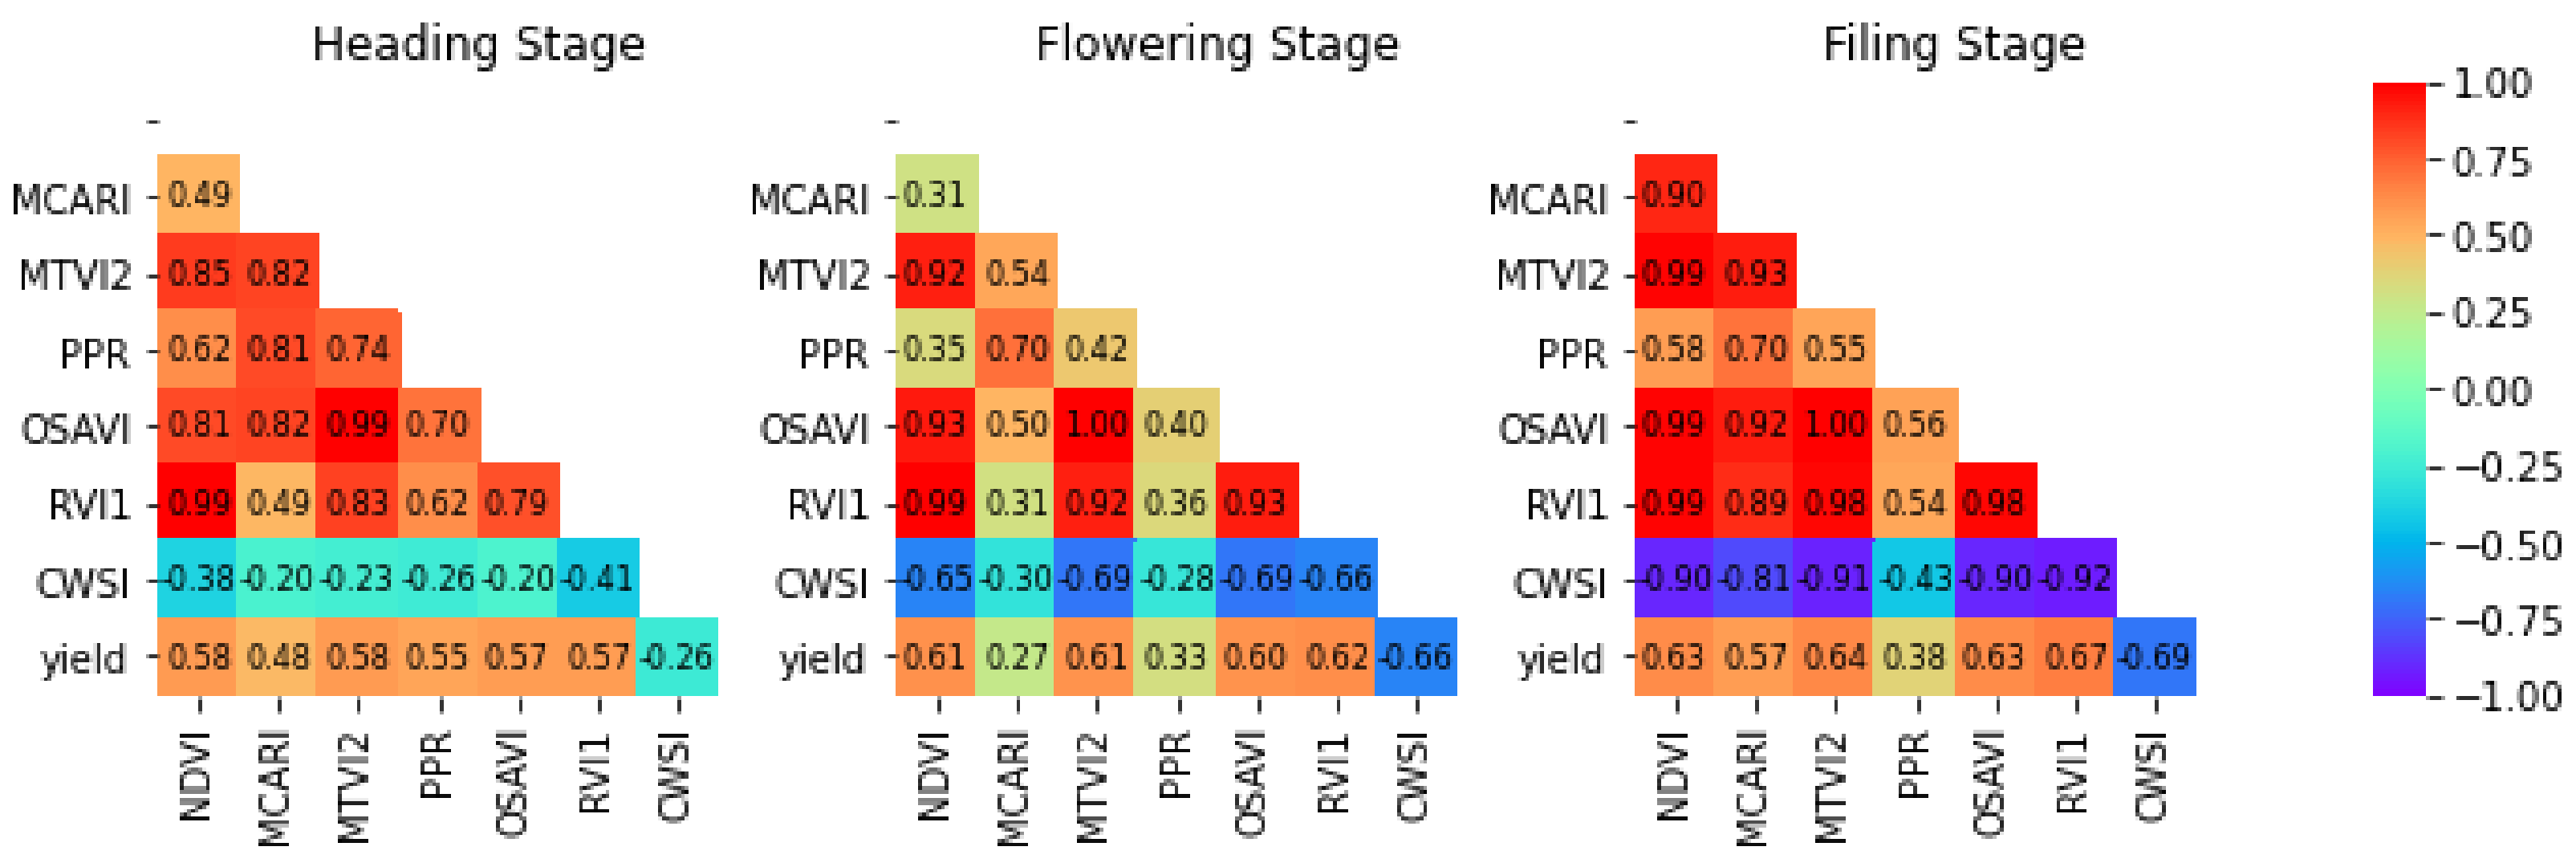
3.2. Correlations between Vegetative Indices and Yield

Figure 8 shows the correlation analysis of vegetation indices and yield at three growth stages. At the flowering stage and the grain-filling stage, RVI1 had the highest correlation with yield, ranging from r = 0.61 to r = 0.67, whereas CWSI showed a very strong negative correlation with yield (r = 0.67–0.69) at the flowering stage and the grain-filling stage. Strong correlations were estimated between yield and MTVI2, r = 0.60, 0.57, 0.65 at the heading stage, flowering stage and grain-filling stages, respectively. There were similar relationships between yield and OSAVI (r = 0.58, 0.56 and 0.64), NDVI (r = 0.60, 0.56 and 0.63). PPR was strongly correlated with yield at the heading stage, while MCARI and yield had a strong correlation at the grain-filling stage.
Figure 9 shows the correlation between the extracted features of LSTM and yield, when vegetation indices in heading, flowering and grain-filling stages were sent into LSTM together (Figure 4), four features were obtained. Feature_11 was extracted from the VIs of heading stage (Figure 4), and had the minimum correlation with yield (r = 0.49). Feature_12 was extracted from the VIs of flowering stage and feature_11 (Figure 4), and had a higher correlation with yield than feature_11 (r = 0.66). Feature_13 was extracted from the VIs of the grain-filling stage and feature_12, and the correlation between it and yield was higher than that of feature_12 (r = 0.70). Feature_2 was extracted from feature_11, feature_12 and feature_13, and had the highest correlation with yield (r = 0.78).

3.3. Model Performance Evaluation

Yield prediction was performed based on vegetation indices at the heading, flowering and grain-filling stages (Table 3). The model was first trained using LSTM neural network and vegetation indices of three stages, the R2 of the LSTM model in the training phase and validation phase are 0.60 (RMSE = 901.16 kg/ha, MAE = 738.58 kg/ha) and 0.61 (RMSE = 878.98 kg/ha, MAE = 718.99 kg/ha), respectively. By training the above LSTM neural network, three primary features and one advance feature were extracted and used as input features to random forest for yield prediction. Compared with LSTM, the model performance of LSTM-RF has been significantly improved. In the training phase, the R 2 , RMSE and MAE of LSTM-RF model were 0.78, 654.56 kg/ha and 515.94 kg/ha, respectively. The R 2 , RMSE and MAE of LSTM-RF model in the model validation phase were 0.78, 684.08 kg/ha and 506.13 kg/ha. Figure 10 shows the relationships between the measured and predicted yield of the LSTM and LSTM-RF models.

4. Discussion

In view of the winter wheat grows for several months, with its yield being affected by various stages of growth, in this study the LSTM has been used for feature extraction. The contributions of this study are as follows:
(1)
It provides a novel idea for studying crop growth and change. This study makes it possible to comprehensively consider the effects of different growth stages on crop yield.
(2)
Compared with other data fusion methods, feature extraction of LSTM is more explicable for time-dependent data such as crop growth.

4.1. Correlation between Features and Yield

Multispectral vegetation indices are frequently used to assess crop growth parameters such as leaf area index, biomass, canopy cover [27,28,29], and have also shown a strong association with crop yield [30]. In this study, most of the VIs extracted from the multispectral images had the highest correlation with yield at the grain-filling stage. The grain-filling period is a critical period for wheat grain formation [31,32], during which dry matter is transferred from plant organs to the seeds and is closely related to the thousand grain weight, so the VIs in this stage exhibit a high correlation with yield. The CWSI derived from canopy temperature information showed desirable yield correlations at both the flowering and grain-filling stages. Temperature is closely linked to crop transpiration. Temperature information has also been used to evaluate crop yield.
The VIs of an individual developmental stage responds to limited information on crop growth. Multispectral indices of multiple growing periods were considered comprehensively is of great significance for the management of agricultural production and can help improve the efficiency of agricultural management. Thus, multi-temporal VIs were proposed to improve the accuracy of grain yield (GY) prediction, for example, the accumulated SRIs ∑PRVI (Nir, Red) and ∑(RNir/(RRed + RGreen)) derived from satellite data from joining grain fill sta-ges predicted GY with high accuracy compared to VIs at individual growth stages [33]. In this study, we proposed a novel idea for coupling VI information across multiple growth stages using the deep learning method. A shallow LSTM was used to extract the features of seven VIs obtained during the three main growth stages of winter wheat. The extracted features by LSTM (Figure 8) had stronger correlation with yield than the single-stage VIs. The more the growth stages involved in extracting the features using LSTM, the higher the correlation between the features and the yield. In addition, the correlation between advanced features and yield was higher than that of the primary features, which was decided by the characteristics of the LSTM, which shows that the feature extraction method is feasible.

4.2. Yield Estimation Using LSTM-RF

With the increasing use of multiple types of sensors for high-throughput phenotyping of plant traits, robust statistical techniques are required to provide optimal predictive power. Machine learning and deep learning algorithms are constantly being used in precision agriculture and achieving desired yield prediction accuracy [27,28,29]. This study creatively combines the respective advantages of LSTM and RF algorithms. Comparing the results of LSTM and LSTM-RF, it was found that LSTM-RF was better in terms of prediction accuracy than LSTM. There may be two reasons for this: firstly, due to the presence of “forget gates”, the earlier the acquisition of vegetation indices, the lower the impact on the yield. For winter wheat, in addition to the grain-filling stage being closely related to yield, the heading stage is the key period to determine the seed setting rate, and the irrigation of flowering stage has a great effect on yield. Therefore, LSTM-RF using both the advanced feature and all primary features is more advantageous than LSTM alone. Second, the part of LSTM that performs yield prediction is the dense layer, which is a linear prediction in effect. Compared with the dense layer, random forest is good at learning complex and nonlinear relationships, and usually has a higher performance [34,35].

4.3. Deficiencies and Improvements

There is a potential for the method of LSTM-RF to be further improved. VIs for some of the earlier growth stages can be encompassed by this framework, providing additional supplementary information, and potentially capturing greater accuracy in yield prediction. Only two sensors, multispectral and thermal infrared, were used in this study, and only canopy information was obtained. Future research could consider sensors that can capture structural characteristics of the crop such as LiDAR to non-intrusively measure plant height, volume, and biomass information. Coupled with multispectral and thermal infrared data, this would overcome the disadvantage of saturating the spectra to obtain higher yield prediction accuracy. It needs to be emphasized that this study only validated the LSTM-RF framework using remote sensing data from a single environment, and more comprehensive studies should be performed to validate the performance of this framework in different environments.

5. Conclusions

In this study, a shallow LSTM-RF neural network was proposed to extract time-series features from vegetation indices of heading, flowering, and grain-filling stages to predict the yield of the winter wheat. The proposed two-layer LSTM framework was able to extract the time-series features of vegetation indices in three different periods, consisting of three primary features obtained from the first layer and an advanced feature from the second layer. All extracted features were proved to have better relevance for wheat yield than the original vegetation indices. An LSTM-RF wheat yield prediction framework was constructed by feeding the time-series features into a random forest to perform yield prediction, which was shown to perform better than LSTM in terms of data fitting, prediction accuracy and robustness. The current system was only validated under water stress conditions in a single environment. Future studies should be conducted in different environments to verify its adaptability and stability.
Agriculture is vital to everyone on our planet, since when you eat, farming is involved. Nowadays, agriculture is undergoing a transformation from traditional agriculture to precision agriculture, and an increasing number of information technologies, such as big data, Internet of Things, cloud computing, robotics, and block-chains, are entering the field of agriculture. In addition, AI technologies have the potential to contribute more in the future. To achieve practical success in agriculture, Andreas et al. [36] proposed three important AI frontier research areas: (1) intelligent sensor information fusion, (2) robotics and embodied intelligence, and (3) augmentation, explanation, and verification technologies for trusted decision support. Among the three areas, intelligent sensor information fusion is the most important. In this study, thermal infrared and multispectral imageries were used as the sensor information to the AI algorithm-based wheat yield prediction. To obtain better results with greater accuracy that are more practical, the integration of data from different sources and the fusion of multimodal information are necessary.

Author Contributions

Conceptualization, B.M. and L.G.; methodology, validation, Y.S.; resources, Q.C.; data curation, writing—original draft preparation, writing—review and editing, Y.S., Z.C. and P.K.; supervision, B.M. and L.G.; project administration, H.Y. and L.G.; funding acquisition, H.Y. and L.G. All authors have read and agreed to the published version of the manuscript.

Funding

This research was funded by National Key R&D Program of China (2021ZD0110901), Science and Technology Planning Project of Inner Mongolia Autonomous Region (2021GG0341) and Central Public-interest Scientific Institution Basal Research Fund (FIRI2022-23).

Institutional Review Board Statement

Not applicable.

Informed Consent Statement

Not applicable.

Data Availability Statement

Not applicable.

Conflicts of Interest

The authors declare no conflict of interest.

References

  1. Reinermann, S.; Asam, S.; Kuenzer, C. Remote Sensing of Grassland Production and Management-A Review. Remote Sens. 2020, 12, 1949. [Google Scholar] [CrossRef]
  2. Zhao, X.; Zhou, D.J.; Fang, J.Y. Satellite-based Studies on Large-Scale Vegetation Changes in China. J. Integr. Plant Biol. 2012, 54, 713–728. [Google Scholar] [CrossRef] [PubMed]
  3. Zheng, C.W.; Abd-Elrahman, A.; Whitaker, V. Remote Sensing and Machine Learning in Crop Phenotyping and Management, with an Emphasis on Applications in Strawberry Farming. Remote Sens. 2021, 13, 531. [Google Scholar] [CrossRef]
  4. Yue, J.; Yang, G.; Li, C.; Li, Z.; Wang, Y.; Feng, H.; Xu, B. Estimation of Winter Wheat Above-Ground Biomass Using Unmanned Aerial Vehicle-Based Snapshot Hyperspectral Sensor and Crop Height Improved Models. Remote Sens. 2017, 9, 708. [Google Scholar] [CrossRef] [Green Version]
  5. Zhou, X.; Zheng, H.B.; Xu, X.Q.; He, J.Y.; Ge, X.K.; Yao, X.; Cheng, T.; Zhu, Y.; Cao, W.X.; Tian, Y.C. Predicting grain yield in rice using multi-temporal vegetation indices from UAV-based multispectral and digital imagery. ISPRS J. Photogramm. Remote Sens. 2017, 130, 246–255. [Google Scholar] [CrossRef]
  6. Hassan, M.A.; Yang, M.; Rasheed, A.; Yang, G.; Reynolds, M.P.; Xia, X.; Xiao, Y.; He, Z. A rapid monitoring of NDVI across the wheat growth cycle for grain yield prediction using a multi-spectral UAV platform. Plant Sci. 2019, 282, 95–103. [Google Scholar] [CrossRef]
  7. Jay, S.; Maupas, F.; Bendoula, R.; Gorretta, N. Retrieving LAI, chlorophyll and nitrogen contents in sugar beet crops from multi-angular optical remote sensing: Comparison of vegetation indices and PROSAIL inversion for field phenotyping. Field Crops Res. 2017, 210, 33–46. [Google Scholar] [CrossRef] [Green Version]
  8. Yang, G.; Liu, J.; Zhao, C.; Li, Z.; Huang, Y.; Yu, H.; Xu, B.; Yang, X.; Zhu, D.; Zhang, X.; et al. Unmanned Aerial Vehicle Remote Sensing for Field-Based Crop Phenotyping: Current Status and Perspectives. Front. Plant Sci. 2017, 8, 26. [Google Scholar] [CrossRef]
  9. Feng, A.; Zhou, J.; Vories, E.D.; Sudduth, K.A.; Zhang, M. Yield estimation in cotton using UAV-based multi-sensor imagery. Biosyst. Eng. 2020, 193, 101–114. [Google Scholar] [CrossRef]
  10. Maimaitijiang, M.; Sagan, V.; Sidike, P.; Hartling, S.; Esposito, F.; Fritschi, F.B. Soybean yield prediction from UAV using multimodal data fusion and deep learning. Remote Sens. Environ. 2020, 237, 111599. [Google Scholar] [CrossRef]
  11. Yang, Q.; Shi, L.; Han, J.; Zha, Y.; Zhu, P. Deep convolutional neural networks for rice grain yield estimation at the ripening stage using UAV-based remotely sensed images. Field Crops Res. 2019, 235, 142–153. [Google Scholar] [CrossRef]
  12. Tripodi, P.; Nicastro, N.; Pane, C. Digital applications and artificial intelligence in agriculture toward next-generation plant phenotyping. Crop Pasture Sci. 2021, 18. [Google Scholar] [CrossRef]
  13. Liu, S.; Jin, X.; Nie, C.; Wang, S.; Yu, X.; Cheng, M.; Shao, M.; Wang, Z.; Tuohuti, N.; Bai, Y.; et al. Estimating leaf area index using unmanned aerial vehicle data: Shallow vs. deep machine learning algorithms. Plant Physiol. 2021, 187, 1551–1576. [Google Scholar] [CrossRef] [PubMed]
  14. Zha, H.; Miao, Y.; Wang, T.; Li, Y.; Zhang, J.; Sun, W.; Feng, Z.; Kusnierek, K. Improving Unmanned Aerial Vehicle Remote Sensing-Based Rice Nitrogen Nutrition Index Prediction with Machine Learning. Remote Sens. 2020, 12, 215. [Google Scholar] [CrossRef] [Green Version]
  15. Sharma, A.; Jain, A.; Gupta, P.; Chowdary, V. Machine Learning Applications for Precision Agriculture: A Comprehensive Review. IEEE Access 2021, 9, 4843–4873. [Google Scholar] [CrossRef]
  16. Darwin, B.; Dharmaraj, P.; Prince, S.; Popescu, D.; Hemanth, D. Recognition of Bloom/Yield in Crop Images Using Deep Learning Models for Smart Agriculture: A Review. Agronomy 2021, 11, 646. [Google Scholar] [CrossRef]
  17. Li, B.; Xu, X.; Zhang, L.; Han, J.; Bian, C.; Li, G.; Liu, J.; Jin, L. Above-ground biomass estimation and yield prediction in potato by using UAV-based RGB and hyperspectral imaging. ISPRS J. Photogramm. Remote Sens. 2020, 162, 161–172. [Google Scholar] [CrossRef]
  18. Yang, H.; Li, F.; Wang, W.; Yu, K. Estimating Above-Ground Biomass of Potato Using Random Forest and Optimized Hyperspectral Indices. Remote Sens. 2021, 13, 2339. [Google Scholar] [CrossRef]
  19. Jiménez, A.F.; Ortiz, B.V.; Bondesan, L.; Morata, G.; Damianidis, D. Evaluation of two recurrent neural network methods for prediction of irrigation rate and timing. Trans. Asabe 2020, 63, 1327–1348. [Google Scholar] [CrossRef]
  20. Sidhu, R.K.; Kumar, R.; Rana, P.S. Long short-term memory neural network-based multi-level model for smart irrigation. Mod. Phys. Lett. B 2020, 34, 19. [Google Scholar] [CrossRef]
  21. Zhao, F.; Yang, G.; Yang, H.; Zhu, Y.; Meng, Y.; Han, S.; Bu, X. Short and Medium-Term Prediction of Winter Wheat NDVI Based on the DTW-LSTM Combination Method and MODIS Time Series Data. Remote Sens. 2021, 13, 4660. [Google Scholar] [CrossRef]
  22. Zhao, H.; Chen, Z.; Jiang, H.; Jing, W.; Sun, L.; Feng, M. Evaluation of Three Deep Learning Models for Early Crop Classification Using Sentinel-1A Imagery Time Series-A Case Study in Zhanjiang, China. Remote Sens. 2019, 11, 2673. [Google Scholar] [CrossRef] [Green Version]
  23. Haider, S.A.; Naqvi, S.R.; Akram, T.; Umar, G.A.; Shahzad, A.; Sial, M.R.; Khaliq, S.; Kamran, M. LSTM Neural Network Based Forecasting Model for Wheat Production in Pakistan. Agronomy 2019, 9, 72. [Google Scholar] [CrossRef] [Green Version]
  24. Huiren, T.; Pengxin, W.; Kevin, T.; Jingqi, Z.; Shuyu, Z.; Hongmei, L. An LSTM neural network for improving wheat yield estimates by integrating remote sensing data and meteorological data in the Guanzhong Plain, PR China. Agric. For. Meteorol. 2021, 310, 108629. [Google Scholar] [CrossRef]
  25. Linchao, L.; Bin, W.; Puyu, F.; De Li, L.; Qinsi, H.; Yajie, Z.; Yakai, W.; Siyi, L.; Xiaoliang, L.; Chao, Y.; et al. Developing machine learning models with multi-source environmental data to predict wheat yield in China. Comput. Electron. Agric. 2022, 194, 106790. [Google Scholar] [CrossRef]
  26. Yu, Y.; Si, X.; Hu, C.; Zhang, J. A review of recurrent neural networks: LSTM cells and network architectures. Neural Comput. 2019, 31, 1235–1270. [Google Scholar] [CrossRef] [PubMed]
  27. Qi, H.; Zhu, B.; Wu, Z.; Liang, Y.; Li, J.; Wang, L.; Chen, T.; Lan, Y.; Zhang, L. Estimation of Peanut Leaf Area Index from Unmanned Aerial Vehicle Multispectral Images. Sensors 2020, 20, 6732. [Google Scholar] [CrossRef]
  28. Devia, C.A.; Rojas, J.P.; Petro, E.; Martinez, C.; Mondragon, I.F.; Patino, D.; Rebolledo, M.C.; Colorado, J. High-Throughput Biomass Estimation in Rice Crops Using UAV Multispectral Imagery. J. Intell. Robot. Syst. 2019, 96, 573–589. [Google Scholar] [CrossRef]
  29. Garcia-Garcia, D.; la Rosa, X.R.; Bedoya, D.G.; Schrevens, E. Linear mixed model analysis of NDVI-based canopy coverage, extracted from sequential UAV multispectral imagery of an open field tomato irrigation experiment. Comput. Electron. Agric. 2021, 189, 11. [Google Scholar] [CrossRef]
  30. Shao, G.; Han, W.; Zhang, H.; Liu, S.; Wang, Y.; Zhang, L.; Cui, X. Mapping maize crop coefficient Kc using random forest algorithm based on leaf area index and UAV-based multispectral vegetation indices. Agric. Water Manag. 2021, 252, 16. [Google Scholar] [CrossRef]
  31. Fu, Z.; Jiang, J.; Gao, Y.; Krienke, B.; Wang, M.; Zhong, K.; Cao, Q.; Tian, Y.; Zhu, Y.; Cao, W.; et al. Wheat Growth Monitoring and Yield Estimation based on Multi-Rotor Unmanned Aerial Vehicle. Remote Sens. 2020, 12, 508. [Google Scholar] [CrossRef] [Green Version]
  32. Fu, Z.; Yu, S.; Zhang, J.; Xi, H.; Gao, Y.; Lu, R.; Zheng, H.; Zhu, Y.; Cao, W.; Liu, X. Combining UAV multispectral imagery and ecological factors to estimate leaf nitrogen and grain protein content of wheat. Eur. J. Agron. 2022, 132, 15. [Google Scholar] [CrossRef]
  33. Wang, L.; Tian, Y.; Yao, X.; Zhu, Y.; Cao, W. Predicting grain yield and protein content in wheat by fusing multi-sensor and multi-temporal remote-sensing images. Field Crops Res. 2014, 164, 178–188. [Google Scholar] [CrossRef]
  34. Hengl, T.; Nussbaum, M.; Wright, M.N.; Heuvelink, G.B.M.; Gräler, B. Random forest as a generic framework for predictive modeling of spatial and spatio-temporal variables. PeerJ 2018, 6, 49. [Google Scholar] [CrossRef] [PubMed] [Green Version]
  35. Rodriguez-Galiano, V.F.; Ghimire, B.; Rogan, J.; Chica-Olmo, M.; Rigol-Sanchez, J.P. An assessment of the effectiveness of a random forest classifier for land-cover classification. ISPRS J. Photogramm. Remote Sens. 2012, 67, 93–104. [Google Scholar] [CrossRef]
  36. Holzinger, A.; Saranti, A.; Angerschmid, A.; Retzlaff, C.O.; Gronauer, A.; Pejakovic, V.; Medel-Jimenez, F.; Krexner, T.; Gollob, C.; Stampfer, K. Digital Transformation in Smart Farm and Forest Operations Needs Human-Centered AI: Challenges and Future Directions. Sensors 2022, 22, 3043. [Google Scholar] [CrossRef]
Figure 1. M210 quadrotor with multispectral and thermal cameras.
Agriculture 12 00892 g001
Figure 2. Methodological flowchart for crop yield prediction from the unmanned aerial vehicle (UAV) imageries in combination with ground-based data.
Agriculture 12 00892 g002
Figure 3. Long short-term memory cell.
Agriculture 12 00892 g003
Figure 4. How the random forest regressor works.
Agriculture 12 00892 g004
Figure 5. Structure of LSTM-RF.
Agriculture 12 00892 g005
Figure 6. Stratified 5-fold cross-validation at different irrigation.
Agriculture 12 00892 g006
Figure 7. Yield distribution with different amounts of irrigation.
Agriculture 12 00892 g007
Figure 8. Correlation analysis heat map in the heading stage, flowering stage, and grain-filling stage, respectively.
Agriculture 12 00892 g008
Figure 9. Correlation analysis heat map between the extracted features of LSTM and yield.
Agriculture 12 00892 g009
Figure 10. The relationships between the measured and predicted values of wheat yield based on the LSTM and LSTM-RF models.
Agriculture 12 00892 g010
Table 1. An overview of the water treatment for the 2019–2020 growing season.
Crop Growth StagesT1T2T3
Tillering35 mm35 mm35 mm
Wintering35 mm35 mm35 mm
Reviving35 mm25 mm20 mm
Elongation50 mm35 mm20 mm
Heading50 mm35 mm20 mm
Flowering35 mm25 mm15 mm
Total240 mm190 mm145 mm
Table 2. List of 7 vegetation indices we have examined in this study.
Index NameIndex AcronymFormula
Normalized difference vegetation indexNDVI ( R N I R R R E D ) / ( R N I R + R R E D )
Modified chlorophyll absorption in reflectance indexMCARI R R E D E D G E R R E D 0.2 R R E D E D G E R G R E E N 9 R R E D E D G E R R E D
Modified triangular vegetation index 2MTVI2 1.5 1.2 R N I R R G R E E N 2.5 R R E D R G R E E N / 2 R N I R + 1 2 6 R N I R 5 R R E D 0.5
ratio vegetation index 1RVI1 R N I R / R R E D
Optimized soil adjusted vegetation indexOSAVI 1.16 ( R N I R R R E D ) / ( R N I R + R R E D + 0.16 )
Normalized difference 550/450 plant pigment ratioPPR ( R G R E E N R B L U E ) / ( R G R E E N + R B L U E )
Crop water stress indexCWSI T C T m i n 2 / ( T m a x + 5 T m i n 2 ]
Table 3. Results of the estimation of the yield of winter wheat based on features extracted from three stages.
Heading + Flowering + Grain Filling
AlgorithmTrainingValidation
R 2 RMSE (kg/ha)MAE (kg/ha) R 2 RMSE (kg/ha)MAE (kg/ha)
LSTM0.60901.16738.580.61878.98718.99
LSTM-RF0.78654.56515.940.78684.08506.13
Publisher’s Note: MDPI stays neutral with regard to jurisdictional claims in published maps and institutional affiliations.

