Article

Spatial and Temporal Variations in the Ecological Efficiency and Ecosystem Service Value of Agricultural Land in China

1
School of Economics, Southwestern University of Finance and Economics, Chengdu 611130, China
2
West Institute for Economic Research, Southwestern University of Finance and Economics, Chengdu 611130, China
3
Sichuan Central for Rural Development Research, College of Management, Sichuan Agricultural University, Chengdu 611130, China
4
Institute of City Situation Survey Research, Beijing Academy of Social Sciences, Beijing 100101, China
*
Authors to whom correspondence should be addressed.
Agriculture 2022, 12(6), 803; https://doi.org/10.3390/agriculture12060803
Submission received: 15 April 2022 / Revised: 25 May 2022 / Accepted: 30 May 2022 / Published: 1 June 2022
(This article belongs to the Special Issue Ecological Restoration and Rural Economic Development)

Abstract

:
In-depth analysis of spatial and temporal variations in the ecological efficiency of agricultural land has important theoretical and practical significance in achieving the efficient utilization of agricultural land, the coordinated development of natural resources and the environment, and the formulation of sustainable agricultural development policies. By including carbon emissions and pollution as undesired output indicators of agricultural land use, and introducing ecological service values as output indicators, an SBM-Undesirable model which can not only avoid the deviation caused by the difference of radial and angular selection, but also reflect the essence of efficiency evaluation, was used to estimate the ecological efficiency of agricultural land in 30 provinces, municipalities and autonomous regions of China from 2004 to 2017. Spatial and temporal differences were then analyzed. The results show that (1) The ecological efficiency of agricultural land in China decreased overall from 2004 to 2017. (2) The eco-efficiency of agricultural land was highest in the eastern provinces, lowest in the central provinces, and moderate in the western provinces. (3) Among the input indicators, the input redundancy rates of agricultural land, chemical fertilizer input and agricultural film input were too high. (4) China’s agricultural land use has not evolved towards harmonious development of the environment and economy. Due to the excessive use of chemical fertilizers, agricultural films and other factors that cause pollution, there has been a one-sided increase in the economic output of agricultural land, and improvements in ecological value have been inhibited. Based on the research results, feasible suggestions are put forward to improve the ecological efficiency of agricultural land in China.

1. Introduction

Land has the characteristics of being non-renewable, fixed in location, and difficulty in changing the direction of utilization [1]. It has been regarded as humans’ most precious resource since ancient times. Since the beginning of the 21st century, land-use management has aimed for protective development and sustainable use. However, according to data released by the Ministry of Natural Resources of China, the area of agricultural land in China decreased from 657.02 million ha in 2004 to 644.8 million ha in 2018, while the per-capita arable land area decreased from 0.097 ha in 2017 to 0.076 ha in 2020 [2]. Therefore, the efficient and sustainable utilization of agricultural land has become the primary concern of the Chinese government. The Central No. 1 document issued by the Chinese government from 2004 to 2020 focuses on agriculture, rural areas and farmers, emphasizing that the rational use and sound improvement of agricultural land are important in linking and coordinating the development of agriculture, rural areas and farmers. At the Central Rural Work Conference held in 2019, it was clearly stated that China’s food security is the top priority of agriculture, and it was proposed that the construction of high-standard farmland be sped-up. The utilization of agricultural land not only needs to rely on the red line of 1.2 million km2 of cultivated land to provide “quantity” protection, but it also needs to achieve “quality” improvement under the requirements of high-standard farmland construction. Published in November 2020, China’s 14th Five-Year Plan aims to achieve the green transition of production and lifestyle, make substantial increases in resource utilization efficiency, and continuously improve the ecological environment [3]. The inseparability of sustainability, economy, ecology and efficiency will be the main theme of China’s future development policies. The efficient use of agricultural land is key to achieving the coordinated development of economic and ecological goals and is related to the security and sustainability of China’s agricultural development.
The evaluation and calculation of pollution sources such as heavy metal pollution and biological pollution in the indicators of the undesired output of agricultural land have not yet achieved breakthroughs in existing research, and the comprehensive evaluation of ecological indicators of agricultural land is a research gap. The novelty of this paper is to redefine the input index system of the ecological efficiency and the ratio of economic value added to the environmental impact of China’s agricultural land. We introduce and recalculate two undesirable output indicators—carbon emissions and other pollution—in the output indicators of agricultural land use in each province. To evaluate the ecological efficiency of agricultural land, the SBM-Undesirable model was selected to reduce the error caused by traditional data envelopment analysis. The objective is to combine with the Malmquist index to achieve horizontal and vertical comparisons of agricultural land ecological efficiency in different provinces and different periods. This provides a theoretical basis and decision-making reference for policies that are relevant to agricultural land use in China.

2. Literature Review

2.1. Eco-Efficiency of Agricultural Land

Traditional economics uses various methods, data and theories to optimally allocate scarce resources to maximize benefits. Because agricultural land has a superposition of economic, ecological and social benefits during its use, agricultural land resources have strong externalities and public goods attributes [4]. Hence, it is not feasible to blindly pursue the maximization of the economic output of agricultural land at the expense of land resources. China contains 21% of the world’s population but has only 7% of its land area. Therefore, improving the quality of cultivated land has become a focus in many fields of research.
The concept of eco-efficiency was proposed by Schmalleger and Sturm of Germany in 2020 [5]. It is defined as the ratio of the output of economic activities to the change in environmental impact in a certain period. Its core concept is that lower resource input can achieve higher economic output while maintaining lower pollution emissions. In 1996, the World Federation of Industry and Commerce for Sustainable Development defined ecological efficiency as economic and social sustainable development that can provide products and achieve the maximum output with the least resource input and pollution by changing production technology and management methods [6]. In other words, eco-efficiency refers to the ratio between economic added value and environmental damage [7]. China’s current economic development mostly adopts an investment-driven model and focuses on the improvement of capital and labor efficiency. However, with the increasing ecological and resource degradation of recent years, the driving forces of China’s economic development should be adjusted accordingly. The original focus on capital and labor efficiency has shifted to ecological efficiency [8]. The same problem also exists in agriculture. Due to the large number of small-scale farmers and the low degree of agricultural modernization in China, sustainable production ideas are lacking and there is a focus on short-term economic benefits. Therefore, studying the ecological efficiency of agricultural land is important for China’s agricultural economic development.

2.2. Eco-Efficiency Assessment of Agricultural Land

Studies on the efficiency of agricultural land usually consider the total agricultural and rural output value and the per capita income of farming households as the expected output. These reflect economic benefits and grain production, which reflects social benefits [9,10,11]. However, with the improvement of national ecological protection concepts and environmental governance capacity, ecological value has been included in considerations of agricultural land utilization efficiency. This has become an entry point to scientifically reflecting upon the real effect of land utilization and it is also an inevitable requirement of eco-civilization in China [12,13]. Due to the differences in indicators and measurement methods, existing studies are still at the primary stage of indicator refinement and methodological revision for the measurement and evaluation of the ecological efficiency of agricultural land [14,15]. Therefore, in practical studies, evaluation methods vary widely and there is not yet a consensus. In a related study in China, the efficiency of urban agricultural land in Xi’an was evaluated by constructing a comprehensive evaluation index of the land efficiency of multifunctional-output urban agriculture. A data envelopment analysis (DEA) model was used to explore the temporal and spatial changes in urban agricultural land efficiency [16]. The SBM-Undesirable model was used to measure the ecological efficiency of agricultural land in Jiangxi Province from 1990 to 2017 and to analyze its spatial and temporal variations, based on which a Tobit model was used to explore the influences of related factors [17]. The dynamics of agricultural eco-efficiency in China from 2007 to 2016 were studied by constructing a super-efficient DEA-Malmquist model, analyzing its distribution characteristics using a spatial autocorrelation model, and exploring the main factors driving spatial and temporal changes in agricultural eco-efficiency using a grey correlation model [18].
Related studies from outside China have focused on the analysis of the impacts of agricultural land-use change on eco-efficiency. Using a factor analysis system SBM-undesirable model, panel data from 31 Chinese provinces from 2007 to 2017 were adapted to calculate the agricultural ecological yield of each province. The ecological performance impacts were calculated using a carbon transfer network-impact analysis panel [19]. The impact of land-use type on the provision of multiple ecosystem services was explored through the development of a typical land-use scenario for Dorset in southern England. The results indicate that the economic contribution of rural land is much greater than that of agricultural production [20]. In other words, the contribution of agricultural land is not only to produce food, but it also includes ecological contributions, etc. The relationship between agricultural land rent and ecosystem services was described by a spatial criteria decision analysis model. Ecogeographic maps were combined with environmental criteria to rank the current overall value of all Danish agricultural land to society in terms of land rent and other ecosystem services, and four possible scenarios for Danish agricultural land in 2050 were presented. The conclusions show that to achieve the dual goals of agricultural production and sustainable development, policymakers should consider differences in development paths and land-use changes between different agricultural zones [21]. By exploring the temporal variation in agricultural land-use change in the Ganges Delta, Bangladesh, and its impact on ecosystem services, a significant link between them was found. A continuous decrease in agricultural land area (due to salinization) and an increase in wetland area was attributed to the conversion of agricultural land to shrimp farming wetlands in the study area, which is a type of land-use change that requires significant capital input [22]. Therefore, it is easier to improve the eco-efficiency of agricultural land by changing agricultural land use in economically developed areas than in less developed areas.

3. Data and Methods

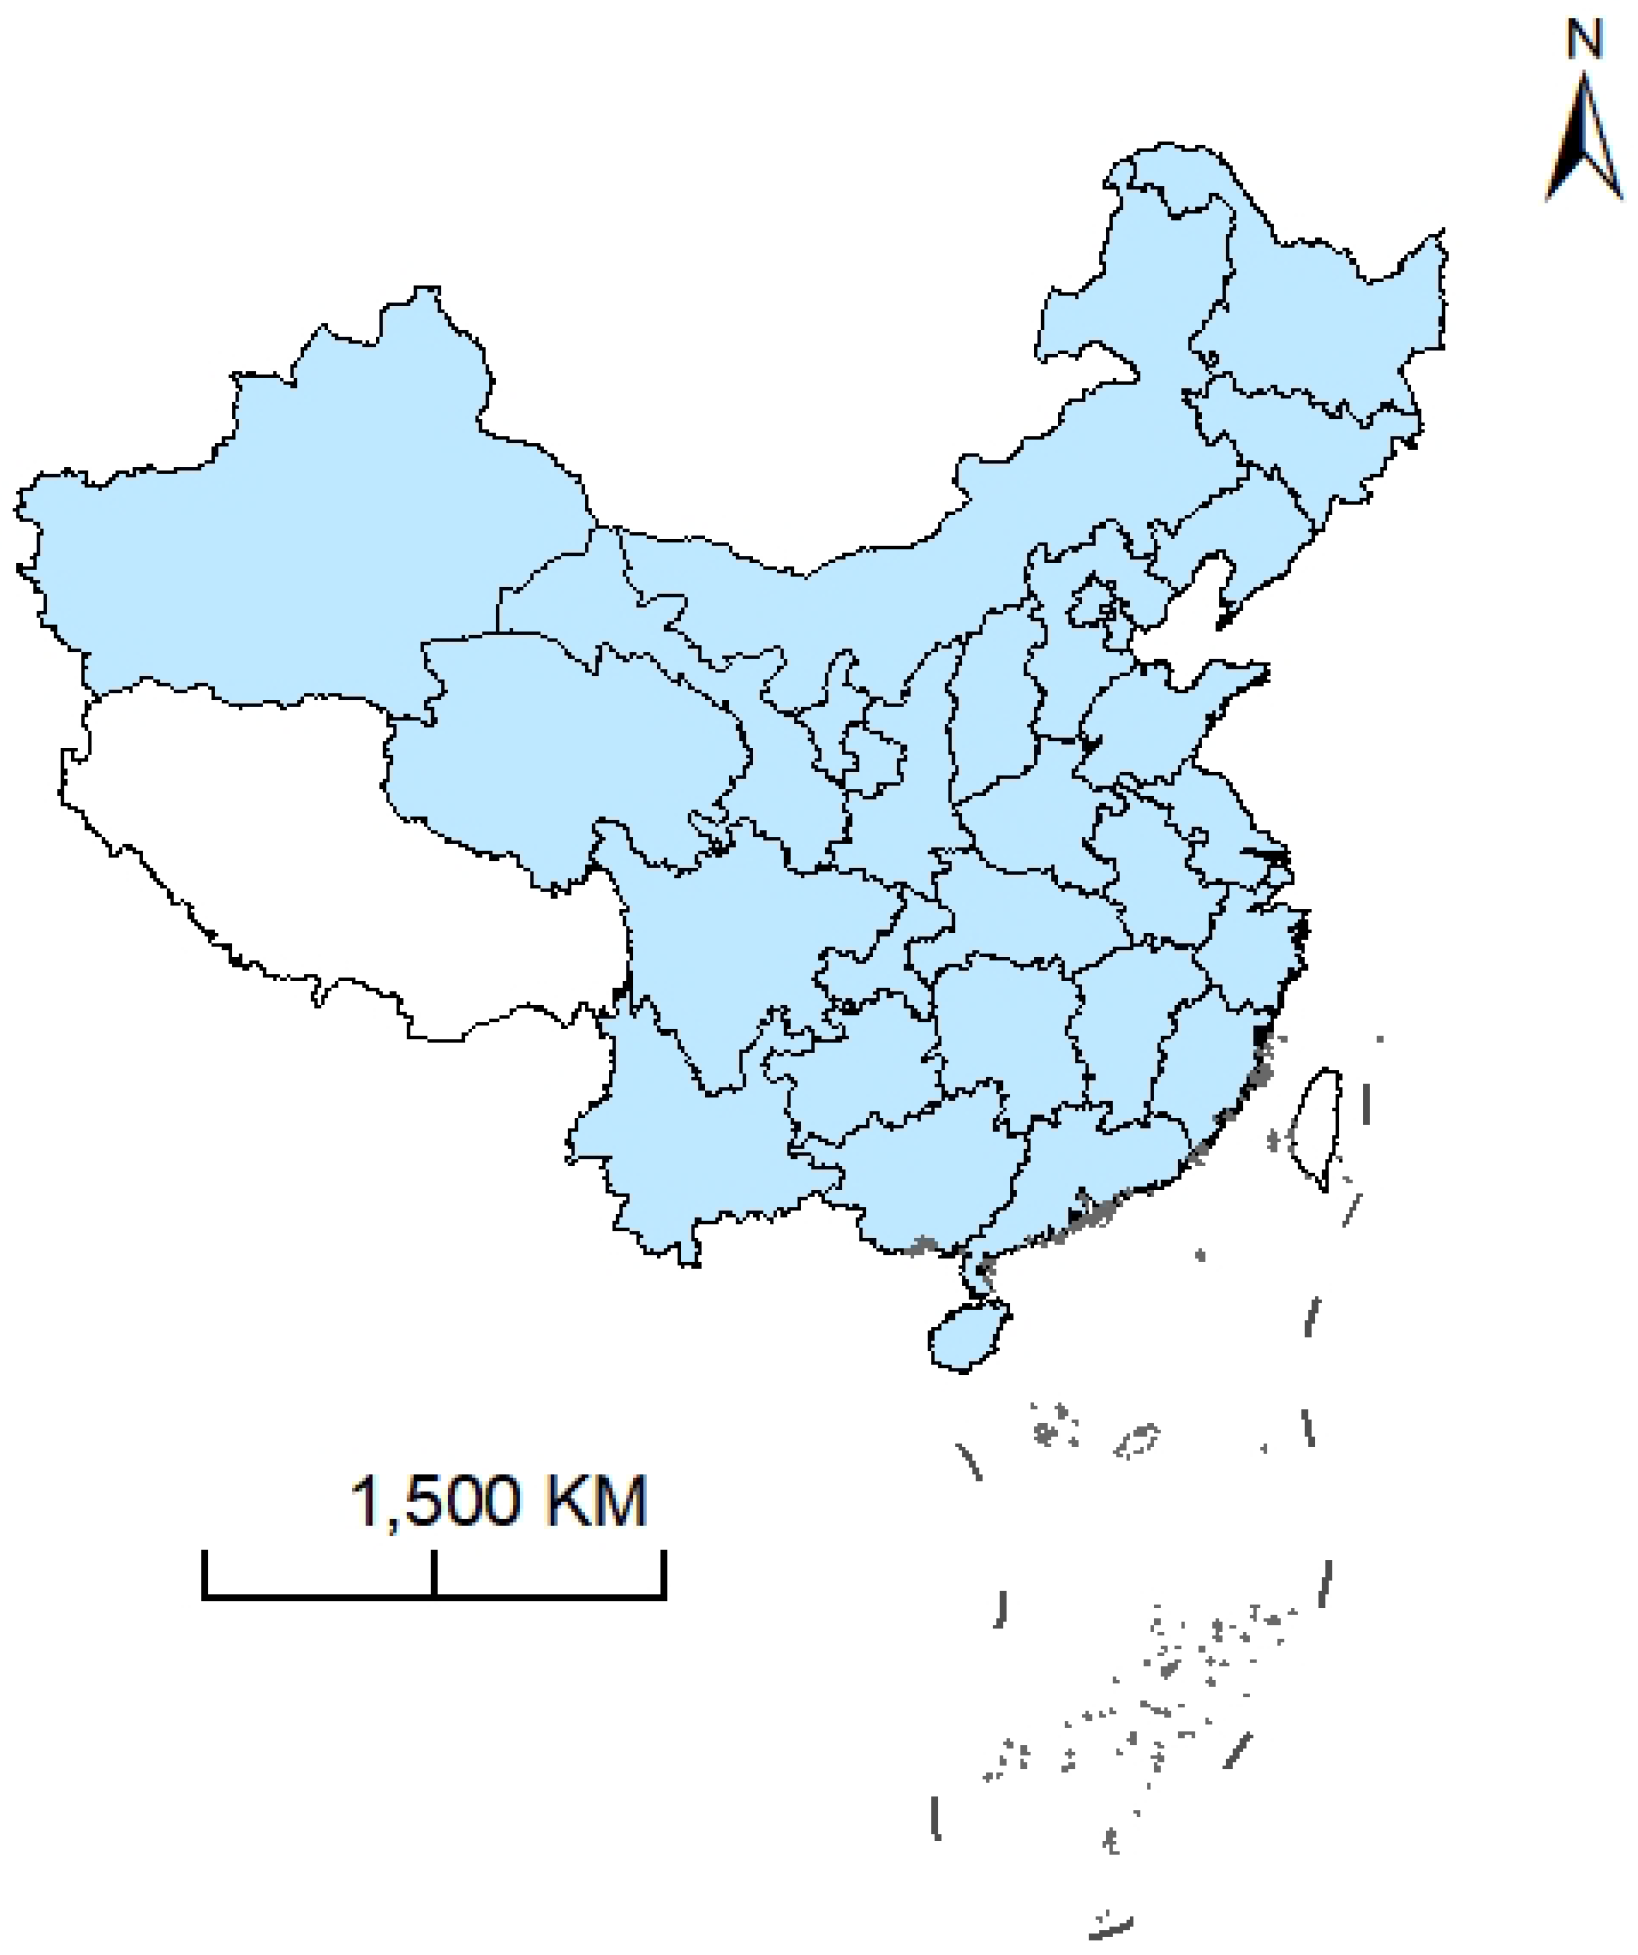
3.1. Study Area and Data Sources

3.1.1. Overview of the Study Area

China is located in the eastern part of the Eurasian continent and forms the west coast of the Pacific Ocean. Its terrain shows a three-stage decreasing step change from west to east, with a complex topography and climate. The superior natural conditions and long history of agriculture have made China a largely agricultural country since ancient times. According to the latest statistics published by the Ministry of Natural Resources of China in 2018, in 2016, China had a total of 645,126,600 ha of agricultural land, including 134,921,000 ha of arable land, 14,266,300 ha of garden land, 252,908,100 ha of forests, 219,359,200 ha of pastures and 39,095,100 ha of construction land [2]. With the development of China’s agricultural technology, chemical agricultural products such as fertilizers, pesticides, and plastic films have been gradually promoted and popularized. On the one hand, these measures have brought convenience to farmers and significantly increased the output of agricultural products. On the other hand, they have also caused land pollution and food safety issues, etc., which have made prominent the phenomenon of the “anti- ecologicalization” of agriculture [23].
In this study, the Hong Kong SAR (Special Administrative Region), Macao SAR and Taiwan were excluded, as was the Tibet Autonomous Region, as it is located on the Qinghai-Tibet Plateau, has a complex ecological environment, and the ecological service value of its agricultural land is difficult to assess [5,22]. Therefore, the sample areas that were selected for this study were China’s remaining 30 provinces (autonomous regions or municipalities). The research area covers 8,334,447 km2, accounting for 86.8% of China’s land area. Figure 1 shows the study area.

3.1.2. Data Sources and Processing

The research data were mainly obtained from the China Statistical Yearbook, China Rural Statistical Yearbook, China Environmental Statistical Yearbook, China Population and Employment Statistical Yearbook, National Compilation of Information on Costs and Benefits of Agricultural Products and the First National Pollution Source Census Workbook from 2004 to 2017. Individual indicator values were obtained from the Second Land Survey Bulletin and the Annual Land Change Survey Bulletins of different provinces. The missing data in the study cycle were supplemented by the Second Land Survey data of each province and the Annual Land Change Survey data published on the official website of the Department of Natural Resources. Data for individual missing years were processed and converted using the smoothed data processing method. This method ensures the comparability and objectivity of the individual missing values in some provinces from 2009 to 2013 and uses the existing data in other years to estimate the missing values by calculating the multi-year average change rate of the agricultural land area. Except for the years with complete data, the agricultural land area with a few missing years is equal to the sum of the estimated agricultural land areas. In addition, price data were converted to equivalents of 2004 prices for the sake of consistency. Spatial geographic data were obtained from the 1:3 million vector data provided by China National Basic Geographic Information Data Center.

3.2. Indicator System

To evaluate the ecological efficiency of agricultural land from ecological and economic perspectives, it is necessary to take a multidimensional view of the anthropogenic use of agricultural land. In addition, the use of agricultural land is a multi-input and multi-output system, and the scale of agricultural land inputs should be considered along with other elements invested in agricultural land to comprehensively and objectively reflect the ecological efficiency of agricultural land. Based on existing research, this paper selected input and output indicators based on the principles of relevance, scientific and data availability to fully consider the input–output relationship in the process of agricultural land use. The three aspects of input, desired output and non-desired output data were selected. The meaning of each input–output indicator and a descriptive statistical analysis are shown in Table 1.
The area of agricultural land was used as an indicator of land scale. Pesticides and agricultural fertilizers act directly on agricultural land and are the main causes of pollution, so the amounts of pesticides and fertilizers applied were selected as input indicators. The use of agricultural plastic film can also directly affect the ecological environment due to pollution from its residues, which has an impact on ecological efficiency. Agricultural plastic film use was used to reflect the input of agricultural film. Agricultural diesel fuel use is one of the main causes of greenhouse gas emissions in rural areas; hence, agricultural diesel fuel consumption was used to reflect the efficiency of agricultural land use from the perspective of ecological constraints.
This paper analyzed agricultural land-use processes from both economic and ecological perspectives. From an economic perspective, the output of the agricultural land-use process should be measured according to the economic value of the output products of a fixed area of agricultural land within a certain period. The gross domestic product of primary industries in each region according to the statistical yearbook was used as an indicator of the economic output variables of agricultural land. From an ecological perspective, the determination of output indicators should be considered in terms of both positive and negative outputs related to the natural environment in the process of agricultural land use. The eco-service value of agricultural land was used as an agricultural land ecological indicator to evaluate the ecological efficiency of agricultural land. In the process of agricultural land use, the use of pesticides, fertilizers, diesel fuel and other forms of energy have negative impacts on the natural environment. At the same time, sowing, fertilization, irrigation and tillage produce various levels of carbon dioxide emissions. Combined with existing research results, this paper selected two indicators of non-desired output: surface source pollution and carbon emissions.
For the harmful emissions in the process of agricultural land use, this paper separately calculated the carbon emissions and surface source pollutant emissions caused by agricultural land use. Different levels of carbon dioxide emissions are generated from seeding, fertilization, irrigation and tillage. Since the CO2 emissions of agricultural land use in different provinces in China cannot be measured in the field, and because the CO2 emissions in existing statistical yearbooks only relate to regions or industries, this paper drew on the calculations of [17,24]. Select the operations involved in the process of agricultural land use to estimate six types of carbon emission sources: chemical fertilizers, pesticides, agricultural film, agricultural diesel use, irrigation and sowing.
The formula for calculating carbon emissions in different regions is:
C t = i = 1 n c i t = i = 1 n ε i × P i t
Equation (1) C t denotes the total carbon emissions of agricultural land in a province in period t ; c i t denotes the carbon emissions of i indicator in a province in period t ; P i t denotes the use or area of indicator i in a province in period t . ε i denotes the carbon emission coefficient of indicator i in a province, and the carbon emission coefficients of fertilizers, pesticides, agricultural film, agricultural diesel use, irrigation and seeding were 0.8956 kg C/kg, 4.931 kg C/kg, 5. 18 kg C/kg, 0.5927 kg C/km, 20.476 kg C/km2 and 312.6 kg C/hm2, respectively.
The sum of agricultural film and fertilizer residues was used as an index of surface pollution. The entropy value method was used to analyze the weights of mulch residue and fertilizer pollution so they could be combined into a surface pollutant index. The calculation formulas are as follows:
F i t = α i × L i t
T i t = N i t + P i t = l = 1 n β i × γ l × I i l t + l = 1 n δ i × θ l × I i l t
In Equation (2), F i t indicates the residual amount of mulch in the i province in period t ; α i indicates the residual coefficient of mulch in the i province; and L i t indicates the amount of mulch input in the i province in period t . In Equation (3), T i t indicates the fertilizer effluent of the i province in period t ; N i t indicates the sum of phosphate fertilizer effluent of the three fertilizers in the i province in period t ; P i t indicates the sum of phosphate fertilizer effluent of the three fertilizers in the i   province in period t ; β i indicates the nitrogen fertilizer loss rate of the i province, γ l indicates the nitrogen fertilizer product coefficient of the l fertilizer and I l indicates the input of the i province in period t ; and δ i indicates the i province’s phosphate fertilizer loss rate, θ l denotes the phosphate fertilizer product coefficient of the l fertilizer, and I l denotes the amount of the l fertilizer input in period t in the i province.

3.3. Research Methods

3.3.1. Assessing the Ecological Service Value of Agricultural Land

Costanza’s approach to valuing ecosystem services, proposed in 1997, is a scientific demonstration of a breakthrough in research into ecosystem service values. However, Costanza’s study was based on global ecosystem services. The simple application of Costanza’s method to measure the value of ecosystem services in China soon led to many controversies. Based on Costanza’s method, Xie proposed a Chinese version of the ecosystem service system and used it to calculate the Chinese ecosystem service value per unit area [25]. After several revisions, it was more widely accepted in China. This paper chose the equivalent factor method to calculate the ecological service value of different agricultural land regions.
Calculation idea: The key to using the equivalence factor method to measure the ecological efficiency of agricultural land is to determine the eco-service value of 1 equivalence factor. In this study, the value that is generated by food production in the natural state of 1 ha of farmland in a year is defined as “1 equivalent factor”. The method for estimating the ecological service value of 1 equivalent factor per unit area of farmland ecosystem is based on the calculation method of Xie Gaodi. Its calculation formula is:
E n = 1 7 i = 1 n a i q i p i a ( i = 1 , 2 , 3 , n )  
In Equation (4), E n denotes the ecological service value provided by the food production function of 1 ha of farmland ecosystem (yuan/ha), i.e., the ecological service value of 1 equivalent factor; i denotes the total food production category of the farmland ecosystem and a i denotes the sown area of food (ha); q i denotes the average yield of the nth crop (kg/ha); p i denotes the average price of i food (yuan/kg); and a denotes the total sown area of the selected n crops (ha). The “1/7” term in the formula is based on the research of scholars who found that the economic value-per-unit of farmland ecosystem in the natural state is 1/7 of the economic value that is produced in the state of human input of each production factor.
After obtaining the ecological service value of 1 equivalent factor, the ecological service-value-per-unit area was further calculated according to the ecosystem ecological service-value-per-unit area equivalence table. Its calculation formula is:
  E S V = i = 1 n V i t × A i t  
The formula E S V indicates the total ecological service value of agricultural land in the study area (yuan); V i indicates the ecological service-value-per-unit area of the agricultural land type in period t (yuan/ha); and A i t indicates the area of the agricultural land type in period t (ha).
The biomass factor method was used to further correct the differences in ecological service values between provinces. Its calculation formula is:
    B E S V i t = E S V i t × B i  
Finally, the ecosystem service values of agricultural land in 30 provinces and autonomous regions of China were estimated.

3.3.2. SBM-Undesirable Model of Non-Desired Outputs

In the process of agricultural land use, the goal is to achieve more economic and ecological outputs and fewer carbon emissions and pollution with as few input factors as possible, meaning that carbon emissions and pollution are evaluated as non-desired outputs. This paper selected the SBM (Slacks Based Measure)-Undesirable-Malmquist model for analysis, which includes undesired outputs in the data envelopment analysis method. The SBM-Undesirable model has the characteristics of being non-angular and dimensionless. It effectively evaluates the decision units containing undesired outputs and reduces the bias caused by a traditional DEA model when measuring efficiency. The SBM-Undesirable model can objectively and truly reflect the ecological efficiency of agricultural land.
SBM-Undesirable model assumptions and principles: It is assumed that the agricultural land-use system contains n decision units, i.e., DMUs (Decision making unit). Each decision unit contains m inputs, desired outputs, and non-desired outputs. The formula is expressed as follows:
  p * = min 1 1 m i = 1 m s i x i 0 1 + 1 s 1 + s 2 ( r = 1 s 1 s r g y r 0 g + r = 1 s 2 s r b z r 0 b )  
s . t { x 0 = X λ + s i y 0 g = Y g λ s g z 0 b = Z b λ + s b s i 0 ,   s g 0 , s b 0 , x X λ , z b Z b λ ,   y g Y g λ λ 0 }
In the formula, p * denotes the ecological efficiency value of agricultural land, where 0 ≤ p * ≤ 1; s i denotes the slack variables of inputs, s g denotes the slack variables of expected outputs, s b denotes the slack variables of non-expected outputs; x denotes the value of inputs, y g denotes the value of expected outputs, z b denotes the value of non-expected outputs; X denotes the matrix composed of input indicators, Y g denotes the matrix composed of expected output labels, Z b denotes the matrix consisting of non-desired output indicators, λ is the weight and p * decreases strictly with input, desired output, and non-desired output slack variable. When p *     = 1, and s i   =   s g   =   s b   = 0 indicates that there is an optimal solution to the model, there is no input deficiency or input redundancy, the desired output does not increase with the input, and the non-desired output does not decrease with the input, this state indicates that the decision unit is completely efficient. When p * < 1 or s i , s g ,   s b not all equal to 0, it means that there is efficiency loss and it is necessary to make adjustments to the corresponding inputs and outputs in order to achieve the optimal efficiency.

3.3.3. Global Covariate Malmquist Index

The ecological efficiencies of agricultural land in different provinces that are estimated by the SBM-Undesirable model can only be compared within the same time period. A longitudinal comparison of the eco-efficiency of agricultural land in the same province is not possible. To carry out a horizontal and vertical comparison of the ecological efficiency of agricultural land in the same province, this paper used the global reference Malmquist index to process the panel data. Since the Malmquist index with reference to the same frontier in each period has transferability, the ecological efficiency values of agricultural land obtained according to the Malmquist model in each period are comparable. The formula is derived as:
M g ( x t + 1 , y t + 1 , x t , y t ) = E g ( x t + 1 , y t + 1 ) E g ( x t , y t )
E C = E t + 1 ( x t + 1 , y t + 1 ) E t ( x t , y t )
T C g = E g ( x t + 1 , y t + 1 ) / E t + 1 ( x t + 1 , y t + 1 ) E g ( x t , y t ) / E t ( x t , y t ) = E g ( x t + 1 , y t + 1 ) E t + 1 ( x t + 1 , y t + 1 ) E t ( x t , y t ) E g ( x t , y t )
M g ( x t + 1 , y t + 1 , x t , y t ) = E C × T C g
In the formula, x denotes different inputs, y denotes different outputs, t denotes the period and E t denotes the distance function in period t. M g is the productivity change index in the process of agricultural land use and E C denotes the technical efficiency index (which is the ratio of the current agricultural land efficiency to that in the previous period). T C g denotes the efficiency index of technical progress in agricultural land use, reflects the change of agricultural land-use efficiency (where values > 1 mean that the efficiency is better than in the previous period), and reflects the change in agricultural land-use technology (where values > 1 mean that the technology is better than in the previous period).

4. Results

4.1. Spatial Differences in Ecological Efficiency

Spatial Differences by Province

Using MAXDEA software, we measured and assessed the eco-efficiency of agricultural land in 30 provinces in China from 2004 to 2017. According to the efficiency classification criteria of Xiao and Zheng [26,27], and combined with the efficiency values assessed in the present study, the final assessed ecological efficiency values of agricultural land were classified into four levels. Efficiency values of 0 ≤ E < 0.5 indicate low efficiency of the ecological use of agricultural land; values of 0.5 ≤ E < 0.75 indicate moderate efficiency; values of 0.75 ≤ E < 1 indicate high efficiency; and E = 1 indicates optimal efficiency (no room for improvement).
In order to analyze the spatial differences in the eco-efficiency of agricultural land, this study calculated and ranked the average values of the 30 provinces from 2004 to 2017. The results are shown in Table 2.
The results show that the average ecological efficiencies in 22 provinces, including Qinghai, Jiangxi and Beijing were >0.75 during the study period. The averages in Liaoning, Hubei and Jilin Provinces were 0.5–0.75 (moderate efficiency). The reason for this result is that these provinces have less redundancy in inputs to the land use process.
The average ecological efficiencies in Anhui, Yunnan, Heilongjiang, Gansu and Shanxi Provinces were <0.5 (low efficiency). In the study period, Qinghai reached the optimal eco-efficiency in all years except 2013, and its multi-year average of 0.99 was the highest among all provinces. Hainan and Guangxi reached optimal efficiency in 12 years each, only failing to attain it in 2014 and 2015, and in 2005 and 2016, respectively, with high efficiency attained in those years. The efficiencies of Jiangxi and Shanghai in sub-optimal years were >0.8 (high efficiency) and there were no clear temporal trends. The difference in efficiencies between Tianjin and Guizhou in the sub-optimal years was large; Tianjin’s 2016 value of only 0.66 and Guizhou’s 2011 value of 0.64 were both much lower than those of other years. Beijing and Sichuan each had optimal efficiency in 10 years during the study period, while the other years had values > 0.9 without much variation. Hunan, Ningxia, Jiangsu, Guangdong, Fujian and Chongqing had higher overall agricultural land-use efficiencies, with half of the years in the study period being optimal. The efficiencies of 15 provinces, including Shaanxi, Henan and Zhejiang, reached the optimal input–output in only a few years, while in six of the provinces, including Hubei, Anhui and Yunnan, the efficiency was not optimal within the study period and all had the potential for efficiency improvement.
The efficiencies of each province within each region also had large differences. For example, in the central region, which had the lowest average eco-efficiency, Henan and Hunan Provinces reached high efficiency in many years, while Shanxi and Hubei Provinces had medium-low efficiency. Hence, efficiency may differ between provinces within the same region, suggesting that location is not the determining factor.

4.2. Spatial-Temporal Changes in the Eco-Efficiency of Agricultural Land in China

Calculate the average value of the agricultural land ecological efficiency of each region and the country from 2004 to 2017 and visualize the data. This can reflect the dynamics of the annual ecological efficiency of agricultural land in the eastern, central and western regions. The results are shown in Figure 2.
As can be seen from Figure 3 and Figure 4, the average efficiencies of the 30 provinces generally remained at about 0.8 from 2004 to 2017. However, from 2004 to 2016, there was an overall decreasing trend and, from 2016 to 2017, the national average of efficiency started to improve but was still lower than the average prior to 2012. Looking at the ecological land-use process in China through a green economy lens reveals that agricultural land-use during the study period became non-conducive to resource efficiency improvement.
In terms of regional structure, the ecological efficiency of agricultural land in the eastern, central, and western regions showed a decreasing trend overall, but with an efficiency increase between 2016 and 2017. The efficiency of the eastern provinces over the years was the highest among the three regions with an average value of >0.91 over 14 years. The eco-efficiency of agricultural land reached a high level. The efficiency of the western provinces was higher than in the central region and lower than in the eastern region in all years. The efficiency in all years was comparable to the national average, except in 2013, 2016 and 2017, when it was slightly lower than the national average. The mean efficiency value of 0.82 in the other study years was higher than the national average. The average efficiency in the central provinces was the lowest among the three regions with an average value of only 0.62 (moderate efficiency). The change in efficiency in the central region was more moderate than in the eastern and western regions overall, while the average in the western provinces had >30% room for improvement over the years.

4.3. Input–Output-Related Indicators of Agricultural Land in China

4.3.1. Overall Analysis of Input–Output-Related Indicators

Based on the calculation results of the ecological efficiency of agricultural land, in general, the average redundancy rate of input factors in the ecological use of agricultural land nationwide during the study period ranged from 6% to 14%. The top three input factors with the highest average redundancy rates were 13.69% (agricultural fertilizer); 13.29% (agricultural land input redundancy); and 11.03% (agricultural film input redundancy). This indicates that the use of agricultural land in China is not economically optimal, with 13.29% of agricultural land being underutilized and agricultural fertilizer inputs being overutilized. The average under-utilization rate of economic value in the expected output of the ecological use of agricultural land was only 0.04%, indicating that the economic output was very close to the optimal expected value and there was little room for improvement. However, the average output deficiency rate of ecological services was as high as 58.41%, which directly affects the improvement of the ecological efficiency of agricultural land. For details, see Table 3.
From 2004 to 2017, the temporal trends in each factor input and output were analyzed. At the factor input level, the redundancy of agricultural land inputs gradually increased, and the redundancy of both pesticides and agricultural fertilizers showed a trend of increasing and then decreasing, with the redundancy of agricultural fertilizers being one of the factors with a high input redundancy rate for many years. The redundancy in agricultural films decreased and then increased, showing a U-shaped trend, and the redundancy of agricultural diesel fuel fluctuated between 4% and 9% for the other years, except for 2016, when it exceeded 10%. In terms of output, the economic output that was measured by the GDP of agriculture was very low and the shortage of the output of agricultural ecological services value (which is a measure of ecological output), as well as the gradual increase in excessive output, including carbon emissions and pollutants, were the main factors leading to the overall decrease in the ecological efficiency of agricultural land in China. The input redundancy and output deficiency situation in eastern, western and central China has obvious differences. The eco-efficiency of agricultural land in the central provinces was high and the redundancy rate of input factors was low compared with other regions.

4.3.2. Analysis of Input-Output-Related Indicators of Agricultural Land in Eastern China

In the eastern provinces, the top three input factors and the degree of redundancy that had a significant impact on the ecological efficiency of agricultural land were: 4.07% redundancy rate of agricultural diesel fuel, 3.93% redundancy rate of agricultural film and 1.95% redundancy rate of pesticide inputs. The output factors that limited the improvement of efficiency were: insufficient output of ecological service value and excessive carbon emissions. In agricultural land use in the eastern provinces, the input redundancy of agricultural land showed a trend of rising and then falling, while the input redundancy rates of pesticides and agricultural fertilizers showed M-shaped trends of rising, then falling and then rising again, while the output of carbon emissions and pollutants maintained an overall increasing trend. For details, see Table 4.

4.3.3. Analysis of Input–Output-Related Indicators of Agricultural Land in Central China

The ecological efficiency of agricultural land in eight of the provinces in central China was lower than that in the eastern and western regions. The main factors limiting the central provinces, in terms of the overall structure of inputs and outputs, were the high redundancy of agricultural land and agricultural fertilizer inputs, and the output of agricultural land ecological services, the value of which was far less than the expected value. The average redundancy of agricultural fertilizer inputs in the central region was as high as 31%, while the redundancy of pesticide inputs was 19.41%, far exceeding the national averages. It is noteworthy that there was no shortfall in the output of gross agricultural product in the central region over 14 years, but the output of the ecological services of agricultural land had a serious shortfall. This indicates that although the central provinces of China achieved the optimal economic output in the process of agricultural land use, they did not take into account improvements in the ecological value of agricultural land. There was an obvious incongruity between the economic and ecological values, thus resulting in the lowest average efficiency in the country. Based on the trend analysis, the redundancy of agricultural land input in eight provinces in central China increased at first and then decreased, while the redundancy of pesticide and chemical fertilizer remained in a state of slow increase overall. The redundancy in agricultural film decreased at first and then increased. The redundancy rate fluctuated at around 15% since 2014. The degree of the redundancy of pesticides, chemical fertilizers, agricultural films and other factors that cause pollution did not improve over time. The degree of redundancy of diesel input in the central region changed slowly and there were fluctuations in different years, but there was no obviously increasing or decreasing trend overall. The insufficient output of agricultural land ecological services in the eight provinces in central China gradually increased, and the carbon emissions and excessive output of pollutants in the unexpected output changed slowly, but the excessive output became increasingly serious, as detailed in Table 5.

4.3.4. Analysis of Input–Output-Related Indicators of Agricultural Land in Western China

The average ecological efficiency of agricultural land in western China was higher than that in the central region and lower than that in the eastern region, which was at the average level within China. The degree of redundancy of agricultural land and agricultural film was the highest among the three input factors, in which the redundancy rate of agricultural land input increased from 12% in 2004 to 28.49% in 2017, although it decreased slightly in 2015, but the utilization of agricultural land in the western region was still lacking. The redundancy rate of agricultural film input increased from 11.46% in 2004 to 23.54% in 2017. In terms of output, the total agricultural output of 11 of the western provinces reached the optimal state, except for insufficient outputs in 2007 and 2013. Among the output indicators, the main reasons for the low efficiency of agricultural land use in western China were the insufficient output of agricultural land ecological services in the expected output, and the excessive output of carbon emissions and pollutants in the unexpected output. The insufficient output of agricultural land ecological services in the western region was lower than that in the central region, but the under-output rate increased rapidly year by year, from 2.09% in 2004 to 69.95% in 2017. Over the years, the degrees of carbon emissions and pollutant output in the non-expected output were higher than expected, and the amounts of these harmful emissions also increased year on year, which limited improvements in agricultural land ecological efficiency in the western region, as shown in Table 6.

4.4. Eco-Efficiency and Technological Development of Agricultural Land in China

The Malmquist index decomposition of the technical efficiency index (EC) and the technological progress index (TC) provide a visual and dynamic representation of the inter-provincial changes in the ecological efficiency and technological progress related to agricultural land. EC and TC values > 1 mean that the efficiency or technology improved compared with the previous period, while values < 1 indicate a regression. Based on the changes in the technological progress index in the ecological use process of agricultural land in different provinces in China, we can find that six provinces (Guizhou, Henan, Liaoning, Ningxia, Shandong and Sichuan) experienced five technological regressions in the studied 14 years. Shaanxi experienced six technological regressions in 14 years, and Xinjiang experienced the most serious technological regressions, with seven of them. Technology in the ecological use process of agricultural land failed to achieve a long-term growth mechanism. The decomposition of the technical efficiency of agricultural land in China is shown in Figure 5.
Except for the above eight provinces, the agricultural land-use technology in Beijing, Fujian, Heilongjiang and other provinces were continuously improved during the study period. Only a few years showed technological retrogression. In terms of time span, more than 2/3 in the 10 stages from 2004 to 2005, 2005 to 2006 and 2006 to 2007 achieved technological progress in the process of agricultural land use, and only the provinces with more than 1/3 in 2007 to 2008, 2013 to 2014 and 2016 to 2017 experienced technological retrogression. Among them, technological retrogression was the most serious from 2016 to 2017, as shown by 22 provinces. Generally speaking, the provinces achieved year-on-year technological progress from 2004 to 2011 in the first half of the study period, and although they maintained technological growth from 2011 to 2017, fluctuations in technology level occurred from time to time. Compared with the technological progress in the process of the ecological utilization of agricultural land, the ecological efficiency of agricultural land failed to increase continuously over time during the study period. The data show that the other 18 provinces outside Beijing, Guangxi, Guizhou, Hainan, Jiangxi, Ningxia, Qinghai, Shaanxi, Shanghai, Sichuan, Tianjin and Zhejiang experienced more than five decreases in efficiency during the study period. The efficiency of many provinces did not improve for many years. In different periods, only the provinces with decreased ecological efficiency from 2005 to 2006, 2007 to 2008, 2011 to 2012, 2013 to 2014 and 2016 to 2017 did not exceed 1% of the total. Among them, more than half of the provinces experienced declines in efficiency from 2008 to 2009 and from 2014 to 2015. The number of provinces that experienced a decline in efficiency between 2012 and 2013 and between 2015 and 2016 exceeded 2/3. Thus, it can be seen that the process of agricultural land ecological use is based more on technological progress to achieve the improvement of the total factor productivity index, and agricultural land ecological efficiency has not achieved a good long-term growth trend. On the contrary, the ecological efficiency of agricultural land in each province developed a direction that was not conducive to improvement in efficiency during the study period. The technological progress index and efficiency index of the ecological use of agricultural land are detailed in Table 7 and Table 8. The values < 1 of the tables indicate periods of decline in technology or efficiency in each province.

5. Discussion and Conclusions

5.1. Discussion

This paper investigated spatial and temporal differences in the ecological efficiency of agricultural land in China from an ecological perspective. Situations of non-expected and expected output were compared. The influence of environmental pollution was included in the non-expected output to make up for not considering carbon emissions or surface pollution. At the same time, the introduction of an ecological service value as an expected output indicator reflected the actual changes in the ecological value of agricultural land in different provinces of China more realistically. The spatial and temporal differences and changes in ecological efficiency in different provinces of China were measured and compared with macro panel data. This made the research results more realistic and provides a theoretical basis for governmental decision-making.
The contributions of this paper are as follows:
  • It introduced agricultural land eco-efficiency indicators into an evaluation of the effects of China’s green economic development policies. A dual economic–ecological standard measurement system was constructed to promote the sustainable use of agricultural land and thereby improve its ecological efficiency. Ecological and environmental concepts, such as sustainable development and green GDP are well-known in China, and green economic development has become the goal of industrial development in various regions. However, the assessment results show that the ecological efficiency of agricultural land in China has not improved but, rather, is decreasing. The possible reasons for this are twofold: First, the industrial restructuring that has occurred in China in the 21st century and the rapid development of the commercial economy during that period have somewhat weakened the position of agriculture in economic development [28]. Moreover, due to the long recovery cycles of vegetation and the ecological environment, restoration of the ecological efficiency of agricultural land will not have significant short-term effects;
  • This paper increased the number of ecological evaluation indicators in agricultural output instead of using a single indicator of economic output. In the process of actual agricultural land use, government supervisory departments have the responsibility for determining the output measurement standard of the regional agricultural land ecological service value according to the natural and production situations of different regions. This is not only to make detailed records of the economic output but also to account for the ecological service value in the process of agricultural land use to build a measurement system of economic and ecological double standards. While meeting economic and social development needs, the limit of ecological value output of agricultural land in different provinces should be determined. The development target of ecological service-value output of agricultural land should be formulated in a planned manner, and the sustainable use of agricultural land should be promoted practically on the basis of quantitative data.

5.2. Conclusions

From the above analysis, it can be concluded that:
  • China’s agricultural land eco-efficiency declined overall between 2004 and 2017. The efficiency in each province did not increase continuously, with a significant boost from technological progress between 2004 and 2011, but experienced a technological regression in the use of agricultural land in several provinces from 2011 to 2017;
  • The comparison of 30 provinces in the eastern, central and western regions revealed that the ecological efficiency of agricultural land in the eastern provinces was the highest, followed by the western provinces and central provinces. The 22 provinces represented by Qinghai, Jiangxi, Beijing and Hainan all maintained high efficiencies of >0.75 in all years. Eight provinces, represented by Anhui, Gansu and Yunnan, had moderate-to-low efficiencies of <0.75 in all years.
  • According to the increases in the indicators, it can be found, both from the regional overall and inter-provincial differences, that the excessive redundancy rate of agricultural land inputs, the excessive redundancy rate of fertilizer inputs, and the excessive redundancy rate of agricultural film inputs were the elements that most affected the ecological efficiency of agricultural land. The insufficient output of ecological services, the excessive output of carbon emissions, and the excessive output of pollutant emissions were the main elements restricting the improvement of efficiency;
  • When ecological indicators were introduced to assess the ecological efficiency of agricultural land in China, the process of agricultural land use in China did not evolve in the direction of harmonizing environmental and economic development, and the excessive use of pollution-prone elements such as chemical fertilizers and agricultural films only unilaterally promoted the increase in economic output of agricultural land, but inhibited the improvement of ecological values.
In addition, the results of this study have important policy implications. First, based on the current situation—that the eco-efficiency of agricultural land in China has decreased rather than increased over the past 14 years—we should not dismiss the green development policies that were implemented by the government, but should look to the long term, as we can see from the data that the eco-efficiency of agricultural land in China has recovered since 2017. Therefore, the government should implement further green development policies and focus on sustainable agricultural development. We expect positive results from future related studies. Secondly, due to the regional and provincial differences in the ecological efficiency of agricultural land, provincial governments in medium- and high-efficiency areas should continue to promote green development, strictly enforce regulations and implement policy. Provincial governments of inefficient areas should “seek reasons, focus on key points and find ways”. First, they should determine the reasons for the low ecological efficiency of agricultural land and then formulate corresponding policies. For example, the cause of the low ecological efficiency of agricultural land in Anhui Province was mainly the high input redundancy of pesticides and chemical fertilizers, resulting in an insufficient output of ecological service value. In this case, the focus of future work should be to restrict pesticide and chemical fertilizer investment and develop organic agriculture.

6. Limitation

Through a literature review, we found that the evaluation of the eco-efficiency of agricultural land is still in an early stage of research. Assessment methods vary but the results generally reflect the importance of the eco-efficiency of agricultural land to agricultural production. The policy recommendations of several studies involve keywords such as green development and sustainable development.
While the present study developed the research area and methods, some limitations remain:
  • The data covered multiple periods and regions, and individual indicator data in some regions were missing from the statistical yearbooks. Although estimates of the missing values were obtained, they may not always be realistic;
  • Due to the limited macro-statistical data, this paper did not conduct further empirical tests on the proposed mechanisms of influence. Future research is needed to achieve a more comprehensive and rigorous verification of these mechanisms.
  • The constant dynamics of the ecological environment and vegetation structure of agricultural land in different regions may lead to bias in the correction factors. Real-time data on the ecological indicators of agricultural land need to be improved in terms of timeliness and accuracy;
  • This study shows that the non-expected output indicators of agricultural land consider carbon emissions and ground pollution, and the evaluation and measurement of heavy metal pollution, biological pollution and other pollution sources in the process of agricultural land use are still incomplete, and the comprehensive and integrated evaluation of the ecological indicators of agricultural land needs to be deepened.

Author Contributions

Conceptualization, S.G. and Z.H.; methodology, S.G.; software, Z.H.; validation, S.G., H.M., D.X. and R.H.; resources, D.X and R.H.; data curation, S.G.; writing—original draft preparation, S.G., Z.H. and H.M; writing—review and editing, S.G.; visualization, H.M.; supervision, D.X.; project administration, R.H.; funding acquisition, S.G. All authors have read and agreed to the published version of the manuscript.

Funding

We gratefully acknowledge the financial support from Sichuan Province Social Science Research “14th Five-Year Plan” 2021 Annual Project (SC21ST011); the Fundamental Research Funds for the Central Universities (JBK2102018); the National Natural Science Foundation of China (Grant No. 41601614); and the Sichuan Center for Rural Development Research (CR2107, Mechanism of Farmers’ Livelihoods on Ecological Security in Ethnic Regions in Sichuan Province).

Institutional Review Board Statement

Not applicable.

Informed Consent Statement

This article does not contain any studies with human participants or animals performed by any of the authors. Informed consent was obtained from all the individual participants included in the study.

Data Availability Statement

The author may provide raw data if necessary.

Conflicts of Interest

The authors declare that they have no conflict of interest.

References

  1. Zhong, F. Agricultural Economics, 5th ed.; China Agricultural Press: Beijing, China, 2011; pp. 15–18. [Google Scholar]
  2. Ministry of Natural Resources of the People’s Republic of China. Available online: http://www.mnr.gov.cn/sj/tjgb/ (accessed on 14 April 2022).
  3. Suggestions of the CPC Central Committee on the Formulation of the 14th Five-Year Plan for National Economic and Social Development and the Long-Term Goals for the Year 2035. Available online: https://baijiahao.baidu.com/s?id=1682333495473802019&wfr=spider&for=pc (accessed on 14 April 2022).
  4. Niu, H.P.; Zhang, A.L.; Li, M.Q. Reconstruction of economic compensation mechanism of arable land use efficiency system and arable land protection. Agric. Mod. Res. 2009, 30, 164–167. [Google Scholar]
  5. Wang, Y.; Zhang, Y. Regional differences in eco-efficiency and its interactive spatial spillover effect with industrial structure upgrading. Geoscience 2020, 40, 1277–1282. [Google Scholar]
  6. Cui, Z. Study on the Spatial Effects and Influencing Factors of Eco-Efficiency in Shandong Province. Master’s Thesis, Jiangxi University of Finance and Economics, Nanchang, China, 2020. [Google Scholar]
  7. Peter, G.; Rebeka, L. Review of Sustainability Terms and Their Definitions. J. Clean. Prod. 2006, 15, 277–287. [Google Scholar]
  8. Pan, X. Study on the Evaluation, Influencing Factors and Convergence of Regional Eco-Efficiency in China. Ph.D. Thesis, Nanchang University, Nanchang, China, 2014. [Google Scholar]
  9. Feng, X.; Zhou, B.; Chen, Y. Analysis of arable land utilization efficiency based on DEA method: A case study of Fengdu County, Chongqing. China Agron. Bull. 2011, 27, 249–253. [Google Scholar]
  10. Zhang, R.; Jiao, H. Analysis of spatial and temporal pattern divergence and mechanism of inter-provincial arable land use efficiency in China. J. Agric. Eng. 2015, 31, 277–287. [Google Scholar]
  11. Li, S.; Gu, G.; Yao, L.; Wang, J.K.; Chen, Y.; Yuan, Y. Analysis of the change of arable land use efficiency in Heilongjiang Reclamation Area. Arid. Zone Resour. Environ. 2016, 30, 30–35. [Google Scholar]
  12. You, H.Y.; Wu, J.F.; Lin, N.; Shen, P. Evaluation of land use eco-efficiency based on data envelopment analysis. J. Agric. Eng. 2011, 27, 309–315. [Google Scholar]
  13. Jin, G.; Wu, F.; Li, Z.; Guo, B.; Zhao, X. Measurement and analysis of land use and eco-efficiency in rapidly urbanizing areas. J. Ecol. 2017, 37, 8048–8057. [Google Scholar]
  14. Qin, Z.; Wang, L.; Zhang, C.; Long, S.; Yuan, L. A study on the productivity of arable land in the Pearl River Delta based on the Malmquist index method. Ecol. Sci. 2019, 38, 125–130. [Google Scholar]
  15. Zhang, H.; Song, G. Ecological efficiency of arable land use in Heilongjiang Reclamation Area and its internal coordination. Ecol. Sci. 2019, 04, 125–130. [Google Scholar]
  16. Wang, Y.; Zhou, Z.X.; Guo, Z. The impact of urban agricultural landscape fragmentation process on the value of ecosystem services in Xi’an city as an example. Geogr. Res. 2014, 33, 1097–1105. [Google Scholar]
  17. Huang, H.; Wang, Z. Study on the evaluation of agricultural land resource use efficiency and the improvement paths–Example of 11 municipalities in Jiangxi Province. Chin. J. Ecol. Agric. 2019, 27, 803–814. [Google Scholar]
  18. Feng, Y.; Qi, Q.; Han, J. Spatial and temporal evolution and driving factors of agricultural eco-efficiency in China. Soil Water Conserv. Bull. 2018, 38, 254–262. [Google Scholar]
  19. Akbar, U.; Li, Q.L.; Akmal, M.A.; Shakib, M.; Iqbal, W. Correction to: Nexus between agroecological efficiency and carbon emission transfer: Evidence from China. Environ. Sci. Pollut. Res. Int. 2021, 28, 18995–19007. [Google Scholar] [CrossRef] [PubMed]
  20. Newton, A.C.; Evans, P.M.; Watson, S.C.; Ridding, L.E.; Brand, S.; McCracken, M.; Gosal, A.S.; Bullock, J.M. Ecological restoration of agricultural land can improve its contribution to economic development. PLoS ONE 2021, 16, e0247850. [Google Scholar] [CrossRef]
  21. Vogdrup-Schmidt, M.; Olsen, S.B.; Dubgaard, A.; Kristensen, I.T.; Jørgensen, L.B.; Normander, B.; Ege, C.; Dalgaard, T. Using spatial multi-criteria decision analysis to develop new and sustainable directions for the future use of agricultural land in Denmark. Ecol. Indic. 2019, 103, 34–42. [Google Scholar] [CrossRef]
  22. Islam, G.T.; Islam, A.S.; Shopan, A.A.; Rahman, M.M.; Lázár, A.N.; Mukhopadhyay, A. Implications of agricultural land use change to ecosystem services in the Ganges delta. J. Environ. Manag. 2015, 161, 443–452. [Google Scholar] [CrossRef]
  23. Wang, B.; Zhang, W. Study on the measurement of agricultural eco-efficiency and spatial and temporal differences in China. China Popul. Resour. Environ. 2016, 26, 11–17. [Google Scholar] [CrossRef]
  24. Xie, G.; Lu, C.; Xiao, Y.; Zheng, D. Assessment of ecosystem service value of alpine grassland on Qinghai-Tibet Plateau. J. Mt. Sci. 2003, 1, 50–55. [Google Scholar]
  25. Xie, G.; Zhen, L.; Lu, C.; Xiao, Y.; Chen, C. An expert knowledge-based approach to ecosystem service value. J. Nat. Resour. 2008, 23, 911–917. [Google Scholar]
  26. Xiao, P.N. A study on the Spatial-Temporal Coupling of Arable Land Use Efficiency and Urbanization Level in Hunan Province at the County Scale. Master’s Thesis, Huazhong Normal University, Wuhan, China, 2019. [Google Scholar]
  27. Zheng, D.F.; Hao, S.H.; Sun, C.Z.; Lv, L.T.; Cheng, Y.H. Analysis of spatial and temporal evolution of eco-efficiency and its trend prediction in mainland China. Geogr. Res. 2018, 37, 1034–1044. [Google Scholar]
  28. Hu, W.; Yu, S.; Ma, Z.; Zhao, R.; Xin, S. Analysis of spatial and temporal differences in agricultural eco-efficiency in Jiangsu Province based on DEA-Malmquist model. Soil Water Conserv. Bull. 2018, 38, 297–302. [Google Scholar]
Figure 1. Study area.
Agriculture 12 00803 g001
Figure 2. Trends in eco-efficiency of agricultural land in China and regions from 2004–2017.
Agriculture 12 00803 g002
Figure 3. (a) Average value of eastern region provinces; (b) average value of central region province.
Agriculture 12 00803 g003
Figure 4. (a) Average value of western region provinces; (b) Average value of China and regions.
Agriculture 12 00803 g004
Figure 5. Decomposition of technical efficiency of agricultural land in China.
Agriculture 12 00803 g005
Table 1. Meaning of input–output indicators and descriptive statistics.
CategoryIndicator SymbolsIndicator NameIndicator Description
Inputs I 1 Agricultural land area
(Million hectares)
Reflecting the scale of agricultural land input
I 2 Amount of pesticide used
(Million tons)
Reflecting the input of technological factors in the process of agricultural land use
I 3 Amount of agricultural fertilizer
application
(Million tons)
Reflecting the input of technological factors in the process of agricultural land use
I 4 Amount of agricultural
film used
(Million tons)
Reflecting technological inputs in the process of agricultural land use
I 5 Consumption of agricultural diesel
(Million tons)
Reflecting energy factor inputs in the process of agricultural land use
Expected
output
O 1 Gross value of primary industry
(Billion yuan)
Economic indicators of agricultural land use, converted to comparable prices using 2004 as the base year to eliminate price effects
O 2 Value of ecological services of
agricultural land use
(Billion yuan)
Quantification of ecological service outputs in agricultural land use
Non-desired
outputs
O 3 Carbon emissions from agricultural
land use (Tons)
The sum of carbon emissions in the process of agricultural land use, including fertilizer, pesticide, agricultural film, agricultural diesel use, irrigation and seeding
O 4 Emission of surface source pollutants (Million tons)Combined indicators of residues of agricultural land film and pesticide residue pollutants processed by the entropy value method
Table 2. Average ranking of ecological efficiency of agricultural land in 30 provinces of China.
ProvinceEfficiencyRankProvinceEfficiencyRankProvinceEfficiencyRank
Qinghai0.99711Ningxia0.964611Hebei0.786121
Jiangxi0.98812Jiangsu0.963212Inner Mongolia0.760222
Beijing0.98643Tianjin0.961113Liaoning0.706123
Hainan0.98244Chongqing0.948514Hubei0.557024
Guangxi0.98235Guizhou0.944915Jilin0.517425
Shanghai0.98186Shaanxi0.926516Anhui0.439526
Sichuan0.98137Henan0.903217Yunnan0.413827
Hunan0.97828Zhejiang0.899818Heilongjiang0.398628
Guangdong0.97609Shandong0.855719Gansu0.268129
Fujian0.968410Xinjiang0.846520Shanxi0.230530
China Average0.8038
Table 3. Changes in input-redundancy desired output deficiency and non-desired output excess in the ecological use process of agricultural land in China.
ElementsAgricultural Land Input RedundancyPesticide Input RedundancyAgricultural Fertilizer Input RedundancyAgricultural Film Input RedundancyDiesel Input RedundancyInadequate Output of Gross Agricultural ProductInsufficient Output of Ecological Service Value of Agricultural LandCarbon emissions OutputExcess output of Pollutants
Time
Area
2004
National
9.28%4.23%9.96%11.84%6.14%0.00%30.51%9.90%7.13%
2005
National
9.49%5.34%9.45%10.61%7.57%0.00%45.33%9.98%6.35%
2006
National
9.29%6.17%10.45%7.39%6.94%0.00%32.32%9.83%7.03%
2007
National
11.75%7.85%12.23%7.50%8.48%0.04%51.33%11.97%8.65%
2008
National
11.75%6.96%11.66%7.79%4.27%0.01%45.62%10.51%7.12%
2009
National
13.02%7.00%13.10%8.33%6.42%0.10%52.14%11.94%8.99%
2010
National
13.28%7.31%12.47%9.61%4.90%0.00%68.27%11.72%8.14%
2011
National
13.19%8.84%13.82%10.41%4.25%0.12%57.66%12.75%8.52%
2012
National
13.61%8.37%13.33%10.58%5.04%0.10%46.14%12.31%8.26%
2013
National
15.46%10.32%16.38%12.29%7.46%0.25%63.92%15.40%12.14%
2014
National
16.57%9.68%17.14%14.90%8.58%0.00%67.52%16.63%12.50%
2015
National
14.32%10.53%15.06%11.90%7.91%0.00%65.50%14.64%10.39%
2016
National
18.42%11.87%21.30%17.20%11.09%0.00%106.11%20.09%17.52%
2017
National
16.64%7.28%15.27%14.11%5.95%0.00%85.40%14.28%10.18%
China
average
13.29%7.98%13.69%11.03%6.79%0.04%58.41%13.00%9.49%
Table 4. Changes in input redundancy, desired output deficiency, and non-desired output excess in ecological land use processes in eastern China.
ElementsAgricultural Land Input RedundancyPesticide Input RedundancyAgricultural Fertilizer Input RedundancyAgricultural Film Input RedundancyDiesel Input RedundancyInadequate Output of Gross Agricultural ProductInsufficient Output of Ecological Service Value Of Agricultural LandCarbon Emissions OutputExcess Output of Pollutants
Time
Area
2004
Eastern
0.00%0.99%0.70%4.02%1.38%0.00%13.30%1.79%3.75%
2005
Eastern
0.03%1.15%1.05%3.41%4.01%0.00%28.27%2.89%4.10%
2006
Eastern
0.09%1.58%0.16%1.68%1.70%0.00%9.51%1.02%2.15%
2007
Eastern
0.78%1.16%1.49%4.27%7.28%0.00%23.44%4.44%4.68%
2008
Eastern
0.69%1.99%1.91%2.14%3.38%0.03%11.09%2.50%3.10%
2009
Eastern
0.24%1.66%1.33%1.76%3.14%0.27%15.91%2.32%4.30%
2010
Eastern
1.17%1.63%0.46%5.00%4.08%0.00%52.20%2.82%3.61%
2011
Eastern
0.36%2.78%2.11%3.74%3.27%0.32%28.18%3.41%1.85%
2012
Eastern
0.25%0.59%1.12%3.61%3.21%0.29%22.61%2.37%1.27%
2013
Eastern
0.83%2.89%1.77%3.29%5.86%0.12%30.15%3.77%3.14%
2014
Eastern
0.24%1.27%1.60%6.23%5.52%0.00%41.52%4.23%2.46%
2015
Eastern
0.62%4.57%1.82%3.66%8.13%0.00%18.91%4.69%3.33%
2016
Eastern
0.66%5.10%5.97%7.73%5.98%0.00%90.49%7.10%10.24%
2017
Eastern
0.00%0.00%1.05%4.51%0.00%0.00%50.58%1.63%1.53%
Eastern
average
0.42%1.95%1.61%3.93%4.07%0.07%31.15%3.21%3.54%
Table 5. Changes in input redundancy, desired output deficiency, and undesired output excess in the ecological use process of agricultural land in central China.
ElementsAgricultural Land Input RedundancyPesticide Input RedundancyAgricultural Fertilizer Input RedundancyAgricultural Film Input RedundancyDiesel Input RedundancyInadequate Output of Gross Agricultural ProductInsufficient Output of Ecological Service Value Of Agricultural LandCarbon Emissions OutputExcess Output of Pollutants
Time
Area
2004
Central
18.28%10.77%25.64%23.11%9.17%0.00%93.24%22.70%11.40%
2005
Central
17.77%12.80%23.04%18.69%9.08%0.00%123.14%20.70%7.77%
2006
Central
18.43%15.25%27.47%9.74%9.78%0.00%102.51%22.82%12.39%
2007
Central
24.33%18.57%30.29%10.24%9.67%0.00%134.57%24.94%15.41%
2008
Central
23.54%16.66%29.60%11.12%9.82%0.00%124.60%24.46%14.30%
2009
Central
26.34%17.06%31.52%12.85%10.07%0.00%134.99%25.95%15.88%
2010
Central
25.39%18.42%32.22%13.17%9.65%0.00%147.13%26.61%15.88%
2011
Central
25.32%20.06%33.16%15.15%10.31%0.00%130.52%27.58%16.75%
2012
Central
25.42%20.46%32.65%15.90%10.44%0.00%109.31%27.32%16.94%
2013
Central
25.85%23.57%34.79%17.57%10.68%0.00%139.35%29.45%19.17%
2014
Central
23.87%24.05%33.55%16.20%9.74%0.00%126.82%28.33%18.19%
2015
Central
23.72%22.94%32.77%15.81%9.44%0.00%144.44%27.58%16.25%
2016
Central
24.20%24.44%34.20%16.83%10.64%0.00%176.33%28.94%18.66%
2017
Central
23.24%19.09%29.78%14.36%8.83%0.00%154.51%24.88%13.68%
Central
average
23.60%19.41%31%14.51%9.85%0.00%134.13%26.09%15.45%
Table 6. Changes in input redundancy, desired output deficiency, and undesired output excess in the ecological use process of agricultural land in western China.
ElementsAgricultural Land Input RedundancyPesticide Input RedundancyAgricultural Fertilizer Input RedundancyAgricultural Film Input RedundancyDiesel Input RedundancyInadequate Output of Gross Agricultural ProductInsufficient Output of Ecological Service Value Of Agricultural LandCarbon Emissions OutputExcess Output of Pollutants
Time
Area
2004
Western
12.00%2.73%7.81%11.46%8.71%0.00%2.09%8.70%7.42%
2005
Western
12.94%4.12%7.97%11.94%10.03%0.00%5.79%9.27%7.55%
2006
Western
11.84%4.15%8.36%11.39%10.10%0.00%4.08%9.20%8.02%
2007
Western
13.58%6.74%9.84%8.72%8.82%0.10%18.69%10.07%7.69%
2008
Western
14.25%4.87%8.36%11.02%1.12%0.00%22.70%8.38%5.91%
2009
Western
16.09%5.03%11.48%11.63%7.04%0.00%28.11%11.38%8.66%
2010
Western
16.60%4.91%10.13%11.63%2.26%0.00%26.98%9.80%7.03%
2011
Western
17.21%6.74%11.47%13.63%0.82%0.00%34.16%11.30%9.19%
2012
Western
18.36%7.37%11.48%13.68%2.95%0.00%23.72%11.32%8.96%
2013
Western
22.54%8.10%17.60%17.45%6.73%0.57%42.83%16.81%16.02%
2014
Western
27.58%7.64%20.74%22.62%10.80%0.00%50.40%20.51%18.39%
2015
Western
21.19%7.47%15.41%17.30%6.59%0.00%54.67%15.18%13.18%
2016
Western
31.99%9.50%27.25%26.94%16.52%0.00%70.67%26.63%23.97%
2017
Western
28.49%5.97%18.93%23.54%9.81%0.00%69.95%19.22%16.29%
Western average18.90%6.10%13.35%15.21%7.31%0.05%32.49%13.41%11.31%
Table 7. Changes in technological progress index for ecological use of agricultural land in 30 provinces in China.
2004–20052005–20062006–20072007–20082008–20092009–20102010–20112011–20122012–20132013–20142014–20152015–20162016–2017
Anhui1.081.101.151.091.601.081.030.941.080.921.051.140.86
Beijing1.001.001.180.981.001.061.091.061.011.111.161.211.18
Fujian1.001.021.111.021.011.050.951.011.050.971.001.100.93
Gansu1.011.041.051.031.041.071.061.031.131.011.011.131.15
Guangdong1.051.001.011.011.040.991.080.951.050.961.061.020.94
Guangxi1.001.001.011.011.001.011.011.011.011.011.011.200.84
Guizhou1.001.001.040.991.060.991.450.661.300.791.011.250.82
Hainan1.001.001.021.021.021.011.120.921.011.001.190.851.01
Hebei1.401.151.230.881.061.080.921.011.101.021.071.110.64
Henan1.171.001.170.881.131.011.050.871.210.950.991.110.83
Heilongjiang1.001.031.101.101.061.921.031.021.050.971.021.140.93
Hubei1.031.061.071.051.051.121.380.951.030.980.951.030.91
Hunan1.001.001.031.031.071.020.981.021.061.000.951.040.95
Jilin1.011.061.201.561.161.001.001.021.081.011.041.160.93
Jiangsu1.151.001.021.021.130.921.140.901.130.901.080.941.01
Jiangxi1.001.070.981.001.011.011.051.011.090.951.030.971.02
Liaoning1.221.001.440.721.012.190.701.030.921.440.513.070.89
In. Mongolia1.001.001.021.011.171.100.841.371.311.001.211.150.97
Ningxia1.001.000.990.891.160.991.011.011.120.921.021.210.83
Qinghai1.001.001.061.021.031.021.031.031.030.990.991.020.98
Shandong1.191.201.060.990.931.081.010.971.050.951.031.060.84
Shanxi1.010.971.061.041.071.091.041.031.051.021.011.081.03
Shaanxi1.101.001.140.911.300.840.951.011.160.960.981.060.89
Shanghai1.001.001.041.171.001.081.031.061.121.011.101.041.08
Sichuan1.001.001.100.971.090.971.031.020.991.020.991.080.94
Tianjin1.001.001.031.011.080.931.011.011.011.170.921.520.77
Xinjiang1.001.040.991.140.940.991.110.920.972.520.392.690.92
Yunnan1.000.991.041.041.071.111.061.041.071.041.041.181.51
Zhejiang1.091.121.010.961.141.020.861.011.230.951.110.990.81
Chongqing1.001.011.130.911.130.911.021.011.071.080.981.020.92
Table 8. Changes in eco-efficiency index of agricultural land in 30 provinces in China.
2004–20052005–20062006–20072007–20082008–20092009–20102010–20112011–20122012–20132013–20142014–20152015–20162016–2017
Anhui1.081.101.151.091.601.081.030.941.080.921.051.140.86
Beijing1.001.001.180.981.001.061.091.061.011.111.161.211.18
Fujian1.001.021.111.021.011.050.951.011.050.971.001.100.93
Gansu1.011.041.051.031.041.071.061.031.131.011.011.131.15
Guangdong1.051.001.011.011.040.991.080.951.050.961.061.020.94
Guangxi1.001.001.011.011.001.011.011.011.011.011.011.200.84
Guizhou1.001.001.040.991.060.991.450.661.300.791.011.250.82
Hainan1.001.001.021.021.021.011.120.921.011.001.190.851.01
Hebei1.401.151.230.881.061.080.921.011.101.021.071.110.64
Henan1.171.001.170.881.131.011.050.871.210.950.991.110.83
Heilongjiang1.001.031.101.101.061.921.031.021.050.971.021.140.93
Hubei1.031.061.071.051.051.121.380.951.030.980.951.030.91
Hunan1.001.001.031.031.071.020.981.021.061.000.951.040.95
Jilin1.011.061.201.561.161.001.001.021.081.011.041.160.93
Jiangsu1.151.001.021.021.130.921.140.901.130.901.080.941.01
Jiangxi1.001.070.981.001.011.011.051.011.090.951.030.971.02
Liaoning1.221.001.440.721.012.190.701.030.921.440.513.070.89
In. Mongolia1.001.001.021.011.171.100.841.371.311.001.211.150.97
Ningxia1.001.000.990.891.160.991.011.011.120.921.021.210.83
Qinghai1.001.001.061.021.031.021.031.031.030.990.991.020.98
Shandong1.191.201.060.990.931.081.010.971.050.951.031.060.84
Shanxi1.010.971.061.041.071.091.041.031.051.021.011.081.03
Shaanxi1.101.001.140.911.300.840.951.011.160.960.981.060.89
Shanghai1.001.001.041.171.001.081.031.061.121.011.101.041.08
Sichuan1.001.001.100.971.090.971.031.020.991.020.991.080.94
Tianjin1.001.001.031.011.080.931.011.011.011.170.921.520.77
Xinjiang1.001.040.991.140.940.991.110.920.972.520.392.690.92
Yunnan1.000.991.041.041.071.111.061.041.071.041.041.181.51
Zhejiang1.091.121.010.961.141.020.861.011.230.951.110.990.81
Chongqing1.001.011.130.911.130.911.021.011.071.080.981.020.92
Publisher’s Note: MDPI stays neutral with regard to jurisdictional claims in published maps and institutional affiliations.

