Article

Evaluation of Agricultural Water Resources Carrying Capacity and Its Influencing Factors: A Case Study of Townships in the Arid Region of Northwest China

1
Northwest Institute of Eco-Environment and Resources, Chinese Academy of Sciences, Lanzhou 730000, China
2
University of Chinese Academy of Sciences, Beijing 100049, China
3
School of Economics, Lanzhou University, Lanzhou 730000, China
4
School of Economics, Minzu University of China, Beijing 100081, China
*
Author to whom correspondence should be addressed.
Agriculture 2022, 12(5), 700; https://doi.org/10.3390/agriculture12050700
Submission received: 13 April 2022 / Revised: 13 May 2022 / Accepted: 13 May 2022 / Published: 16 May 2022
(This article belongs to the Special Issue Precision Water Management in Dryland Agriculture)

Abstract

:
The water resources carrying capacity (WRCC) strongly determines the agricultural development in arid areas. Evaluation of WRCC is important in balancing the availability of water resources with society’s economic and environmental demands. Given the demand for sustainable utilization of agricultural water resources, we combine the water stress index and comprehensive index of WRCC and use multi-source data to evaluate agricultural WRCC and its influencing factors at the township scale. It makes up for the deficiencies of current research, such as the existence of single-index evaluation systems, limited calibration data, and a lack of a sub-watershed (i.e., township) scale. By applying multi-source data, this study expands the spatial scale of WRCC assessment and establishes a multidimensional evaluation framework for the water resources in dryland agriculture. The results indicate water stress index ranges from 0.52 to 1.67, and the comprehensive index of WRCC ranges from 0.25 to 0.70, which are significantly different in different types of irrigation areas and townships. Water quantity and water management are key factors influencing WRCC, the water ecosystem is an area requiring improvement, and the water environment is not a current constraint. Different irrigation areas and different types of townships should implement targeted measures to improve WRCC.

1. Introduction

The term water resources carrying capacity (WRCC) refers to the maximum population and the socioeconomic development scale that can be maintained by regional water resources at a certain level of social and economic development [1]. It is also a measure of water resources at a given spatial and temporal scale [2]. The purpose of research into WRCC is to identify a social and economic development model that matches the available water resources. It is crucial to plan the future social and economic development scale and mode according to the supply and demand of regional water resources [3]. The evaluation of WRCC has been widely used to study the water supply and demand balance and ecosystem protection required by the economic development of industry, agriculture, and cities in a certain region, especially in water-scarce regions [4,5,6]. This is of great significance for strengthening the scientific management of regional water resources, maintaining regional ecological security, and ensuring sustainable development.
In a broader sense, the evaluation of natural resource carrying capacity includes the measurement of the current resources and environment’s bearing status on economic and social development, as well as the quantification of the scale of the carrying object, but there are few studies on the combination of the two. Common evaluation methods include ecological footprint, the state-space method, index evaluation method, system dynamics, energy analysis method, and multi-objective decision making [7,8,9]. The evaluation focus and applicable objects vary among each of these methods. In terms of research scale, most studies have been conducted at larger scales, such as in provinces, prefecture-level cities, counties, regions, and river basins [10,11,12,13]. Some researchers have tried to establish unique frameworks for small-scale study areas like an irrigation district, such as a hydro-economic or water accounting oriented system [14,15,16]. However, because of the difficulty in obtaining data at the small study scale, there remains a lack of research at the township scale.
For the study of WRCC, international scholars have mainly focused on water security [17,18,19], whereas Chinese scholars have focused on the concept and connotation of WRCC [20,21,22]. Scholars generally believe that WRCC covers the water resources system, the economic and social system, and the ecological system [18,19,20,21,22,23]. The WRCC is defined by four dimensions: water quantity, water quality, water area, and water flow [24,25,26]. The evaluation methods of WRCC include the empirical formula method, the comprehensive evaluation method, the system analysis method, and quota water consumption [21,22,23,24,25]. The calculation of WRCC mainly involves quantitatively measuring the levels of economic and population development that regional water resources can support [27,28].
Many studies have also considered the factors influencing WRCC. WRCC is a complex system composed of the water resources environment and social and economic systems. There are many factors that affect the carrying capacity of water resources. Water resources factors include the quantity and quality of water sources, the development and utilization of water resources, and the self-purification capacity of water bodies [8,29]. Economic factors include the level of economic development, productivity, and economic structure [18,30]. Social factors include population size and growth rate, labor force quality, urbanization rate, and the level and mode of social consumption [31,32]. The environmental factors include the quantity and quality of environmental elements [10,33]. There is a complex network of relationships among the variables, and they interact to form the region-specific WRCC. The load status of WRCC changes with the transformation of the above factors. Therefore, it is necessary to select scientific index systems and methods to identify the main factors affecting the WRCC so as to improve the water resources carrying capacity level.
According to the existing literature, there remain certain limitations in the study of WRCC, which can be summarized as follows. First, many studies have evaluated single element carrying capacity of water resources systems, such as water resources carrying capacity, water environment carrying capacity, and water ecological carrying capacity [34,35,36]. However, there is still a lack of research on the comprehensive carrying capacity of the integration of water resources, water ecology, and the water environment. Second, there are few studies combining the evaluation of water resources carrying state with the quantitative calculation of carrying capacity. Finally, a township is a composite ecosystem integrating natural resources, the ecological environment, and economic and social elements. It frequently exchanges materials and energy with the outside world, causing difficulties in evaluating it through scale changes [37]. Moreover, it is difficult to obtain data on water use and economic and social development at the township scale; correspondingly, there are relatively few studies considering WRCC at the township scale.
In the context of global warming and the rapid progress of urbanization and industrialization, the problems of water shortage, pollution of the water environment, water ecological imbalance, and the threat of drought and flood disasters in arid and semi-arid regions are becoming increasingly prominent. The regional water resources development and utilization intensity approaches or even exceeds the carrying capacity limit [38,39,40,41]. The WRCC has become a major shortcoming restricting the sustainable development of agriculture in arid and semi-arid regions. The evaluation of agricultural WRCC in arid and semi-arid regions is crucial for increasing food production, improving water resources utilization efficiency, and promoting economic development.
As a typical irrigation area in the arid region of Northwest China, the Heihe River Basin accounts for 90% of the total water consumption. The carrying capacity of water resources is a restrictive factor for the sustainable development of agriculture in the region. In this study, we considered villages and towns in the middle reaches of the Heihe River in the arid region of Northwest China and systematically analyzed the current research progress of WRCC evaluation indicators. An open and scalable water resource comprehensive carrying capacity evaluation framework was established based on the realistic demand for sustainable utilization of agricultural water resources in arid areas. Then we carried out a comprehensive evaluation of WRCC at the town scale together with an analysis of key influencing factors by using multi-source data.
The contributions of this paper are as follows: (1) From the perspective of multiple factors, based on control indicators and comprehensive indexes, we established a set of evaluation indicators and application framework for the comprehensive carrying capacity of agricultural water resources at the township scale in inland river basins in arid regions. This expands the spatial scale of the WRCC assessment. (2) Through the combination of multi-source data such as simulation data, remote sensing data, monitoring data, statistical data, and questionnaire survey data, the feasibility of applying multi-source data to carry out the evaluation of agricultural WRCC at the township scale was examined. (3) The key factors affecting the WRCC of townships were explored for different water use types and different development types in the study area. This will provide useful support for the subsequent formulation of regulatory policies and measures for the carrying capacity of agricultural water resources in the same type of river basin.
The remainder of the paper is structured as follows. The materials and methods section introduces the research method and the construction of the evaluation index system. The results section analyzes the evaluation results of the comprehensive carrying capacity of agricultural water resources in townships and villages from different perspectives and further explores the influencing factors of WRCC. The discussion section provides in-depth analysis of the observed results. The conclusion section, combined with the evaluation results, puts forward suggestions for improving agricultural WRCC in townships and further discusses the limitations of this paper and future research directions.

2. Materials and Methods

2.1. Study Area

The Heihe River Basin is the second-largest inland river basin in China. The Ganzhou District of Zhangye City is located in the middle reaches of the Heihe River. It has a typical temperate continental climate with low annual precipitation and high evaporation. The Zhangye Oasis Basin is the most concentrated irrigated agricultural area in the entire basin. The Heihe River Basin is a resource-based water shortage area. The average per capita water resources occupation in Zhangye City for many years is 1190 m3 per person, which is far lower than the national and world per capita water resources [42]. The stable supply of water resources in the region guarantees the carrying capacity of water resources. The annual average natural runoff in Ganzhou District is 1.651 billion m3, and the water mainly comes from the main stream of the Heihe River. The available water volume in Ganzhou, Linze, and Gaotai counties in the middle reaches of the Heihe River has averaged only 630 million m3 for many years, while the average annual water consumption in Ganzhou District alone reached 750 million m3 from 2015 to 2019. Water demand exceeds water supply too much, so the supply and demand situation of water resources is severely imbalanced [43]. Ganzhou District governs 18 townships, which are distributed in eight irrigation districts of three types: Heihe Irrigation Area, Spring Irrigation Area, and Mountain Irrigation Area. Considering the differences in the mode of water use and economic development in agricultural production in townships, we examined a township in each irrigation area. Correspondingly, eight towns (Huazhai Township, Anyang Township, Daman Town, Ganjun Town, Liangjiadun Town, Longqu Township, Shajing Town, and Wujiang Town) were selected (Figure 1).
Ganzhou District is the main producing area of national agricultural products, and the whole area belongs to the provincial key development zone. The mountain area belongs to the Qilian Mountains National Nature Reserve. Moreover, it is also an important area for windbreak and sand fixation in the middle reaches of the Heihe River and water source conservation in the Qilian Mountains. The towns were categorized according to the different irrigation areas (Mountain Irrigation Area, Heihe Irrigation Area, and Spring Irrigation Area) and the main function in the region (agricultural product supply, industrial agglomeration, and ecological). The descriptions of each township are shown in Table 1.

2.2. Evaluation Index System for Water Resources Carrying Capacity in Townships

From the perspective of the realistic demand for sustainable utilization of water resources in agriculture in arid areas, this study combined control indicators and comprehensive indexes. The relationship between water supply and demand was the main focus, and the towns and villages in the Heihe irrigation areas were the research objects. This research focused on the support status and scale of the township water resources system (carrier) to the economy and society (carrying object). The comprehensive WRCC was analyzed and characterized from the four dimensions of water quantity, water environment, water ecology, and water management (Figure 2). The evaluation of water resources carrying status was combined with the quantitative calculation of carrying capacity, and multi-source data were applied to carry out a comprehensive evaluation of the WRCC at the township scale and to analyze the key influencing factors of the WRCC.
To address the problem of a single data source of the WRCC evaluation index in previous studies, we integrated data from various sources, absorbed the characteristics of different data sources, and then extracted a higher amount of information compared with the single data source. This increased the accuracy and completeness of the evaluation index system of the WRCC. Based on the analysis of the basic connotation, main dimensions, and water resources system of the agricultural WRCC of the towns in the middle reaches of the Heihe River, we included data from multiple sources, including simulations, remote sensing, monitoring, statistical, and questionnaire surveys. The carrying capacity of township water resources was taken as the target layer, and four system layers were constructed (water quantity, water environment, water ecology, and water management) together with a carrying capacity evaluation index system including 20 evaluation indicators (Table A1).
The water quantity is the total amount of water resources that sustain human survival, living and production. This paper selects the following indicators to measure the water resources that people use for agricultural production and economic activities: water resources available per capita, collectively owned storage ponds and dams, water production quantity, ratio of the total amount of water consumption, ratio of industrial to agricultural income, rate of change in cultivated land area, groundwater exploitation potential, and water stress index. The water environment is the space where water is formed, distributed, and transformed in nature. It is a water body directly or indirectly affecting human life and development. The following indicators reflect various natural and social factors related to water environments: pesticide usage of arable land, fertilizer applied of arable land, centralized sewage disposal capacity, domestic waste innocuous disposal capacity, and water quality compliance rate of centralized drinking water sources. Water ecology refers to the interaction and mutual restriction between biological communities and water environments. Through material circulation and energy flow, they together constitute a dynamic balance system with a certain structure and function. In this paper, the water-wading ecosystem area ratio and the ratio of forest and grass area are selected to measure water ecology. Water management refers to the management of the planning, development, distribution, and efficient use of water sources under hydrological policies and laws. We select indicators to measure water management status from the following aspects: water rights trading, intactness of channel works, the proportion of high-standard farmland area, water-saving awareness of farmers, and farmers’ water resources satisfaction. The index system and calculation methods of each index are shown in Table 2.

2.3. Research Methods

Firstly, this study evaluates the WRCC status of representative townships by calculating the water stress index, which assesses water resources bearing status. Secondly, we construct an index system to measure agricultural WRCC, standardize indicators and calculate the weight of each index, and obtain the comprehensive index of WRCC of each township. Finally, combined with the questionnaire survey data, this paper uses importance-performance analysis (IPA) to analyze the influencing factors of agricultural WRCC. The flow chart of the methodology is shown in Figure 3.

2.3.1. The Control Index and the Comprehensive Index

A control index and a comprehensive index were applied to reflect the state of agricultural WRCC in townships. The control index refers to the indicators related to the control and management of the WRCC [44]. The comprehensive index refers to the analysis of comprehensive indicators and statistical data. Moreover, it is able to comprehensively and objectively reflect the basic situation of the WRCC in a region [45].
The water stress index, which reflects the relationship between water supply [46] (available water resources) and water consumption [47,48], was used as the control index. The water supply reflects the support of the water resources system, and the water consumption reflects pressures on the water resources system [49,50]. If this index exceeds a certain threshold (Table 3), the current state of the WRCC is determined to be overloaded [51]. The overload state indicates that the WRCC in this region is insufficient, which could lead to problems in the continued utilization of water resources [52,53].
For all conditions in which the control index is not overloaded, the comprehensive index is calculated to reflect the comprehensive state of the agricultural WRCC of each township. With consideration of the regional water resources system and economic and social development, the comprehensive index can be divided into four bearing states: extremely fragile, fragile, generally acceptable, and acceptable (Table 4).
The comprehensive index of the WRCC was obtained by using the standardized numerical weighting of each index, determined as follows:
WRCC = i = 1 20 ( X * × W )
WRCC is the comprehensive index of the water resources carrying capacity, X * is the standardized value of each index, and W is the combined weight of each index corresponding to the target layer, as calculated by the analytic hierarchy process (AHP) defined below.

2.3.2. Standardization of Indicators

The extreme value standardization method was used to standardize each index to complete the linear transformation of the original data [54]. According to the role of each index in the overall objective of evaluating the WRCC of townships, each index was divided into positive and negative indicators. The standardization method was as follows:
For positive indicators:
X * = X i m i n X i m a x X i m i n X i
For negative indicators:
X * = m a x X i X i m a x X i m i n X i
where X i is the original index data of the evaluation year; X * is the standardized data of each index; and m a x X i and m i n X i are the maximum and minimum values of the indexes, respectively. The extreme value mainly refers to the index values of the 18 townships in Ganzhou District, and it also considers the relevant policy goals.

2.3.3. Analytic Hierarchy Process (AHP)

AHP is a simple, flexible, and practical multi-criteria decision-making method for quantitative analysis of qualitative problems. Its characteristic is to organize various factors in complex problems by dividing them into orderly levels of interrelatedness [55]. According to the subjective judgment structure of a certain objective reality (mainly a pairwise comparison), AHP directly and effectively combines the expert opinion [56], and the objective judgment result of the analyst and quantitatively describes the importance of the pairwise comparison at the same level. Then, mathematical methods are used to calculate the weights reflecting the relative importance order of the elements of each level, and the relative weights of all elements are calculated and sorted through the total ordering among all levels [57]. AHP has the following advantages [58]: (1) AHP establishes the hierarchy of all elements (including non-quantification and quantification) and clearly presents the relationship between each layer, each criterion, and each element. (2) The evaluation procedure is simplified, and the calculation process is simple and easy to understand. (3) If there are omissions or deficiencies in the research data, the importance of each element can still be obtained. (4) The AHP method can better integrate stakeholders such as local governments, local residents, and researchers to participate in decision making. Based on the above reasons, this paper selects AHP to obtain the weights of different target importances.
The AHP is a decision-making method that decomposes decision-related elements into levels, such as goals, criteria, and plans, and then is used to conduct qualitative and quantitative analysis [55]. The use of AHP to calculate the weight of indicators involves judging the importance of each indicator and quantifying qualitative judgments. The relative importance of low-level factors to high-level factors is judged and measured through experience and expert scoring (Table A2), and the weights are ranked according to the degree of importance (Table A3), which can then be quantitatively analyzed and compared. Based on the importance of each indicator, the importance comparison of different indicators is carried out around the system-level objectives of the indicator system [59]. Then, based on the evaluation index system, a hierarchical structure model of WRCC evaluation is built (Figure A1). Finally, the judgment matrix (Table A4, Table A5, Table A6, Table A7 and Table A8) is constructed, its consistency is checked, and the index weight results can be obtained after passing the test.
The basic intention of the AHP is to hierarchize the problem to be analyzed. The problem is then decomposed into different components according to the nature of the problem and the overall goal to be achieved. According to the related influence of these factors and their subordinate relationship, the factors are aggregated and combined at different levels to form a multi-level analysis structure model. The problems are compared with reference to their advantages and disadvantages and finally ranked. In this paper, the analytic hierarchy process software yaahp is used to calculate the index weight and check the consistency.

2.3.4. Importance-Performance Analysis (IPA)

IPA was originally proposed by Martilla and James in the field of marketing in 1977, including importance (I) and performance (P) [60]. The core idea is that users attach importance to various attributes of the products and evaluate the performance of the products. At present, the IPA model has been widely used to analyze the importance and performance differences of evaluation indicators. Importance (I) refers to the value of the impact factors to the research object, and performance (P) refers to the actual performance of the impact factors. The IPA analysis method compares the importance and performance of the measurement indicators and reflects the relative importance and performance of each indicator. It takes the performance value of the measurement index as the X-axis and the importance value of the measurement index as the Y-axis to construct a two-dimensional coordinate system. Although the IPA evaluation index is very simple, it has high practicability and is suitable for providing more visualized data for decision makers. In general, the IPA method has four characteristics of low cost, easy operation, accurate analysis, and intuitive conclusion, which is beneficial to translate the evaluation results directly into actions. The method is based on an objective and professional analysis system and incorporates an open process of public participation, as well as direct feedback guidance for optimal decision making. Based on these, this paper selects IPA to analyze the key influencing factors of the agricultural WRCC of the townships in Ganzhou District.
Firstly, a questionnaire survey is adopted to allow farmers to evaluate the influencing factors of WRCC by using a five-point Likert scale. Secondly, calculate the average of the scores of all the influencing factors, and obtain the overall average importance and average performance. Finally, take the actual performance level of each factor as the horizontal axis, its importance level as the vertical axis, and the median or overall mean of the two factors as the origin of the coordinate, where the coordinate system is divided into four quadrants (Figure 4). In addition, fill in the influencing factors into the corresponding quadrants according to the evaluation value [61].
The evaluation performance and importance of each factor in Quadrant I are higher than the average, and these factors are the key factors that should be maintained to ensure a good WRCC. The factors in Quadrant II are low-performance but high-importance factors, representing factors that need to be improved. Factors in Quadrant III are low-performance and low-importance factors, which are secondary consideration factors. Factors in Quadrant IV are high-performance and low-importance factors, representing factors on which efforts should be reduced.

3. Results

3.1. Evaluation of Water Resources Carrying Capacity

3.1.1. Evaluation Index Weight

The weight results for the system layer and the index layer based on AHP are shown in Table 5 and Table A9. At the system level, the current water quantity (B1) and water management system (B4) were identified as the most important for the carrying capacity of agricultural water resources in townships in Ganzhou District, with a weight of 0.29. This was followed by the water environment system (B2) with a weight of 0.24 and the water ecosystem (B3) with a relatively small weight of 0.18. The water ecosystem area ratio (C14) and the forest and grass area ratio (C15) have the largest weights, indicating that these two indicators are important influences on the agricultural WRCC of townships in Ganzhou District. On the whole, the importance of the indicators was similar in each system layer, and the weights were relatively balanced except for B3. This indicates that each index is almost equally important to the evaluation of the agricultural WRCC of townships under the current level of water resources utilization and economic and social development.

3.1.2. Evaluation of Controlling Index

The water stress index reveals the relationship between the annual agricultural water demand of each township and the total water consumption control target (initial water right amount). Among the eight representative townships, the water stress index values exceed 1 for Wujiang Town, Anyang Township, and Shajing Town, which are 1.67, 1.28, and 1.25, respectively. Under the total water consumption control target, the pressure of the water resources system represented by water consumption exceeds the support capacity represented by the water supply in these three towns. This means that the water systems of these townships are under enormous pressure. The water resources systems of Liangjiadun Town, Longqu Township, Huazhai Township, Daman Town, and Ganjun Town still have some supporting capacity, with water stress indices of 0.88, 0.72, 0.68, 0.53, and 0.52, respectively (Figure 5 and Table 6). Among these, the water stress index of Wujiang Town is the largest, at 1.67. Field investigation found that Wujiang Town, as a major crop production area, faces huge water demand. However, the water conservancy engineering facilities are few and old, and the lack of water-saving facilities leads to backward irrigation methods, so the water stress index is the largest. Owing to the introduction of dryland crops and the popularization of water-saving concepts, the supply and demand of water resources in Ganjun Town are relatively balanced, and the water stress index is the smallest at 0.52.

3.1.3. Comprehensive Index Evaluation of Water Resources Carrying Capacity

A comprehensive index of WRCC was constructed based on four dimensions: water quantity, water environment, water ecology, and water management. We then selected the key indicators closely related to the water resources system of the towns in Ganzhou District to comprehensively evaluate the current status of the agricultural WRCC of the towns. Moreover, the main control points of WRCC were determined for each township by analyzing the key restrictive factors. Table 6 shows the evaluation results of agricultural WRCC of representative townships in Ganzhou District. The WRCC of three townships (Wujiang Town, Anyang Township, and Shajing Town) was in a state of overload. The WRCC of the remaining five townships (Huazhai Township, Daman Town, Ganjun Town, Liangjiadun Town, and Longqu Township) was not overloaded. The available water volume of these five townships was maintained in surplus under the strictest water resource management policies, which can support the sustainable development of the population and economy in the future.

3.2. Factors Influencing Water Resources Carrying Capacity

In this paper, the index performance level (normalized index value) and the importance level (index weight) of agricultural WRCC were used as the coordinate axes, and the average value of the two was used as the coordinate origin to construct an IPA analysis chart. The importance and performance analysis of factors affecting WRCC are shown in Figure 6.

4. Discussion

4.1. Analysis of Comprehensive Agricultural Water Resources Carrying Capacity

Under the strictest water resource management policies and total water use control targets, the evaluation results of the control index (water stress index) show that the water stress index in Mountain Irrigation Area and Spring Irrigation Area was large (>1), and the water resources system was under great pressure. The township water stress index in Heihe Irrigation Area was small (<1), and the water resources system retained some supporting capacity. The water stress index of agricultural product supply towns was relatively large (>1), that of the industrial agglomeration townships was close to the critical overload state (close to 1), and the water stress index of ecological townships was relatively small (<1). Different irrigation areas and different types of townships should implement targeted measures to improve the carrying capacity of agricultural water resources in key areas.
The comprehensive index of WRCC identified Anyang Township, Wujiang Town, and Shajing Town as being in an overloaded state due to an overloaded water stress index. Moreover, the comprehensive index of Shajing Town was relatively small (0.25), indicating that Shajing Town retains some shortcomings in related key areas, which are the key focus of improving the carrying capacity of agricultural water resources in the region. Huazhai Township, which belongs to the mountain irrigation area, comprises a large area of arable land. However, as a result of the low availability of agricultural water resources and more sloping land, the irrigation area is not large, and some cultivated land along the mountainous area remains unirrigated. The township mainly grows cereal crops with low water consumption, so the water demand for agricultural production is relatively small. Therefore, the comprehensive index has a maximum of 0.70, which is within the “generally acceptable” state. Daman Town, Ganjun Town, Liangjiadun Town, and Longqu Township in Heihe Irrigation District were mainly in the cultivation of grain and vegetables, thus in a “fragile” state. This shows that the agricultural water resources system is weak in supporting future economic and social development, and the key indicators of the water resources system perform poorly. Of these, Longqu Township had the smallest comprehensive index at 0.39, and it is thus necessary to implement targeted measures to improve the carrying capacity of agricultural water resources.

4.2. Analysis of Influencing Factors of Comprehensive Water Resources Carrying Capacity

Overall, the indicators of the agricultural water resources system were mainly distributed in Quadrants III and IV, indicating that the importance of the water resources system is less than the average. These are secondary consideration factors and should receive less effort and focus in the future. The study results reflect that the focus of agricultural WRCC in Ganzhou District has shifted from traditional water quantity to water management and water ecology. This is related to the relatively stable availability of agricultural water resources in the middle reaches of the Heihe River.
Agricultural water ecosystem indicators are distributed in Quadrant II, indicating factors that need to be improved. This suggests that local farmers are currently paying more attention to improving the regional water ecological conditions and that the local water ecological environment is relatively fragile. The water environment indicators are secondary considerations and factors to avoid excessive consideration, which indicates that the current water environment problem is not the focus of agricultural WRCC. As for water management indicators, the importance level is higher than the average, but the performance level of related factors is not high at present, which is the key area of agricultural WRCC improvement.
The four index factors of water-related ecosystem area ratio (C14), forest and grass area ratio (C15), high-standard farmland area ratio (C18), and water-saving awareness (C19) were positioned in Quadrant II. The importance level of these factors was higher than average, but the actual evaluation performance level was lower than average, indicating that these are factors that need to be improved. The area of water-related ecosystems and forests and grasslands in townships is small and has a weak effect on regional water conservation, soil and water conservation, and water purification. Therefore, improvements to these areas are not conducive to improving the carrying capacity of agricultural water resources. It is necessary to promote the construction of high-standard farmland further and, at the same time, improve the water-saving awareness of farmers in the region.
In addition, the ratio of industrial to agricultural income (C5), water rights transaction volume (C16), per capita sewage centralized disposal capacity (C11), per capita domestic waste harmless disposal capacity (C12), and other indicators were positioned in Quadrant III. These influencing factors are secondary considerations, their evaluation performance levels are considerably lower, and their importance is close to average. Improving such factors may further enhance the carrying capacity of rural agricultural water resources.

5. Conclusions

This paper took the townships in the middle reaches of the Heihe River, a typical irrigation area in the arid region of Northwest China, as the research object. In this study, simulation data, remote sensing data, monitoring data, statistical data, and questionnaire survey data were combined to carry out a comprehensive analysis of agricultural WRCC and its influencing factors based on the control and comprehensive indexes of the representative townships of Ganzhou District. It was found that the water stress index and the comprehensive index of WRCC were significantly different among different types of irrigation areas and different types of townships. Furthermore, targeted measures to improve the WRCC of agriculture should be implemented in key areas. The IPA of agricultural WRCC indicators showed that water resources and water management are key aspects of the WRCC of townships, the water ecosystem is an area requiring improvement, and the water environment is not currently a constraint. The use of pesticides and fertilizers, domestic waste, and sewage discharge are potential factors affecting the agricultural WRCC of townships. Policy makers need to implement proper regulation to maintain strengths, focus on key improvement factors, and save energy on factors that need secondary considerations. This study constructed a set of evaluation indicators and application framework for the comprehensive agricultural WRCC at the township scale in arid regions, which complements the research content and expands the spatial scale of WRCC assessment. Moreover, the research results of this paper will provide a theoretical basis and decision support for improving the agricultural WRCC in arid regions.
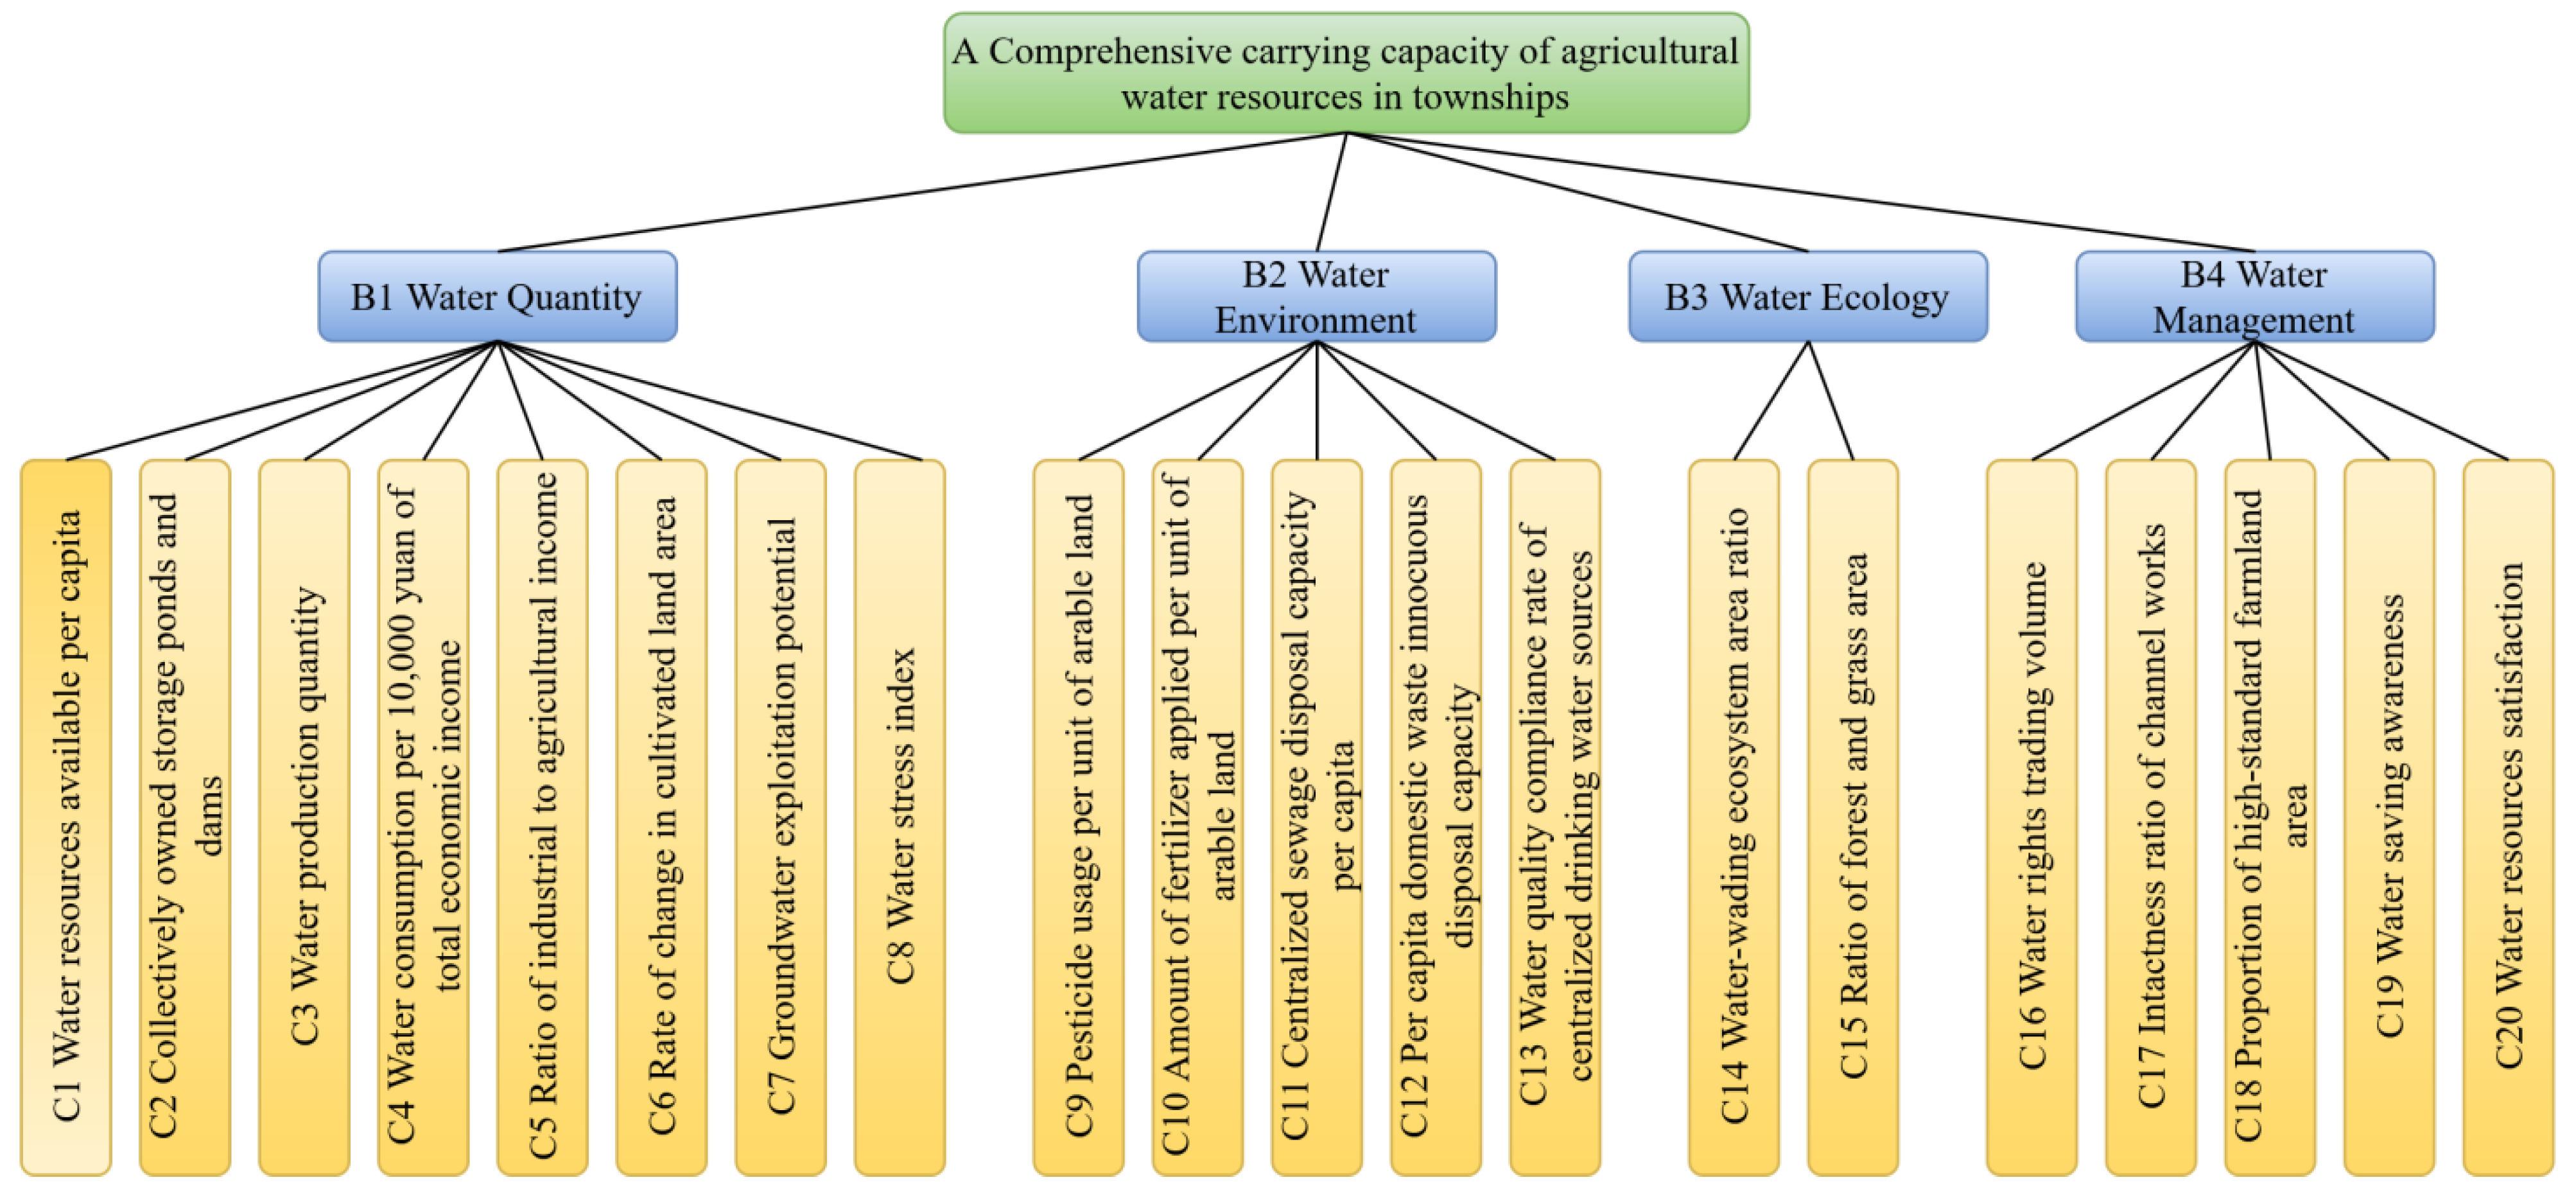
The evaluation framework of the comprehensive carrying capacity of agricultural water resources was analyzed from the perspectives of water quantity, water environment, water ecology, and water management. The results can be applied in general guidance and developing practical approaches for improving the carrying capacity of agricultural water resources. Different regions have different constraints on the WRCC. For example, water quantity and water quality are the key attributes affecting water resources; water quality restricts the water environment capacity and affects the WRCC. However, the main problem in inland river basins is insufficient water quantity, and water quality is not a limiting factor. Therefore, this index system does not include relevant indicators that directly reflect water quality, such as chemical oxygen demand concentration and ammonia nitrogen concentration [62,63]. For areas with serious water quality problems, the evaluation of WRCC needs to be supplemented with the corresponding indicators, such as total oxygen demand index, total organic carbon index, biochemical oxygen demand index, total bacteria index, etc. [64,65]. The approach described in this paper is an open and extensible WRCC evaluation framework, and localized specific indicators can be added to different regions to reveal regional key issues better.
The relationship between water supply and demand is critical in the evaluation of WRCC. The balance of water supply and demand depends on certain temporal and spatial scales and is largely affected by climatic factors and human activities [66,67]. Climate change is expected to affect the water supply and the water demand (especially agricultural demand) under economic and social development in a region [68,69]. The limitation of this paper is that climate change factors are not included in the research framework of agricultural WRCC. Global climate change has exacerbated the severity of the mismatch between water supply and demand, increasing the uncertainty and risk of future water resources utilization. Therefore, future research on WRCC should include the comprehensive influences of climate change, human activities, and economic and social development. The study on the carrying capacity of water resources still needs in-depth research from the following aspects: (1) Although there are many types of research methods on WRCC, the main methods have been established for many years, and new methods and new technologies are currently lacking. (2) The current main research methods are still insufficient in the aspects of the index system, scientific evaluation standard, and comprehensive evaluation dimension. These aspects need to be further improved in future research. (3) The dynamic research of WRCC needs to be further strengthened. At the same time, researchers should pay attention to the combination of theory and practice, try to establish a monitoring and early warning system, and select some areas for demonstration so as to meet the needs of water resources management in the new era.

Author Contributions

Conceptualization, P.W., Y.W. and F.Z.; data curation, Y.W., P.W. and X.S.; formal analysis, P.W., F.Z., Y.W. and B.W.; investigation, P.W., Y.W. and X.S.; methodology, P.W., Y.W. and Q.W.; resources, F.Z., Y.W., B.W. and P.W.; software, Y.W. and Q.W.; supervision, F.Z. and X.S.; validation, P.W., F.Z., Y.W. and B.W.; visualization, F.Z., Y.W. and X.S.; writing—original draft, P.W., Y.W. and F.Z.; writing—review and editing, P.W., Y.W., F.Z., X.S., B.W. and Q.W. All authors have read and agreed to the published version of the manuscript.

Funding

This research was supported by the Strategic Priority Research Program of the Chinese Academy of Sciences (grant No. XDA19040502), the National Key R&D Program (grant No. 2018YFD1100102), and Gansu Province Science and Technology Program (grant No. 20CX4ZA036).

Institutional Review Board Statement

Not applicable.

Informed Consent Statement

Not applicable.

Data Availability Statement

Relevant data can be obtained by contacting the corresponding author with reasonable reasons.

Conflicts of Interest

The authors declare no conflict of interest.

Appendix A

Appendix A.1. Index System Construction

Based on the construction ideas, construction goals and principles of the evaluation index system, this paper focuses on four dimensions of Water Quantity, Water Environment, Water Ecology and Water Management. Referring to the various water resource evaluation indicators involved in related researches, we selected 25 alternative evaluation indicators through multiple discussions with the research team. After comprehensively considering the importance of each index and the availability of data, 20 indicators were finally selected to construct the evaluation index system of township WRCC, as shown in Table A1.
Table A1. Selection of evaluation indexes of WRCC for towns in Ganzhou district.
IndicatorsAttribute of the IndicatorIndicator Selection
Water Quantity Indicators
Water resources available per capitaPositive
Collectively owned storage ponds and damsPositive
Water production quantityPositive
Water consumption per 10,000 yuan of total economic incomeNegative
Proportion of water use in the tertiary industryPositive
Ratio of industrial to agricultural incomePositive
Rate of change in cultivated land areaNegative
Groundwater exploitation potentialPositive
Water stress indexNegative
Water quota compliance rate of key water industriesPositive
Water Environment Indicators
Pesticide usage per unit of arable landNegative
Amount of fertilizer applied per unit of arable landNegative
Livestock and poultry breeding volume per unit areaNegative
Centralized sewage disposal capacity per capitaPositive
Per capita domestic waste innocuous disposal capacityPositive
Water quality compliance rate of centralized drinking water sourcesPositive
Water Ecology Indicators
Water-wading ecosystem area ratioPositive
Ecological base flow guarantee ratePositive
Ratio of forest and grass areaPositive
Water Management Indicators
Water rights trading volumePositive
Intactness ratio of channel worksPositive
Proportion of high-standard farmland areaPositive
Water user association performancePositive
Water saving awarenessPositive
Water resources satisfactionPositive

Appendix A.2. Experts Scoring Method

The expert scoring method refers to the method of consulting the opinions of experts in relevant fields of the research content, conducting statistical analysis on the expert opinions, and comprehensively evaluating the opinions of multiple experts. This method is intuitive and simple to calculate, and can distinguish the importance of each index. Expert scoring-AHP has the characteristics of simplicity, flexibility and practicality. It combines qualitative and quantitative analysis together, and is more suitable for the evaluation process with many evaluation factors lacking of quantitative relationship. The specific scoring method and basic steps are as follows:
(1)
Select expert members with research experience and project experience related to WRCC, and explain in detail the concept, sequence and the method of scoring.
(2)
The weight range of all importance evaluation indicators is given, which is expressed by scoring method.
(3)
Send each expert a list, check and fill in according to steps 4 to 9, until there is no change in the expert’s score.
(4)
Each expert member marks and scores the importance of each type of indicator, and obtains the weight score of each evaluation indicator.
(5)
All experts compare the marked columns item by item, and discuss whether the scores evaluated by all experts represent their opinions. If there is anything inappropriateness or cannot reflect their opinions, they will need to re-score until they are satisfied.
(6)
Experts add up the score values of each evaluation index to obtain the total number of all indicators.
(7)
Each expert member divides the score of each index with the total number obtained in step 6, that is, the weight of each evaluation index is obtained.
(8)
Collect all scoring tables, and obtain the average weight of various evaluation indicators, which is the group average weight.
(9)
List the averages of each evaluation index, and compare the averages of each group with the weights obtained in step 7.
(10)
After the comparison in step 9, if the expert wants to change the previous scoring, he needs to go back to step 4 and repeat the entire scoring process from steps 4 to 9. If there is no objection, the expert scoring ends, and the average weight of the group is the final weight of each evaluation index.
This study conducted a questionnaire survey among experts in the water resources management sector and researchers in the field of water resources. We invited experts from Zhangye Water Affairs Bureau, Ganzhou District Water Affairs Bureau, Qilian Mountain Water Conservation Forest Research Institute of Gansu Province, Lanzhou University, Northwest Normal University, Hubei University, Nanjing Institute of Lakes of Chinese Academy of Sciences, Northwest University of Political Science and Law and other units to participate in the survey. Among them, there are 4 management decision-making experts and 9 scholars in related fields. The importance and suitability of the indicators are scored and judged by the Delphi method, which is an important reference for the selection of indicators in the construction of the indicator system, and is also an important support for determining the weight of each indicator by the AHP. A total of 13 expert scoring questionnaires were obtained, and the average expert scores of the four dimensions are shown in Table A2.
Table A2. Average scoring results of experts in water quantity, water environment, water ecology, and water management.
Management Decision ExpertResearch ScholarComposite Average Score
B1 Water Quantity5.004.884.92
B2 Water Environment4.504.334.38
B3 Water Ecology4.003.893.92
B4 Water Management4.754.564.61
It can be seen from Table A2 that the water quantity has the highest score in the current agricultural WRCC evaluation of inland river basins. This suggests that water quantity is a priority area for WRCC for water-scarce inland river basins. Water management scored second and had the second highest importance. This shows that under the circumstance that the amount of water resources cannot be changed in the short term, it is important for WRCC to improve water use efficiency by optimizing water resources management. Although management decision-makers and researchers have different average scores for the four dimensions, both of them believe that at the current development stage, water quantity and water management are the two most important aspects of WRCC.

Appendix A.3. AHP Measures Index Weights

Appendix A.3.1. Judging the Importance of Indicators

This paper uses AHP to carry out the weight calculation of the WRCC evaluation index. The key to using AHP to calculate the index weight is to judge the importance of each evaluation index and quantify the qualitative judgment. Based on the scores of evaluation indicators by experts in water resources management departments and researchers in the field of water resources, the average score of each indicator is used as the basis for quantifying the importance of each indicator (Table A3). In order to distinguish the importance of the average score of each index, we assign the average score at [4.5, 5.0] to 5, [4.0, 4.5) to 4, [3.0, 4.0) to 3, (2.0, 3.0] to 2, and (0, 2.0] to 1. The scores correspond to very important, important, general, unimportant, and very unimportant, respectively. Based on the evaluation of the importance of each indicator, the importance comparison of the two indicators is carried out around the system-level objectives of the indicator system.
Table A3. Quantitative criteria for the importance of indicators.
Indicator ScoringImportance Level
ImportanceSuitabilityVery UnimportantUnimportantGeneralImportantVery Important
Quantitative scoringYes/No12345

Appendix A.3.2. Establishing a Hierarchical Model

Based on the above evaluation index system, and according to the hierarchical relationship of each index, a hierarchical structure model of WRCC evaluation in townships in Ganzhou District is constructed (Figure A1). The hierarchical structure model is divided into three layers. Layer A is the target layer (the carrying capacity of water resources in towns in Ganzhou District), layer B is the system layer (water quantity, water environment, water ecology and water management), and layer C is the index layer (including 20 specific indicators).
Figure A1. Evaluation hierarchy structure of WRCC for townships in Ganzhou district.
Agriculture 12 00700 g0a1

Appendix A.3.3. Constructing the Judgment Matrix

Constructing the judgment matrix is a key step in the quantification of hierarchical model. The judgment matrix represents the relative importance of an element at the previous level as the criterion for the relevant elements at this level. Comparing the elements of this level in pairs and according to the hierarchical structure, we build a judgment matrix layer by layer from top to bottom, and each level element is based on the adjacent elements of the previous level. This paper adopts the method of assigning importance of each indicator to compare the indicators in each level, and constructs all judgment matrices in each level, as shown in Table A4, Table A5, Table A6, Table A7 and Table A8.
Table A4. A-B judgment matrix.
A1B1B2B3B4
B115/45/31/1
B24/514/34/5
B33/53/413/5
B415/45/31
Table A5. B1-C judgment matrix.
B1C1C2C3C4C5C6C7C8
C115/415/41/15/35/41/1
C24/514/51/14/54/314/5
C315/415/41/15/35/41
C44/514/514/54/31/14/5
C515/415/415/35/41/1
C63/53/43/53/43/513/43/5
C74/514/514/54/314/5
C815/415/41/15/35/41/1
Table A6. B2-C judgment matrix.
B2C9C10C11C12C13
C911/114/34/5
C10111/14/34/5
C111114/34/5
C123/43/43/413/5
C135/45/45/45/31
Table A7. B3-C judgment matrix.
B3C14C15
C153/41
Table A8. B4-C judgment matrix.
B4C16C17C18C19C20
C1613/43/43/43/4
C174/311/11/11/1
C184/3111/11
C194/31111/1
C204/31/11/11/11

Appendix A.3.4. Hierarchical Single Ordering

The purpose of single-level ordering is to express the relative importance weight of an element of this level corresponding to an element of an upper level. This process can be summed up as finding the maximum eigenroot of the judgment matrix and the corresponding eigenvectors. This feature vector represents the importance weight of the element of this layer corresponding to the upper-level criterion element, and after normalization, it is the weight of the element corresponding to the upper-level criterion element. That is to solve the W in the following formula:
BW = λ max W
B is the judgment matrix, λ max is the largest eigenroot of B , W is the corresponding normalized eigenvector of λ max , and the component of W is the weight of the single ordering of the corresponding elements of this level.

Appendix A.3.5. Consistency Test

The relative importance of the elements of a certain level can be considered reasonable only if the judgment matrix passes the consistency test. This paper uses the following consistency indicators to test the consistency of the judgment matrix:
CI = λ max n n 1
CR = CI RI
CI is the consistency index, CR is the random consistency ratio, and RI is the average random consistency index. For the 1–9 order matrix, RI can be obtained by checking the average random consistency index table.
It is generally believed that when CR   < 0.1 , the judgment matrix has satisfactory consistency, otherwise the judgment matrix needs to be adjusted. When the λ max of the judgment matrix is close to n , that is, the closer the value of CI is to 0, the better the consistency is. When CI   = 0 , the matrix has complete consistency. All judgment matrices in this paper satisfy CR   < 0.1 , pass the consistency test and have satisfactory consistency.

Appendix A.3.6. Index Weight Results

The weights of the system layer and the index layer are calculated according to the expert scoring-AHP method (Table A9). On the whole, the importance of the indicators in each system layer is not much different, and the weights are relatively balanced. It shows that each index is almost equally important to the evaluation target of the WRCC of the townships.
Table A9. Evaluation index weights for WRCC of townships.
System LayerSystem Layer Corresponding Target Layer WeightIndex LayerIndex Layer Corresponding to System Layer WeightIndex Layer Corresponding to Target Layer Combination Weight
B10.29C10.140.04
C20.110.03
C30.140.04
C40.110.03
C50.140.04
C60.090.03
C70.110.03
C80.140.04
B20.24C90.200.05
C100.200.05
C110.200.05
C120.150.04
C130.250.06
B30.18C140.570.10
C150.430.08
B40.29C160.160.05
C170.210.06
C180.210.06
C190.210.06
C200.210.06

References

  1. Chao, Z.L.; Song, X.Y.; Feng, X.H. Concept and Connotation of Water Resources Carrying Capacity in Water Ecological Civilization Construction. ICAEE 2017, 111, 012003. [Google Scholar] [CrossRef]
  2. Zhang, C.; Chen, X.X.; Li, Y.; Ding, W.; Fu, G.T. Water-energy-food nexus: Concepts, questions and methodologies. J. Clean. Prod. 2018, 195, 625–639. [Google Scholar] [CrossRef]
  3. Cao, W.Z.; Deng, J.L.; Yang, Y.; Zeng, Y.Y.; Liu, L.M. Water Carrying Capacity Evaluation Method Based on Cloud Model Theory and an Evidential Reasoning Approach. Mathematics 2022, 10, 266. [Google Scholar] [CrossRef]
  4. Wang, G.; Xiao, C.L.; Qi, Z.W.; Meng, F.A.; Liang, X.J. Development tendency analysis for the water resource carrying capacity based on system dynamics model and the improved fuzzy comprehensive evaluation method in the Changchun city, China. Ecol. Indic. 2021, 122, 107232. [Google Scholar] [CrossRef]
  5. Tang, B.J.; Hu, Y.J.; Li, H.N.; Yang, D.W.; Liu, J.P. Research on comprehensive carrying capacity of Beijing-Tianjin-Hebei region based on state-space method. Nat. Hazards 2016, 84, 113–128. [Google Scholar] [CrossRef]
  6. Djuwansyah, M.R. Environmental sustainability control by water resources carrying capacity concept: Application significance in Indonesia. GCGE 2018, 118, 012027. [Google Scholar] [CrossRef]
  7. Zuo, Q.T.; Guo, J.H.; Ma, J.X.; Cui, G.T.; Yang, R.X.; Yu, L. Assessment of regional-scale water resources carrying capacity based on fuzzy multiple attribute decision-making and scenario simulation. Ecol. Indic. 2021, 130, 108034. [Google Scholar] [CrossRef]
  8. Motoshita, M.; Pfister, S.; Finkbeiner, M. Regional Carrying Capacities of Freshwater Consumption-Current Pressure and Its Sources. Environ. Sci. Technol. 2020, 54, 9083–9094. [Google Scholar] [CrossRef]
  9. Wu, C.G.; Zhou, L.Y.; Jin, J.L.; Ning, S.W.; Zhang, Z.X.; Bai, L. Regional water resource carrying capacity evaluation based on multi-dimensional precondition cloud and risk matrix coupling model. Sci. Total Environ. 2020, 710, 136324. [Google Scholar] [CrossRef]
  10. Zhou, X.Y.; Zheng, B.H.; Khu, S.T. Simulation platform of human-environment systems for water environment carrying capacity research. J. Clean. Prod. 2020, 250, 119577. [Google Scholar] [CrossRef]
  11. Fan, C.H.; Chen, K.H.; Huang, Y.Z. Model-based carrying capacity investigation and its application to total maximum daily load (TMDL) establishment for river water quality management: A case study in Taiwan. J. Clean. Prod. 2021, 291, 125251. [Google Scholar] [CrossRef]
  12. Wang, Y.X.; Wang, Y.; Su, X.L.; Qi, L.; Liu, M. Evaluation of the comprehensive carrying capacity of interprovincial water resources in China and the spatial effect. J. Hydrol. 2019, 575, 794–809. [Google Scholar] [CrossRef]
  13. Li, J.H.; Lei, X.H.; Fu, Q.; Li, T.X.; Qiao, Y.; Chen, L.; Liao, W.H. Multi-scale research of time and space differences about ecological footprint and ecological carrying capacity of the water resources. Appl. Water Sci. 2018, 8, 22. [Google Scholar] [CrossRef] [Green Version]
  14. Hassani, Y.; Shandany, S.M.H.; Maestre, J.M.; Zahraie, B.; Ghorbani, M.; Henneberry, S.R.; Kulshreshtha, S.N. An economic-operational framework for optimum agricultural water distribution in irrigation districts without water marketing. Agric. Water Manag. 2019, 221, 348–361. [Google Scholar] [CrossRef]
  15. Kamrani, K.; Roozbahani, A.; Shahdany, S.M.H. Using Bayesian networks to evaluate how agricultural water distribution systems handle the water-food-energy nexus. Agric. Water Manag. 2020, 239, 106265. [Google Scholar] [CrossRef]
  16. Tork, H.; Javadi, S.; Shahdany, S.M.H. A new framework of a multi-criteria decision making for agriculture water distribution system. J. Clean. Prod. 2021, 306, 127178. [Google Scholar] [CrossRef]
  17. Marttunen, M.; Mustajoki, J.; Sojamo, S.; Ahopelto, L.; Keskinen, M. A Framework for Assessing Water Security and the Water-Energy-Food Nexus:The Case of Finland. Sustainability 2019, 11, 2900. [Google Scholar] [CrossRef] [Green Version]
  18. Aboelnga, H.T.; El-Naser, H.; Ribbe, L.; Frechen, F.B. Assessing Water Security in Water-Scarce Cities: Applying the Integrated Urban Water Security Index (IUWSI) in Madaba, Jordan. Water 2020, 12, 1299. [Google Scholar] [CrossRef]
  19. Empinotti, V.L.; Budds, J.; Jepson, W.; Millington, N.; Ferrara, L.N.; Geere, J.-A.; Grandisoli, E.; Arteiro da Paz, M.G.; Puga, B.P.; Alves, E.M.; et al. Advancing urban water security: The urbanization of water-society relations and entry-points for political engagement. Water Int. 2021, 46, 956–968. [Google Scholar] [CrossRef]
  20. Hu, G.Z.; Zeng, W.H.; Yao, R.H.; Xie, Y.X.; Liang, S. An integrated assessment system for the carrying capacity of the water environment based on system dynamics. J. Environ. Manag. 2021, 295, 113045. [Google Scholar] [CrossRef]
  21. Cao, F.F.; Lu, Y.; Dong, S.J.; Li, X.L. Evaluation of natural support capacity of water resources using principal component analysis method: A case study of Fuyang district, China. Appl. Water Sci. 2021, 46, 956–968. [Google Scholar] [CrossRef]
  22. Ren, C.F.; Guo, P.; Li, M.; Li, R.H. An innovative method for water resources carrying capacity research—Metabolic theory of regional water resources. J. Environ. Manag. 2016, 167, 139–146. [Google Scholar] [CrossRef] [PubMed]
  23. Harmancioglu, N.B. Overview of Water Policy Developments: Pre- and Post-2015 Development Agenda. Water Resour. Manag. 2017, 31, 3001–3021. [Google Scholar] [CrossRef]
  24. Wu, L.; Su, X.L.; Ma, X.Y.; Kang, Y.; Jiang, Y.A. Integrated modeling framework for evaluating and predicting the water resources carrying capacity in a continental river basin of Northwest China. J. Clean Prod. 2018, 204, 366–379. [Google Scholar] [CrossRef]
  25. Wei, X.M.; Wang, J.Y.; Wu, S.G.; Xin, X.; Wang, Z.L.; Liu, W. Comprehensive evaluation model for water environment carrying capacity based on VPOSRM framework: A case study in Wuhan, China. Sust. Cities Soc. 2019, 50, 101640. [Google Scholar] [CrossRef]
  26. Chen, M.L.; Jin, J.L.; Ning, S.W.; Zhou, Y.L.; Udmale, P. Early Warning Method for Regional Water Resources Carrying Capacity Based on the Logical Curve and Aggregate Warning Index. Int. J. Environ. Res. Public Health 2020, 17, 2206. [Google Scholar] [CrossRef] [Green Version]
  27. Cui, Y.; Feng, P.; Jin, J.L.; Liu, L. Water Resources Carrying Capacity Evaluation and Diagnosis Based on Set Pair Analysis and Improved the Entropy Weight Method. Entropy 2018, 20, 359. [Google Scholar] [CrossRef] [Green Version]
  28. Naimi-Ait-Aoudia, M.; Berezowska-Azzag, E. Algiers carrying capacity with respect to per capita domestic water use. Sust. Cities Soc. 2014, 13, 1–11. [Google Scholar] [CrossRef]
  29. Zhang, S.H.; Xiang, M.S.; Yang, J.S.; Fan, W.W.; Yi, Y.J. Distributed hierarchical evaluation and carrying capacity models for water resources based on optimal water cycle theory. Ecol. Indic. 2019, 101, 432–443. [Google Scholar] [CrossRef]
  30. Bu, J.H.; Li, C.H.; Wang, X.; Zhang, Y.; Yang, Z.W. Assessment and prediction of the water ecological carrying capacity in Changzhou city, China. J. Clean. Prod. 2020, 277, 123988. [Google Scholar] [CrossRef]
  31. Zhou, X.Y.; Lei, K.; Meng, W.; Khu, S.T. Industrial structural upgrading and spatial optimization based on water environment carrying capacity. J. Clean. Prod. 2017, 165, 1462–1472. [Google Scholar] [CrossRef]
  32. Zhang, Y.X.; Chen, M.; Zhou, W.H.; Zhuang, C.W.; Ouyang, Z.Y. Evaluating Beijing’s human carrying capacity from the perspective of water resource constraints. J. Environ. Sci. 2010, 22, 1297–1304. [Google Scholar] [CrossRef]
  33. Wang, P.; Zhu, Z.Q.; Fei, Y.H. The Environmental Early Warning Management of Water Resources Carrying Capacity of Ski Resorts in China. J. Coast. Res. 2020, 115, 430–433. [Google Scholar] [CrossRef]
  34. Song, W.W.; Pang, Y. Research on narrow and generalized water environment carrying capacity, economic benefit of Lake Okeechobee, USA. Ecol. Eng. 2021, 173, 106420. [Google Scholar] [CrossRef]
  35. Jia, Z.M.; Cai, Y.P.; Chen, Y.; Zeng, W.H. Regionalization of water environmental carrying capacity for supporting the sustainable water resources management and development in China. Resour. Conserv. Recycl. 2018, 134, 282–293. [Google Scholar] [CrossRef]
  36. Cheng, K.; Fu, Q.; Meng, J.; Li, T.X.; Pei, W. Analysis of the Spatial Variation and Identification of Factors Affecting the Water Resources Carrying Capacity Based on the Cloud Model. Water Resour. Manag. 2018, 32, 2767–2781. [Google Scholar] [CrossRef]
  37. Li, C.J. The Development of Township and Village Enterprises and the Issues of Agriculture, Countryside and Peasantry. In Proceedings of the International Conference on Management Innovation and Public Policy, Chongqing, China, 7–8 January 2012. [Google Scholar]
  38. Han, Q.; Jiang, J.Y.; Li, Y.; Shi, Z.G.; Yin, P.H. Current Research Status and Perspective of Water Resources Carrying Capacity in the Arid and Semi-arid Regions of Northwest China. In Proceedings of the 2nd International Conference on Social Science and Development, Chengdu, China, 28–29 May 2016. [Google Scholar]
  39. King-Okumu, C.; Jillo, B.; Kinyanjui, J.; Jarso, I. Devolving water governance in the Kenyan Arid Lands: From top-down drought and flood emergency response to locally driven water resource development planning. Int. J. Water Resour. Dev. 2018, 34, 675–697. [Google Scholar] [CrossRef]
  40. Yu, Y.; Pi, Y.; Yu, X.; Ta, Z.; Sun, L.; Disse, M.; Zeng, F.; Li, M.; Chen, X.; Yu, R. Climate change, water resources and sustainable development in the arid and semi-arid lands of Central Asia in the past 30 years. J. Arid Land 2019, 11, 1–14. [Google Scholar] [CrossRef] [Green Version]
  41. Xiao, H.; Zhang, L.; Chai, Z. Development of urbanization in arid and semi arid regions based on the water resource carrying capacity—A case study of Changji, Xinjiang. ISEO 2016, 74, 012003. [Google Scholar] [CrossRef] [Green Version]
  42. Zhangye Water Affairs Bureau. Available online: http://www.zhangye.gov.cn/swj/dzdt/tbgz/202007/t20200730_464514.html (accessed on 30 July 2020).
  43. Heihe River Bureau of the Yellow River Conservancy Commission. Available online: http://hrb.yrcc.gov.cn/content/2020-08-11/2653.html (accessed on 11 August 2020).
  44. Zhang, M.; Liu, Y.M.; Wu, J.; Wang, T.T. Index system of urban resource and environment carrying capacity based on ecological civilization. Environ. Impact Assess. Rev. 2018, 68, 90–97. [Google Scholar] [CrossRef]
  45. Wang, Y.T.; Cheng, H.X.; Huang, L. Water resources carrying capacity evaluation of a dense city group: A comprehensive water resources carrying capacity evaluation model of Wuhan urban agglomeration. Urban Water J. 2018, 15, 615–625. [Google Scholar] [CrossRef]
  46. Wu, C.F.; Yi, H.Y. The water resources supporting capacity for the new-type urbanization of Gansu Province, China. IOP Conf. Ser. Earth Environ. Sci. 2019, 330, 032023. [Google Scholar] [CrossRef]
  47. Gao, G.F.; Cao, D.F. Design of Constant Pressure Water Supply System for a Residential District Based on PLC. In Proceedings of the 2016 IEEE International Conference of Online Analysis and Computing Science (ICOACS), Chongqing, China, 28–29 May 2016. [Google Scholar]
  48. Zhou, D.; Zhang, R.Q.; Liu, L.M.; Gao, L.L.; Cai, S.M. A study on water resources consumption by principal component analysis in Qingtongxia irrigation areas of Yinchuan Plain, China. J. Food Agric. Environ. 2009, 7, 734–738. [Google Scholar]
  49. He, L.X.; Nie, C.L. Theory and development trend in future about water resources carrying capacity. In Proceedings of the 2nd International Conference on Climate Change, Global Warming, Biological Programs, Morgan State University, Baltimore, MD, USA, 7–9 November 2009. [Google Scholar]
  50. Khorsandi, M.; Homayouni, S.; van Oel, P. The edge of the petri dish for a nation: Water resources carrying capacity assessment for Iran. Sci. Total Environ. 2022, 817, 153038. [Google Scholar] [CrossRef]
  51. Pfister, S.; Bayer, P. Monthly water stress: Spatially and temporally explicit consumptive water footprint of global crop production. J. Clean. Prod. 2014, 73, 52–62. [Google Scholar] [CrossRef]
  52. Gosling, S.N.; Arnell, N.W. A global assessment of the impact of climate change on water scarcity. Clim. Chang. 2016, 134, 371–385. [Google Scholar] [CrossRef] [Green Version]
  53. Zimoch, I. Method of Risk Analysis and Assessment of Water Supply System Exploitation in Agricultural Areas. Ochr. Srodowiska 2017, 38, 33–38. [Google Scholar]
  54. Barakat, H.M.; Nigm, E.M.; Khaled, O.M. Extreme value modeling under power normalization. Appl. Math. Model. 2013, 37, 10162–10169. [Google Scholar] [CrossRef]
  55. Emshoff, J.R.; Saaty, T.L. Applications of The Analytic Hierarchy Process to Long-range Planing Processes. Eur. J. Oper. Res. 1982, 10, 131–143. [Google Scholar] [CrossRef]
  56. Campagne, C.S.; Roche, P.; Gosselin, F.; Tschanz, L.; Tatoni, T. Expert-based ecosystem services capacity matrices: Dealing with scoring variability. Ecol. Indic. 2017, 79, 63–72. [Google Scholar] [CrossRef] [Green Version]
  57. Subramanian, N.; Ramanathan, R. A review of applications of Analytic Hierarchy Process in operations management. Int. J. Prod. Econ. 2012, 138, 215–241. [Google Scholar] [CrossRef]
  58. Ho, W.; Ma, X. The state-of-the-art integrations and applications of the analytic hierarchy process. Eur. J. Oper. Res. 2018, 267, 399–414. [Google Scholar] [CrossRef]
  59. Han, C.; Chen, S.; Yu, Y.; Xu, Z.; Zhu, B.; Xu, X.; Wang, Z. Evaluation of Agricultural Land Suitability Based on RS, AHP, and MEA: A Case Study in Jilin Province, China. Agriculture 2021, 11, 370. [Google Scholar] [CrossRef]
  60. Martilla, J.A.; James, J.C. Importance-performace analysis. J. Mark. 1977, 41, 77–79. [Google Scholar] [CrossRef]
  61. Hawes, J.M.; Rao, C.P. Using importance-performance analysis to develop health care marketing strategies. J. Health Care Mark. 1985, 5, 19–25. [Google Scholar]
  62. Pratum, C. Assessment of Water Resources Pollution Carrying Capacity in The Sa Kaeo Special Economic Zone, Thailand. Pollution 2021, 7, 815–830. [Google Scholar] [CrossRef]
  63. Sui, R.; Anapalli, S.S. Effects of Nitrogen Rate and Cover Crop on Cotton (Gossypium hirsutum L.) Yield and Soil Water Content. Agriculture 2021, 11, 650. [Google Scholar] [CrossRef]
  64. Wang, Y.Q.; Xian, C.F.; Jiang, Y.Q.; Pan, X.L.; Ouyang, Z.Y. Anthropogenic reactive nitrogen releases and gray water footprints in urban water pollution evaluation: The case of Shenzhen City, China. Environ. Dev. Sustain. 2019, 22, 6343–6361. [Google Scholar] [CrossRef]
  65. Li, Z.; Fang, Y.; Zeng, G.; Li, J.; Zhang, Q.; Yuan, Q.; Wang, Y.; Ye, F. Temporal and spatial characteristics of surface water quality by an improved universal pollution index in red soil hilly region of South China: A case study in Liuyanghe River watershed. Environ. Geol. 2009, 58, 101–107. [Google Scholar] [CrossRef]
  66. Ait-Aoudia, M.N.; Berezowska-Azzag, E. Water resources carrying capacity assessment: The case of Algeria’s capital city. Habitat Int. 2016, 58, 51–58. [Google Scholar] [CrossRef]
  67. Zhang, X.Y.; Zuo, Q.T.; Yang, Q.X. Calculation of the water resources dynamic carrying capacity of Tarim River Basin under climate change. Desalin. Water Treat. 2018, 119, 243–252. [Google Scholar] [CrossRef]
  68. Ogunkanmi, L.; MacCarthy, D.S.; Adiku, S.G.K. Impact of Extreme Temperature and Soil Water Stress on the Growth and Yield of Soybean (Glycine max (L.) Merrill). Agriculture 2022, 12, 43. [Google Scholar] [CrossRef]
  69. Rice, D.C.J.; Carriveau, R.; Ting, D.S.K.; Bata, M.H. Evaluation of Crop to Crop Water Demand Forecasting: Tomatoes and Bell Peppers Grown in a Commercial Greenhouse. Agriculture 2017, 7, 104. [Google Scholar] [CrossRef] [Green Version]
Figure 1. Overview of the study area and the locations of the eight townships.
Agriculture 12 00700 g001
Figure 2. Flow chart of the analysis of the WRCC in the studied townships.
Agriculture 12 00700 g002
Figure 3. Flow chart of WRCC assessment methodology.
Agriculture 12 00700 g003
Figure 4. Schematic of the importance-performance analysis.
Agriculture 12 00700 g004
Figure 5. Evaluation results of water stress index of typical townships.
Agriculture 12 00700 g005
Figure 6. Importance-performance analysis of the WRCC index in towns.
Agriculture 12 00700 g006
Table 1. Description of the eight studied townships.
Irrigation District TypeTownship NameIrrigation DistrictIrrigation MethodTownship Type
Mountain Irrigation AreaAnyang TownshipAnyang Irrigation DistrictSurface resourcesAgricultural product supply
Huazhai TownshipHuazhai Irrigation DistrictSurface resourcesEcological
Heihe Irrigation AreaDaman TownDaman Irrigation DistrictMixed irrigation with groundwater resources and surface resourcesEcological
Ganjun TownGanjun Irrigation DistrictSurface resourcesEcological
Liangjiadun TownYingke Irrigation DistrictMixed irrigation with groundwater resources and surface resourcesIndustrial agglomeration
Longqu TownshipShangsan Irrigation DistrictSurface resourcesIndustrial agglomeration
Shajing TownXigan Irrigation DistrictMixed irrigation with groundwater resources and surface resourcesAgricultural product supply
Spring Irrigation AreaWujiang TownWujiang Irrigation DistrictSurface resourcesAgricultural product supply
Table 2. Evaluation index system for the comprehensive carrying capacity of agricultural water resources in townships.
System LayerIndex LayerIndex Calculation
B1 Water QuantityC1 Water resources available per capitaInitial water rights per capita.
C2 Collectively owned storage ponds and damsCapacity of collectively owned reservoirs and ponds in each township
C3 Water production quantitySelf-produced water volume in each township area
C4 Water consumption per 10,000 yuan of total economic incomeRatio of the total amount of water consumption in the township to the total economic income of 10,000 yuan (the water consumption includes domestic, aquaculture, irrigation, and industrial water, and the water use quota for each part is calculated based on the relevant data of production and living)
C5 Ratio of industrial to agricultural incomeRatio of total industrial income to total agricultural production income in each township
C6 Rate of change in cultivated land areaRate of change of cultivated land area in each township from 2010 to 2020 (the cultivated land area data comes from land use data, with a spatial resolution of 100 m, and the data source is http://www.resdc.cn, accessed on 1 December 2021)
C7 Groundwater exploitation potentialRatio of the allowable extraction of groundwater to the actual extraction of groundwater in each irrigation district
C8 Water stress indexRatio of township water consumption to available water resources (initial water rights)
B2 Water EnvironmentC9 Pesticide usage per unit of arable landHousehold-scale data from each township obtained through a questionnaire survey
C10 Amount of fertilizer applied per unit of arable landHousehold-scale data from each township obtained through a questionnaire survey
C11 Centralized sewage disposal capacity per capitaDaily centralized sewage treatment volume per person in each township sewage treatment facility
C12 Per capita domestic waste innocuous disposal capacityAnnual per capita harmless disposal of domestic waste in each township
C13 Water quality compliance rate of centralized drinking water sourcesProportion of the monitoring results of centralized drinking water source water quality above the class III standard in each township
B3 Water EcologyC14 Water-wading ecosystem area ratioArea ratio of water-related ecosystems (e.g., canals, wetlands, reservoirs, ponds, tidal flats) in each township (calculated based on 2020 land use data)
C15 Ratio of forest and grass areaRatio of forest and grassland area to regional land area in each township (calculated based on 2020 land use data)
B4 Water ManagementC16 Water rights trading volumeAverage number of acres of cultivated land transferred by farmers in each township
(obtained through surveys of rural households in villages and towns)
C17 Intactness ratio of channel worksRatio of the intact channel length to the total length of channels in each irrigation area
C18 Proportion of high-standard farmland areaRatio of high-standard farmland construction area to total farmland area in each township
C19 Water saving awarenessWater-saving awareness of farmer in each township based on two perspectives: the willingness to adjust the planting structure and the willingness to use water-saving technologies
C20 Water resources satisfactionWater resources satisfaction for each township farmer was determined by a survey based on three perspectives: water quantity satisfaction, water quality satisfaction, and water environment satisfaction
Table 3. Evaluation criteria for control index of water resources carrying capacity in townships.
Water Resource Carrying StatusOverloadCritical OverloadNo Overload
Water stress indexR > 1R = 1R < 1
Table 4. Evaluation standard of comprehensive index of water resources carrying capacity.
Comprehensive Index of Water Resources Carrying CapacityWater Resource Carrying StatusStatus Explanation
(0, 0.25)Extremely fragileThe water system is not working well. Its economic and social carrying capacity is in a critical state, and there are obvious weaknesses in various fields
(0.25, 0.50)FragileThe operation of water resources system is manageable; however, its economic and societal carrying capacity is weak, and there are clear restrictive factors
(0.50, 0.75)Generally acceptableThe water resources system is operating well. It adapts to the current economic and social scale, but there are constraints in some areas
(0.75, 1)AcceptableThe water resources system is in a state of sustainable utilization. It has strong carrying capacity for the status of the economy and society, and there are no obvious restrictive factors
Table 5. Evaluation index weights for township WRCC.
System LayerSystem Layer Corresponding Target Layer WeightIndex LayerAttribute of the IndicatorIndex Layer Corresponding to System Layer WeightIndex Layer Corresponding to Target Layer Combination Weight
B10.29C1positive0.140.04
C2positive0.110.03
C3positive0.140.04
C4positive0.110.03
C5positive0.140.04
C6negative0.090.03
C7positive0.110.03
C8negative0.140.04
B20.24C9negative0.200.05
C10negative0.200.05
C11positive0.200.05
C12positive0.150.04
C13positive0.250.06
B30.18C14positive0.570.10
C15positive0.430.08
B40.29C16positive0.160.05
C17positive0.210.06
C18positive0.210.06
C19positive0.210.06
C20positive0.210.06
Table 6. Evaluation results of WRCC of typical townships in Ganzhou District in 2021.
Irrigation District
Type
Township TypeTownship NameControl IndexWater Resources Carrying Capacity
Comprehensive Index
Comprehensive Evaluation
Water Stress IndexBearing StateComprehensive IndexBearing State
Mountain Irrigation AreaAgricultural product supplyAnyang Township1.28Overload0.54 Overload
EcologicalHuazhai Township0.68No overload0.70Generally acceptableGenerally acceptable
Heihe Irrigation AreaEcologicalDaman Town0.53No overload0.44FragileFragile
EcologicalGanjun Town0.52No overload0.48FragileFragile
Industrial agglomerationLiangjiadun Town0.88No overload0.41FragileFragile
Industrial agglomerationLongqu Township0.72No overload0.39FragileFragile
Agricultural product supplyShajing Town1.25Overload0.25 Overload
Spring Irrigation AreaAgricultural product supplyWujiang Town1.67Overload0.48 Overload
Publisher’s Note: MDPI stays neutral with regard to jurisdictional claims in published maps and institutional affiliations.

