Article

Utilization of Intra-Cultivar Variation for Grain Yield and Protein Content within Durum Wheat Cultivars

1
Department of Agriculture, International Hellenic University, Sindos, 57400 Thessaloniki, Greece
2
Hellenic Agricultural Organization-Dimitra, Institute of Plant Breeding and Genetic Resources, Thermi, 57001 Thessaloniki, Greece
3
Department of Agriculture, University of Western Macedonia, 53100 Florina, Greece
4
International Center for Agricultural Research in the Dry Areas (ICARDA), Al-Irfane, Rabat 10090, Morocco
*
Authors to whom correspondence should be addressed.
Agriculture 2022, 12(5), 661; https://doi.org/10.3390/agriculture12050661
Submission received: 6 April 2022 / Revised: 27 April 2022 / Accepted: 28 April 2022 / Published: 3 May 2022
(This article belongs to the Topic Plant Breeding, Genetics and Genomics)

Abstract

:
This study assessed the variations in grain yield (GY) and protein content (PC) within two commercial durum wheat cultivars (Svevo and Maestrale) and evaluated their responses to intra-cultivar selection for both traits. We investigated whether the variations are exploitable and could result in concurrent GY and PC upgrading. The experiments were conducted in the IPBGR, Thessaloniki, Greece (2018–2020). The first year included two identical honeycomb design trials under ultra-low plant density (ULD) where the divergent selection was applied based on single plant yield and protein content. In the second year, progeny evaluation under typical crop density (TCD) for GY and PC occurred in a randomized complete block (RCB) and with three replications for each cultivar selected line. This revealed considerable variation within already improved commercial cultivars. Single-plant selection for GY and PC simultaneously resulted in: (a) one high-yielding line that significantly outperformed the original cultivar Svevo while maintaining high PC, and (b) two high-grain PC lines that outperformed the original cultivar Maestrale significantly while maintaining high GY. ULD allowed efficient selection for GY and PC simultaneously within narrow gene pools by maximizing phenotypic expression and differentiation among individual plants.

1. Introduction

Durum wheat (Triticum turgidum subsp. durum (Desf.) Husnot) is an essential crop for food and feeding products. Its cultivation area reached 17 million ha worldwide in 2019, and global production was around 38.1 million tonnes [1]. In the Mediterranean basin, the cultivated area is tending to increase [2,3], due to the adaptation of the crop to stress prone conditions in terms of both abiotic [3,4,5] and biotic adversities [6,7]. Moreover, many research projects aim to increase durum wheat’s stability in contrasting environments by utilizing wild crop relatives [8,9,10,11].
Developing an improved elite cultivar through breeding programs is a time-consuming and costly process, but is necessary for wheat’s adaptation to continuously changing environmental conditions. Thus, the longevity of the elite varieties is of the utmost importance. Relevant research in many crops has encouraged intense selection at nil competition (e.g., ultra-low density) as a useful tool for either upgrading or avoiding a gradual degradation of the genetic background to maintain uniformity and ensure optimum quality of breeder seed for longer time periods [12]. Moreover, the long-term selection studies on maize for oil and protein undertook for almost a century at the University of Illinois [13] showed that continuous intracultivar breeding is a workable option for handling intracultivar variation. A different approach from the classical breeding program is the valuable exploitation of the intra-cultivar phenotypic variation through selection at nil competition, as shown in numerous studies on plants such as corn (Zea mays L.) [14], soybean [Glycine max (L.) Merr.] [15], wheat (Triticum aestivum L.) [16], cotton (Gossypium hirsutum L.) [17], snap bean (Phaseolus vulgaris L.) [18] and rice (Oryza sativa L.) [19]. This technique, i.e., the selection at nil competition, is a short-time tool for selection within landraces to breed for high yielding and stable varieties [20,21,22,23,24]. Many projects using molecular techniques have revealed genetic heterogeneity within cultivars [19,25,26]. Advances in DNA-based techniques contributed to discovering genetic variation at the genomic level and verified significant heterogeneity [27]. It is well documented that the genome is more variable than previously assumed [13,28] and has endogenous mechanisms to be flexible and dynamic, characterized by high plasticity. In her Nobel Prize-winning lecture, McClintock [29] argued that the genomes of many organisms are susceptible to unusual and unexpected events and can modify themselves in response to environmental forces. The genome undergoes constant remodelling and restructuring by utilizing an array of different mechanisms, such as intragenic recombination, unequal crossing over, DNA methylation, excision or insertion of transposable elements, gene duplication and genetic restoration events [30,31,32,33,34]. All the above-mentioned factors enlarge the genetic variation within the improved cultivars [35,36] and provide evidence that inbred lines contain genetic variation that can be further utilized in a breeding program, and the impact of intra-cultivar genetic heterogeneity may be significant [25,37].
The study of this de novo variation is feasible by applying the honeycomb design [38], which permits optimal conditions to maximize the phenotypic expression and thus [39] allows continuous selection within the elite cultivars. Elite cultivars are not homogeneous but rather heterogeneous, within which selections can be made to maintain or improve uniformity and further improve desirable agronomic traits [40]. The intra-cultivar selection relies on distinguishing outstanding genotypes within a narrow gene pool. Many reports confirm that intra-cultivar selection under ULD (i.e., nil competition) maximizes the phenotypic expression and differentiation of the genοtype [40,41,42]. Tokatlidis [12] reports that intense selection at ULD is a useful technique to upgrade or avoid gradual degradation of the genetic background. The importance of non-stop intra-cultivar selection was highlighted by Fasoula [41] and Fasoula and Fasoula [43]. Honeycomb intra-cultivar selection in wheat [16,39,41], maize [14], cotton [17,40,44] and soybean [15,45] succeeded in upgrading cultivars for yield, stability and important agronomic traits related to product quality and tolerance to stresses. While there have been case studies of intra-cultivar breeding with bread wheat at ULD [16,39,41], there is a lack of information about continuous selection in durum wheat.
Although there is considerable variability within a variety that can be used for intra-variety selection [39,40,46], the small number of seeds of individual plants does not allow the measurement of quality characteristics such as nutrient concentrations via the destructive classical analytical methods. The seeds are of course necessary for the breeding process though. A solution to this problem could be the use of the near-infrared spectroscopy (NIR) technology for non-destructive analysis of small seed samples (protein, starch, gluten, etc.) [47]. This would allow the analysis of the seed quality of various genotypes without destroying the seeds and would enable sowing in the next growing season to continue the selection process. This method has become the most widely used alternative to conventional analytical methods due to its rapidity, simplicity, accuracy, cost-effectiveness and potential for routine analysis and quantification of nutrients in food products and crops [48]. Despite the small seed quantity required for measuring seed quality traits using NIR, the seed quantity limitation can still be a challenge when assessing individual plants, especially when plants are evaluated under dense stands. Thus, there is a lack of studies on the evaluation of durum wheat seed quality traits on an individual plant basis. The ULD approach tackles the problem since durum wheat plants grown far apart can produce enough seeds for quality evaluation and selection and line advancement in the next generation.
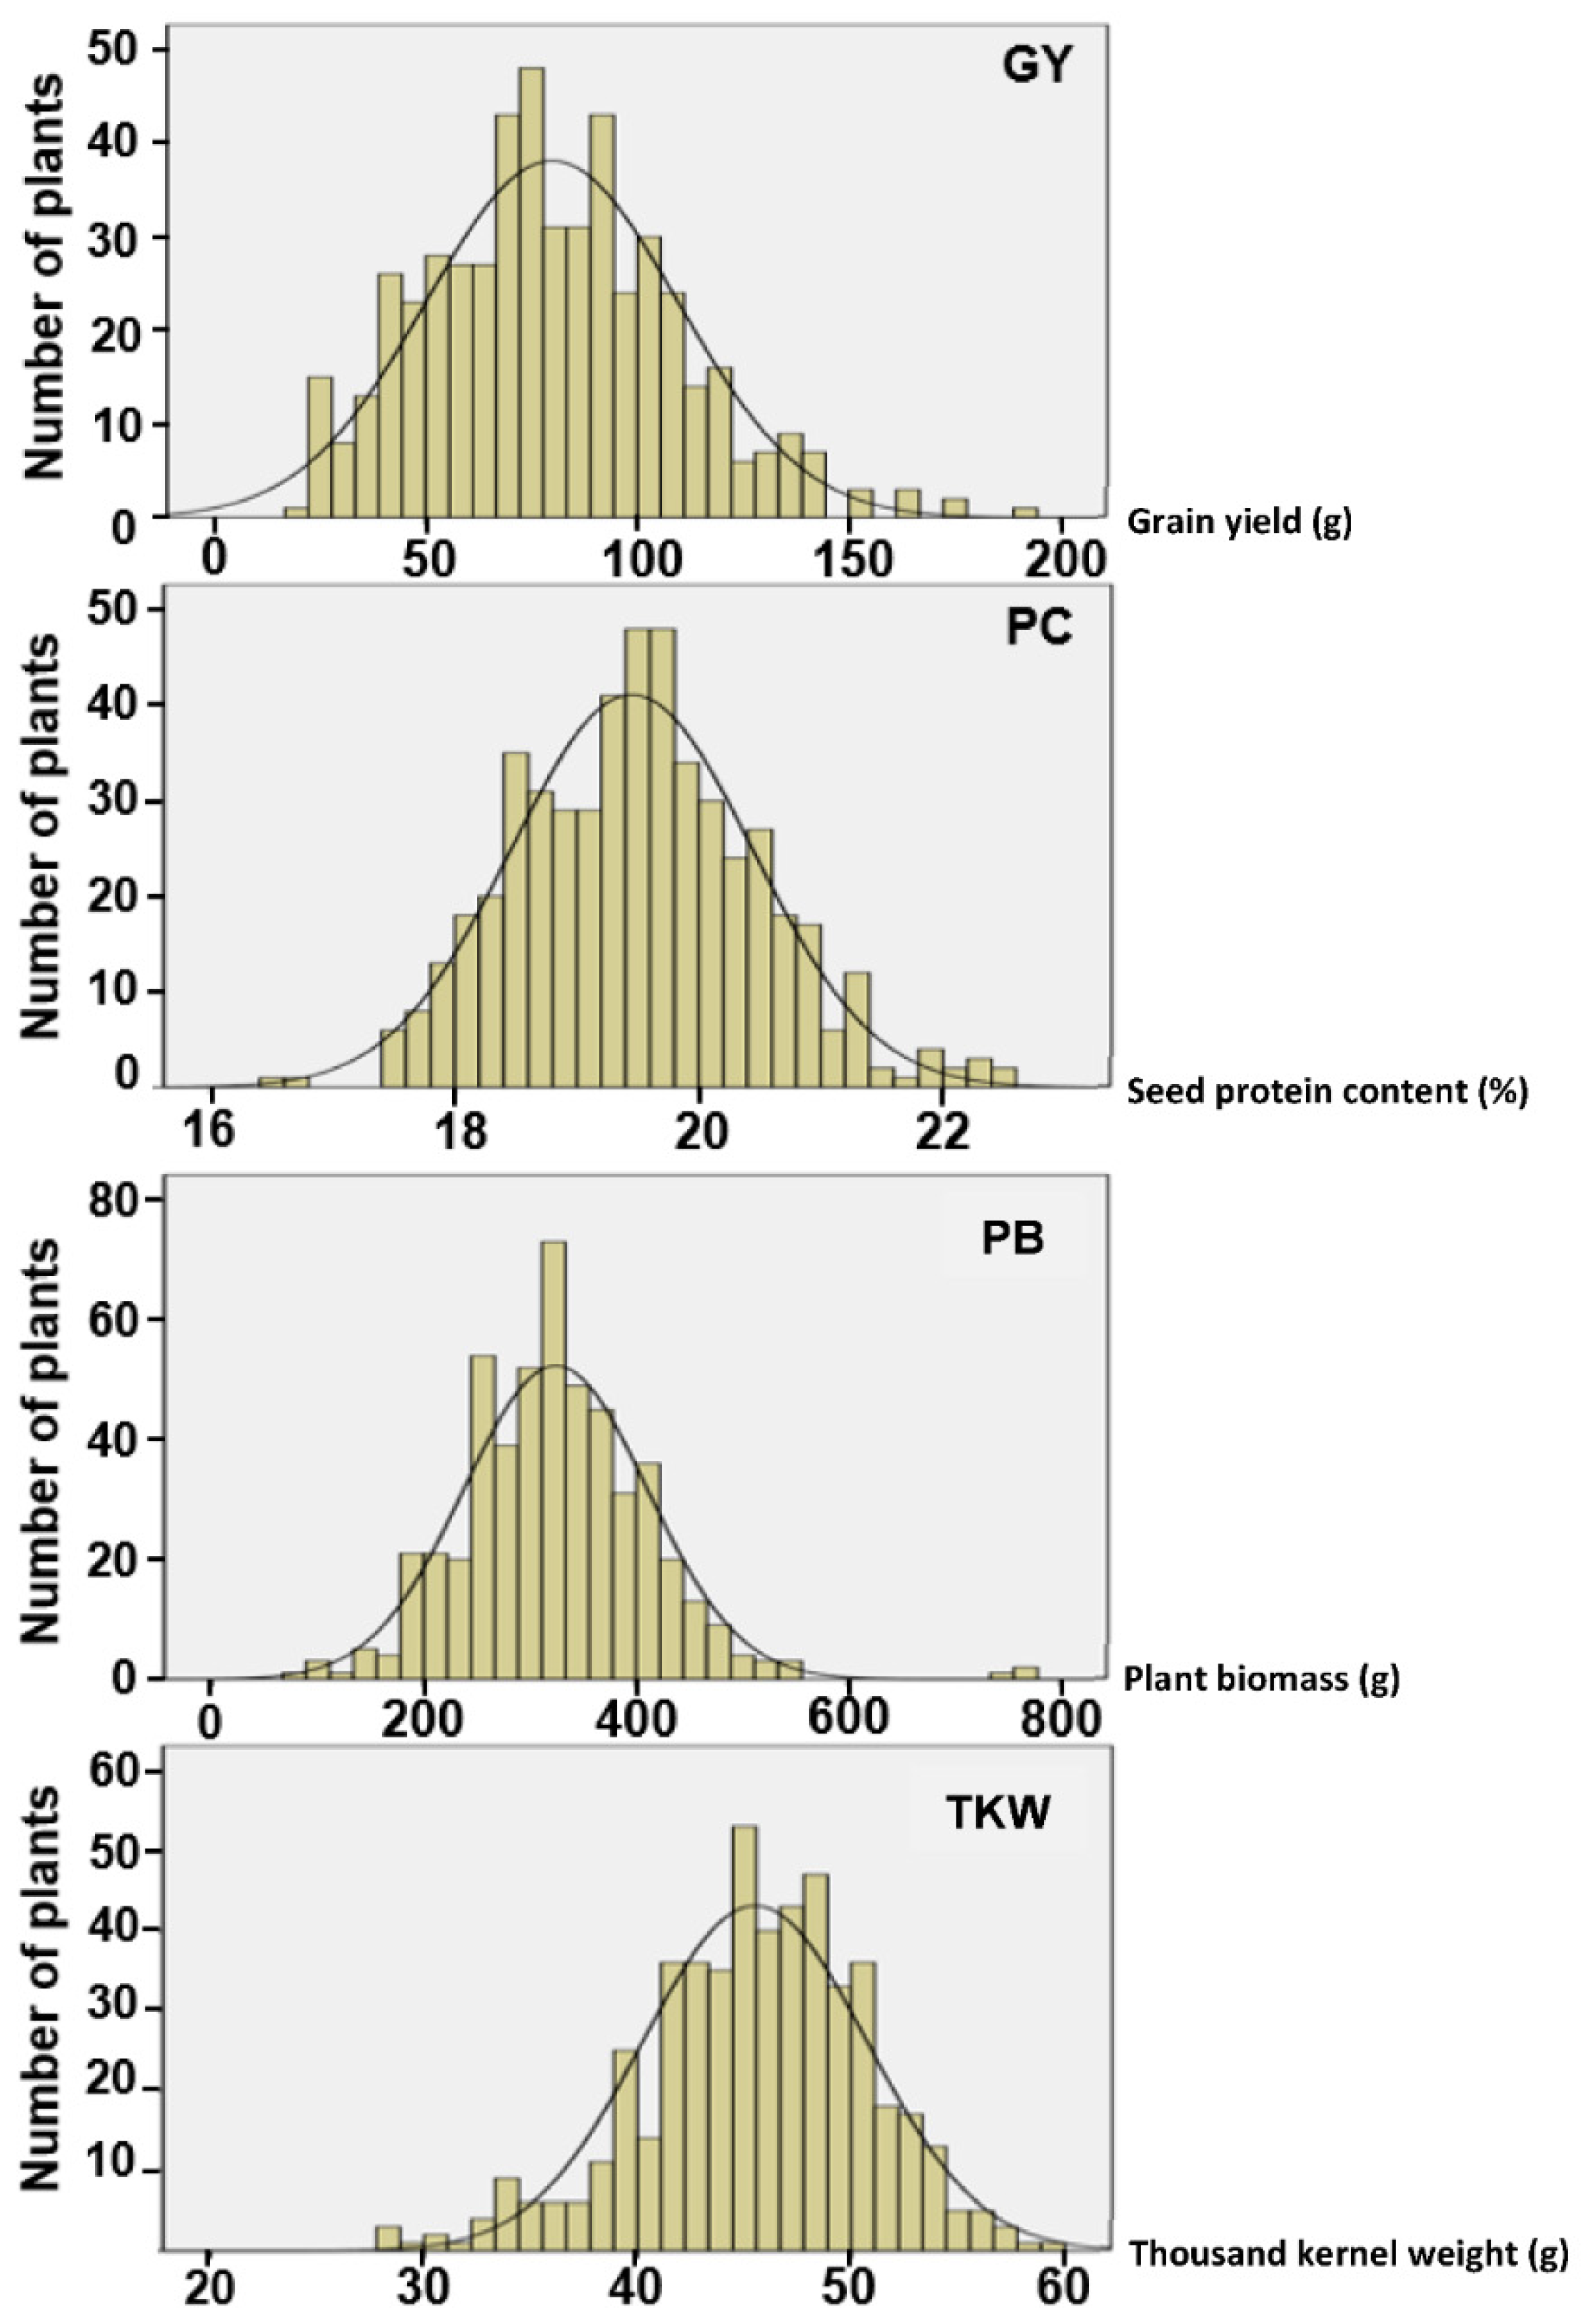
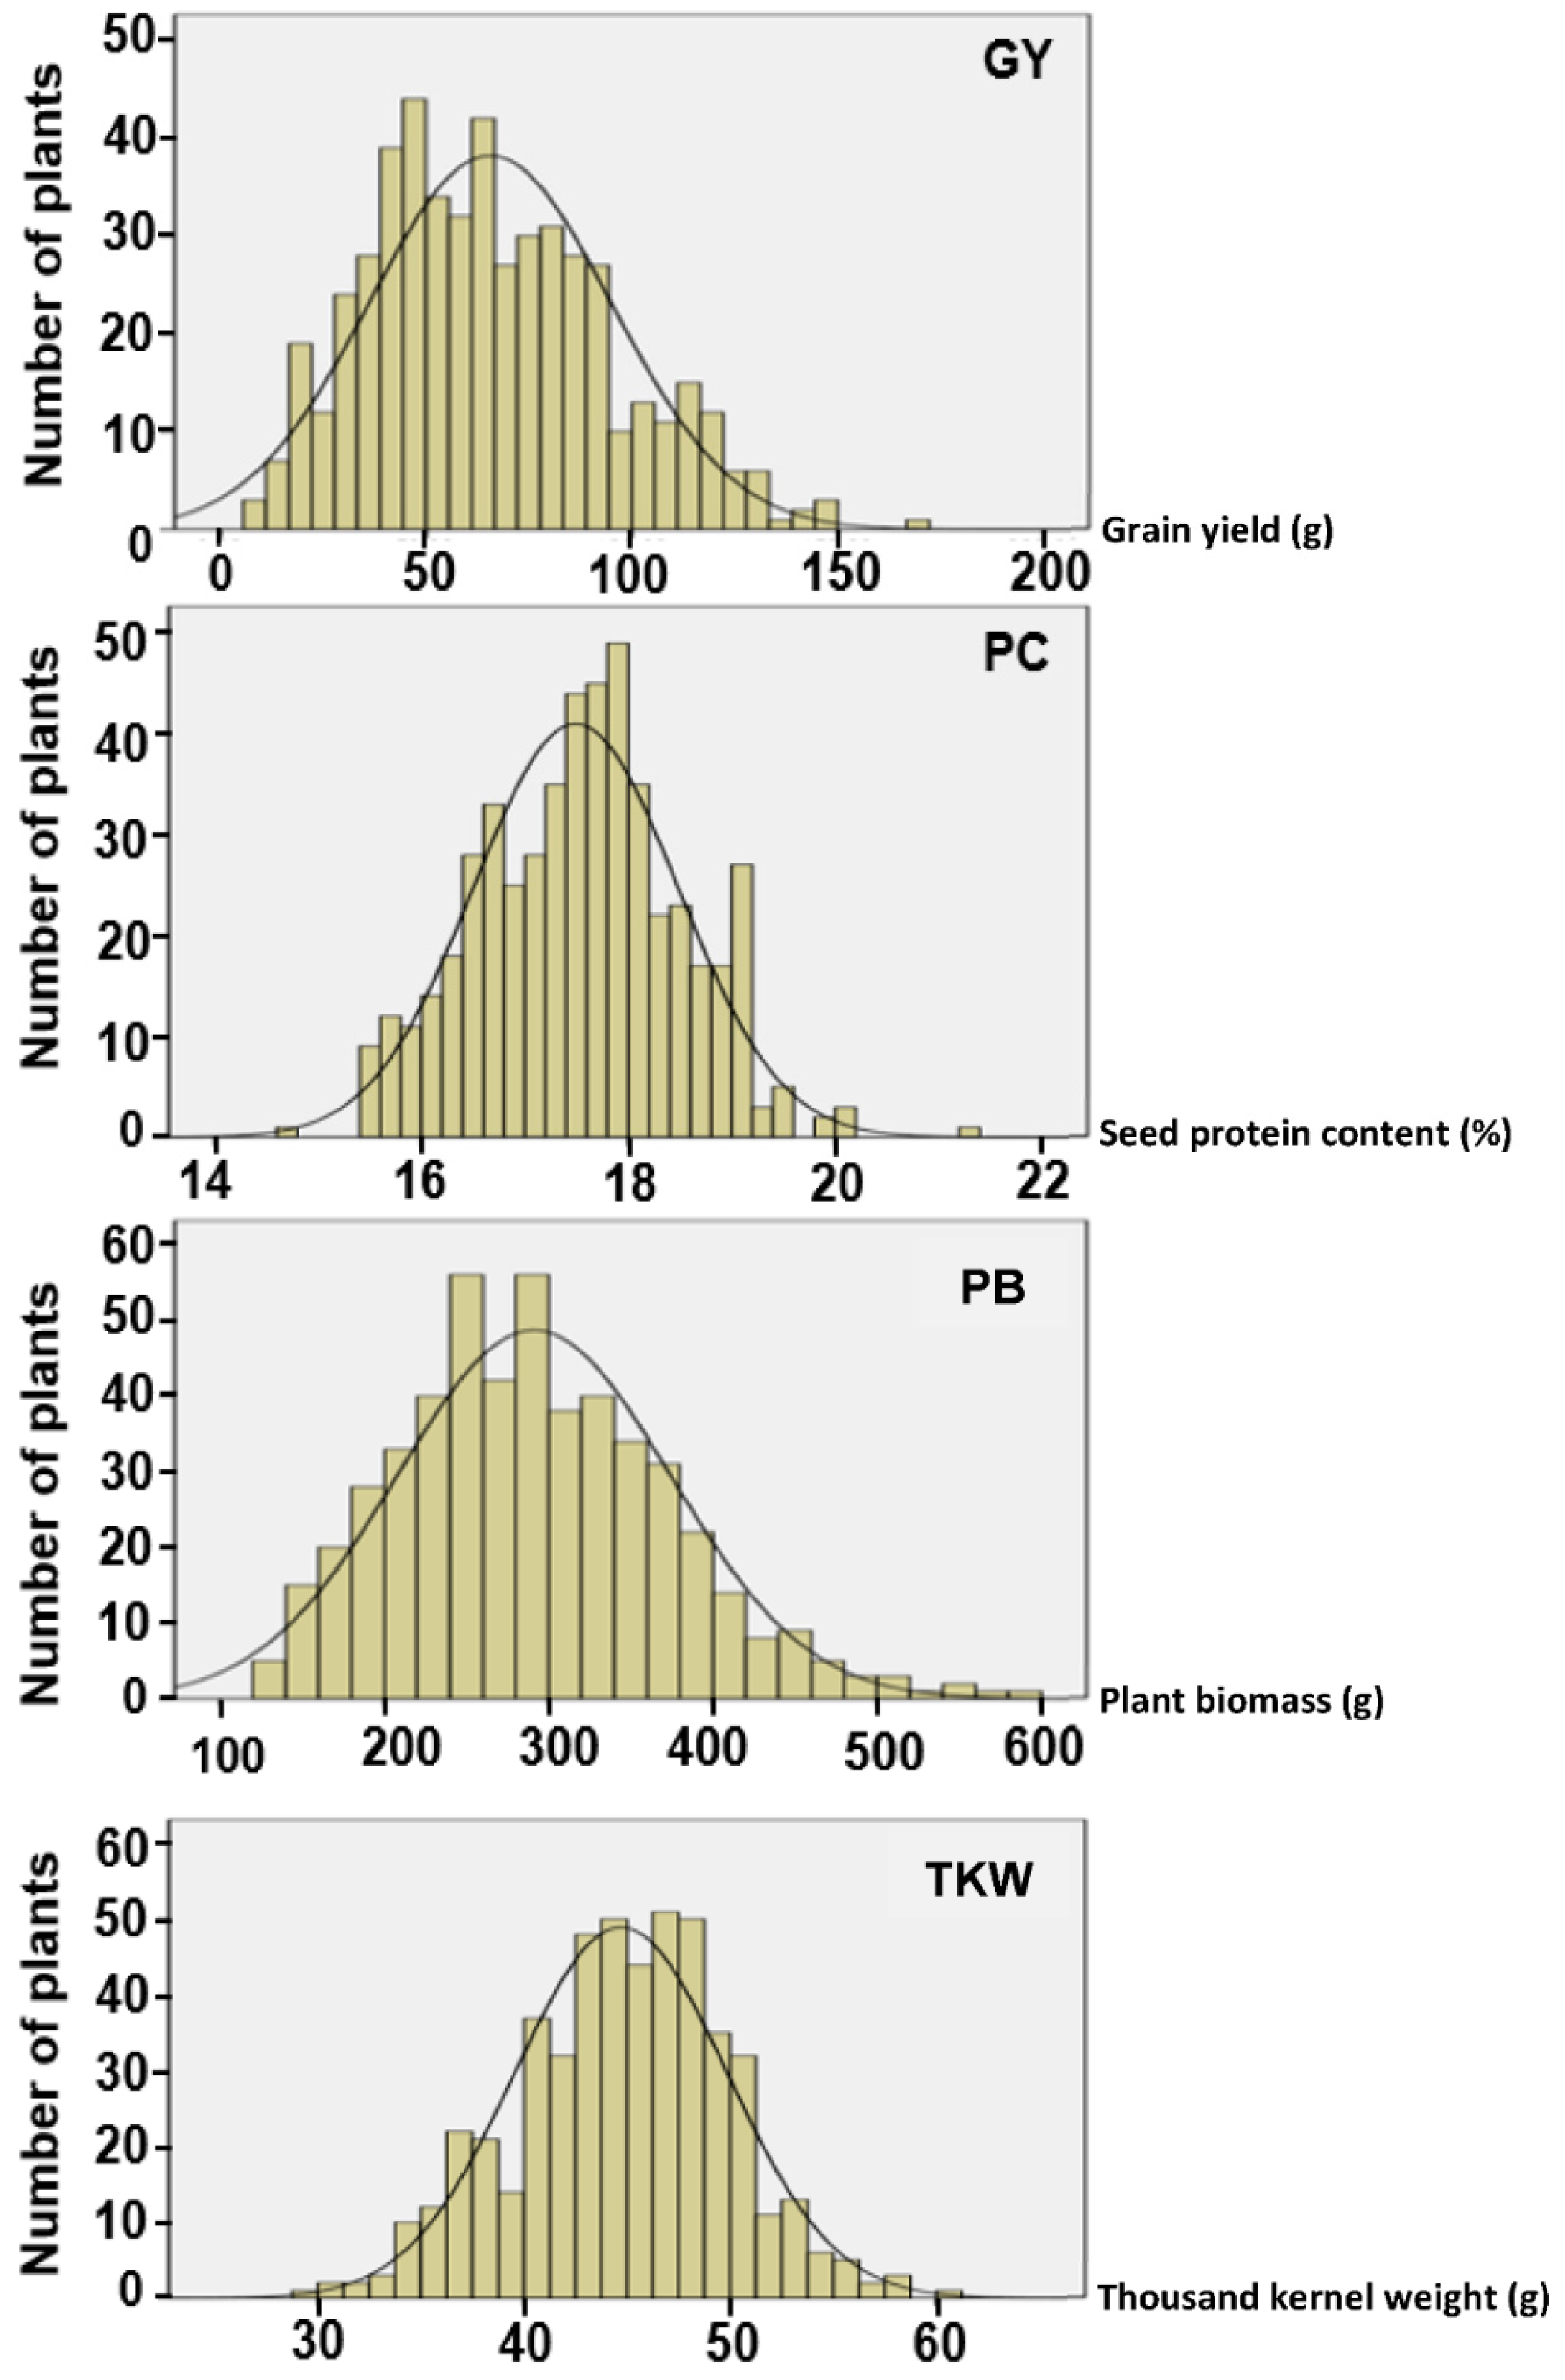
Thus, the main objectives of this study were to assess the phenotypic variations in grain yield (GY) and protein content (PC) within two elite commercial durum wheat cultivars and evaluate the potential of selection for GY and PC, to investigate whether the variations are exploitable and could result in GY and PC upgrades for those cultivars.

2. Materials and Methods

2.1. Source Material and Experimental Treatments

Two commercial elite durum wheat cultivars, cv Svevo and cv Maestrale were chosen as source material. Cv Svevo was registered in 1996. Created by PSB, it is the property of Syngenta (Genealogy: Linea Cimmyt/Zenith) which is exclusively grown under the Barilla contract and is considered suitable for the production of high-quality pasta (https://www.Syngenta.gr/proionta/sporoi/skliro-sitari/svevo, accessed on 1 April 2022). Cv Maestrale was registered in 2004, was also created by PSB, is the property of Syngenta, (Genealogy: Iride/Svevo) and is characterized by high productivity and quality (https://www.syngenta.gr/proionta/sporoi/skliro-sitari/maestrale accessed on 1 April 2022). According to the specifications provided by the property company, cv Svevo is characterized by very high seed protein content and medium to high yield potential; cv Maestrale is reported to have high seed protein content and very high yield potential. These cultivars were chosen due to their characterization as high-quality commercial genotypes in Greece.
Experimentation was carried out on the experimental farm of the Institute of Plant Breeding and Genetic Resources farm, Thessaloniki, Greece, during the 2018–19 and 2019–2020 growing seasons. The soil for the 1st year of experimentation was as follows: (1) cv Svevo experiment: texture (L): sand 34.0%, silt 26.0%, clay 40.0%—pH 7.83 and organic matter content 1.83%.; (2) cv Maestrale experiment: texture (SCL): sand 54.0%, silt 25.0%, clay 24.0%—pH 7.40 and organic matter content 1.51%. The soil for the 2nd year of experimentation: texture (L): sand 34.5%, silt 26.5%, clay 3 + 9.0%—pH 7.80 and organic matter content 1.79%. The same fertilization and weed control were applied in all experiments. More specifically, 64 kg∙ha−1N and 80 kg∙ha−1 P2O5 were applied pre-sowing as phosphate ammonium (N-P-K: 16–20–0), and 103.5 kg∙ha−1N was used in spring application in the middle of March as ammonium nitrate (N-P-K: 34.5-0-0). Weed control was obtained by post-emergent herbicide (mesosulfuron-methyl 4.5% w/w, propoxycarbazone-sodium 6.75% w/w) and hand weeding.

2.2. Intra-Cultivar Selection at Ultra-Low Plant Density (ULD)

In the 1st year of the experimentation (2018–19), two identical experiments were established, one for each cultivar. The experimental layout was a non-replicated (NR-0) honeycomb design [49] with 540 plant positions for cv Svevo, i.e., 15 rows with 36 plants per row, and 525 plant positions, i.e., 15 rows with 35 plants, for cv Maestrale. A distance of 1.0 m plant spacing in a triangle grid (11.547 plants∙ha−1)—very low plant density—was used to avoid unfavorable effects of competition in response to selection and to allow plants to fully express their potential, facilitating the identification of superior ones [12,43]. Each hill was overplanted with hand jobbers and later thinned to one seedling per hill. At the maturity stage, 510 individual plants of cv Svevo and 507 individual plants of cv Maestrale were hand-harvested and threshed with an experimental harvest machine. The following characteristics were recorded for each plant: plant biomass in grams (PB), GY in grams, thousand kernel weight in grams (TKW) and PC obtained with an Infratec™ 1241 whole Grain Analyzer (FOSS, Hillerød, Denmark) fitted with a sample transport module for the analysis of small grain samples suitable for plant breeding purposes.
In the case where cv Svevo was the source material, the moving-circle selection [49] was used for the selection of seven high-grain yielding (HGY) plants and the three medium-grain yielding (MGY) plants, giving seven HGY and three MGY families. To create each of the two low-grain yielding (LGY) families for cv Svevo, the seeds of four low-grain yielding plants were combined to give enough seeds for progeny evaluation. A similar selection procedure was described by Tokatlidis et al. [39] and Ben Ghanem et al. [50]. Similarly, in the case where cv Maestrale was the source material, the moving-circle selection [49] was used for the selection of eight high-grain yielding (HGY) plants and the two medium-grain yielding (MGY) plants, giving eight HGY and two MGY families. To create each of the two low-grain yielding (LGY) families for cv Maestrale, the seeds of four low-grain yielding plants were combined to give enough seeds for progeny evaluation.

2.3. Progeny Evaluation under Typical Crop Density (TCD)

In the 2nd year of experimentation (2019–2020), two identical experiments were established, one for the twelve progeny families selected from the 1st year honeycomb experimentation of cv Svevo and one for the twelve selected lines of cv Maestrale. The commercial cultivars were included as controls. The experimental layout was a randomized complete block (RCB). There were three replicates for each selected line. The size of the plot was 2.0 m2 (i.e., 6 rows 1.34 m in length and 0.25 m distance between them) and the plant density was 5,000,000 plant∙ha−1. Yield per ha and protein content were recorded.

2.4. Statistical Analysis

Analysis of variance (ANOVA) was conducted for the randomized complete block design. The significance level of all hypotheses tested was pre-set at p < 0.05 using the Duncan test (p < 0.05). Pearson correlation coefficients were also calculated for all traits. All statistical analyses were performed using the SPSS software package (version 18. SPSS Inc., Chicago, IL, USA).

3. Results

3.1. Intra-Cultivar Selection at Ultra-Low Plant Density (ULD)

Important variation was found among the individual plants of both cultivars for all the recorded characteristics, i.e., for GY, PC, PB and TKW (Table 1, Figure 1). More specifically, the mean GY of cv Svevo plants was 78.93 g∙plant−1, and the range was 169.70 g∙plant−1, almost double the value of the mean (Table 1, Figure 1). Similarly, the mean PB was 324.03 g∙plant−1, and the range was a little more than the double value of the mean. However, the mean for PC was 19.15%, and the minimum and maximum values were 16.50% and 22.40%, respectively. The mean of TKW was 45.49 g; the range was 30.80. The coefficient of variation (CV) values for GY and PB were 37.16% and 26.66%, respectively; the CV values for PC and TKW were notably lower. PC and TKW are considered characteristics controlled by significantly fewer genetic loci than GY and PB [51].
The findings for individual cv Maestrale plants were similar. The mean GY was 65.56 g∙plant−1 and the range was 162.26 g∙plant−1, i.e., almost 2.5 times the value of the mean (Table 1, Figure 1). Accordingly, the mean PB was 290.99 g∙plant−1 and the range was 470.00. However, the mean for PC was 17.49, and the minimum and maximum values were 14.70 and 21.20, respectively. For TKW the mean was 44.70 g and the range was 31.15. The CV values were 44.83% and 28.57% for GY and PB, respectively, which are quantitative characteristics. The CV values were notably lower for PC and TKW, which are characteristics controlled by significantly fewer gene loci compared to GY and PB [51] (Table 1, Figure 2).
An important positive correlation was found between GY and PΒ for both experiments (r = 0.764 **, r = 0.767 **, respectively). Values of coefficient of correlation were lower than 0.5 for all the other combinations of recorded characteristics (Table 2 and Table 3).
Moreover, in both experiments, the selected single plants combined high, medium or low GY and high, medium or low-grain PC (Table 4 and Table 5). More, specifically, from cv Svevo plants we selected: two high-yielding plants with high PC (HGY_HPC), four high-yielding plants with moderate PC (HGY_MPC), one high-yielding plant with low PC (HGY_LPC), two moderate-yielding plants with high PC (MGY_HPC), one moderate-yielding plant with low PC (MGY_LPC), one line which came from the mixture of four low-yielding plants with high PC (LGY_HPC 1) in order to have enough seed for experimentation and one line which came from the mixture of four low-yielding plants with low PC (LGY_LPC 1) (also in order to have enough seed for experimentation) (Table 4). In the case of cv Maestrale, the selected plants consisted of five high-yielding plants with moderate PC (HGY_MPC 1 to 5), three high-yielding plants with low PC (HGY_MPC 1 to 3), one moderate-yielding plant with high PC (MGY_HPC 1), one moderate-yielding plant with moderate PC (MGY_MPC 1), a mixture of four low-yielding plants (in order to have enough seed for experimentation) with high PC (LGY_HPC 1) and a mixture of four low-yielding plants with low PC (LGY_LPC 1) (in order to have enough seed for experimentation) (Table 5).

3.2. Progeny Evaluation under Typical Crop Density (TCD)

Significant differences were found between the twelve selections/families of cv Svevo for GY (t·ha−1) and PC (%) (Table 6, Figure 3). Mean GY was 2.26 t∙ha−1, and three selections/families (1. HGY_HPC1, 2. HGY_MPC1 and 3. HGY_MPC3) had significantly higher GY than the original cv Svevo by 25% to 33%. Mean PC (%) was 18.53%, and only three (1.HGY_HPC1, 2. HGY_HPC2 and 10. HGY_MPC3) of the twelve selections/families had significantly lower PC (%) than the original cv Svevo by 5% to 8% (Table 6, Figure 3).
Significant differences were found between twelve selections/families of cv Maestrale for GY (t∙ha−1) and PC (%) (Table 7, Figure 4). Mean GY was 4.14 t∙ha−1 and for seven selections/families GY did not differ significantly from the original cultivar. Mean PC (%) was 16.58%, and nine of the twelve selections/families had significantly higher PC (%) than the original cv Maestrale by 9% to 19%, which had the lowest value (Table 7, Figure 4).

3.3. Relationships between GY and PC under ULD and TCD

Regarding the relation between GY and PC of twelve selected plants at ULD (in the 1st year of experimentation) and the GY and PC of twelve families under TCD (in the 2nd year of experimentation), we found: (1) positive correlations between GY under TCD and ULD for cv Svevo experiments (r = 0.649 *) and for cv Maestrale experiments (r = 0.596 *); (2) positive correlations between PC under TCD and ULD for cv Svevo experiments (r = 0.643 *) and for cv Maestrale experiments (but not significant r = 0.554).

4. Discussion

This study developed two distinct sets of durum wheat lines by applying divergent single-plant selection under ultra-low plant density to two elite durum wheat commercial cultivars. The results revealed that selection under ultra-low density is an effective tool to select simultaneously for GY and PC. Both traits are of major importance in durum wheat breeding [52]. However, PC in durum wheat is negatively associated with GY [53,54], so breeding for higher yield can decrease PC [55]. Nevertheless, as Simmonds [
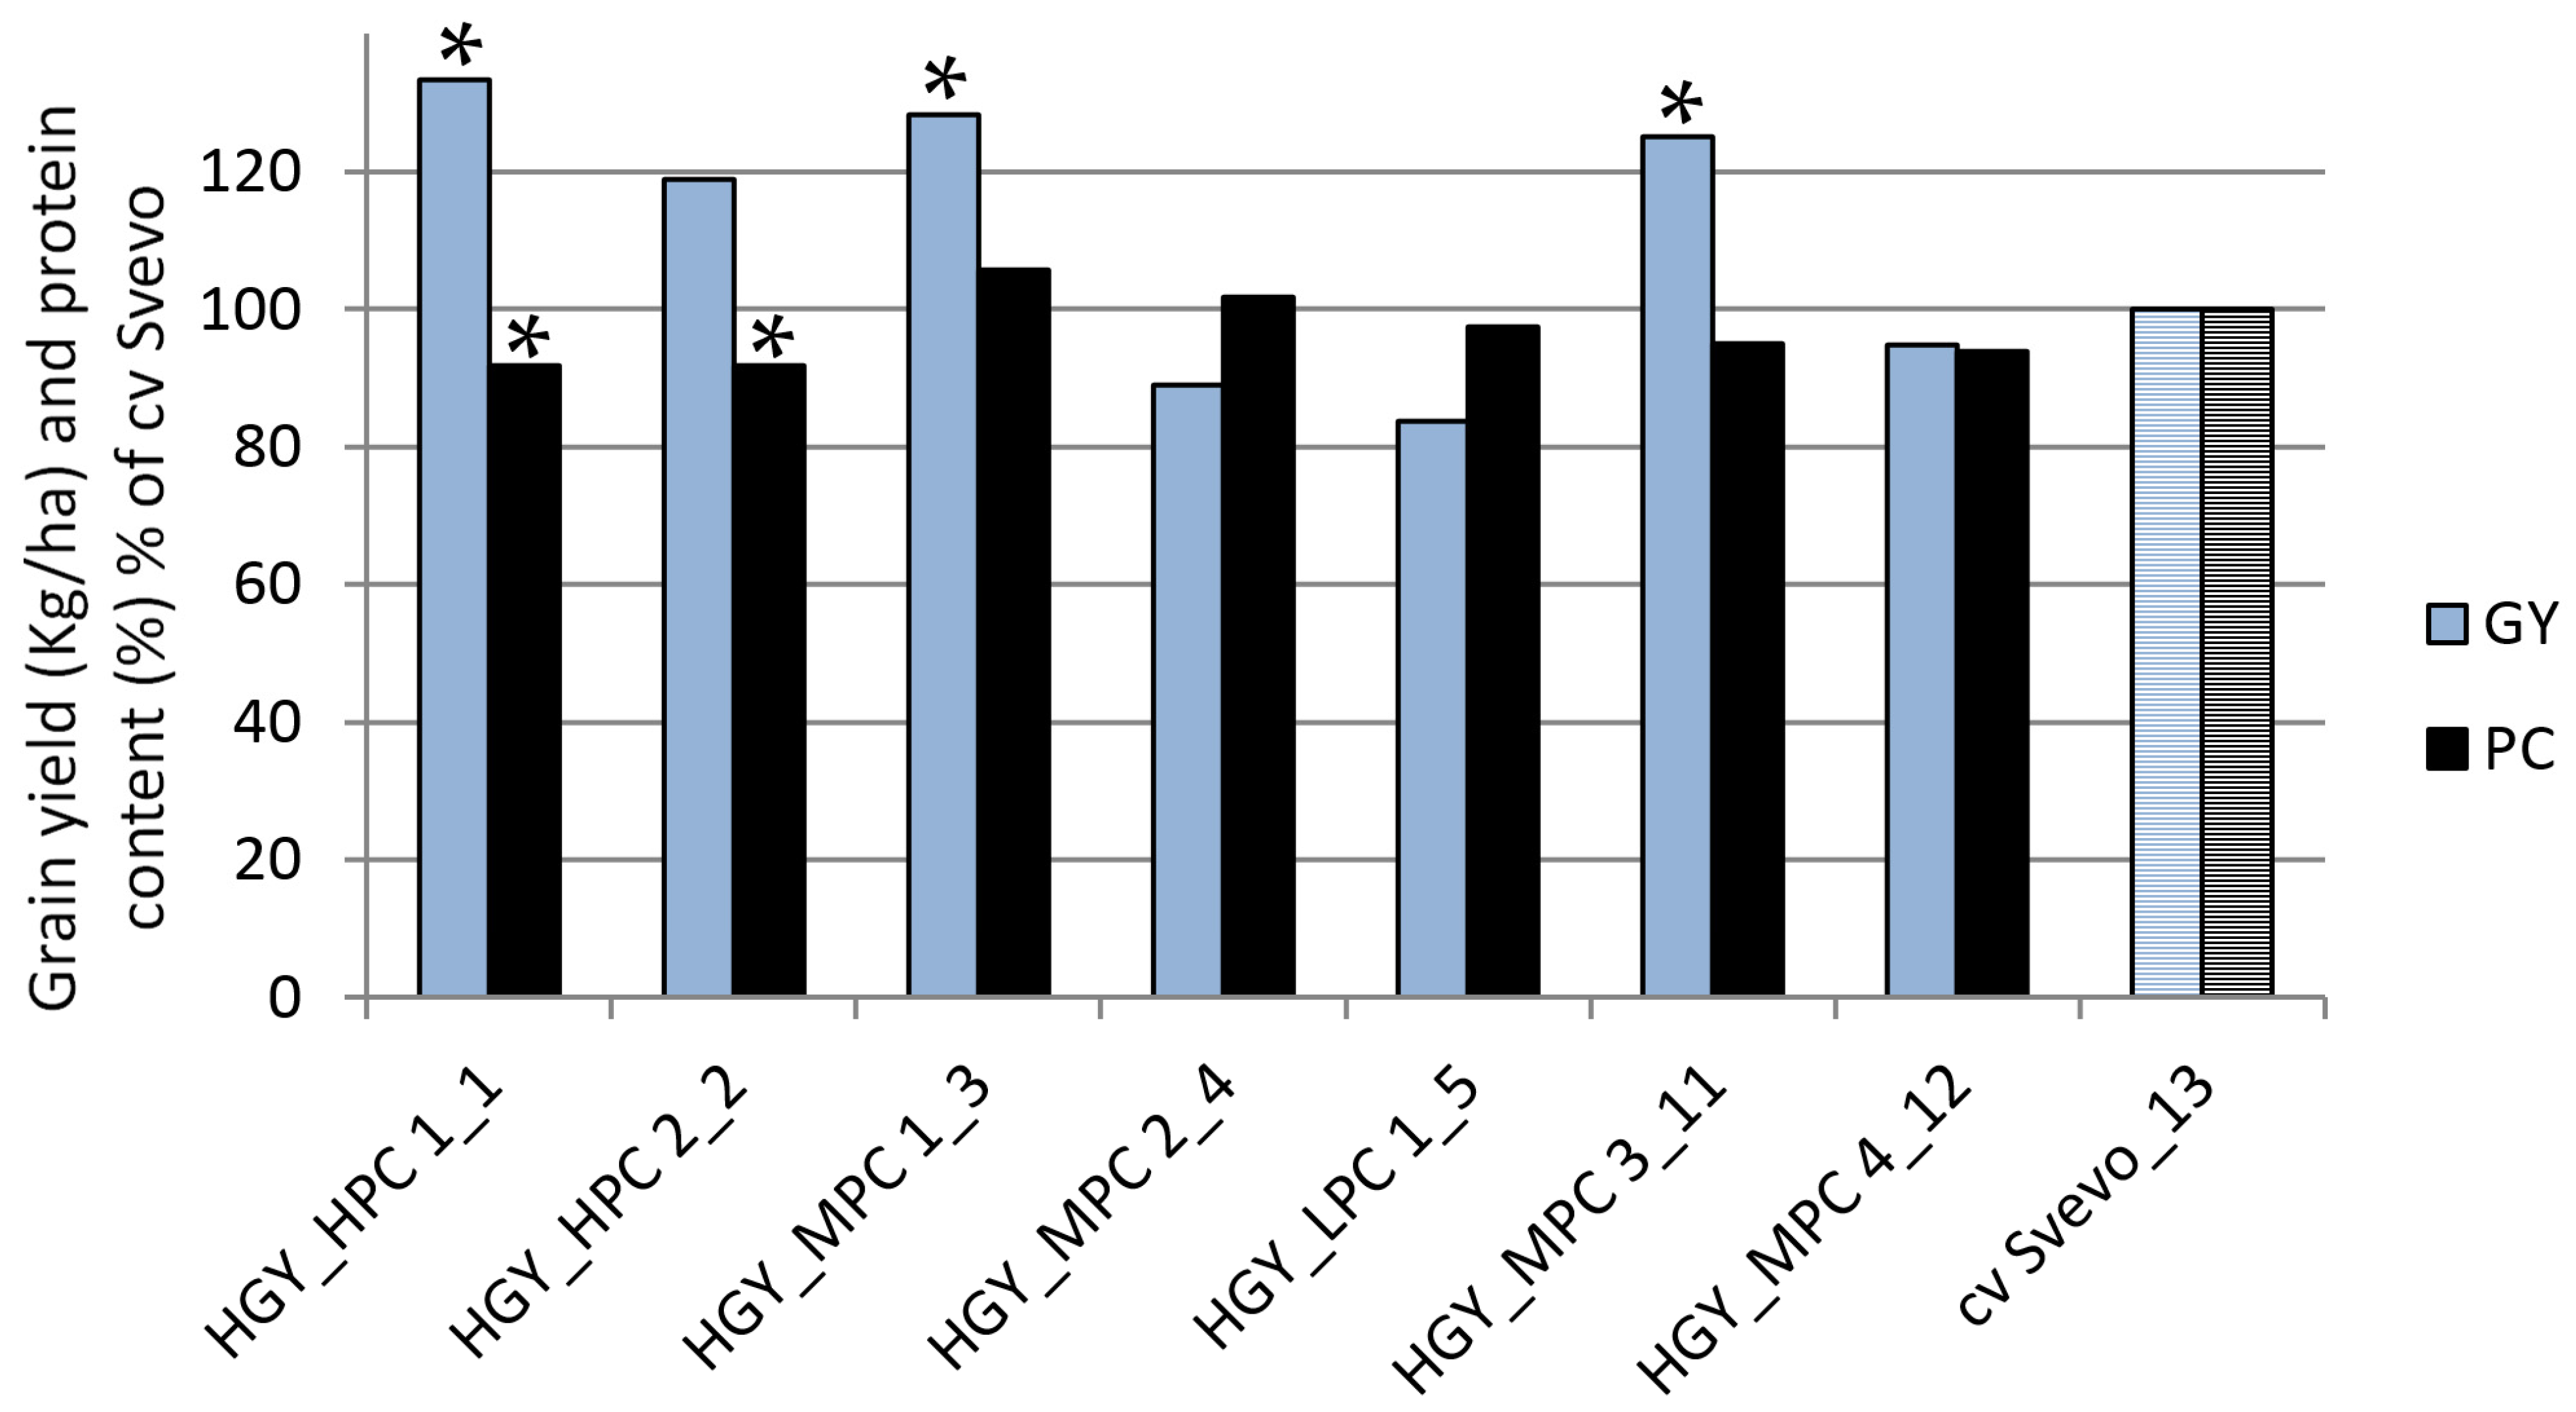
56] highlighted, despite the consensus on a strong negative correlation between GY and PC in cereals, a positive expected relationship also holds by making some compromises between the attainable higher yield and the protein concentration. Indeed, in our case, we identified that three lines derived from cv Svevo significantly surpassed the source material in terms of GY, with one maintaining a high PC concurrently. In addition, another two lines derived from cv Maestrale outperformed the source material in GY, even though the difference did not reach significant levels. Still, these lines had significantly higher PC than the original genotype at the same time, implying that intra-cultivar selection under ultra-low density was effective at upgrading at least one target trait.
Numerous studies have been conducted on the simultaneous selection of PC and GY in wheat, employing index selection [57,58,59,60], tailored with genome-wide association mapping and prediction models [52,61], providing evidence of efficient concurrent selection, even though results sometimes can be genotype or environment dependent. However, all these studies have been processed with very diverse sets of germplasm. In our study, though, we evaluated and distinguished for yield and PC among lines of very narrow genetic diversity, since these lines were derived through intra-cultivar selection. While breeders commonly believe that intra-cultivar selection within a fairly homogeneous germplasm cannot lead to high amounts of genetic gain due to limitations of the genetic variance component, new debates have come to light in this regard. Selection within the bread wheat cultivar Nestos for two generations at 1.2 plants∙m2 confirmed an improvement in GY of up to 22% per unit area under typical farmers’ stands [39]. In barley, two years of selection under ultra-low density within the cultivar Athenaida resulted in lines that showed average yield increases of up to 2.5 times over the original genotype when tested under typical farm densities in two locations [41]. Similar results on the efficiency of intra-cultivar selection have also been obtained in other predominately self-pollinated crops, other than cereals. Tokatlidis et al. [17] selected three cotton commercial cultivars for two years at the density of 1.15 plants∙m−2, and succeeded in identifying lines that, when tested under typical crop density, there were up to 12% higher cotton seed yield on average across the sites and years compared to the original cultivars. Furthermore, in terms of quality traits, selecting for protein and oil content within three soybean cultivars using a density of 1.4 plants∙m−2, Fasoula and Boerma [15] reported considerable variation for these two traits within each of the three cultivars. Our results confirm the above studies not only for the higher GY achieved when we selected within two elite durum wheat cultivars, but at the same time for the simultaneous upgrading of the PC, which in the case of the one cultivar (cv Maestrale) reached significant levels in comparison to the original genotype.
Evidence from molecular markers studies elucidate further the concept of exploitable intra-cultivar variation within homogeneous germplasm and further enhance our results. Using RFLP and microsatellite markers, Olufowote et al. [19] detected significant variation within rice landraces and cultivars that were assumed to be pure lines. In barley, Ben Ghanem et al. [50] detected variation within landraces and elite commercial varieties for the RYd2 and RYd3 alleles that allow resistance to barley yellow dwarf virus (BYDV). The intrinsic amount of genetic variation detected within homogeneous gene pools can be attributed either to latent genetic diversity or to mechanisms that can generate de novo variation. Hence, residual heterozygosity, due to differential segregation of polymorphic chromosomal regions in the breeding process’s successive generations, has been concluded to be one source of structural intra-cultivar genetic variation in soybean [37]. On the other hand, additional heterogeneity might stem from de novo generated variation, as a result of spontaneous mutations [62,63] or via genetic and epigenetic mechanisms, such as intragenic recombination, unequal crossing over, gene duplications or deletions, DNA methylation, excision or insertion of transposable elements, chromatin alterations and others [32,64,65,66].
Detecting exploitable intra-cultivar variation, though, is a challenging procedure. Potential response to selection relies on the ability to distinguish outstanding genotypes within a narrow gene pool [12]. Thus, all the above studies that recorded significant progress by applying intra-cultivar variation have been conducted via selection under ultra-low density, in conditions that practically eliminate plant to plant interference and simulate a nil-competition regime. Notwithstanding, the argument that usually pertains among breeders is that selection should be applied under a dense stand regime similar to farming conditions [46,67]. At the same time, though, the consensus among breeders is that the optimum environment for selection is the one that maximizes genetic variation and hence responds to selection [68,69]. However, the ultra-low planting density regime will ensure the conditions of nil-competition among plants and allow for maximum phenotypic expression of their genetic differences, ultimately facilitating the selection of desirable genotypes [12,70]. Moreover, Tokatlidis [46] raised another issue as a counterargument to the claim of a lack of connection between plants spaced apart for selection purposes and those densely grown by questioning whether segregating generations can simulate farming conditions. He highlighted that solid seeded conditions and nil-competition may not correlate when heterogeneous populations are evaluated due to strong competitor genotypes and the inverse association between yielding and competitive ability [46]. Several studies on different crops, such as rye [71], vetch [72] and wheat [73], have well demonstrated this negative relationship between yielding and competitive ability. Nevertheless, as Tokatlidis [46] mentioned, solid seeded and nil-competition do correlate well in the case of genetically homogeneous lines, something that also agrees with the findings of our study, since we found high positive correlation coefficients for GY between ultra-low density and typical crop density for both cultivars.
Overall, the development of durum wheat varieties that combine high GY and high PC is one of the significant challenges of modern plant breeding, since these are the two most critical factors determining the crop’s economic value. Thus, exploiting intra-cultivar variation through simultaneous selection for GY and PC under ultra-low density conditions seems an efficient tool to surpass the negative association between these two traits and to develop elite material characterized by high GY, stability of performance and upgraded quality traits, meeting the future demands of the market.

5. Conclusions

The results herein provide evidence of exploitable variation within improved commercial durum wheat cultivars. The single-plant selections at ultra-low density within two elite durum wheat commercial cultivars resulted in: (1) improved GY lines that maintained the PC, in the case of cv Svevo, and (2) improved PC lines that maintained GY, in the case of cv Maestrale. Ultra-low density allowed for efficient simultaneous selection for GY and PC within narrow gene pools by maximizing phenotypic expression and differentiation among individual plants, erasing at the same time the confounding effect of competition. The results can give further insights for addressing the negative association between GY and PC in durum wheat, and in other crops, towards the development of high-yielding cultivars that maintain high-grain quality traits.

Author Contributions

Conceptualization, E.N.; methodology, E.N., I.M., A.T., I.S. and F.P.; validation, I.M.; investigation, E.N., I.M., I.K., S.M., A.T. and F.P.; data curation, E.N., I.M., I.K., S.M., I.S. and I.A.; writing—original draft preparation, E.N., I.M., I.K., S.M., A.T., I.S., I.A., E.K. and F.P.; writing—review and editing, E.N., I.M., I.A. and F.P.; supervision, E.N., I.M. and F.P.; project administration, E.N., I.M., I.A., E.K. and F.P. All authors have read and agreed to the published version of the manuscript.

Funding

This research was funded by the Research Committee of the University of Western Macedonia, Greece (project code 70312).

Conflicts of Interest

The authors declare no conflict of interest.

References

  1. Xynias, I.; Mylonas, I.; Koriintrpetis, E.; Ninou, E.; Tsaballa, A.; Avdikos, I.; Mavromatis, A. Durum Wheat Breeding in the Mediterranean Region: Current Status and Future Prospects. Agronomy 2020, 10, 432. [Google Scholar] [CrossRef] [Green Version]
  2. European Commission. Short Term Outlook for EU Agricultural Markets in 2021. Available online: https://ec.europa.eu/info/sites/info/files/food-farming-fisheries/farming/documentsshort-term-outlook-spring-2021_en (accessed on 21 April 2021).
  3. Aberkane, H.; Belkadi, B.; Kehel, Z.; Filali-Maltouf, A.; Tahir, I.S.A.; Meheesi, S.; Amri, A. Assessment of Drought and Heat Tolerance of Durum Wheat Lines Derived from Interspecific Crosses Using Physiological Parameters and Stress Indices. Agronomy 2021, 11, 695. [Google Scholar] [CrossRef]
  4. Lopez-Castaneda, C.; Richards, R. Variation in temperate cereals in rain-fed environments 2. Phasic Dev. Growth. Field Crops Res. 1994, 37, 75. [Google Scholar] [CrossRef]
  5. Ayed, S.; Othmani, A.; Bouhaouel, I.; Teixeira da Silva, J.A. Multi-Environment Screening of Durum Wheat Genotypes for Drought Tolerance in Changing Climatic Events. Agronomy 2021, 11, 875. [Google Scholar] [CrossRef]
  6. Naseri, B.; Sasani, S. Cultivar, planting date and weather linked to wheat leaf rust development. Cereal Res. Commun. 2020, 48, 203–210. [Google Scholar] [CrossRef]
  7. Naseri, B.; Sabeti, P. Analysis of the effects of climate, host resistance, maturity and sowing date on wheat stem rust epidemics. J. Plant Pathol. 2021, 103, 197–205. [Google Scholar] [CrossRef]
  8. Aberkane, H.; Amri, A.; Belkadi, B.; Filali-Maltouf, A.; Valkoun, J.; Kehel, Z. Contribution of Wild Relatives to Durum Wheat (Triticum turgidum subsp. durum) Yield Stability across Contrasted Environments. Agronomy 2021, 11, 1992. [Google Scholar] [CrossRef]
  9. Aberkane, H.; Amri, A.; Belkadi, B.; Filali-Maltouf, A.; Kehel, Z.; Tahir, I.S.A.; Meheesi, S.; Tsivelikas, A. Evaluation of durum wheat lines derived from interspecific crosses under drought and heat stress. Crop Sci. 2021, 61, 119–136. [Google Scholar] [CrossRef]
  10. Haddad, L.; Bouzerzour, H.; Benmahammed, A.; Zerargui, H.; Hannachi, A.; Bachir, A.; Salmi, M.; Oulmi, A.; Fellahi, Z.A.; Nouar, H.; et al. Analysis of genotype × environment interaction for grain yield in early and late sowing date on durum wheat (Triticum durum Desf.) genotypes. Jordan J. Biol. Sci. 2016, 9, 139–146. [Google Scholar]
  11. Ayed, S.; Bouhaouel, I.; Othmani, A.; Bassi, F.M. Use of Wild Relatives in Durum Wheat (Triticum turgidum L. var. durum Desf.) Breeding Program: Adaptation and Stability in Context of Contrasting Environments in Tunisia. Agronomy 2021, 11, 1782. [Google Scholar] [CrossRef]
  12. Tokatlidis, I.S. Conservation breeding of elite cultivars. Crop Sci. 2015, 55, 2417–2434. [Google Scholar] [CrossRef]
  13. Dudley, J.W.; Lampert, R.J. Ninety generations if selection for oil and protein in maize. Maydica 1992, 37, 81–87. [Google Scholar]
  14. Tokatlidis, I.S. Variation within maize lines and hybrids in the absence of competition and relation between hybrid potential yield per plant with line traits. J. Agric. Sci. 2000, 134, 391–398. [Google Scholar] [CrossRef]
  15. Fasoula, V.A.; Boerma, H.R. Divergent selection at ultra-low plant density for seed protein and oil content within soybean cultivars. Field Crops Res. 2005, 91, 217–229. [Google Scholar] [CrossRef]
  16. Tokatlidis, I.S.; Tsialtas, J.T.; Xynias, I.N.; Tamoutsidis, E.; Irakli, M. Variation within a bread wheat cultivar for grain yield, protein content, carbon isotope discrimination and ash content. Field Crops Res. 2004, 86, 33–42. [Google Scholar] [CrossRef]
  17. Tokatlidis, I.S.; Tsikrikoni, C.; Tsialtas, J.T.; Lithourgidis, A.S.; Bebeli, P.J. Variability within cotton cultivars for yield, fibre quality and physiological traits. J. Agric. Sci. 2008, 146, 483–490. [Google Scholar] [CrossRef]
  18. Traka-Mavrona, E.; Georgakis, D.; Koutsika-Sotiriou, M.; Pritsa, T. An integrated approach of breeding and maintaining an elite cultivar of snap bean. Agron. J. 2000, 92, 1020–1026. [Google Scholar] [CrossRef]
  19. Olufowote, J.O.; Xu, Y.; Chen, X.; Park, W.D.; Beachell, H.M.; Dilday, R.H.; Goto, M.; McCouch, S.R. Comparative evaluation of within-cultivar variation of rice (Oryza sativa L.) using microsatellite and RFLP markers. Genome 1997, 40, 370–378. [Google Scholar] [CrossRef]
  20. Koutsika-Sotiriou, M.; Mylonas, I.G.; Ninou, E.; Traka-Mavrona, E. The cultivation revival of a landrace: Pedigree and analytical breeding. Euphytica 2010, 176, 15–24. [Google Scholar] [CrossRef]
  21. Kargiotidou, A.; Chatzivassiliou, E.; Tzantarmas, C.; Sinapidou, E.; Papageorgiou, A.; Skaracis, G.N.; Tokatlidis, I.S. Selection at ultra-low density identifies plants escaping virus infection and leads towards high-performing lentil (Lens culinaris L.) varieties. J. Agric. Sci. 2014, 152, 749–758. [Google Scholar] [CrossRef]
  22. Koutsika-Sotiriou, M.; Mylonas, I.; Tsivelikas, A.; Traka-Mavrona, E. Compensation studies on the tomato landrace “Tomataki Santorinis”. Sci. Hortic. 2016, 198, 78–85. [Google Scholar] [CrossRef]
  23. Vlachostergios, D.N.; Tzantarmas, C.; Kargiotidou, A.; Ninou, E.; Pankou, C.; Gaintatzi, C.; Mylonas, I.; Papadopoulos, I.; Foti, C.; Chatzivassiliou, E.K.; et al. Single-plant selection within lentil landraces at ultra-low density: A short-time tool to breed high yielding and stable varieties across divergent environments. Euphytica 2018, 214, 58. [Google Scholar] [CrossRef]
  24. Ninou, E.; Papathanasiou, F.; Vlachostergios, D.N.; Mylonas, I.; Kargiotidou, A.; Pankou, C.; Papadopoulos, I.; Sinapidou, E.; Tokatlidis, I. Intense breeding within lentil landraces for high-yielding pure lines sustained the seed quality characteristics. Agriculture 2019, 9, 175. [Google Scholar] [CrossRef] [Green Version]
  25. Yates, J.L.; Boerma, R.H.; Fasoula, V. SSR-marker analysis of the intracultivar phenotypic variation discovered within 3 soybean cultivars. J. Hered. 2012, 103, 570–578. [Google Scholar] [CrossRef] [Green Version]
  26. Nie, G.; Huang, T.; Ma, X.; Huang, L.; Peng, Y.; Yan, Y.; Li, Z.; Wang, X.; Zhang, X. Genetic variability evaluation and cultivar identification of tetraploid annual ryegrass using SSR markers. Peer J. 2019, 7, e7742. [Google Scholar] [CrossRef] [Green Version]
  27. Espinosa, K.; Boelter, J.; Lolle, S.; Hopkins, M.; Goggi, S.; Palmer, R.G.; Sandhu, D. Evaluation of spontaneous generation of allelic variation in soybean in response to sexual hybridization and stress. Can. J. Plant Sci. 2015, 95, 405–415. [Google Scholar] [CrossRef] [Green Version]
  28. Russell, W.A.; Sprague, G.F.; Penny, L.H. Mutations affecting quantitative characters in long-time inbred lines of maize. Crop Sci. 1963, 3, 175–178. [Google Scholar] [CrossRef]
  29. Mc Clintock, B. The significance of the responses of the genome to challenge. Science 1984, 226, 792–801. [Google Scholar] [CrossRef] [Green Version]
  30. Walbot, V.; Cullis, C.A. Rapid genomic change in higher plants. Annu. Rev. Plant Physiol. 1985, 36, 367–396. [Google Scholar] [CrossRef]
  31. Cullis, C.A. DNA rearrangements in response to environmental stress. Adv. Genet. 1990, 28, 73–97. [Google Scholar]
  32. Rasmusson, D.C.; Phillips, R.L. Plant breeding progress and genetic diversity from de novo variation and elevated epistasis. Crop Sci. 1997, 37, 303–310. [Google Scholar] [CrossRef]
  33. Lolle, S.; Victor, J.L.; Young, J.M.; Pruitt, R.E. Genomewide non-mendelian inheritance of etra-genomic information in Arabidopsis. Nature 2005, 434, 505–509. [Google Scholar] [CrossRef] [PubMed]
  34. Springer, N.M.; Stupar, R.M. Allelic variation and heterosis in maize: How do two halves make more than a whole? Genome Res. 2007, 17, 264–275. [Google Scholar] [CrossRef] [PubMed] [Green Version]
  35. Laverack, G.K. Management of breeders seed production. Seed Sci. Technol. 1994, 22, 551–563. [Google Scholar]
  36. Kimmich, F. Erhaltungszüchtung muss auf dem Verkaufsgebiet des Samens basieren. (Maintenance breeding must be based in the region where seeds are sold). TASPO Gartenbau Magazin 1996, 11, 18–20. [Google Scholar]
  37. Haun, W.J.; Hyten, D.L.; Xu, W.W.; Gerhardt, D.J.; Albert, T.J.; Richmond, T.; Jeddeloh, J.A.; Jia, G.; Springer, N.M.; Vance, C.P.; et al. The composition and origins of genomic variation among individuals of the soybean reference cultivar Williams 82. Plant Physiol. 2011, 155, 645–655. [Google Scholar] [CrossRef] [PubMed] [Green Version]
  38. Fasoula, V.A.; Tokatlidis, I.S. Development of crop cultivars by honeycomb breeding. Agron. Sustain. Dev. 2012, 32, 161–180. [Google Scholar] [CrossRef] [Green Version]
  39. Tokatlidis, I.S.; Xynias, I.N.; Tsialtas, J.T.; Papadopoulos, I.I. Single-plant selection at ultra low density to improve stability of a bread wheat cultivar. Crop Sci. 2006, 46, 90–97. [Google Scholar] [CrossRef]
  40. Tokatlidis, I.; Tsikrikoni, C.; Lithourgidis, A.; Tsialtas, J.; Tzantarmas, C. Intra-cultivar variation in cotton: Response to single-plant yield selection. J. Agric. Sci. 2011, 149, 197–204. [Google Scholar] [CrossRef]
  41. Fasoula, D.A. Correlations between auto-, allo- and nill competition and their implications in plant breeding. Euphytica 1990, 50, 57–62. [Google Scholar] [CrossRef]
  42. Fasoula, D.A. An overlooked cause of seed degradation and its implications in the efficient exploitation of plant genetic resources. Plant Genet. Resour. 2011, 9, 321–323. [Google Scholar] [CrossRef]
  43. Fasoula, D.A.; Fasoula, V.A. Competitive ability and plant breeding. Plant Breed. Rev. 1997, 14, 89–138. [Google Scholar]
  44. Fasoulas, A.C. Building up resistance to Verticillium wilt in cotton through honeycomb breeding. In New Frontiers in Cotton Research, Proceedings of the 2nd World Cotton Research Conference, Athens, Greece, 6–12 September 1998; Gillham, F.M., Ed.; WCRC: Athens, Greece, 2000; pp. 120–124. [Google Scholar]
  45. Fasoula, V.A.; Boerma, H.R. Intra-cultivar variation for seed weight and agronomic traits. Crop Sci. 2007, 47, 367–373. [Google Scholar] [CrossRef]
  46. Tokatlidis, I.S. Crop adaptation to density to optimise grain yield: Breeding implications. Euphytica 2017, 213, 92. [Google Scholar] [CrossRef]
  47. Font, R.; Celestino, M.; Bailon, A. The use of near-infrared spectroscopy (NIRS) in the study of seed quality components in plant breeding programs. Ind. Crops Prod. 2006, 24, 307–313. [Google Scholar] [CrossRef]
  48. Magwaza, L.S.; Messo Naidoo, S.I.; Laurie, S.M.; Laing, M.D.; Shimelis, H. Development of NIRS models for rapid quantification of protein content in sweet potato [Ipomoea batatas (L.) LAM.]. LWT Food Sci. Technol. 2016, 72, 63–70. [Google Scholar] [CrossRef]
  49. Fasoulas, A.C.; Fasoula, V.A. Honeycomb selection designs. Plant Breed. Rev. 1995, 13, 87–139. [Google Scholar]
  50. Ben Ghanem, H.; Najar, A.; Udupa, S.; Kumari, S.G.; Amri, A.; Rezgui, S.; El Felah, M.; Tsivelikas, A.L. Exploiting intra-cultivar variation to select for Barley yellow dwarf virus-PAV (BYDV-PAV) resistance in barley. Can. J. Plant Sci. 2018, 98, 930–946. [Google Scholar] [CrossRef] [Green Version]
  51. Hockett, E.A.H.; Nilan, R.A. Genetics. In Barley; Rasmusson, D.C., Ed.; Agronomy Monograph No. 26; ASA-CSSA-SSSA: Madison, WI, USA, 1985; pp. 187–230. [Google Scholar]
  52. Rapp, M.; Lein, V.; Lacoudre, F.; Lafferty, J.; Müller, E.; Vida, G.; Bozhanova, V.; Ibraliu, A.; Thorwarth, P.; Piepho, H.P.; et al. Simultaneous improvement of grain yield and protein content in durum wheat by different phenotypic indices and genomic selection. Theor. Appl. Genet. 2018, 131, 1315–1329. [Google Scholar] [CrossRef]
  53. Blanco, A.; Simeone, R.; Gadaleta, A. Detection of QTLs for grain protein content in durum wheat. Theor. Appl. Genet. 2006, 112, 1195–1204. [Google Scholar] [CrossRef]
  54. Würschum, T.; Leiser, W.L.; Kazman, E.; Longin, C.F.H. Genetic control of protein content and sedimentation volume in European winter wheat cultivars. Theor. Appl. Genet. 2016, 129, 1685–1696. [Google Scholar] [CrossRef] [PubMed]
  55. Acreche, M.M.; Slafer, G.A. Variation of grain nitrogen content in relation with grain yield in old and modern Spanish wheats grown under a wide range of agronomic conditions in a Mediterranean region. J. Agric. Sci. 2009, 147, 657–667. [Google Scholar] [CrossRef] [Green Version]
  56. Simmonds, N. Yields of Cereal Grain and Protein. Exp. Agric. 1996, 32, 351–356. [Google Scholar] [CrossRef]
  57. Koekemoer, F.P.; Labuschagne, M.T.; Van Deventer, C.S. A selection strategy for combining high grain yield and high protein content in South African wheat cultivars. Cereal Res. Commun. 1999, 27, 107–114. [Google Scholar] [CrossRef]
  58. Monaghan, J.M.; Snape, J.W.; Chojecki, J.S.; Kettlewell, P.S. The use of grain protein deviation for identifying wheat cultivars with high grain protein concentration and yield. Euphytica 2001, 122, 309–317. [Google Scholar] [CrossRef]
  59. Oury, F.X.; Godin, C. Yield and grain protein concentration in bread wheat: How to use the negative relationship between the two characters to identify favourable genotypes. Euphytica 2007, 157, 45–57. [Google Scholar] [CrossRef]
  60. Bogard, M.; Allard, V.; Brancourt-Hulmel, M.; Heumez, E.; Machet, J.-M.; Jeuffroy, M.-H.; Gate, P.H.; Martre, P.; Le Gouis, J. Deviation from the grain protein concentration-grain yield negative relationship is highly correlated to post-anthesis N uptake in winter wheat. J. Exp. Bot. 2010, 61, 4303–4312. [Google Scholar] [CrossRef] [Green Version]
  61. Michel, S.; Löschenberger, F.; Ametz, C.; Pachler, B.; Sparry, E.; Bürstmayr, H. Simultaneous selection for grain yield and protein content in genomics-assisted wheat breeding. Theor. Appl. Genet. 2019, 132, 1745–1760. [Google Scholar] [CrossRef]
  62. Shaw, R.G.; Byers, D.L.; Darmo, E. Spontaneous mutational effects on reproductive traits of Arabidopsis thaliana. Genetics 2000, 155, 369–378. [Google Scholar] [CrossRef]
  63. Ossowski, S.; Schneeberger, K.; Lucas–Lledó, J.I.; Warthmann, N.; Clark, R.M.; Shaw, R.G.; Weigel, D.; Lynch, M. The rate and molecular spectrum of spontaneous mutations in Arabidopsis thaliana. Science 2010, 327, 92–94. [Google Scholar] [CrossRef] [Green Version]
  64. Sani, E.; Herzyk, P.; Perrella, G.; Colot, V.; Amtmann, A. Hyperosmotic priming of arabidopsis seedlings establishes a long–term somatic memory accompanied by specific changes of the epigenome. Genome Biol. 2013, 14, R59. [Google Scholar] [CrossRef] [PubMed] [Green Version]
  65. Cavrak, V.V.; Lettner, N.; Jamge, S.; Kosarewicz, A.; Bayer, L.M.; Mittelsten Scheid, O. How a retrotransposon exploits the plants heat stress response for its activation. PLoS Genet. 2014, 10, e1004115. [Google Scholar] [CrossRef] [PubMed] [Green Version]
  66. Kim, M.Y.; Zilberman, D. DNA methylation as a system of plant genomic immunity. Trends Plant Sci. 2014, 19, 320–326. [Google Scholar] [CrossRef] [PubMed]
  67. Ceccarelli, S.; Grando, S.; Impiglia, A. Choice of selection strategy in breeding barley for stress environments. Euphytica 1998, 103, 307–318. [Google Scholar] [CrossRef]
  68. Bänziger, M.; Betrán, F.J.; Lafitte, H.R. Efficiency of high nitrogen selection environment for improving maize for low-nitrogen target environments. Crop Sci. 1997, 37, 1103–1109. [Google Scholar] [CrossRef]
  69. Alizadeh, M.A.; Jafari, A.A.; Sepahvand, K.; Davazdahemami, S.; Moeini, M.R.; Moaied, F.N.; Naseri, B. Evaluation of sainfoin accessions exposed to powdery mildew disease at four locations in Iran. Trop. Grassl. Forrajes Trop. 2021, 9, 97–108. [Google Scholar] [CrossRef]
  70. Fasoula, V.A.; Fasoula, D.A. Principles underlying genetic improvement for high and stable crop yield potential. Field Crop Res. 2002, 75, 191–209. [Google Scholar] [CrossRef]
  71. Kyriakou, D.T.; Fasoulas, A.C. Effects of competition and selection pressure on yield response in winter rye (Secale cereale L.). Euphytica 1985, 34, 883–895. [Google Scholar] [CrossRef]
  72. Chatzoglou, T.; Tokatlidis, I.S. Decision on germplasm choice to apply breeding within a local population of common vetch is affected by crowding. Span. J. Agric. Res. 2012, 10, 752–755. [Google Scholar] [CrossRef] [Green Version]
  73. Ninou, E.G.; Mylonas, I.G.; Tsivelikas, A.; Ralli, P.; Dordas, C.; Tokatlidis, I.S. Wheat landraces are better qualified as potential gene pools at ultraspaced rather than densely grown conditions. Sci. World J. 2014, 2014, 957472. [Google Scholar] [CrossRef]
Figure 1. Single-plant frequency distribution of cv Svevo plants for grain yield (GY), protein content (PC), plant biomass (PB) and thousand kernel weight (TKW).
Agriculture 12 00661 g001
Figure 2. Single-plant frequency distribution of cv Maestrale plants for grain yield (GY), protein content (PC), plant biomass (PB) and thousand kernel weight (TKW).
Agriculture 12 00661 g002
Figure 3. Grain yield (GY) and protein content (PC) of seven families coming from high-yielding plants, are expressed as percentages (%) of the original cv Svevo values. * The vertical bars with * represent families that differ statistically with the original cv Svevo for a = 0.05.
Agriculture 12 00661 g003
Figure 4. Grain yield (GY) and protein content (PC) of seven families coming from high-yielding plants, expressed as percentages (%) of the original cv Maestrale. * The vertical bars with * represent families that differ statistically with the original cv Maestrale for a = 0.05.
Agriculture 12 00661 g004
Table 1. Descriptive statistics (mean, coefficient of variation %, minimum, maximum, range, skewness, kurtosis) for grain yield (GY), protein content (PC), plant biomass (PB) and thousand kernel weight (TKW) of individual plants of cvs Svevo and Maestrale, in the 1st year of experimentation under ultra-low plant density (ULD).
TraitsMeanCV%Min.Max.RangeSkew.Kurt.
cv SvevoGY79.8337.1621.40191.10169.700.705 **3.028 **
PC19.455.0916.5022.405.900.422 **0.202
PB324.0326.6688.40771.00682.60−0.446 **0.449 *
TKW45.4911.5228.4559.2530.800.215 **0.056
cv MaestraleGY65.5644.838.65170.91162.260.545 **0.320
PC17.495.6414.7021.206.500.486 **−0.157
PB290.9928.57128.60598.60470.000.062−0.116 *
TKW44.7011.5629.3560.5031.15−0.1660.009
* Significant at a = 0.05; ** significant at a = 0.01.
Table 2. Correlations between grain yield (GY), protein content (PC), plant biomass (PB) and thousand kernel (TKW) weight for individual cv Svevo plants.
GYPCPBTKW
GY1
PC−0.388 **1
PB0.764 **−0.314 **1
TKW0.310 **−0.0610.172 **1
** significant at a = 0.01.
Table 3. Correlations between grain yield (GY), protein content (PC), plant biomass (PB) and thousand kernel weight (TKW) for individual cv Maestrale plants.
GYPCBPTKW
GY1
PC−0.193 **1
PB0.767 **−0.139 **1
TKW0.288 **0.0640.0821
** significant at a = 0.01.
Table 4. Characteristics of selected plants (cv Svevo) from the 1st year of experimentation under ultra-low plant density (ULD) that were evaluated in the 2nd year of experimentation under typical crop density (TCD).
Selected Plants GYPCPBTKW
1HGY a_HPC1 b125.021.0430.450.35
2HGY_HPC2131.020.0459.648.55
3HGY_MPC163.019.0465.549.35
4HGY_MPC2137.019.043845.05
5HGY_LPC1154.018.0535.247.75
6MGY_HPC191.222.0464.547.1
7MGY_HPC293.921.0757.149.45
8LGY-HPC134.621.0276.446.2
42.623.0264.446.1
35.822.0228.750.2
41.022.019949.1
9LGY-LPC144.218.0266.844.0
39.818.0193.246.05
38.618.0245.244.5
38.618.0196.445.8
10MGY_LPC190.518.0745.750.7
11HGY_MPC3191.019.0520.649.05
12HGY_MPC4177.019.0510.147.75
a In the 1st year of experimentation, GY of the individual plants of cv Svevo ranged from 21.4 to 191.1 g. Thus, plants yielding from 21.40 to 77.97 g were low-grain yielding plants (LGY), and those with values from 77.98 to 134.53 g were moderate-grain yielding plants (MGY) and those with yield from 134.54 to 191.10 g were high-grain yielding plants (HGY). b Similarly for PC, plants with values from 16.50 to 18.47% were characterized as low PC (LPC), those with values from 18.48% to 20.43% were characterized as moderate PC (MPC) and those with values from 20.44% to 22.40% were characterized as high PC (HPC) plants.
Table 5. Characteristics of selected plants (cv Maestrale) from 1st year of experimentation under ultra-low plant density (UPD) that were evaluated in the 2nd year of experimentation under typical crop density (TCD).
Selected Plants GYPCPBTKW
1HGY_LPC 1170.916.6498.644.05
2HGY a_MPC b 1143.317.5598.643.1
3HGY_MPC 2 139.717.2550.046.65
4HGY_MPC 3134.217.8469.950.55
5HGY_MPC 4131.017.8492.250.4
6HGY_LPC 2130.616.7362.551
7HGY_MPC 5125.417.6374.952.8
8MGY_HPC 1106.120363.050.5
9LGY_HPC 134.319.1251.949.5
31.419.1164.847.65
39.919.2254.546.7
37.519.1251.856.65
10LGY_LPC 130.016.8180.043.15
30.516.8257.044.8
30.516.8161.141.45
31.516188.243.4
11HGY_LPC 3145.016.7456.646.95
12MGY_MPC 1114.518.5379.644.45
a In the 1st year of experimentation, GY of the individual plants of cv Maestrale, ranged from 8.65 to 170.91 g. Thus, plants yielding from 8.65 g to 62.74 g were characterized as low-grain yielding (LGY) plants, those with values from 62.75 g to 116.82 g were characterized as moderate-grain yielding (MGY) plants and those with yield from 116.83 g to 170.71 g were characterized as high-grain yielding (HGY) plants. b Similarly, for PC, plants with values from 14.70% to 16.87% were characterized as low PC (LPC), those with values from 16.88% to 19.03% were characterized as moderate PC (MPC) and those with values from 19.04% to 21.20% were characterized as high PC (HPC) plants.
Table 6. Mean grain yield (GY) (t∙ha−1) and protein content (PC) (%) of the 12 progeny originated from cv Svevo and that of cv Svevo as a control, during the 2nd year of experimentation under typical crop density (TCD).
Selected PlantsGYPC
1HGY_HPC13.18a 117.13g
2HGY_HPC22.84ab17.10g
3HGY_MPC13.06a19.70bc
4HGY_MPC22.13cde18.93cde
5HGY_LPC12.00cde18.17defg
6MGY_HPC11.86de17.77efg
7MGY_HPC21.73e20.60ab
8LGY_HPC11.63e21.37a
9LGY_LPC11.72.0e19.30bcd
10MGY_LPC11.80de17.10g
11HGY_MPC32.99.3a17.70efg
12HGY_MPC42.26cd17.47fg
13Svevo2.39bc18.60cdef
1 Means followed by different letters are differentiated statistically for a = 0.05.
Table 7. Mean grain yield (GY) (t∙ha−1) and protein content (PC) (%) of the 12 progenies derived from cv Maestrale and those of cv Maestrale as a control, during the 2nd year of experimentation under typical crop density (TCD).
Selected Plants GYPC
1HGY_LPC 15.68a 116.43bc
2HGY_MPC15.87a16.43bc
3HGY_MPC 2 5.18ab16.13bcd
4HGY_MPC 34.15bcd16.37bc
5HGY_MPC 43.62de16.73abc
6HGY_LPC 22.66e17.30ab
7HGY_MPC 54.22bcd17.33ab
8MGY_HPC 13.93bcde17.87a
9LCY_HPC 13.65de17.37ab
10LCY_LPC 12.62e15.77cd
11HGY_LPC 33.86cde16.77abc
12MGY_MPC 13.29de16.07bcd
13Maestrale5.04abc15.00d
1 Means followed by different letter are differentiated for a = 0.05.
Publisher’s Note: MDPI stays neutral with regard to jurisdictional claims in published maps and institutional affiliations.

