Article

Morpho-Physiological and Stress-Related Gene Expression of Rice Varieties in Response to Salinity Stress at Early Vegetative Stage

by
Tasneem Shakri
1,
Muhammad Hafiz Che-Othman
2,
Nurulhikma Md Isa
2,
Noor Liyana Sukiran
2 and
Zamri Zainal
1,2,*
1
Institute of System Biology, Universiti Kebangsaan Malaysia, Bangi 43600, Selangor, Malaysia
2
Department of Biological Sciences and Biotechnology, Faculty of Science and Technology, Universiti Kebangsaan Malaysia, Bangi 43600, Selangor, Malaysia
*
Author to whom correspondence should be addressed.
Agriculture 2022, 12(5), 638; https://doi.org/10.3390/agriculture12050638
Submission received: 9 March 2022 / Revised: 11 April 2022 / Accepted: 18 April 2022 / Published: 28 April 2022
(This article belongs to the Topic Plant Responses and Tolerance to Salinity Stress)

Abstract

:
This study focuses on the growth and morpho-physiological responses of the Malaysian commercial variety MR219 rice to salinity stress during the early vegetative stages, specifically during germination and the five-leaf stage. For germination responses, MR219 seeds were grown for 10 days in different salt concentrations. Low salinity significantly improves seed germination and increases the total number of germinated seeds. However, higher salinity (160 mM NaCl) inhibits the germination of MR219 seeds and reduces the total number of germinated seeds by 93.3%. The effects of salinity on the five-leaf stage of MR219 were also determined and compared to the salinity-tolerant (Pokkali) and susceptible (IR64) varieties. There were significant reductions in the photosynthesis rate, transpiration rate, stomatal conductance, and leaf chlorophyll content by 28.1%, 58.6%, 81.1%, and 3.7%, respectively. These reductions could contribute to the significant decrease in growth parameters measured throughout the treatment period. Based on the principal component analysis (PCA) result, MR219 is more tolerant to salinity than IR64, but is less tolerant than Pokkali. Further investigation on stress-related gene expression suggests that significant changes in the transcript level of genes involved in gamma-aminobutyric acid (GABA) shunt, ion transport, and reactive oxygen species detoxification could be attributed to the adaptation and tolerance level of each variety to salinity stress.

1. Introduction

Rice is one of the most widely consumed grains in the world, supplying carbohydrates and nutrients to more than half of the world’s population. The widespread use of rice in food (e.g., cereals, oils, beverages, and flour) and medicine, combined with a growing population, have resulted in massive demand for rice over the decades [1,2]. Reduced arable land, climate change, and biotic and abiotic stresses are the major contributors to limited global rice crop production. Salinity is one of the major factors reducing global rice yields [3]. It is estimated to affect ~20% of cultivated and ~33% of irrigated farmland worldwide, and is predicted to affect more than half of total arable land by 2050 [4,5].
Previous reports have found that high salt stress has several negative effects on rice plants, including germination interference, stunted growth, impaired fertility, flowering inhibition, and reduced photosynthetic activity [1,6]. Germination and emergence are critical stages in the plant’s life cycle for regulating the plant’s efficacy in utilising available water and nutrients. Perturbation at any of these stages has a significant impact on the plant’s subsequent growth, resulting in a yield penalty [7]. For instance, a high salt level in plant tissue has been shown to reduce leaf photosynthetic activity and respiration rate, inhibiting overall plant growth [8]. The reduction of photosynthetic activity of plants under salinity stress can be attributed to several factors: (1) limitations in CO2 availability due to stomatal closure; (2) loss of function of photosynthetic pigments following degradation and/or oxidative damage; and (3) biochemical modifications [9,10]. Thus, prolonged exposure to a saline environment results in the reduction of the concentration and translocation of assimilates across plant organs that are crucial for cell growth and development [10].
Rice plants able to confer higher growth performance in a saline environment over a period of time are deemed “tolerant” and have higher potential in contributing to food security [11]. Changes in morpho-physiological traits frequently depend on the regulation of plant molecular and biochemical processes in response to stress. Biochemicals such as sugar alcohols, quaternary ammonium, proline, and tertiary sulfonium modulate critical processes such as osmoregulation, protein stability, membrane permeability maintenance, ROS scavenging, and photosystem association [12,13]. Cumulative effects of biochemical alterations under stress help plant adaptation and survival in saline environment, ensuring steady growth while minimising damage caused by osmotic and ionic stress [13].
An increase in salt level also triggers a series of continuous signals that contribute to the activation or inactivation of particular proteins or genes involved in specific biological processes [14]. Transcript profiling of different rice varieties by Basu and Roychoudhury [15] showed that salinity stress triggers upregulated expression of stress-related genes such as SOS3, NHX1, HKT1, PAL, and CHS. These genes encode proteins that play important roles in metabolic pathways and plant tolerance mechanisms against salinity such as transport, detoxification, stress-related hormone biosynthesis energy, and more [15]. The activation of salt overly sensitive (SOS)-related proteins, for example, modulates the exclusion and sequestration of excess Na+ in the cell and prevents ionic imbalance [16,17]. An increase in the activity of enzymatic antioxidants such as superoxide dismutase (SOD), peroxidase, and catalase (CAT) reduces and prevents the accumulation of reactive oxygen species (ROS), minimising toxicity and damage to cell components [18].
MR219 (Oryza sativa L. ssp. indica) is a commercial Malaysian rice variety that was released in 2001 and is reported to have high yield production, good grain quality, a short maturation period, and resistance to infectious pests such as blast and bacterial blight [19]. However, MR219 is quite sensitive to environmental changes such as drought and flooding [20,21,22]. Although there is good understanding of the effect of salinity on rice in general, studies on the Malaysian variety are still limited. The purpose of this study is to determine MR219′s response to salt treatment by comparing the morpho-physiological and biochemical changes between MR219 and a salt-tolerant variety, Pokkali, as well as susceptible variety, IR64. The expression levels of genes involved in gamma-aminobutyric acid (GABA) metabolism, ion transport, and ROS detoxification were also investigated to understand plant responses to salinity stress at a transcriptional level. Here, Pokkali and IR64 were used as control varieties due to their remarkably high tolerance level and susceptibility to salinity, respectively, as reported in many previous salinity-related studies [23,24,25,26].
Rice varieties that show high tolerance to salinity should have better growth performance in terms of shoot height, root length, biomass, leaf area, and number of nodes and leaves, as well as higher chlorophyll and relative water content compared to susceptible varieties. We hypothesized that MR219 could withstand the salinity stress during the vegetative stage, hence contributing to better growth performance traits than that of susceptible variety. The salinity tolerance can be determined by the roles of GABA metabolism, ion transport, and antioxidant activity. Obtaining this information will assist in further understanding the coping mechanism of MR219 to salinity stress.

2. Materials and Methods

2.1. Seed Sterilisation and Treatments

MR219 seeds were obtained from the Malaysian Agricultural Research and Development Institute, Seberang Perai. The seeds were washed with DEACON, 70% ethanol for 2 min, 100% Clorox, and Tween 20 for 30 min, then rinsed five times with distilled water and dried. At least 75 seeds were immediately treated with salt, while the remainder were sown and grown in a supported hydroponic system. In 9 cm diameter Petri dishes, seeds were soaked in 10 mL of NaCl solution of various concentrations: 0 (control; distilled water), 40, 80, 120, and 160 Mm for the salt treatment at the seedling stage (15 seeds per dish). The seeds were incubated for 10 days in the tissue culture room (27 ± 1 °C with 12 h of daylight), and germinated seeds were counted daily throughout the treatment period.

2.2. Germination Observation and Seedlings Physiological Analyses

Data on the germination rate (SG), germination energy (GE), and final germination percentage (FGP) were calculated based on the work by Hakim et al. [27]. On the tenth day of treatment, growth parameters such as shoot height, root length, and relative water content (RWC) were measured, and the means were calculated for 15 seedlings. The experiment was repeated three times.

2.3. Plant Growth and Treatment

Sterilised seeds of MR219, Pokkali, and IR64 (50–60 seeds per variety) were soaked in distilled water and left in the dark until the radicle emerged. The seeds were then sown on moist filter paper for five days under continuous light. Thirty healthy seedlings were selected for each variety and transferred into the container of a supported hydroponic system. In every container, the positions of each plant were arranged at random, with a distance of 5 cm between them. The plants were grown until the fifth leaf emerged. After that, NaCl was added in increments of 25 mM twice daily (at 9 a.m. and 5 p.m.) until a final concentration of 100 mM was reached after a 10-day treatment period. The plants were reshuffled every 2 days from the beginning to ensure minimal error and experimental bias. The nutrient solution containing 1/2 Hoagland growth solution was changed every 2 weeks. The experiment was designed as a 2 × 3 × 4 factorial with 24 treatment combinations. Four replicates were used for each treatment combination, making a total of 96 experimental units.

2.4. Measurement of Morpho-Physiological Characters

Each morpho-physiological parameter was measured at four different time points (0, 2, 6, and 10 days of treatment). The time-points were selected based on the protocol by Bado et al. [28], which was modified in this study so that seedling mortality could be avoided at the end of the treatment period. The parameters were as follows:

2.4.1. Growth Measurement

The data for growth measurement include plant height, shoot-to-root ratio, biomass, surface area of the fifth leaf, and the total number of leaves and nodes. Plant height was measured from the ground to the tip of the central plant panicle, and root length was determined by the length of the longest main root. The biomass of the plant was measured after drying the entire plant at 60 °C for 7 days or until stable measurements were obtained.

2.4.2. Gaseous Exchange

Measurements of net photosynthetic rate, transpiration rate, and stomatal conductance of the fifth leaf were taken between 8 a.m. and 10 a.m. using a portable infrared gas analyser system, LiCOR-6400. The operating system was set up as follows: photosynthetically active radiation = 1000 nm, leaf cuvette temperature = 30 °C, air relative humidity = 50–70%, and CO2 supply = 400 μmol.

2.4.3. Total Chlorophyll Content

Chlorophyll extraction was performed using a modified version of the method developed by Hu, Tanaka, and Tanaka [29]. Chlorophyll from the fifth leaf was extracted by immersing a 0.2 g leaf sample in 100 mL of boiling water for 10 s, grinding it into small pieces, and then soaking it in 2 mL of cold, pure (100%) acetone overnight at −20 °C. The absorbance of 1 mL of the extract was taken at 645 nm (A645) and 663 nm (A663) using a UV–vis spectrophotometer (Biobase). Shibghatallah et al. [30] devised the following formula for calculating total chlorophyll content:
Chlorophylla = 12.7 A663 − 2.69 A645
Chlorophylla+b = (12.7 A663 − 2.69 A645) + (22.9 A645 − 4.68 A663)
Chlorophyllb = 22.9 A645 − 4.68 A663
Total chlorophyll (mg g−1 FW) = 2 × Chlorophylla+b/(0.2 × 100)

2.4.4. Relative Water Content

Following the method by Turner [31], the weight of a total of 15 leaf discs was measured at three different time points. Fresh weight (FW) was determined immediately after sampling, whereas turgidity weight (TW) was determined after soaking the leaf discs in distilled water for at least 4 h. The same leaf discs were then dried for a week at 60 °C, and their dry weight (DW) was measured. The RWC was calculated using the following formula:
RWC = FW DW TW DW   × 100

2.5. Gene Expression Analyses

2.5.1. RNA Extraction and First-Strand cDNA Synthesis

Total RNA from each variety was isolated using TRIzol reagent according to the manufacturer’s protocol (Invitrogen, Thermo Fisher Scientific, Waltham, MA, USA). The extracted RNA samples were diluted further, and the purity of the RNA was confirmed using NanoDrop. HiScriptIII First Strand cDNA Synthesis Kit (Vazyme Biotech, Nanjing, China) was used to synthesise first-strand cDNA from 100 µg of RNA. The synthesised cDNA can be stored at −80 °C for further analysis.

2.5.2. Semi Quantitative RT-PCR

Polymerase chain reactions were performed with OneTaq 2X Master Mix DNA polymerase kit (NEB, UK) to amplify targeted genes with the following set of primers: 18sRNA (F:CGGCGGATGTTGCTTATAGG, R:TGCACCACCACCCATAGAAT), GABA-T1 (F:CATTCACAGCTGGTTGGCAG, R:ATGGAAGCGCCAGTAGTGAG), GAD2 (F:GAAGGCTGCTACGTGATGGA, R:CACGCTCTTGTACCCCTCAA), SSADH (F:TGTCCTGTATGGGCAGCAAA, R:ACTCCAACAGGCTGCTTCAA), SOS2 (F:GTGCTACATCGCTTATCCAC, R:GAGCAACTTCGAAAACCTGT), OsNHX1 (F:GTCAATGAGTCCATCACCGC, R:GTAGCATCGTTCACAACACC), CuZnSOD1 (F:GTGAAGGCTGTTGTTGTGC, R:AGCCTTGAAGTCCGATGATC), MnSOD1 (F:GGAGGCCATGTCAATCATTC, R:GTCGCATTTTCGTACACCTC) and CAT1 (F:CCACCACAACAACCACTACG, R:CCAACGACTCATCACACTGG). The PCR running programme was set up according to the protocol provided by NEB, with an annealing temperature of 56–57 °C and optimisation for 30 cycles. Gel electrophoresis was conducted on each amplified product. ImageJ software was used to perform quantitative analysis of the expression rate of each gene based on the band intensity on the gel.

2.6. Statistical Analyses

SAS University Edition was used to analyse the data to determine the level of variation caused by varieties, salinity, and treatment period. The data collected for germination and plant growth in hydroponic systems were analysed using one-way and three-way factorial analysis of variance (ANOVA), respectively. ANOVA was also used to determine the mean, coefficient of variation, and standard deviation for each parameter. Duncan’s multiple range test grouping was performed, with a significant value set below 0.05 (p-value < 0.05), whereas principal component analysis was conducted using IBM SPSS Statistics V25 using the Oblimin rotation method with Kaiser normalisation.

3. Results

3.1. Effect of Salinity on MR219 Germination

To determine the effect of salinity stress on MR219 germination, the seeds were soaked in NaCl solutions of different concentrations (0, 40, 80, 120, and 160 mM) for 10 days. According to the findings, increasing the salt concentration inhibits MR219 germination and limits the growth of rice seedling plumules and radicles (Figure 1). At 40 mM NaCl, the SG of MR219 peaked at 5.93, which is 17.0% higher than the control. As the salinity level increased, the SG decreased significantly and was nearly halted at 160 mM. Both the GE and FGP of MR219 follow a similar pattern to the SG, with a significant reduction in GE and the fewest germinated seeds at 160 mM NaCl (Table 1).
Treated MR219 seedlings had shorter shoot and root lengths compared to non-treated seedlings. The mean shoot length recorded at 40 mM was 2.0 cm, which is 60.0% shorter than the control, while the root length was reduced by 63.6% at 80 mM NaCl. No radicles emerged at the 160 mM treatment, despite the presence of a few germinated seeds (emergence of plumule). The RWC of the 15 seedlings increased by 11.0% at low salinity and decreased by >6.0% at high salinity (120–160 mM NaCl).

3.2. Salinity Effects on Plant Morpho-Physiology at Vegetative Stage

3.2.1. Growth Performance

The effect of salinity on MR219 plants during the vegetative stage was compared to Pokkali and IR64 varieties. The 21-day old plants were subjected to 100 mM NaCl for 10 days, and changes in growth parameters were observed at four different time points. Based on ANOVA, there were significant differences (p-value < 0.05) in plant height and leaf surface area based on variety (V), salinity (S), treatment period (T), and V×T and T×S interactions (Table 2). Significant differences in biomass were attributed to V×T and T×S interactions, whereas significant differences in V and T were attributed to shoot-to-root ratio and number of leaves. Meanwhile, the number of nodes only showed a significant difference for T.
Except for the shoot-to-root ratio, the overall results show that salinity significantly reduces all growth parameters of each variety. On day 6 of treatment, the mean for all treated plants’ heights was 11.8% lower than the control. This result can be attributed to the significant height reduction of Pokkali and IR64, which exceeded 12.0% of the control. The height of MR219 was reduced by 16.6% on day 10. Salinity-treated Pokkali had the highest plant height, which was >1.6 times higher than MR219 and IR64. On day 10, there were no significant differences between treated MR219 and IR64.
Salinity also reduces the leaf surface area and the number of plant leaves and nodes. The surface area of the fifth leaf in all varieties was reduced after 6 days of treatment. On day 10, Pokkali had the lowest leaf surface area reduction of 34.1% compared to MR219 and IR64, both of which were around 44.7%. Salinity also reduced the total number of leaves and nodes, especially for Pokkali (p-value < 0.05) on day 6 (−17.6%) and day 10 (−14.3%), whereas there were no significant changes in the number of leaves and nodes for either MR219 or IR64 throughout the treatment.
As shown in Table 3, the decrease in these growth parameters is attributed to each variety’s decreasing biomass, especially for MR219 and Pokkali. Except for day 0, the mean biomass of all treated plants was lower than the control at all time points. On day 10, Pokkali had the highest biomass reduction among the varieties, at 55.9%, followed by IR64 (14.6%) and MR219 (7.0%). Regardless of these reductions, the shoot-to-root ratio of plants increased over the course of the treatment. Both MR219 and Pokkali showed a significant increase in the shoot-to-root ratio on day 6 and day 10, respectively. This observation indicates that the root growth of the rice plant was more sensitive to salinity than the shoot growth.

3.2.2. Rate of Gaseous Exchange

According to Table 4, there are significant differences in transpiration rate and stomatal conductance for V, T, and S, as well as V×T, V×S, T×S, and V×T×S interactions, but only for V, S, and T×S interactions in photosynthesis rate. The results show that as the treatment was extended, gaseous exchange parameters such as photosynthesis rate, transpiration rate, and fifth-leaf stomatal conductance decreased significantly. The effects of salinity on the photosynthesis rates of MR219, Pokkali, and IR64 can be seen as early as 2 days of treatment, with salinity causing 22.7%, 18.5%, and 30.4% reductions, respectively. On day 10, IR64 had the greatest reduction in photosynthesis rate, with 59.0% lower than the control, followed by MR219 (32.7%) and Pokkali (28.1%). Pokkali had a higher photosynthesis rate than MR219 and IR64 throughout the treatment period. After 10 days of treatment, the photosynthesis rate of Pokkali was 1.2 and 2.4 times higher than that of MR219 and IR64, respectively (Figure 2a).
On day 2, the transpiration rate of MR219, Pokkali, and IR64 was reduced by 20.4%, 15.6%, and 63.7%, respectively, compared to the control. The trend continued until day 10, when IR64 showed the greatest decrease in transpiration rate, 74.6% lower than the control, followed by MR219 (66.1%) and Pokkali (58.6%) (Figure 2b). In terms of stomatal conductance, salinity reduced the stomatal aperture of MR219 by 81.1% compared to the control after 10 days of treatment. The changes in stomatal conductance can be seen in treated IR64 (−80.0%) and Pokkali (−43.2%) on the same day. Pokkali has the highest stomatal conductance throughout the treatment period, which is highly significant compared to MR219 and IR64, while there were no significant differences between MR219 and IR64 under similar treatment (Figure 2c).

3.2.3. Total Chlorophyll and Relative Water Content

The ANOVA result in Table 5 shows a significant difference (p-value < 0.05) in chlorophyll content for V and S, as well as V×T, V×S, and T×S interactions, whereas significant differences in RWC are observed for V, T, S, and T×S interaction. Based on Figure 3, salinity significantly reduced the total chlorophyll content of IR64 and MR219 but not Pokkali, which maintained a high chlorophyll content throughout the treatment period. After 6 days of treatment, IR64 showed a significant reduction in chlorophyll content, which was 5.5% lower than the control and lasted until day 10. On day 10, the total chlorophyll content of the MR219 leaf was reduced by 3.7% compared to the control. Regardless, the chlorophyll content of MR219 on day 10 was still 3.7% higher than that of treated IR64, but 9.3% lower than that of treated Pokkali.
Salinity also reduces the RWC of plant leaves. Significant differences were observed on both days 6 and 10. On day 6, the range value for RWC was between 63.7% (IR64) and 75.8% (Pokkali). IR64 had the greatest reduction in RWC compared to the control, at 29.8%, followed by MR219 (21.3%) and Pokkali (17.1%). RWC continued to decrease until day 10 at which point there were no significant changes except for IR64, which experienced a further decrease in RWC. On day 10, the highest RWC was shown in Pokkali (72.6%), which was 7.9% and 35.3% higher than MR219 and IR64, respectively.

3.2.4. Identification of Phenotypic Correlation Identification Using PCA

Principal component analysis (PCA) was used to determine the phenotypic correlation between morpho-physiological traits. Supplementary Table S1 shows the coefficient values for all traits in the three components extracted from the analysis. The total variation for the components is 80.8% (PC1 = 40.8%, PC2 = 25.0%, PC3 = 15.0%). Plant height, leaf surface area, shoot-to-root ratio, biomass, and chlorophyll content are all positively correlated and heavily influenced by PC1 (Supplementary Figure S1). PC2 shows positive correlations between photosynthesis rate, transpiration rate, stomatal conductance, and RWC, all of which are negatively correlated with the number of leaves and nodes, which are heavily influenced by PC3. The scatter plot for the first two components (PC1 vs. PC2) describes the 65.8% variability of the samples at the end of the treatment (Figure 4), with the least-salinity-tolerant species occupying the negative quadrant of PC1 and the most-tolerant species occupying the positive quadrant of PC1. The plot suggests that Pokkali is the most-salinity-tolerant variety, followed by MR219 and IR64.

3.3. Semi-Quantitative qRT-PCR Analysis of Selected Gene Expression under Salinity Stress

3.3.1. Expression of GABA Shunt Genes

The qRT-PCR products were run on agarose gels and observed under UV light (Figure S2). There were significant differences (p-value < 0.05) in gene expression for V, T, and V×T interaction (Table 6). Both Pokkali and MR219 showed a significant increase in GABA-T1 expression under salinity stress. On day 6 of treatment, the expression increased by 32.4% and 52.2% for Pokkali and MR219, respectively (Figure 5). In comparison to Pokkali and MR219, IR64 showed a 36.6% reduction in gene expression on the same day. At the end of the treatment, the highest GABA-T1 expression was recorded in Pokkali, which was 2.1% and 7.8 times higher than MR219 and IR64, respectively.
Similar to GABA-T1, the expression of SSADH increased significantly during treatmen t. On day 6 of treatment, MR219 showed a significant increase in SSADH expression, 2.5 times higher than the previous time point. On day 2, SSADH expression for Pokkali and IR64 increased by 2.2 and 3.0 times, respectively. Unlike MR219 and Pokkali, the expression of SSADH in IR64 decreased significantly by 64.3% at the end of the treatment period. Salinity also reduced GAD2 expression in MR219, Pokkali, and IR64. On day 10 of treatment, the expression of GAD2 in IR64 decreased by 78.4%, while it decreased by 28.5% and 9.6% in MR219 and Pokkali, respectively. Regardless of the reduction, Pokkali shows the highest expression of GAD2 (13.9%) on the same day, followed by MR219 (11.2%) and IR64 (3.7%).

3.3.2. Expression of the Ion Transport Gene

The expression of SOS2 in MR219, Pokkali, and IR64 increased significantly after 2 days of treatment. Pokkali showed a 7.8-fold increase in SOS2 expression compared to the control. Meanwhile, SOS2 expression in MR219 and IR64 increased by 1.3 and 14.6 times, respectively. In contrast to Pokkali, gene expression in MR219 and IR64 decreased with treatment duration, as observed on day 10, with SOS2 expression in MR219 being 51.9% lower than that on day 0, whereas SOS2 expression in IR64 was nearly halted.

3.3.3. Expression of the Antioxidant Genes

Under salinity stress, there were significant changes in the expression of antioxidant genes in MR219, Pokkali, and IR64. On day 2, the expression of CuZnSOD1 in MR219 drastically increased by 2.9-fold, whereas in IR64 it increased by 30.8%. Despite a gradual decrease in expression as the treatment progressed, CuZnSOD1 expression in MR219 and IR64 was still slightly higher than that of the control at the end of treatment. During the treatment period, there were no significant changes in CuZnSOD1 expression for Pokkali. Nevertheless, CuZnSOD1 expression in Pokkali was higher than in MR219 and IR64.
MnSOD1 expression gradually increased in all varieties during the treatment period. MnSOD1 expression was highest on day 10, when it was 1.1 times higher in Pokkali than on day 0, while MR219 and IR64 both recorded a ~68.0% increase. Salinity caused a significant increase in CAT1 expression in all varieties after 2 days of treatment. The expression of CAT1 in Pokkali increased 19.9-fold, whereas MR219 and IR64 experienced a 12.2-fold increase in expression. Despite the drastic increment, CAT1 expression decreased with treatment duration, with IR64 being the most affected on days 6 and 10.

4. Discussion

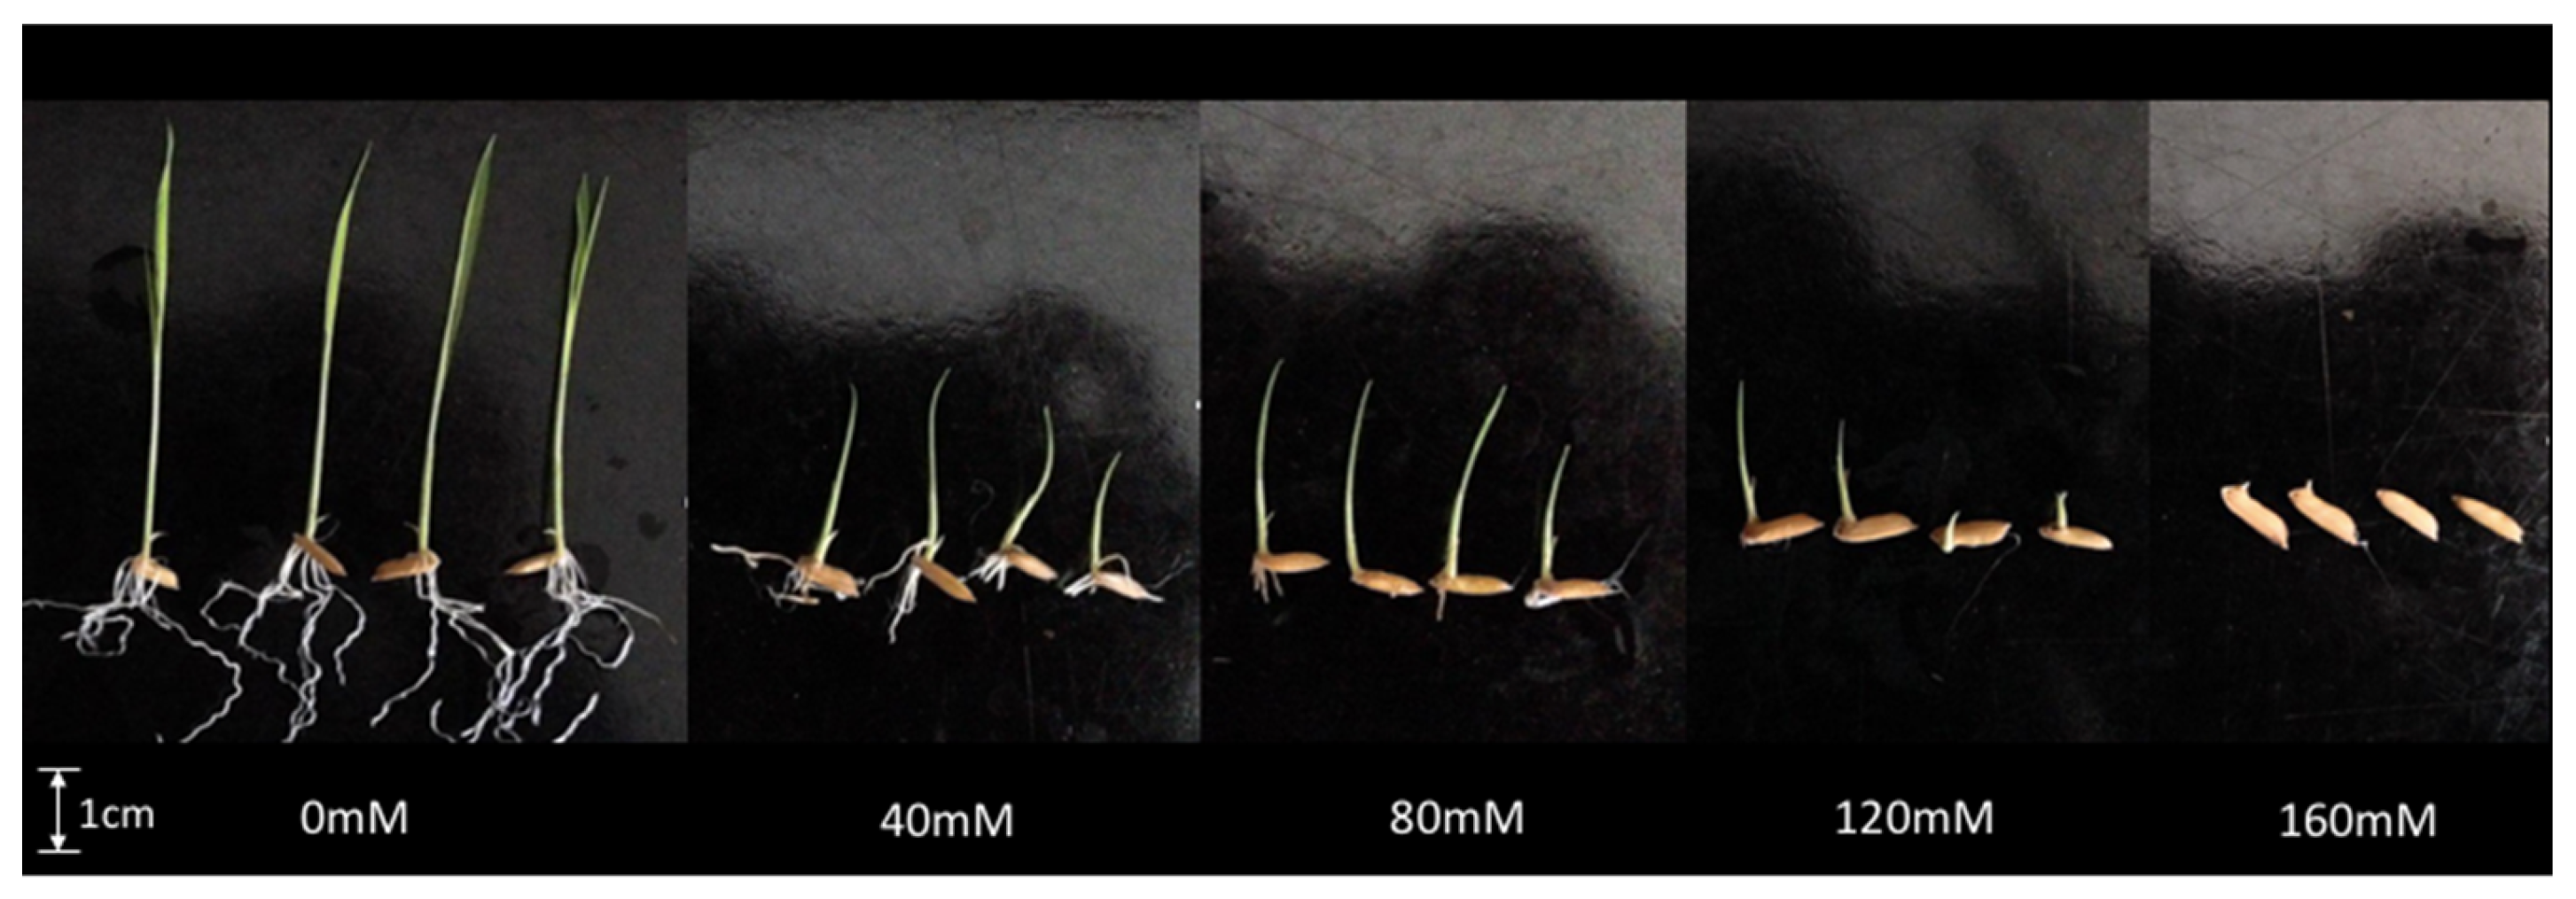
The results of germination performance indicate that the MR219 seed has slight tolerance to salt stress and is unaffected by low to moderate salinity levels, though the time required for the seed to germinate appears to be delayed as the salinity level increases. Interestingly, the seed germination rate of MR219 was improved at a low level of salinity, which contrasts with the findings of recent studies on rice seed germination [32,33]. It is, however, supported by an earlier study by Panuccio et al. [34] reporting that low salt treatment speeds up seed germination of quinoa, but not the final germination percentage. As suggested by Zhang et al. [35], sodium or salt may act as osmoticum whereby the absorption of sodium into seeds may facilitate the uptake of water more rapidly. In contrast, high salinity levels have a significant impact on MR219 seed, completely halting germination and radical emergence. Similar results were also reported by Roy et al. [36] that high salinity stress treatment reduces the germination rate and percentage of two different Binadhan varieties. Likewise, an increase in salinity concentration caused inhibition of >80% seeds of both tolerant and susceptible rice varieties after 10 days of treatment [37]. This could be due to metabolic changes such as reduction in K+ efflux and solute leakage caused by mineral nutrient imbalances under salinity stress [3,32]. Meanwhile, Na+ build-up caused a K+/Na+ imbalance, which disrupts many physiological functions of MR219, including germination. Salinity also reduces moisture availability, which is required for embryo activation.
During the germination stage, salinity reduces turgor pressure, which may limit the elongation of cells and cause stunted growth, as evidenced by shoot height and root lengths, which are important morphological parameters for growth and development. Previous research found that young seedlings are more sensitive to salinity than older plants, as plumule growth is greatly affected even when treated with low salt stress [27,38]. Osmotic stress, low nutrient availability, and K+ efflux may inhibit shoot growth, interfering with a variety of growth processes such as enzyme activation, stomatal activity, photosynthesis, sugar transport, protein and starch synthesis [39,40]. The plumule’s growth is initially suppressed more than the radicle’s, with plumule length being shorter and the root appearing to grow longer compared to the control at low salinity. This observation is supported by research by Hakim et al. [27] and Fogliatto et al. [33], which suggests that the shoot is more susceptible to salinity than the root. At high salinity levels, the growth of radicles and roots was shown to be severely hampered, as opposed to shoots, where the emergence of radicles from most seeds was completely halted. The positive correlation between root growth and salinity at low levels could be attributed to the MR219 adaptive strategy, suggesting that seedlings can still maintain homeostasis under low salinity stress. Moreover, low water potential due to limited water availability could cause root elongation in MR219. In contrast to high salinity levels, the shortening of the MR219 roots may be able to restrict the uptake of Na+ and Cl- ions into the plant transport system via root tissues to prevent toxic sodium accumulation, hence the inhibitory effects of salt on root growth.
Growth stalled immediately after salt treatment in MR219 grown in a hydroponic support system. Unlike other salt-tolerant varieties, MR219 is susceptible to salinity even at the late vegetative stage. The reduction in the number of leaves is consistent with the observation in rice and other plant species such as tomato, rosemary, and more [41,42,43]. These reductions indicate that salinity inhibits cell elongation and division, which directly inhibits rice plant vertical growth. The reduction of leaf surface area and the number of leaves could be attributed to the plant’s stress-avoidance mechanism to prevent excessive water loss and support the retention of toxic ions in the root rather than the aerial part of the plant [44,45]. Moreover, the inhibitory effects of salinity on leaf growth of different rice varieties have also been reported in previous studies by Kazemi et al., and Siregar et al. [46,47]. Salinity also inhibits biomass allocation, resulting in a decrease in plant biomass under salinity stress. This study has found that Pokkali is less affected by salinity than MR219 and IR64, as evidenced by the high plant height, biomass, leaf surface area, number of leaves, and number of nodes under stress. This could be attributed to Pokkali’s efficiency in growth- and development-related biological processes, which may contribute to the plant’s higher growth rate even under normal conditions when compared to MR219 and IR64. Pokkali may be able to adapt to salinity stress better if it has a high photosynthesis rate, efficient carbon utilisation for growth and maintenance, and high antioxidant activity. The root growth of salt-tolerant Pokkali is more sensitive to salinity than the salt-susceptible IR64, as evidenced by the increased shoot-to-root ratio. This observation, however, contradicts the majority of studies, which show that increasing root surface area aids salinity-tolerant plants in retaining toxic ions in the root and controlling their distribution to other parts [44,48]. Regardless, the results in this study are supported by Safitri et al. [49] on similar rice genotypes treated with 120 mM NaCl, where Pokkali showed a 37.9% decrease in root length compared to a 19% decrease in IR64. Plant alternatives, such as limiting soluble salt accumulation in the shoot and delaying the onset of the tolerance threshold, could explain the inhibition of root growth, as suggested in previous studies [45,50,51].
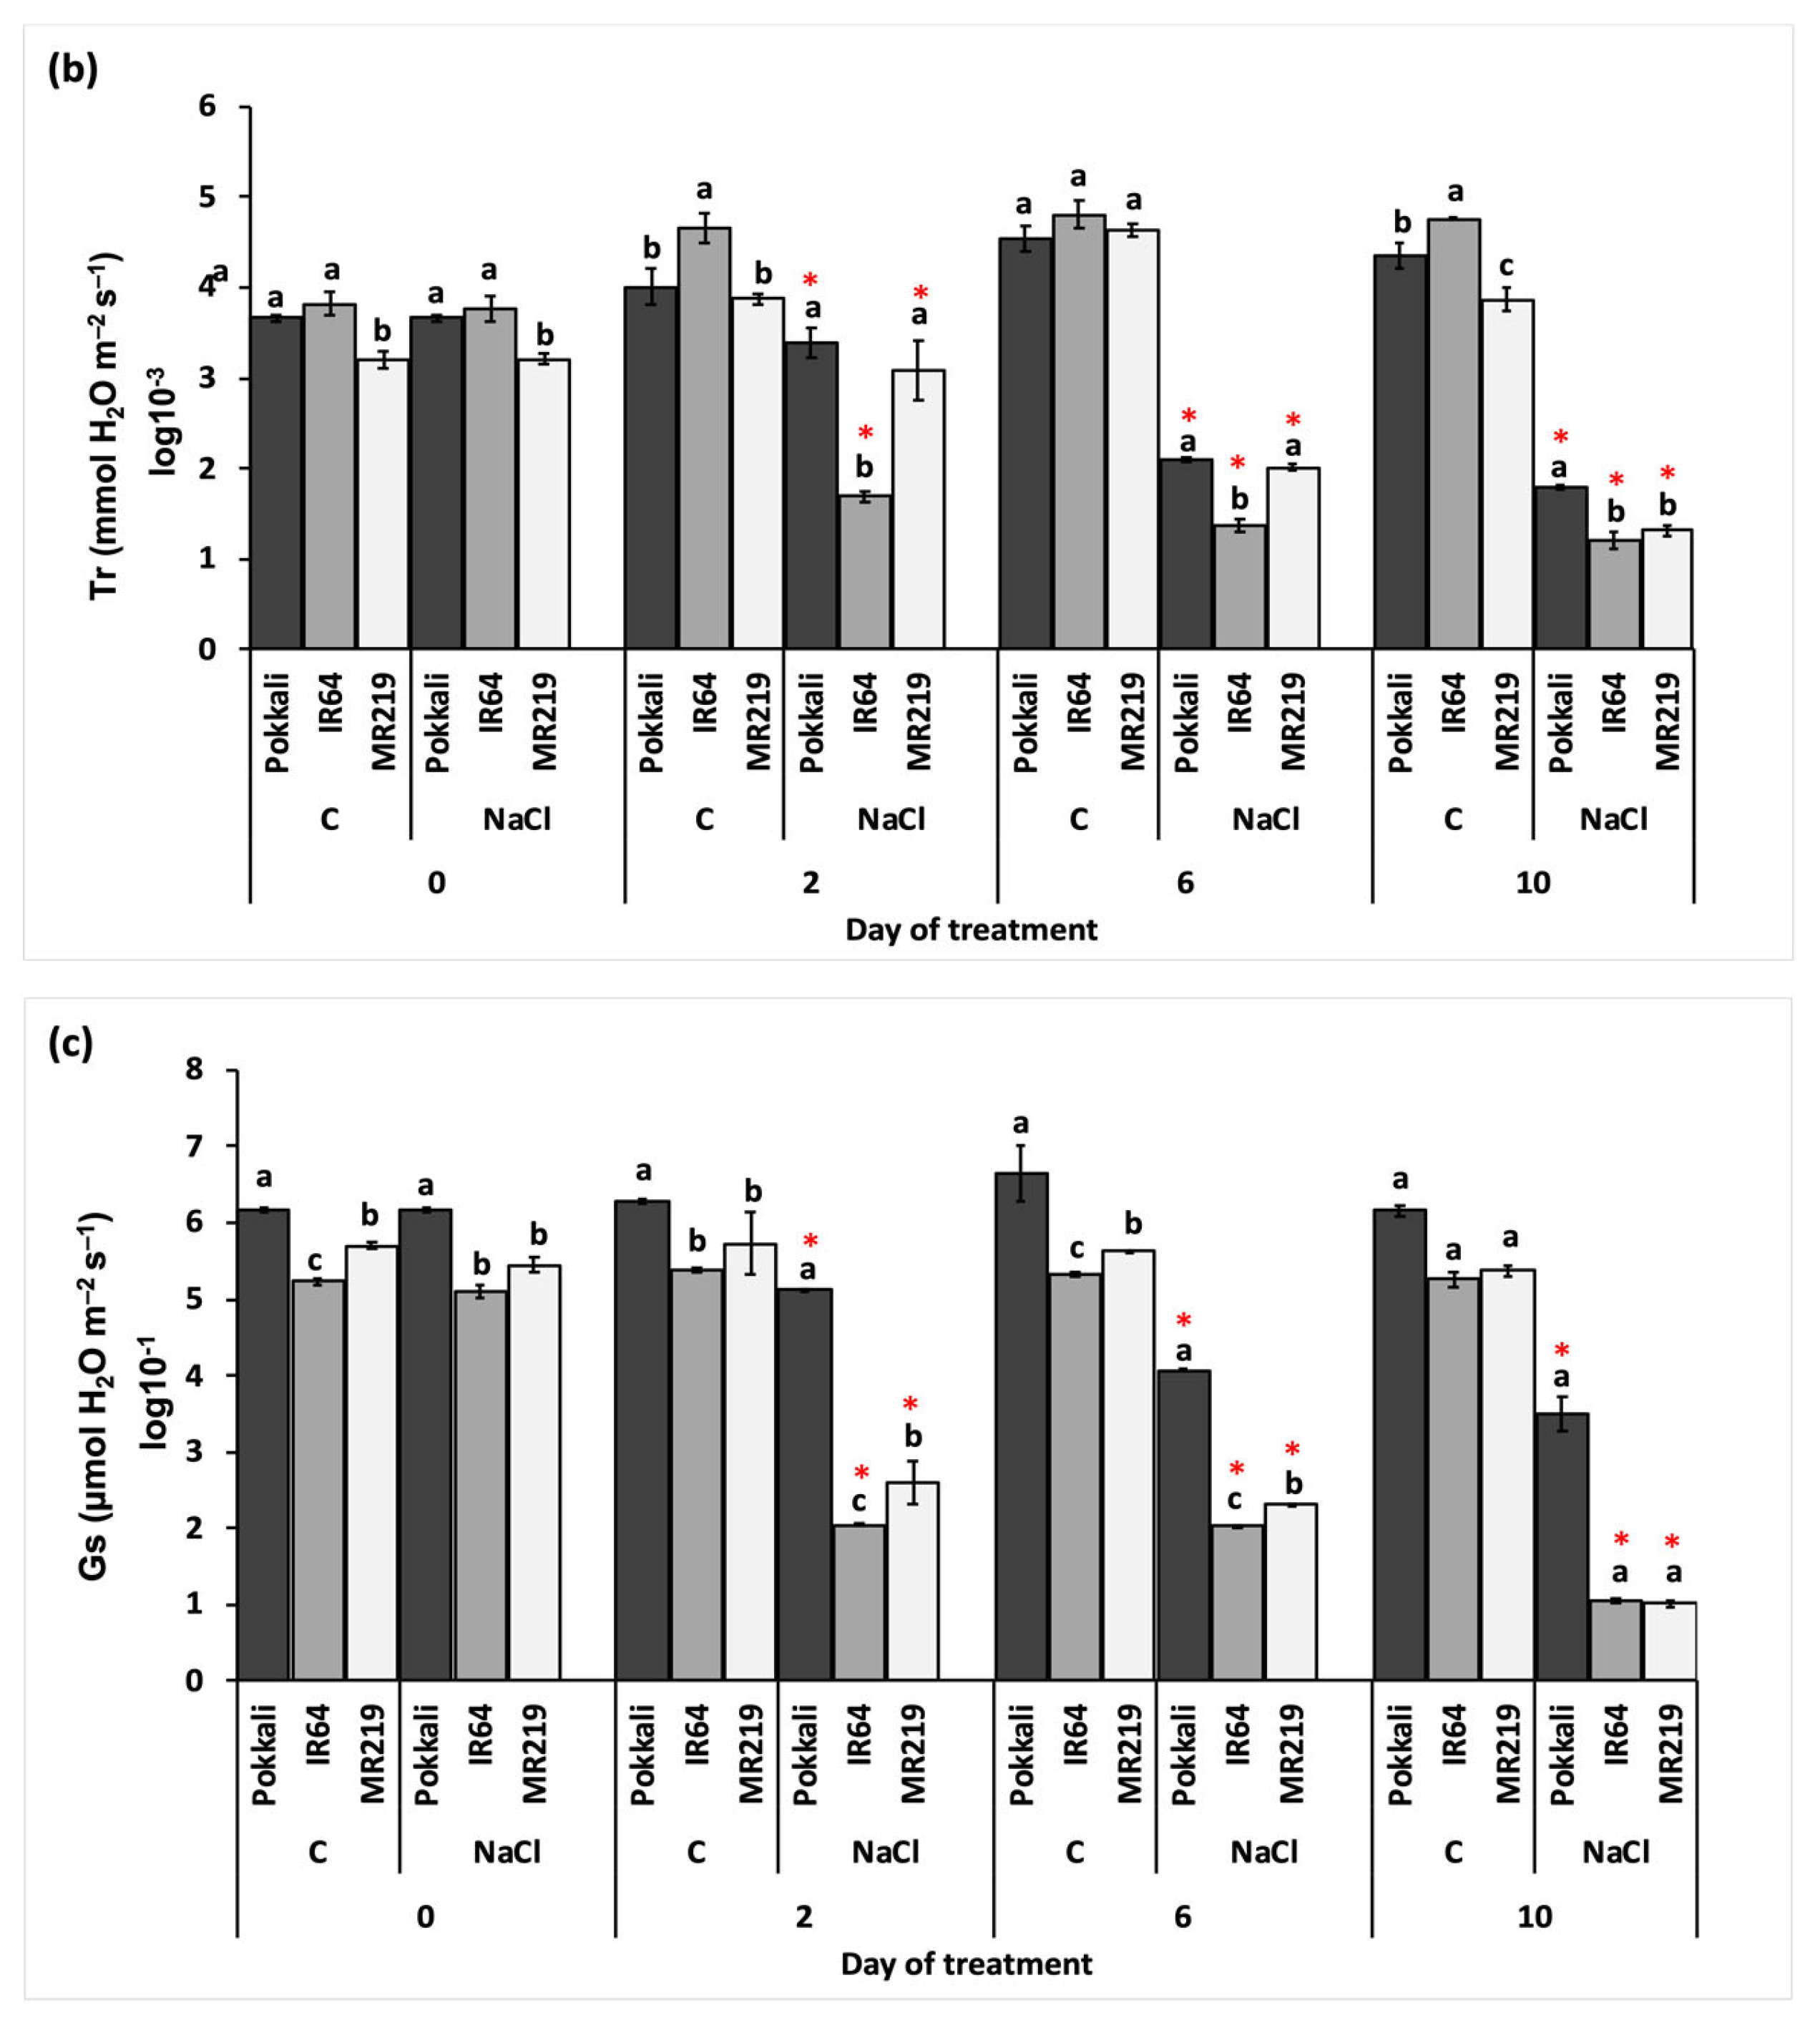
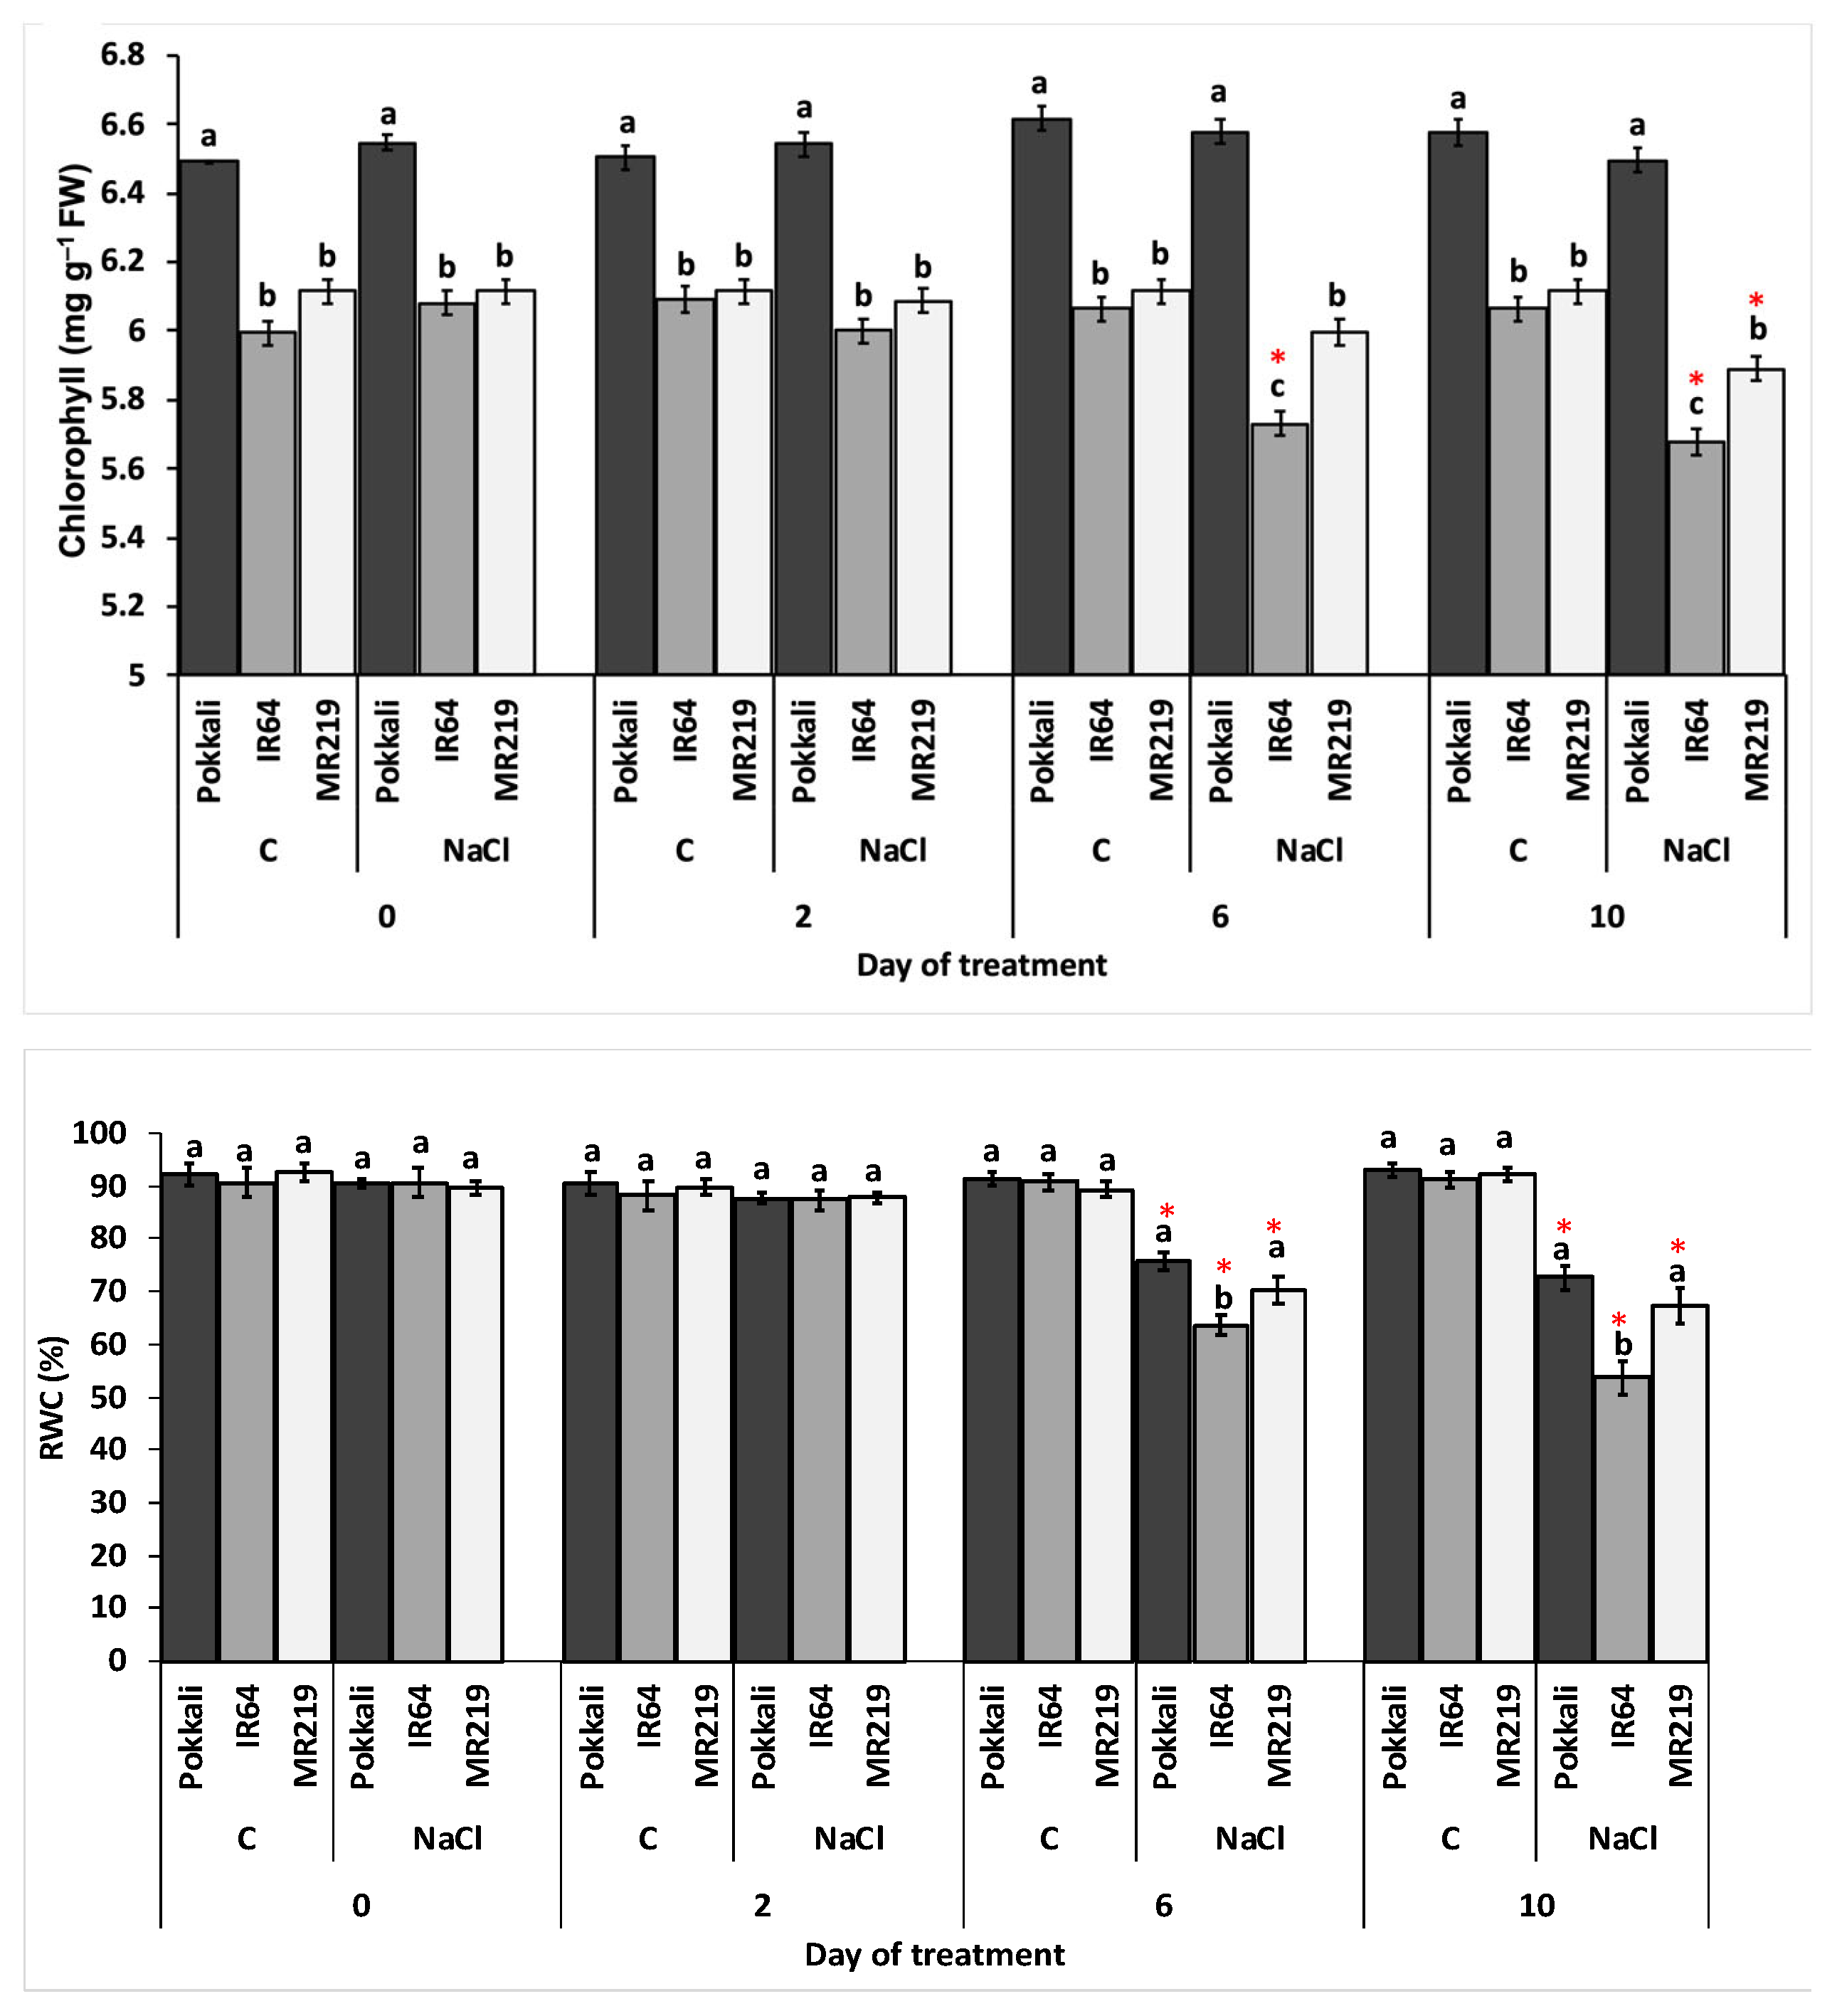
Salinity causes a decrease in water potential, which induces cell dehydration, including that of guard cells on the leaf. This phenomenon causes the stomatal aperture to close during salinity stress, which helps to reduce water loss from the leaf tissues and maintain osmotic homeostasis [44,52]. With a decrease in leaf surface area and the number of leaves, the decrease in stomatal conductance due to stomatal closure indirectly reduces the plants’ overall photosynthesis rate and transpiration rate [53]. Similar results were observed when other plant species were subjected to salinity stress [10,54]. As previously suggested [55,56], the decrease in stomatal conductance may contribute to plant survival against salinity by maintaining cellular osmotic homeostasis and reducing toxic ion translocation through transpiration flow. Regulation of leaf osmotic potential has an indirect effect on leaf RWC. At the end of treatment, only Pokkali and MR219 managed to retain RWC readings above 70%. This finding suggests that Pokkali and MR219 maintain osmotic homeostasis better than IR64 under salinity stress. Aside from stomatal closure, the decline in gaseous exchange activities could be attributed to the high concentrations of soluble ions (e.g., Na+ and Cl) that damage the thylakoid membrane in the chloroplast [57].
The increased toxicity caused by ROS accumulation damages plant tissues and organelles, disrupting biological processes critical for survival, including photosynthesis and carbon metabolism. The decrease in chlorophyll content in the leaf sample could be attributed to ROS toxicity. In this study, the early and greatest reduction in chlorophyll observed in IR64 from days 6 to 10 may contribute to the photosynthesis rate reduction under stress. Despite the decrease in photosynthesis rate, there were no significant changes in chlorophyll content in Pokkali and, to a lesser extent, MR219. In this case, the decrease in photosynthesis rate in Pokkali and MR219 could be attributed to a decrease in stomatal conductance and transpiration rate or inhibition of related biochemical processes such as carbon dioxide assimilation [58]. Salinity also affects the photosynthates allocation within plants, which influences plant growth and maintenance under stress. Photosynthates may act as osmolytes to combat osmotic pressure, allowing the plant to tolerate salinity [59,60]. This may explain Pokkali’s superior growth performance in terms of morpho-physiological traits and the gaseous exchange rate when compared to MR219 and IR64 under normal and salinity-treated conditions.
To understand the biological mechanism underlying the changes in plants morpho-physiology under salinity, we also investigated the expression of genes involved in plant tolerance mechanisms against salinity. Among the wide range of pathways and mechanisms involved in plant responses and tolerance against salinity, GABA metabolism, ion transport, and detoxification are considered key mechanisms and have been highly studied among researchers [61,62,63]. It was found that the GABA shunt may provide an alternative carbon source in the TCA cycle when part of the TCA cycle is perturbed or downregulated during salinity stress [64]. Previous research has also shown that salinity-tolerant wheat plants show upregulation of transcript encoding components of the GABA shunt pathway upon salinity treatment [65]. Moreover, according to Shetewy et al. [62], exogenous application of GABA improves rice growth performance and tolerance against salinity stress. To the best of our knowledge, however, reports on the activity of components involved in the GABA shunt pathway, specifically in rice, are still scarce and have yet to be carried out.
In this study, treated rice plants showed increases in GABA-T1, GAD2, and SSADH expression at least once during the treatment period in MR219, Pokkali, and IR64. Pokkali and MR219, specifically, managed to maintain their high expression levels of those genes at the end of treatment, despite a slight downregulation during the stress. In contrast, expression in IR64 plummeted significantly after 10 days of treatment, suggesting that the anaplerotic function of the GABA shunt is important in conferring salinity stress tolerance in rice. This may also explain the low level of tolerance in IR64, which may be attributed to the low energy level supporting the stress-tolerance mechanism for survival under stress. This notion is in agreement with previous research, which found a decrease in salinity tolerance in plants with mutated genes encoding GABA-shunt pathway components [66,67]. Aside from that, salinity enhances the expression of genes involved in ion transport. SOS2 expression increased significantly in MR219, Pokkali, and IR64, especially after 2 days of treatment. This rapid response demonstrates rice plants’ critical response to maintaining ionic homeostasis under stress. The expression, however, decreased over time, especially in IR64. This could be due to degradation or damage by ROS, which affects the ion transport activities in IR64. As demonstrated by Pokkali, the ability to maintain high SOS2 expression throughout stress reflects plant tolerance to salinity
There was a significant increase in the expression of genes encoding enzymatic antioxidants such as CuZnSOD, MnSOD, and CAT in Pokkali, MR219, and IR64. These antioxidants are essential for detoxification and protection against oxidative damage caused by ROS accumulation [68,69]. CuZnSOD1 overexpression under stress in all varieties suggests ROS scavenging mechanisms in the cytosol, chloroplast, and peroxisome [70,71]. Pokkali maintains high CuZnSOD activities throughout the treatment period, whereas MR219 and IR64 have CuZnSOD1 expression downregulated as the treatment progresses. This observation corresponds to Pokkali’s high photosynthesis rate and chlorophyll content, as previously discussed. Meanwhile, MnSOD1 expression increased in all varieties, indicating an improvement in the ROS scavenging mechanism in the mitochondria and peroxisomes [72]. The correlation between increased activity and/or expression of these genes with tolerance to salinity is discussed in previous studies [73,74,75]. Besides SOD, salinity affects the expression of genes encoding CAT. According to Ighodaro and Akinloye [76] and Poli et al. [77], SOD activity is positively correlated with CAT, which is involved in the conversion of H2O2 into water. There was an increase in CAT1 expression in MR219, Pokkali, and IR64 under stress. This suggests that the plant response improves the scavenging mechanism for photorespiratory products such as H2O2 [78]. In contrast to CuZnSOD1 and MnSOD1 expression, transcription of CAT1 decreases with treatment duration for all varieties. This could be attributed to the plant’s inability to counter the damaging effects of excess H2O2 produced by photorespiration or even SOD action. It also indicates that CAT activities are independent of SODs and differ among plant species. Overall, increased antioxidant activities improve the ability of plants to limit oxidative damage, resulting in salinity tolerance.
This study provides a focused comparative study on effects of salinity towards germination, morpho-physiological traits, and stress-related gene expression of MR219 with salinity-tolerant Pokkali and salinity-susceptible IR64 varieties. Compared to previous studies, the data collected show changes in the parameters at different time-points throughout the treatment period, allowing us to identify the plant responses against osmotic and ionic stress. It also enables us to determine the changes in the expression of selected stress-related genes encoding components that may involve in MR219 tolerance activity against salinity, for example components that involved GABA shunt pathways, which is novel in rice studies. Furthermore, the changes in morphological traits and transcriptome analysis of MR219, Pokkali, and IR64 in response to salinity will provide a baseline for comparison in future investigations through other omics platforms such as proteomics and metabolomics. This allows us to identify the target gene/protein/metabolite involved in plant responses and salinity tolerance mechanisms, which can then be followed up with functional studies. This is significant since MR219 is one of the elite varieties that has been widely distributed in Malaysia. As a result, any research aimed at improving the performance of local rice crops is critical.

5. Conclusions

This study demonstrates that high salinity (>120 mM NaCl) causes detrimental effects on the germination of MR219, and long-term exposure to saline conditions (100 mM NaCl) during the vegetative stage significantly disrupts rice plant growth and development in terms of plant height, biomass, and leaf surface area in all varieties. Significant changes in the shoot-to-root ratio were also observed, with salinity seeming to affect the growth of the root more than the shoot in Pokkali and MR219, and vice versa for IR64. Besides, Pokkali also exhibits significant decreases in the number of leaves and nodes under salinity as compared to MR219 and IR64. These changes in growth traits could be attributed to a disruption in photosynthetic activity caused by a decrease in stomatal conductance and transpiration rate of the treated leaves. The reduction in photosynthetic activity may result in disruption of growth-related metabolic processes. PCA analysis of the morpho-physiological parameters reveals that Pokkali has the highest tolerance against salinity, followed by MR219, and IR64 is the most salinity-susceptible among the three varieties. According to the findings of the stress-related gene expression studies, there was upregulation of transcript-level encoding genes such as GABA, SSADH, and GAD, at least at one time-point during the treatment period. Salinity tolerant varieties such as Pokkali, and even MR219 to an extent, managed to maintain a high level of those transcripts at the end of treatment, as opposite to IR64. This may explain the plants’ abilities to modulate efficient GABA metabolism, ion transport, and antioxidant activity under stress, and could contribute to differences in salinity tolerance among different varieties.

Supplementary Materials

The following supporting information can be downloaded at: https://www.mdpi.com/article/10.3390/agriculture12050638/s1, Table S1: Loadings for the three first components acquired through PCA, Figure S1: Component plot for each parameter based on PC1 and PC2, Figure S2: Gel electrophoresis for the targeted genes viewed under UV.

Author Contributions

Conceptualization, T.S., M.H.C.-O. and Z.Z.; methodology, T.S. and M.H.C.-O.; software, T.S.; validation, T.S. and Z.Z.; formal analysis, T.S.; investigation, T.S.; resources, Z.Z., M.H.C.-O., N.M.I. and N.L.S.; data curation, T.S.; writing—original draft preparation, T.S.; writing—review and editing, Z.Z., M.H.C.-O., N.M.I. and N.L.S.; visualization, T.S.; supervision, Z.Z.; project administration, Z.Z.; funding acquisition, Z.Z. All authors have read and agreed to the published version of the manuscript.

Funding

This research was funded by Dana Impak Perdana (DIP-2019-031).

Institutional Review Board Statement

Not applicable.

Informed Consent Statement

Not applicable.

Data Availability Statement

Not applicable.

Acknowledgments

The authors would like to acknowledge Universiti Kebangsaan Malaysia (UKM) for providing the grant for this study.

Conflicts of Interest

The authors declare no conflict of interest.

References

  1. Ghosh, B.; Ali, M.N. Response of rice under salinity stress: A review update. Rice Res. Open Access 2016, 4, 2–9. [Google Scholar] [CrossRef] [Green Version]
  2. Rathna-Priya, T.S.; Eliazer-Nelson, A.R.L.; Ravichandran, K.; Antony, U. Nutritional and functional properties of coloured rice varieties of South India: A review. J. Ethn. Foods 2019, 6, 11. [Google Scholar] [CrossRef] [Green Version]
  3. Riaz, M.; Arif, M.S.; Ashraf, M.A.; Mahmood, R.; Yasmeen, T.; Shakoor, M.B.; Shahzad, S.M.; Ali, M.; Saleem, I.; Arif, M.; et al. A comprehensive review on rice responses and tolerance to salt stress. In Advances in Rice Research for Abiotic Stress Tolerance; Woodhead Publishing: Cambridge, UK, 2019; pp. 133–158. [Google Scholar]
  4. Shrivastava, P.; Kumar, R. Soil salinity: A serious environmental issue and plant growth promoting bacteria as one of the tools for its alleviation. Saudi J. Biol. Sci. 2015, 22, 123–131. [Google Scholar] [CrossRef] [PubMed] [Green Version]
  5. Kumar, P.; Sharma, P.K. Soil salinity and food security in India. Front. Sustain. Food Syst. 2020, 4, 533781. [Google Scholar] [CrossRef]
  6. Machado, R.; Serralheiro, R. Soil salinity: Effect on vegetable crop growth. Management practices to prevent and mitigate soil salinization. Horticulturae 2017, 3, 30. [Google Scholar] [CrossRef]
  7. Shaban, M. Effect of water and temperature on seed germination and emergence as a seed hydrothermal time model. Int. J. Adv. Biol. Biomed. Res. 2013, 1, 1686–1691. [Google Scholar]
  8. Quan, R.; Wang, J.; Hui, J.; Bai, H.; Lyu, X.; Zhu, Y.; Zhang, H.; Zhang, Z.; Li, S.; Huang, R. Improvement of salt tolerance using wild rice genes. Front. Plant Sci. 2018, 8, 2269. [Google Scholar] [CrossRef] [Green Version]
  9. Sultana, N.; Ikeda, T.; Itoh, R. Effect of NaCl salinity on photosynthesis and dry matter accumulation in developing rice grains. Environ. Exp. Bot. 1999, 42, 211–220. [Google Scholar] [CrossRef]
  10. Irakoze, W.; Prodjinoto, H.; Nijimbere, S.; Rufyikiri, G.; Lutts, S. NaCl and Na2SO4 salinities have different impact on photosynthesis and yield-related parameters in rice (Oryza sativa L.). Agronomy 2020, 10, 864. [Google Scholar] [CrossRef]
  11. Hossain, M.S.; Shah, J.S.A. Present scenario of global salt affected soils, its management and Importance of salinity research. Int. Res. J. Biol. Sci. Perspect. 2019, 1, 1–3. [Google Scholar]
  12. Papageorgiou, G.C.; Murata, N. The unusually strong stabilizing effects of glycine betaine on the structure and function of the oxygen-evolving Photosystem II complex. Photosynth. Res. 1995, 44, 243–252. [Google Scholar] [CrossRef] [PubMed]
  13. Shahid, M.A.; Sarkhosh, A.; Khan, N.; Balal, R.M.; Ali, S.; Rossi, L.; Gomez, C.; Mattson, N.; Nasim, W.; Garcia-Sanchez, F. Insights into the physiological and biochemical impacts of salt stress on plant growth and development. Agronomy 2020, 10, 938. [Google Scholar] [CrossRef]
  14. Che-Othman, M.H.; Millar, A.H.; Taylor, N.L. Connecting salt stress signalling pathways with salinity-induced changes in mitochondrial metabolic processes in C3 plants. Plant Cell Environ. 2017, 40, 2875–2905. [Google Scholar] [CrossRef] [PubMed] [Green Version]
  15. Basu, S.; Roychoudhury, A. Transcript profiling of stress-responsive genes and metabolic changes during salinity in indica and japonica rice exhibit distinct varietal difference. Physiol. Plant 2021, 173, 1434–1447. [Google Scholar] [CrossRef] [PubMed]
  16. Keisham, M.; Mukherjee, S.; Bhatla, S.C. Mechanisms of sodium transport in plants—progresses and challenges. Int. J. Mol. Sci. 2018, 19, 647. [Google Scholar] [CrossRef] [Green Version]
  17. Brindha, C.; Vasantha, S.; Raja, A.K.; Tayade, A.S. Characterization of the Salt Overly Sensitive pathway genes in sugarcane under salinity stress. Physiol. Plant 2021, 171, 677–687. [Google Scholar] [CrossRef]
  18. Tang, J.; Wang, S.Q.; Hu, K.D.; Huang, Z.Q.; Li, Y.H.; Han, Z.; Chen, X.Y.; Hu, L.Y.; Yao, G.F.; Zhang, H. Antioxidative capacity is highly associated with the storage property of tuberous roots in different sweetpotato cultivars. Sci. Rep. 2019, 9, 11141. [Google Scholar] [CrossRef] [Green Version]
  19. Zuraida, A.R.; Zulkifli, A.S.; Habibuddin, H.; Naziah, B. Regeneration of Malaysian rice variety MR 219 via somatic embryogenesis. J. Trop. Agric. Fd. Sc. 2012, 39, 167–177. [Google Scholar]
  20. Talei, D.; Valdiani, A.; Maziah, M.; Mohsenkhah, M. Germination response of MR 219 rice variety to different exposure times and periods of 2450 MHz microwave frequency. Sci. World J. 2013, 2013, 408026. [Google Scholar] [CrossRef]
  21. Ahmed, F.; Rafii, M.Y.; Ismail, M.R.; Juraimi, A.S.; Rahim, H.A.; Latif, M.A.; Hasan, M.M.; Tanweer, F.A. The addition of submergence-tolerant Sub1 gene into high yielding MR219 rice variety and analysis of its BC2F3 population in terms of yield and yield contributing characters to select advance lines as a variety. Biotechnol. Biotechnol. Equip. 2016, 30, 853–863. [Google Scholar] [CrossRef] [Green Version]
  22. Zulkarnain, W.M.; Ismail, M.R.; Ashrafuzzaman, M.; Saud, H.M.; Haroun, I.C. Growth, physiological and biochemical responses of malaysia rice cultivars to water stress. Pertanika J. Trop. Agric. Sci. 2009, 32, 323–333. [Google Scholar]
  23. Yadav, P.; Singh, P.; Yadav, B.; Pandey, S.; Singh, V.; Dwivedi, D.K. Evaluation of rice genotypes for salinity tolerance at seedling stage. J. Pharmacogn. Phytochem. 2018, 7, 202–205. [Google Scholar]
  24. Lakra, N.; Kaur, C.; Singla-Pareek, S.L.; Pareek, A. Mapping the ‘early salinity response’ triggered proteome adaptation in contrasting rice genotypes using iTRAQ approach. Rice 2019, 12, 3. [Google Scholar] [CrossRef] [PubMed]
  25. Noorzuraini, A.R.S.; Ramdzan, O.M.; Idayu, A.R.N.; Hafiz, M.S.M. Evaluating the rice germplasm for salinity tolerance based on phenotypic traits. In IOP Conference Series: Earth and Environmental Science, Proceedings of the International Conference on Biodiversity 2020, Melaka, Malaysia, 4–5 November 2020; IOP Publishing: Bristol, UK, 2021; Volume 736. [Google Scholar]
  26. Polash, M.A.S.; Sakil, M.A.; Tahjib-Ul-Arif, M.; Hossain, M.A. Effect of salinity on osmolytes and relative water content of selected rice genotypes. Trop. Plant Res. 2018, 5, 227–232. [Google Scholar] [CrossRef]
  27. Hakim, M.A.; Juraimi, A.S.; Begum, M.; Hanafi, M.M.; Ismail, M.R.; Selamat, A. Effect of salt stress on germination and early seedling growth of rice (Oryza sativa L.). Afr. J. Biotechnol. 2010, 9, 1911–1918. [Google Scholar]
  28. Bado, S.; Forster, B.P.; Ghanim, A.M.A.; Jankowicz-Cieslak, J.; Berthold, G.; Liu, L.X. Protocol for screening for salt tolerance in rice. In Protocols for Pre-Field Screening of Mutants for Salt Tolerance in Rice, Wheat and Barley; Springer: Cham, Switzerland, 2016; pp. 21–31. [Google Scholar]
  29. Hu, X.; Tanaka, A.; Tanaka, R. Simple extraction methods that prevent the artifactual conversion of chlorophyll to chlorophyllide during pigment isolation from leaf samples. Plant Methods 2013, 9, 19. [Google Scholar] [CrossRef] [Green Version]
  30. Shibghatallah, M.A.H.; Khotimah, S.N.; Suhandono, S.; Viridi, S.; Kesuma, T. Measuring leaf chlorophyll concentration from its color: A way in monitoring environment change to plantations. In AIP Conference Proceedings, Proceedings of the Padjadjaran International Physics Symposium 2013 (PIPS-2013), Sumedang, Indonesia, 7–9 May 2013; AIP Publishing: Long Island, NY, USA, 2013; Volume 1554, pp. 210–213. [Google Scholar]
  31. Turner, N.C. Techniques and experimental approaches for the measurement of plant water status. Plant Soil 1981, 58, 339–366. [Google Scholar] [CrossRef]
  32. Liu, L.; Xia, W.; Li, H.; Zeng, H.; Wei, B.; Han, S.; Yin, C. Salinity inhibits rice seed germination by reducing α-amylase activity via decreased bioactive gibberellin content. Front. Plant Sci. 2018, 9, 275. [Google Scholar] [CrossRef]
  33. Fogliatto, S.; Serra, F.; Patrucco, L.; Milan, M.; Vidotto, F. Effect of different water salinity levels on the germination of imazamox-resistant and sensitive weedy rice and cultivated rice. Agronomy 2019, 9, 658. [Google Scholar] [CrossRef] [Green Version]
  34. Panuccio, M.R.; Jacobsen, S.E.; Akhtar, S.S.; Muscolo, A. Effect of saline water on seed germination and early seedling growth of the halophyte quinoa. AoB Plants 2014, 6, plu047. [Google Scholar] [CrossRef]
  35. Zhang, H.; Irving, L.J.; McGill, C.; Matthew, C.; Zhou, D.; Kemp, P. The effects of salinity and osmotic stress on barley germination rate: Sodium as an osmotic regulator. Annals Bot. 2010, 106, 1027–1035. [Google Scholar] [CrossRef] [PubMed]
  36. Roy, P.R.; Tahjib-Ul-Arif, M.; Polash, M.A.S.; Hossen, M.Z.; Hossain, M.A. Physiological mechanisms of exogenous calcium on alleviating salinity-induced stress in rice (Oryza sativa L.). Physiol. Mol. Biol. Plants 2019, 25, 611–624. [Google Scholar] [CrossRef] [PubMed]
  37. Singh, A.; Singh, A.; Pandey, A.K.; Singh, A.K.; Singh, R.; Singh, A.; Yadav, R.K. Effect salinity on germination percentage (%) and seed vigour index of rice (Oryza sativa L.). J. Pharmacogn. Phytochem. 2020, 9, 1130–1133. [Google Scholar] [CrossRef]
  38. Singh, R.K.; Kota, S.; Flowers, T.J. Salt tolerance in rice: Seedling and reproductive stage QTL mapping come of age. Theor. Appl. Genet. 2021, 134, 3495–3533. [Google Scholar] [CrossRef]
  39. Prajapati, K.; Modi, H.A. The importance of potassium in plant growth—A review. Indian J. Plant Sci. 2012, 1, 2319–3824. [Google Scholar]
  40. Kakar, N.; Jumaa, S.H.; Redoña, E.D.; Warburton, M.L.; Reddy, K.R. Evaluating rice for salinity using pot-culture provides a systematic tolerance assessment at the seedling stage. Rice 2019, 12, 57. [Google Scholar] [CrossRef] [Green Version]
  41. Asch, F.; Wopereis, M.C.S. Responses of field-grown irrigated rice cultivars to varying levels of floodwater salinity in a semi-arid environment. Field Crop Res. 2001, 70, 127–137. [Google Scholar] [CrossRef]
  42. Albacete, A.; Ghanem, M.E.; Martínez-Andújar, C.; Acosta, M.; Sánchez-Bravo, J.; Martínez, V.; Lutts, S.; Dodd, I.C.; Perez-Alfocea, F. Hormonal changes in relation to biomass partitioning and shoot growth impairment in salinized tomato (Solanum lycopersicum L.) plants. J. Exp. Bot. 2008, 59, 4119–4131. [Google Scholar] [CrossRef]
  43. Sánchez-Blanco, M.J.; Rodríguez, P.; Olmos, E.; Morales, M.A.; Torrecillas, A. Differences in the effects of simulated sea aerosol on water relations, salt content, and leaf ultrastructure of Rock-Rose plants. J. Environ. Qual. 2004, 33, 1369–1375. [Google Scholar] [CrossRef] [Green Version]
  44. Acosta-Motos, J.R.; Ortuño, M.F.; Bernal-Vicente, A.; Diaz-Vivancos, P.; Sanchez-Blanco, M.J.; Hernandez, J.A. Plant responses to salt stress: Adaptive mechanisms. Agronomy 2017, 7, 18. [Google Scholar] [CrossRef] [Green Version]
  45. Dalton, F.N.; Maggio, A.; Piccinni, G. Simulation of shoot chloride accumulation: Separation of physical and biochemical processes governing plant salt tolerance. Plant Soil 2000, 219, 1–11. [Google Scholar] [CrossRef]
  46. Kazemi, S.; Eshghizadeh, H.R.; Zahedi, M. Responses of four rice varieties to elevated CO2 and different salinity levels. Rice Sci. 2018, 25, 142–151. [Google Scholar] [CrossRef]
  47. Siregar, M.P.A.; Hanum, C.; Siregar, L.A.M.; Tistama, R. Morphological and physiological performance of brown rice (Oryza nivara L.) under salinity stress. SABRAO J. Breed. Genet. 2021, 53, 228–239. [Google Scholar]
  48. Seo, D.H.; Seomun, S.; Choi, Y.D.; Jang, G. Root development and stress tolerance in rice: The key to improving stress tolerance without yield penalties. Int. J. Mol. Sci. 2020, 21, 1807. [Google Scholar] [CrossRef] [Green Version]
  49. Safitri, H.; Purwoko, B.S.; Dewi, I.S.; Ardie, S.W. Salinity tolerance of several rice genotypes at seedling stage. Indones. J. Agric. Sci. 2018, 18, 63. [Google Scholar] [CrossRef] [Green Version]
  50. Maggio, A.; Raimondi, G.; Martino, A.; De Pascale, S. Salt stress response in tomato beyond the salinity tolerance threshold. Environ. Exp. Bot. 2007, 59, 276–282. [Google Scholar] [CrossRef]
  51. Pattanagul, W.; Thitisaksakul, M. Effect of salinity stress on growth and carbohydrate metabolism in three rice (Oryza sativa L.) cultivars differing in salinity tolerance. Indian J. Exp. Biol. 2008, 46, 736–742. [Google Scholar]
  52. Song, X.J.; Matsuoka, M. Bar the windows: An optimized strategy to survive drought and salt adversities. Genes Dev. 2009, 23, 1709–1713. [Google Scholar] [CrossRef] [Green Version]
  53. Safdar, H.; Amin, A.; Shafiq, Y.; Ali, A.; Yasin, R. A review: Impact of salinity on plant growth. Nat. Sci. 2019, 17, 34–40. [Google Scholar]
  54. Xu, N.; Chu, Y.; Chen, H.; Li, X.; Wu, Q.; Jin, L.; Wang, G.; Huang, J. Rice transcription factor OsMADS25 modulates root growth and confers salinity tolerance via the ABA–mediated regulatory pathway and ROS scavenging. PLoS Genet. 2018, 14, e100766. [Google Scholar] [CrossRef] [Green Version]
  55. Kerstiens, G.; Tych, W.; Robinson, M.F.; Mansfield, T.A. Sodium-related partial stomatal closure and salt tolerance of Aster tripolium. New Phytol. 2002, 153, 509–515. [Google Scholar] [CrossRef] [PubMed]
  56. Li, J.; Li, Y.; Yin, Z.; Jiang, J.; Zhang, M.; Guo, X.; Ye, Z.; Zhao, Y.; Xiong, H.; Zhang, Z.; et al. OsASR5 enhances drought tolerance through a stomatal closure pathway associated with ABA and H2O2 signalling in rice. Plant Biotechnol. J. 2017, 15, 183–196. [Google Scholar] [CrossRef] [PubMed]
  57. Srivastava, S.; Sharma, P.K. Effect of NaCl on chlorophyll fluorescence and thylakoid membrane proteins in leaves of salt sensitive and tolerant rice (Oryza sativa L) varieties. J. Stress Physiol. Biochem. 2021, 17, 35–44. [Google Scholar]
  58. Wang, X.; Wang, W.; Huang, J.; Peng, S.; Xiong, D. Diffusional conductance to CO2 is the key limitation to photosynthesis in salt-stressed leaves of rice (Oryza sativa). Physiol. Plant 2018, 163, 45–58. [Google Scholar] [CrossRef] [PubMed] [Green Version]
  59. Rahman, A.; Nahar, K.; Al-Mahmud, J.; Hasanuzzaman, M.; Hossain, M.S.; Fujita, M. Salt stress tolerance in rice: Emerging role of exogenous phytoprotectants. In Advances in International Rice Research; IntechOpen: Rijeka, Croatia, 2017; pp. 139–174. [Google Scholar]
  60. Jogawat, A. Osmolytes and their role in abiotic stress tolerance in plants. In Molecular Plant Abiotic Stress: Biology and Biotechnology; Wiley: Hoboken, NJ, USA, 2019; pp. 91–104. [Google Scholar]
  61. Razzaque, S.; Elias, S.M.; Haque, T.; Biswas, S.; Jewel, G.M.N.A.; Rahman, S.; Weng, X.; Ismail, A.M.; Walia, H.; Juenger, T.E.; et al. Gene Expression analysis associated with salt stress in a reciprocally crossed rice population. Sci. Rep. 2019, 9, 8249. [Google Scholar] [CrossRef] [PubMed] [Green Version]
  62. Sheteiwy, M.S.; Shao, H.; Qi, W.; Hamoud, Y.A.; Shaghaleh, H.; Khan, N.U.; Yang, R.; Tang, B. GABA-alleviated oxidative injury induced by salinity, osmotic stress and their combination by regulating cellular and molecular signals in rice. Int. J. Mol. Sci. 2019, 20, 5709. [Google Scholar] [CrossRef] [Green Version]
  63. Challabathula, D.; Analin, B.; Mohanan, A.; Bakka, K. Differential modulation of photosynthesis, ROS and antioxidant enzyme activities in stress-sensitive and -tolerant rice cultivars during salinity and drought upon restriction of COX and AOX pathways of mitochondrial oxidative electron transport. J. Plant Physiol. 2022, 268, 153583. [Google Scholar] [CrossRef]
  64. Che-Othman, M.H.; Jacoby, R.P.; Millar, A.H.; Taylor, N.L. Wheat mitochondrial respiration shifts from the tricarboxylic acid cycle to the GABA shunt under salt stress. New Phytol. 2020, 225, 1166–1180. [Google Scholar] [CrossRef]
  65. Renault, H.; Roussel, V.; El Amrani, A.; Arzel, M.; Renault, D.; Bouchereau, A.; Deleu, C. The Arabidopsis pop2-1mutant reveals the involvement of GABA transaminase in salt stress tolerance. BMC Plant Biol. 2010, 10, 20. [Google Scholar] [CrossRef] [Green Version]
  66. Zhang, M.; Liu, Z.; Fan, Y.; Liu, C.; Wang, H.; Li, Y.; Xin, Y.; Gai, Y.; Ji, Z. Characterization of GABA-transaminase gene from mulberry (Morus multicaulis) and its role in salt stress tolerance. Genes 2022, 13, 501. [Google Scholar] [CrossRef]
  67. Su, N.; Wu, Q.; Chen, J.; Shabala, L.; Mithöfer, A.; Wang, H.; Qu, M.; Yu, M.; Cui, J.; Shabala, S. GABA operates upstream of H+-ATPase and improves salinity tolerance in Arabidopsis by enabling cytosolic K+ retention and Na+ exclusion. J. Exp. Bot. 2019, 70, 6349–6361. [Google Scholar] [CrossRef] [PubMed]
  68. Xu, J.; Kang, Z.; Zhu, K.; Zhao, D.; Yuan, Y.; Yang, S.; Zhen, W.; Hu, X. RBOH1-dependent H2O2 mediates spermine-induced antioxidant enzyme system to enhance tomato seedling tolerance to salinity–alkalinity stress. Plant Physiol. Biochem. 2021, 164, 237–246. [Google Scholar] [CrossRef] [PubMed]
  69. Golnari, S.; Vafaee, Y.; Nazari, F.; Ghaderi, N. Gamma-aminobutyric acid (GABA) and salinity impacts antioxidative response and expression of stress-related genes in strawberry cv. Aromas. Braz. J. Bot. 2021, 44, 639–651. [Google Scholar] [CrossRef]
  70. Bobrovskikh, A.; Zubairova, U.; Kolodkin, A.; Doroshkov, A. Subcellular compartmentalization of the plant antioxidant system: An integrated overview. PeerJ 2020, 8, e9451. [Google Scholar] [CrossRef]
  71. Corpas, F.J.; González-Gordo, S.; Palma, J.M. Plant peroxisomes: A factory of reactive species. Front. Plant Sci. 2020, 11, 853. [Google Scholar] [CrossRef]
  72. Tounsi, S.; Feki, K.; Kamoun, Y.; Saïdi, M.N.; Jemli, S.; Ghorbel, M.; Alcon, C.; Brini, F. Highlight on the expression and the function of a novel MnSOD from diploid wheat (T. monococcum) in response to abiotic stress and heavy metal toxicity. Plant Physiol. Biochem. 2019, 142, 384–394. [Google Scholar] [CrossRef]
  73. Shafi, A.; Mir, M.A.; Zahoor, I. Effect of salinity stress on germination, tolerance and antioxidant response in Arabidopsis thaliana overexpressing Cu/Zn-SOD. Int. J. Life Sci. Res. 2017, 5, 69–78. [Google Scholar]
  74. Lee, H.-J.; Yang, H.Y.; Choi, J.I. Study of functional verification to abiotic stress through antioxidant gene transformation of Pyropia yezoensis (Bangiales, Rhodophyta) APX and MnSOD in Chlamydomonas. J. Microbiol. Biotechnol. 2018, 28, 1217–1224. [Google Scholar] [CrossRef]
  75. Kumar, A.; Singh, S.; Mukherjee, A.; Rastogi, R.P.; Verma, J.P. Salt-tolerant plant growth-promoting Bacillus pumilus strain JPVS11 to enhance plant growth attributes of rice and improve soil health under salinity stress. Microbiol. Res. 2021, 242, 126616. [Google Scholar] [CrossRef]
  76. Ighodaro, O.; Akinloye, O. First line defence antioxidants-superoxide dismutase (SOD), catalase (CAT) and glutathione peroxidase (GPX): Their fundamental role in the entire antioxidant defence grid. Alex. J. Med. 2017, 54, 287–293. [Google Scholar] [CrossRef] [Green Version]
  77. Poli, Y.; Nallamothu, V.; Balakrishnan, D.; Ramesh, P.; Desiraju, S.; Mangrauthia, S.K.; Violeti, S.R.; Neelamraju, S. Increased catalase activity and maintenance of Photosystem II distinguishes high-yield mutants from low-yield mutants of rice var. Nagina22 under low-phosphorus stress. Front. Plant Sci. 2018, 9, 1543. [Google Scholar] [CrossRef] [PubMed] [Green Version]
  78. Zarifth Shafika, K.; Noraziyah, A.A.S.; Muhd Hafiz, C.O.; Shakri, T.; Tan, L.W.; Noor Liyana, S.; Isa, N.M.; Rahman, Z.A.; Zainal, Z. Morpho-physiology and antioxidant enzyme activities of transgenic rice plant overexpressing ABP57 under reproductive stage drought condition. Agronomy 2020, 10, 1530. [Google Scholar]
Figure 1. MR219 seedlings after 10 days of NaCl treatment.
Agriculture 12 00638 g001
Figure 2. Salinity effect on (a) photosynthesis rate (Pn), (b) transpiration rate (Tr), and (c) stomatal conductance (Gs) at four different time points. The small letter at the top of the bar indicates significant differences between varieties at the same time point, whereas (*) indicates significant differences in a variety between control and salinity-treated plants using the DNMRT analytical method with a p-value of 0.05. Error bar: Standard deviations (SD) of the means.
Agriculture 12 00638 g002aAgriculture 12 00638 g002b
Figure 3. Salinity effect on fifth-leaf chlorophyll and the relative water content of 15 leaf discs for each variety at four different time points. The small letter at the top of the bar indicates significant differences between varieties at the same time point, whereas (*) indicates that there are significant differences in a variety between control and salinity-treated plants using the DNMRT analytical method with a p-value of 0.05. Error bar = Standard deviations (SD) of the means.
Agriculture 12 00638 g003
Figure 4. Scatter plot of the first two principal components with all variables, showing the distribution of the samples on day 10 of salinity treatment: (C) control/normal condition, (S) saline condition.
Agriculture 12 00638 g004
Figure 5. Gene expression in Pokkali, IR64, and MR219 at four different time points under salinity treatment. The small letter at the top of the bars indicates that there are significant differences between different time points for the same variety based on the DNMRT analytical method with a p-value of 0.05. Error bar = Standard deviations (SD) of the means.
Agriculture 12 00638 g005
Table 1. Changes in seed germination and growth performance parameters of MR219 treated with different salt concentrations.
NaCl (mM)SG (d−1)GE (%)FGP (%)Shoot (cm)Root (cm)RWC (%)
05.07 (±1.12) a73.33 (±15.28) b73.33 (±15.28) b5.0 (±1.6) a5.5 (±1.0) a82.80 (±3.68) a,b
405.93 (±0.46) a86.67 (±5.77) a90.00 (±0.00) a2.0 (±0.9) b5.5 (±1.1) a91.93 (±8.63) a
805.75 (±0.15) a85.00 (±5.00) a,b90.00 (±0.00) a1.9 (±0.6) b2.0 (±0.2) b88.11 (±2.12) a
1203.97 (±0.38) b56.67 (±11.55) c66.67 (±5.77) b1.3 (±0.9) b,c0.5 (±0.1) c77.84 (±6.71) b
1600.33 (±0.31) c3.33 (±3.33) d6.67 (±5.77) c0.1 (±0.0) c0.0 (±0.0) c77.49 (±6.09) b
Mean4.2161.0065.332.12.786.63
CV (%)51.9553.8649.7295.9093.159.38
SG = germination rate, GE = germination energy, FGP = final germination percentage, PH = plant height, RL = root length, RWC = relative water content. Means ± SD (n = 15) followed by different letters within a column are significantly different from each other according to DNMRT at a p = 0.05 level.
Table 2. ANOVA result of growth parameters.
Source of VariationdfMean Square
PH (cm)SRB(g)LA (cm2)LNNN
Replication (R)31.840.210.010.720.040.09
Variety (V)26692.61 *11.43 *0.24 *2876.16 *3.82 *4.51 *
Day of treatment (T)32431.19 *2.69 *0.51 *972.27 *35.20 *2.12
Salinity (S)1602.00 *0.100.10667.82 *4.593.76
V×T6127.57 *0.140.06 *91.11 *0.350.50
V×S25.180.260.0610.830.780.32
T×S3190.21 *0.030.07 *228.86 *0.590.59
V×T×S611.410.080.04 *9.260.360.11
Error696.450.040.012.240.330.27
* The mean difference is significant at the 0.05 level.
Table 3. Changes in growth parameters of Pokkali, IR64, and MR219 under salinity stress. C = Control, S = Salinity.
DayVarietyPH (cm)SRB (g)LA (cm2)LNNN
CSCSCSCSCSCS
0Pokkali64.6 (±1.2) a66.1 (±2.9) a2.64 (±0.21) a2.72 (±0.21) a0.23 (±0.02) a0.22 (±0.03) a18.6 (±0.6) a19.3 (±1.4) a5.5 (±0.6) a5.5 (±0.6) a6.5 (±0.6) a6.5 (±0.6) a
IR6446.4 (±1.5) b45.6 (±1.9) b1.68 (±0.24) b1.71 (±0.16) b0.19 (±0.02) a0.19 (±0.03) a9.5 (±0.7) b9.1 (±1.0) b5.8 (±0.5) a5.8 (±0.5) a7.0 (±0.0) a7.0 (±0.0) a
MR21946.0 (±1.9) b45.7 (±1.5) b1.90 (±0.17) b1.91 (±0.45) b0.21 (±0.05) a0.23 (±0.04) a9.3 (±0.9) b9.1 (±0.8) b5.8 (±0.5) a5.5 (±0.6) a6.5 (±0.6) a6.5 (±0.6) a
Mean52.352.42.072.100.210.2112.412.55.75.66.76.7
CV (%)17.5019.5622.6525.1216.0316.6236.8441.098.699.227.397.39
2Pokkali67.4 (±1.2) a67.3 (±1.7) a2.58 (±0.19) a2.69 (±0.19) a0.27 (±0.02) a0.25 (±0.03) a24.9 (±0.7) a24.9 (±1.0) a7.5 (±0.6) a7.0 (±0.0) b6.5 (±0.6) a6.0 (±0.0) a
IR6448.2 (±1.5) b47.1 (±1.9) b1.75 (±0.25) b1.71 (±0.14) b0.23 (±0.02) a0.22 (±0.03) a10.4 (±0.7) b9.8 (±1.0) b8.0 (±0.0) a8.0 (±0.0) a7.0 (±0.0) a7.0 (±0.0) a
MR21947.5 (±1.9) b47.3 (±1.5) b1.91 (±0.17) b1.92 (±0.44) b0.25 (±0.05) a0.26 (±0.04) a10.2 (±0.9) b9.9 (±0.8) b7.8 (±0.5) a7.3 (±0.5) b6.8 (±0.5) a6.3 (±0.5) a
Mean54.453.92.082.110.250.2415.114.97.87.46.86.42
CV (%)17.7118.5920.1724.2213.4314.5447.8350.045.846.946.708.02
6Pokkali93.1 (±3.7) a80.3 (±2.6) a*3.45 (±0.07) a3.50 (±0.28) a0.59 (±0.18) a0.51 (±0.04) a40.5 (±2.9) a30.2 (±2.1) a*8.0 (±0.0) a7.0 (±0.0) b*7.0 (±0.0) a6.0 (±0.0) b*
IR6461.5 (±2.9) c53.9 (±1.5) b*2.31 (±0.18) b2.05 (±0.13) c0.27 (±0.04) b0.30 (±0.08) b21.4 (±1.7) b13.2 (±0.6) b*8.5 (±0.6) a7.8 (±0.5) a7.5 (±0.6) a6.8 (±0.5) a
MR21961.6 (±2.3) b56.4 (±2.1) b2.14 (±0.14) b2.46 (±0.20) b*0.35 (0.05) b0.29 (±0.02) b*21.4 (±1.4) b14.5 (±1.0) b*8.3 (±0.5) a7.5 (±0.6) a,b7.0 (±0.0) a6.5 (±0.6) a,b
Mean72.063.52.632.670.400.3627.819.38.37.47.26.4
CV (%)21.9019.7523.5924.8543.8031.8034.5742.355.486.945.438.02
10Pokkali100.6 (±0.4) a88.3 (±4.1) a*3.26 (±0.05) a3.71 (±0.23) a*1.02 (±0.16) a0.45 (±0.07) a*49.5 (±0.3) a32.6 (±2.9) a*8.5 (±0.6) a7.0 (±0.0) b*7.0 (±0.0) a6.0 (±0.0) b*
IR6463.8 (±2.1) c54.5 (±4.6) b*2.45 (±0.30) b2.17 (±0.10) c0.48 (±0.12) b0.41 (±0.11) a20.8 (±1.3) c11.5 (±2.3) b*8.8 (±1.5) a9.0 (±0.8) a7.8 (±1.5) a7.5 (±0.6) a
MR21970.6 (±1.8) b58.9 (±5.3) b*2.11 (±0.07) c2.45 (±0.16) b0.43 (±0.17) b0.40 (±0.12) a24.8 (±1.1) b13.7 (±2.7) b*8.8 (±0.5) a8.5 (±0.6) a7.8 (±0.5) a7.5 (±0.6) a
Mean78.367.22.612.770.640.4231.719.38.78.27.57.00
CV (%)21.4424.1720.3125.8648.3923.3141.9552.6710.2412.6112.0612.18
PH = plant height, SR = shoot/root ratio, B = biomass, LA = leaf surface area, LN = number of leaves, NN = number of nodes. Means ± SD (n = 4) followed by a different small letter in a column indicates significant differences between varieties, whereas (*) indicates that there are significant differences between control and treated plants of the same variety using the DNMRT analytical method with a p-value of 0.05.
Table 4. ANOVA result of gaseous exchange parameters.
Source of VariationdfMean Square
Pn (µmol CO2 m−2 s−1)Tr (mmol H2O m−2 s−1)Gs (µmol H2O m−2 s−1)
Replication (R)30.050.210.12
Variety (V)2118.32 *0.68 *22.86 *
Day of treatment (T)38.042.10 *15.31 *
Salinity (S)1219.80 *77.76 *134.80 *
V×T64.860.43 *0.57 *
V×S20.933.00 *3.57 *
T×S324.06 *11.08 *14.87 *
V×T×S60.580.56 *0.50 *
Error691.003.775.37
* The mean difference is significant at the 0.05 level.
Table 5. ANOVA result of chlorophyll and relative water content.
Source of VariationdfMean Square
Chl (mg g−1 FW)RWC (%)
Replication (R)30.0137.89
Variety (V)23.06 *176.07 *
Day of treatment (T)30.04923.98 *
Salinity (S)10.20 *4010.89 *
V×T60.03 *45.54
V×S20.06 *81.69
T×S30.09 *1055.62 *
V×T×S60.0250.68
Error690.3515.22
* The mean difference is significant at the 0.05 level.
Table 6. ANOVA result of gene expression.
Source of VariationsdfMean Square
GABA-T1SSADHGAD2SOS2CuZn SOD1MnSOD1CAT118sRNA
Replication (R)20.150.141.511.062.148.940.6221.76
Variety (V)291.04 *54.93 *23.86 *286.15 *72.05 *22.86 *135.01 *73.69
Day of treatment (T)339.81 *113.85 *78.92 *196.79 *36.21 *109.98 *335.78 *11.55
V×T677.22 *97.92 *26.29 *92.15 *36.35 *10.50 *27.55 *35.52
Error220.801.111.051.411.271.023.1931.63
* The mean difference is significant at the 0.05 level.
Publisher’s Note: MDPI stays neutral with regard to jurisdictional claims in published maps and institutional affiliations.

