
Effects of Temperature and Radiation on Yield of Spring Wheat at Different Latitudes

 , ,
, ,
Abstract
:1. Introduction
2. Materials and Methods
2.1. Experimental Site and Experimental Design
2.2. Experimental Data Collection
2.3. Calculation Methods and Statistical Analysis
3. Results
3.1. Differences of EAT and Tmean at Different Latitudes and Sowing Dates
3.2. Difference of CSR and Rmean at Different Latitudes and Sowing Dates
3.3. Differences in Yield under Different Temperature and Radiation Conditions
3.4. Differences in Dry Matter Formation under Different Temperature and Radiation Conditions
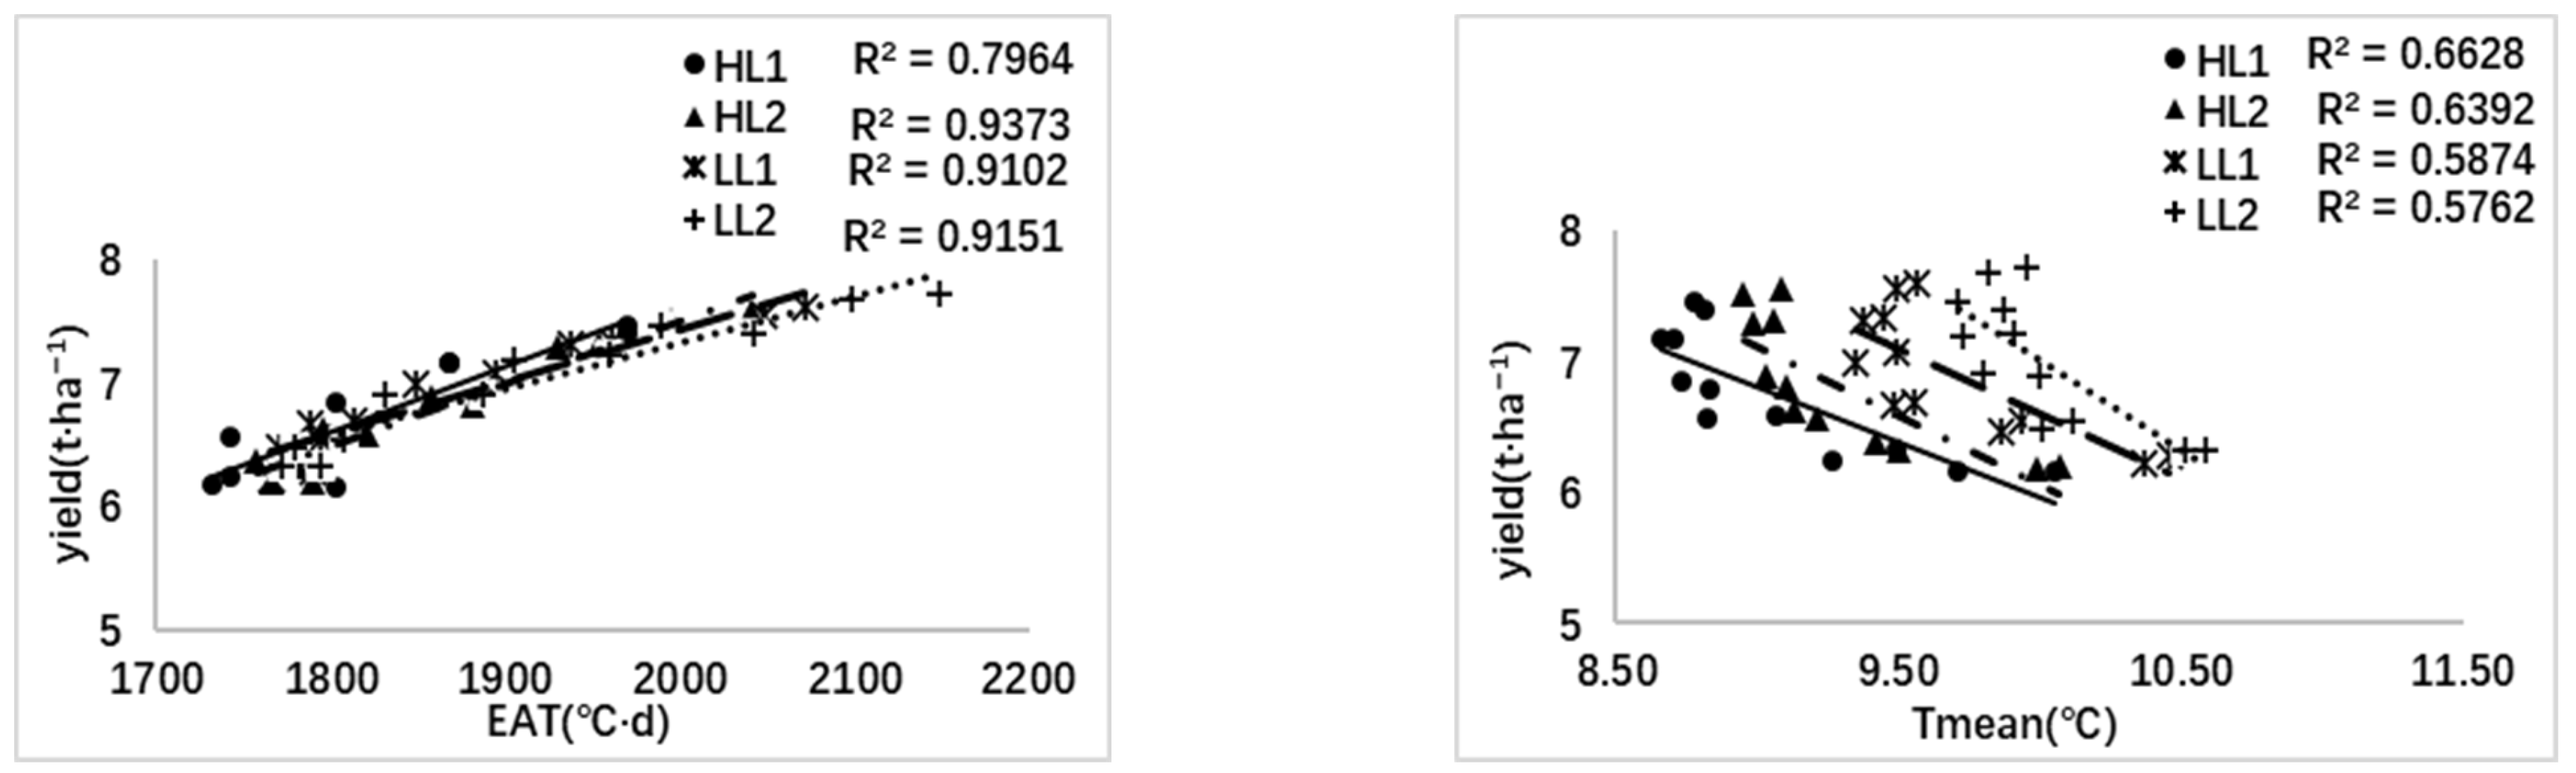
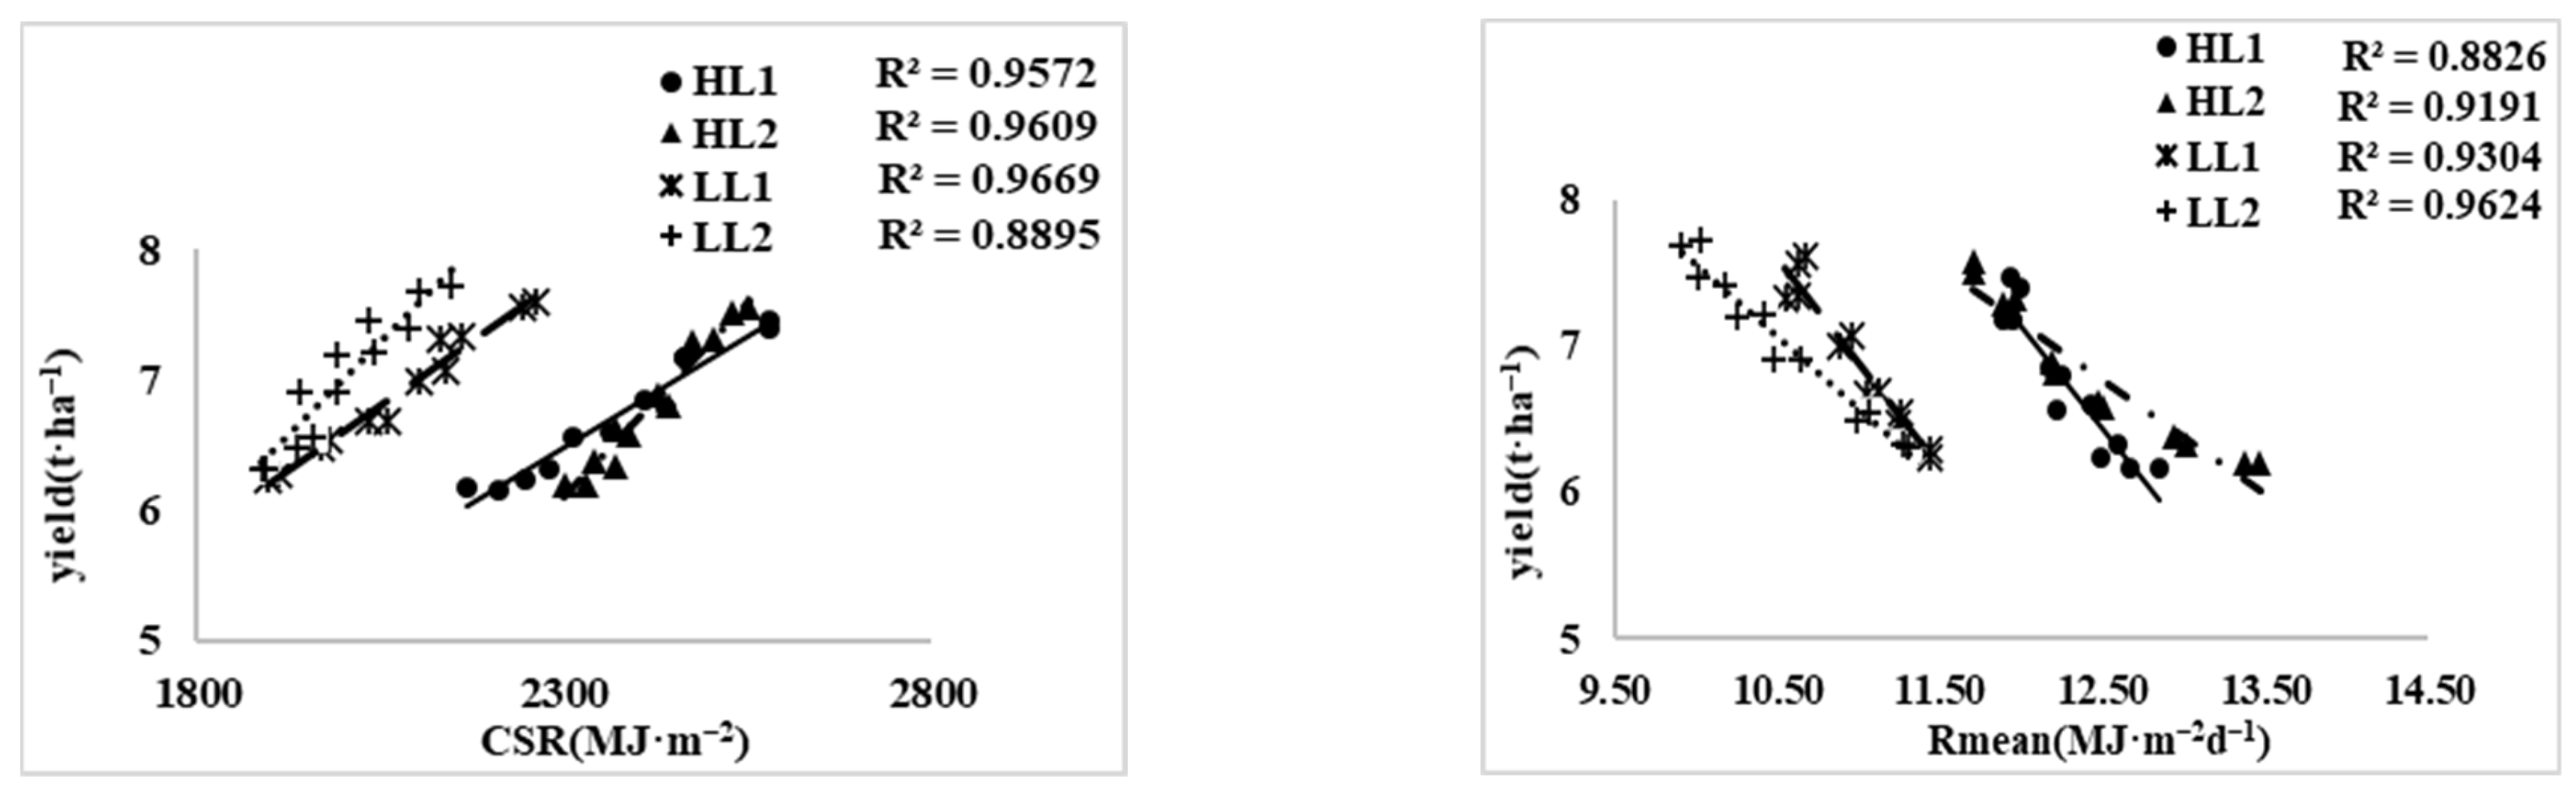
3.5. Correlations between Temperature, Radiation and Yield at Different Latitudes
3.6. Correlations between Temperature, Radiation and Dry Matter Accumulation at Different Latitudes
4. Discussion
4.1. Effects of Latitude and Sowing Date on Temperature and Radiation Received by Wheat
4.2. Effects of Temperature and Radiation on Wheat Material Production
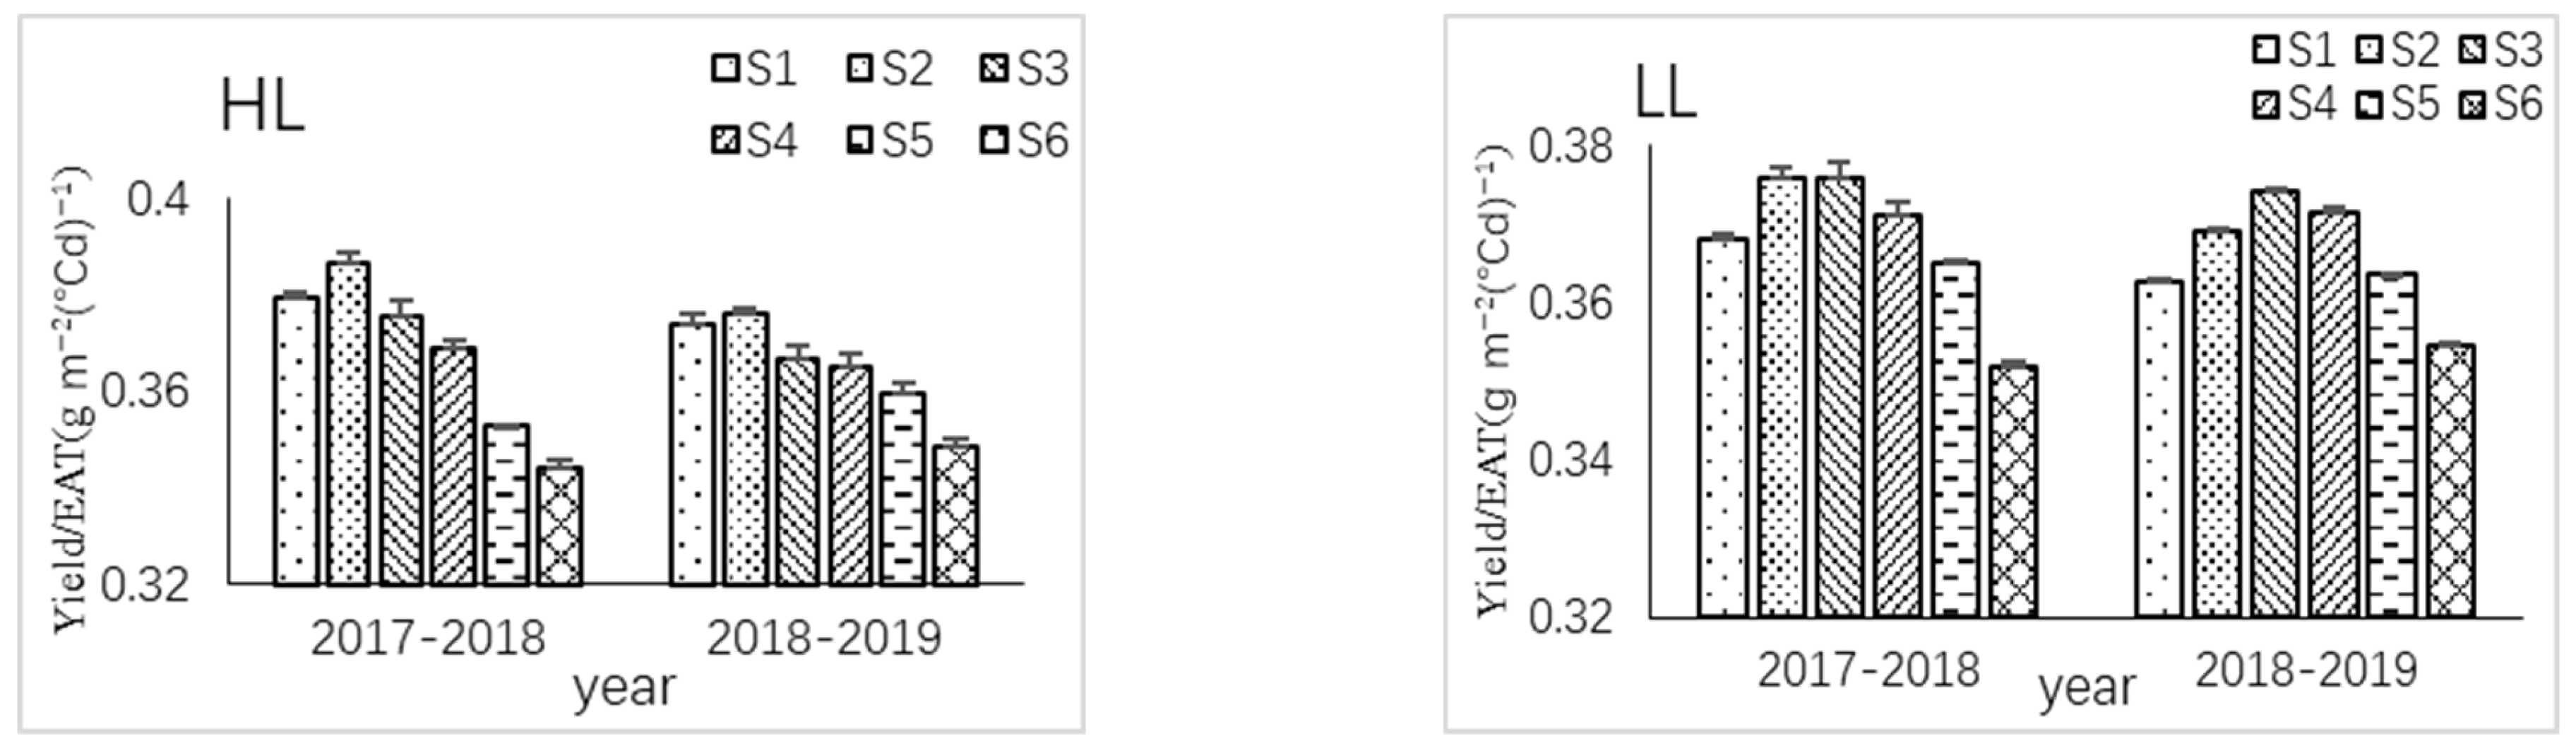
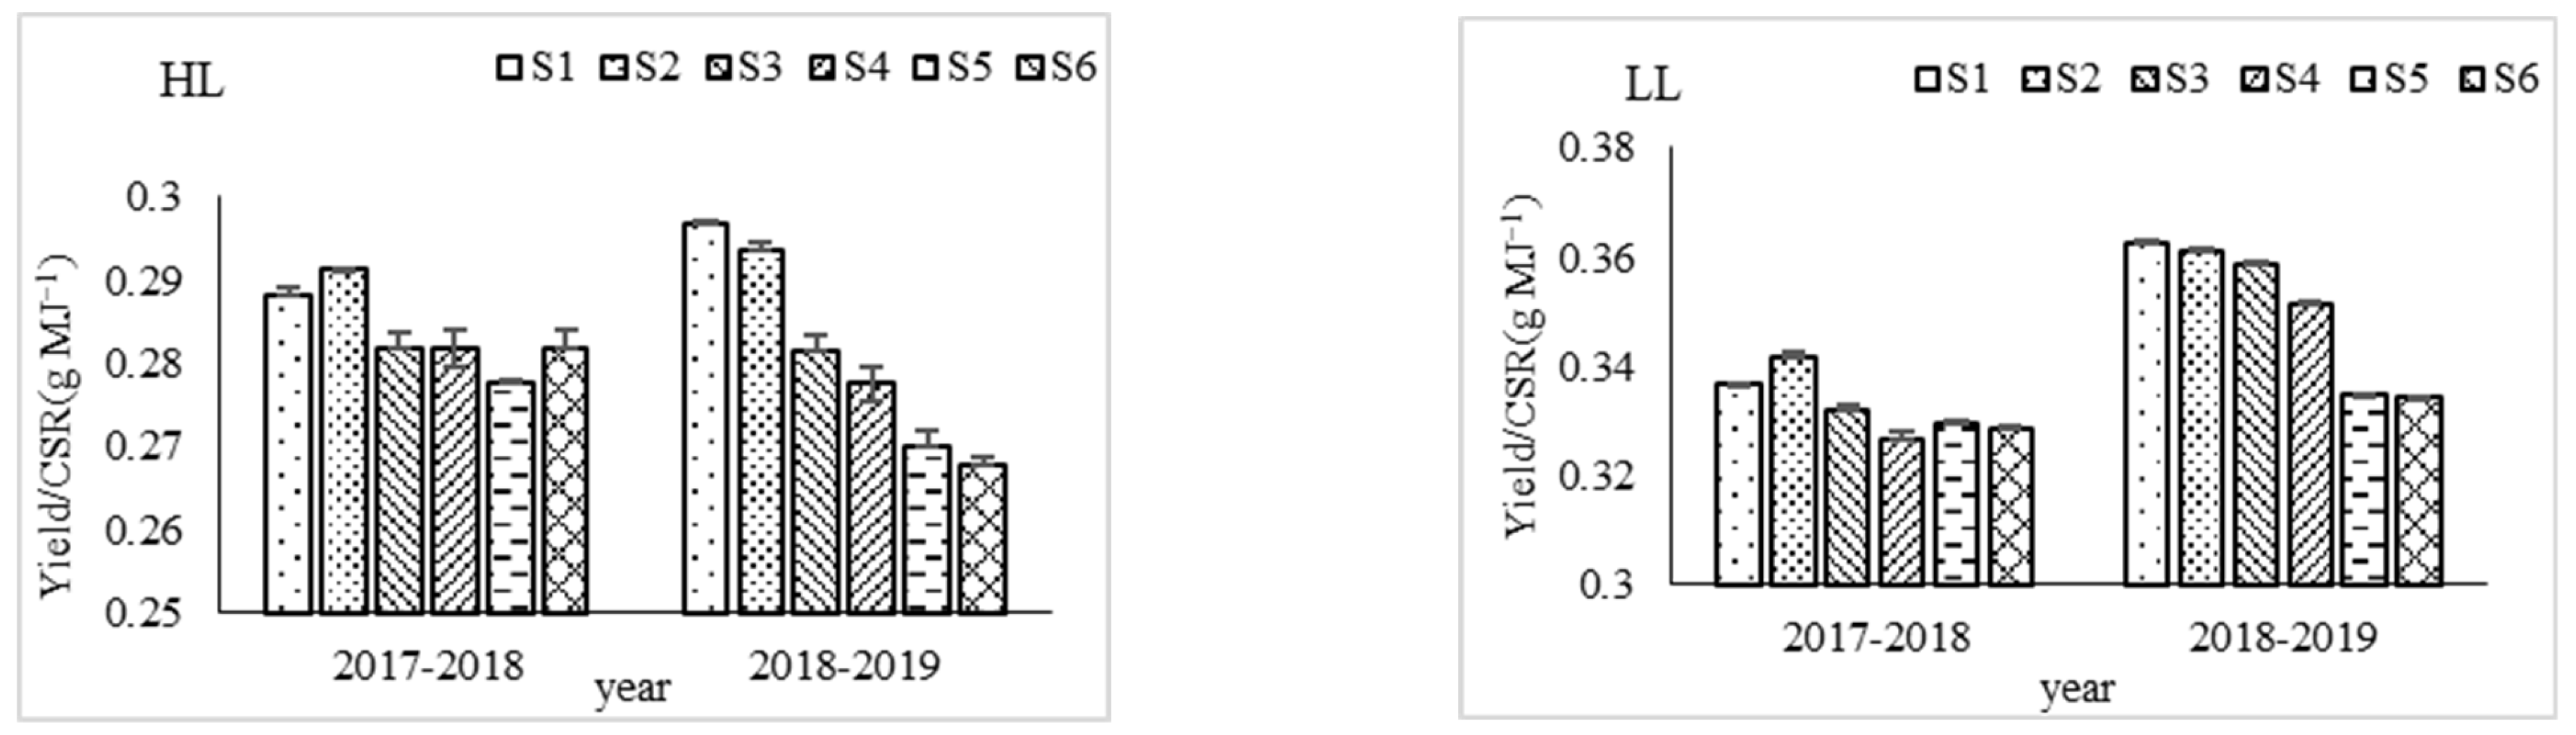
4.3. Utilization Efficiency of Temperature and Radiation at Different Latitudes
4.4. Adaptability of Growing Spring Wheat Northward
5. Conclusions
Author Contributions
Funding
Institutional Review Board Statement
Informed Consent Statement
Data Availability Statement
Conflicts of Interest
References
- Mahmood, T.; Khalid, S.; Abdullah, M.; Ahmed, Z.; Shah, M.; Ghafoor, A.; Du, X. Insights into Drought Stress Signaling in Plants and the Molecular Genetic Basis of Cotton Drought Tolerance. Cells 2019, 9, 105. [Google Scholar] [CrossRef] [PubMed] [Green Version]
- Cooney, C.M. Health scenarios for a warming world. Environ. Health Perspect. 2010, 118, a382. [Google Scholar] [CrossRef] [PubMed]
- Gaffen, D.J.; Ross, R.J. Increased summertime heat stress in the US. Nature 1998, 396, 529–530. [Google Scholar] [CrossRef]
- Zhu, B.; Sun, J.L.; Hu, R.C.; Wei, X.Y.; Zhai, L. Analysis on the change characteristics of agroclimatic resources in Jiangsu Province in recent 50 years. In Proceedings of the Annual Meeting of Chinese Meteorological Society, Shenyang, China, 1 September 2012; pp. 799–806. [Google Scholar]
- Asseng, S.; Foster, I.; Turner, N.C. The impact of temperature variability on wheat yields. Glob. Chang. Biol. 2011, 17, 997–1012. [Google Scholar] [CrossRef]
- Amir, J.; Sinclair, T.R. A model of the temperature and solar-radiation effects on spring wheat growth and yield. Field Crops Res. 1991, 28, 47–58. [Google Scholar] [CrossRef]
- Bao, Y.X. Meteorology; Southern Version China Agriculture Press: Beijing, China, 2002. [Google Scholar]
- Liu, L.; Ji, H.; An, J.; Shi, K.; Yan, Z. Response of biomass accumulation in wheat to low-temperature stress at jointing and booting stages. Environ. Exp. Bot. 2018, 157, 46–57. [Google Scholar] [CrossRef]
- LI, Q.Y.; Nian, L.; Liu, W.D.; Li, L.; Zhou, S.M.; Jun, Y. Effects of accumulated temperature before winter on Growth and Development of Wheat in Henan Province. Chin. J. Agrometeorol. 2010, 31, 563–569. (In Chinese) [Google Scholar]
- Shah, N.; Paulsen, G. Interaction of drought and high temperature on photosynthesis and grain-filling of wheat. Plant Soil 2003, 257, 219–226. [Google Scholar] [CrossRef]
- Jing, J.; Guo, S.; Li, Y.; Li, W. The alleviating effect of exogenous polyamines on heat stress susceptibility of different heat resistant wheat (Triticum aestivum L.) varieties. Sci. Rep. 2020, 10, 7467. [Google Scholar] [CrossRef] [PubMed]
- Driever, S.M.; Lawson, T.; Andralojc, P.J.; Raines, C.A.; Parry, M.A. Natural variation in photosynthetic capacity, growth, and yield in 64 field-grown wheat genotypes. J. Exp. Bot. 2014, 65, 4959–4973. [Google Scholar] [CrossRef] [Green Version]
- Beijing Orient Aige Agriculture Consulting Co. LTD. Table 1.3.4, Area of Wheat by Province in China, 2000–2009. In China Agricultural Commodities Yearbook; Beijing, China, April 2011; Volume 17. [Google Scholar]
- Zhang, Y.Q.; Liu, C.M.; You, Q.L.; Chen, C.C.; Xie, W.X.; Ye, Z.W.; Li, X.C.; He, Q.N. Decrease in light precipitation events in Huai River Eco-economic Corridor, a climate transitional zone in eastern China. Atmos. Res. 2019, 226, 240–254. [Google Scholar] [CrossRef]
- Cheng, S.L.; Xiao, H.R.; Zhu, X.M.; Ma, Z.B.; Shi, L.; Zhou, M.; Zhu, D.W. The mechanical transplanting technology of raising rice seedlings in field and the study, innovation and development of raising rice seedlings equipment of mechanization in southward of china. Chin. Agric. Mech. 2005, 02, 42–45. [Google Scholar]
- Gong, J.L.; Xing, Z.P.; Hu, Y.J.; Zhang, H.C.; Dai, Q.G.; Huo, Z.Y.; Xu, K.; Wei, H.Y.; Gao, H. The relative advantages of “changing indica to japonica” and the countermeasures of production development. Chin. Rice 2013, 19, 1–6. (In Chinese) [Google Scholar]
- Zhang, H.C.; Zhang, J.; Gong, J.L.; Chang, Y.; Li, M.; Gao, H.; Dai, Q.G.; Huo, Z.Y.; Xu, K.; Wei, H.Y. The productive advantages and formation mechanisms of “indica rice to japonica rice”. Sci. Agric. Sin. 2013, 46, 686–704. (In Chinese) [Google Scholar]
- He, Q.H.; Xie, Y. Study on Climatological calculation method of Total Solar radiation in China. J. Nat. Resour. 2010, 25, 308–319. (In Chinese) [Google Scholar]
- Chen, T.Y.; Yuan, J.Q.; Liu, Y.Y.; Xu, K.; Guo, B.W.; Dai, Q.G.; Huo, Z.Y.; Zhang, H.C.; Li, G.H. Effects of different sowing dates on crop yield, quality, and annual light-temperature resources utilization for rice–wheat double cropping system in the lower reaches of the Yangtze-Huaihe Rivers valley. Acta Agron. Sin. 2020, 46, 1566–1578. [Google Scholar]
- Lewis, S.; Faricelli, M.E.; Appendino, M.L.; Valárik, M.; Dubcovsky, J. The chromosome region including the earliness per se locus Eps-Am1 affects the duration of early developmental phases and spikelet number in diploid wheat. J. Exp. Bot. 2008, 59, 3595–3607. [Google Scholar] [CrossRef]
- Mondal, S.; Rutkoski, J.E.; Velu, G.; Singh, P.K.; Crespo-Herrera, L.A.; Guzmán, C.; Bhavani, S.; Lan, C.; He, X.; Singh, R.P. Harnessing Diversity in Wheat to Enhance Grain Yield, Climate Resilience, Disease and Insect Pest Resistance and Nutrition Through Conventional and Modern Breeding Approaches. Front. Plant Sci. 2016, 7, 991. [Google Scholar] [CrossRef] [Green Version]
- Sabine, D.M.; Jeuffroy, M.H. Incorporating radiation and nitrogen nutrition into a model of kernel number in wheat. Crop Sci. 2001, 41, 415–423. [Google Scholar] [CrossRef]
- Manderscheid, R.; Burkart, S.; Bramm, A.; Weigel, H.J. Effect of CO2 enrichment on growth and daily radiation use efficiency of wheat in relation to temperature and growth stage. Eur. J. Agron. 2003, 19, 411–425. [Google Scholar] [CrossRef]
- Williams, G.D.V. Wheat phenology in relation to latitude, longitude and elevation on the Canadian great plains. Can. J. Plant Sci. 1971, 1, 1–12. [Google Scholar] [CrossRef]
- Nie, Y.W. Effects of Sowing Date and Latitude on Growth, Yield and Quality of Different Temperature Sensitive Wheat Varieties; Henan Agricultural University: Zhengzhou, China, 2018. [Google Scholar]
- Yang, H.B.; Xu, C.Z.; Li, C.G.; Li, F.Y. Growth and Required Accumulated Temperature of Winter Wheat under Different Sowing Time. China Agric. Meteorol. 2009, 30, 201–203. [Google Scholar]
- Wang, Y.; Zhang, Z.; Liang, Y.; Han, Y.; Han, Y.; Tan, J. High Potassium Application Rate Increased Grain Yield of Shading-Stressed Winter Wheat by Improving Photosynthesis and Photosynthate Translocation. Front. Plant Sci. 2020, 11, 134–144. [Google Scholar] [CrossRef] [PubMed]
- Lv, L.H.; Liang, S.B.; Zhang, J.T.; Yao, Y.R.; Dong, Z.Q.; Zhang, L.H.; Jia, X.L. Response of yield and light energy utilization of different wheat varieties to accumulated temperature before winter. J. Wheat Crops 2017, 8, 1047–1055. [Google Scholar]
- Porter, J.R. Rising temperatures are likely to reduce crop yields. Nature 2005, 436, 174. [Google Scholar] [CrossRef] [Green Version]
- Lawlor, D.; Day, W.; Johnston, A.; Legg, B.; Parkinson, K. Growth of spring barley under drought: Crop development, photosynthesis, dry-matter accumulation and nutrient content. J. Agric. Sci. 1981, 96, 167–186. [Google Scholar] [CrossRef]
- Lu, H.; Hu, Y.; Wang, C.; Liu, W.; Ma, G.; Han, Q.; Ma, D. Effects of High Temperature and Drought Stress on the Expression of Gene Encoding Enzymes and the Activity of Key Enzymes Involved in Starch Biosynthesis in Wheat Grains. Front. Plant Sci. 2019, 10, 1414. [Google Scholar] [CrossRef] [PubMed]
- Deng, N.Y.; Ling, X.X.; Sun, Y.; Zhang, C.D.; Fahad, S.; Peng, S.B.; Cui, K.H.; Nie, L.X.; Huang, J. Influence of temperature and solar radiation on grain yield and quality in irrigated rice system. Eur. J. Agron. 2015, 64, 37–46. [Google Scholar] [CrossRef]
- Liu, Z.; Gao, J.; Gao, F.; Liu, P.; Zhao, B.; Zhang, J. Photosynthetic Characteristics and Chloroplast Ultrastructure of Summer Maize Response to Different Nitrogen Supplies. Front. Plant Sci. 2018, 9, 576. [Google Scholar] [CrossRef]
- Yang, X.; Wang, B.; Chen, L.; Li, P.; Cao, C. The different influences of drought stress at the flowering stage on rice physiological traits, grain yield, and quality. Sci. Rep. 2019, 9, 3742. [Google Scholar] [CrossRef] [Green Version]
- Yang, W. Monograph on Crop Cultivation; China Agriculture Press: Beijing, China, 2011. [Google Scholar]
- Hakala, K.; Jauhiainen, L.; Himanen, S.J.; Rötter, R.; Salo, T.; Kahiluoto, H. Sensitivity of barley varieties to weather in Finland. J. Agric. Sci. 2012, 150, 145–160. [Google Scholar] [CrossRef] [Green Version]
- Li, L. The Analysis of Changes in Climatic Resources, Potential and Utilization of Wheat in Henan Province in Different Latitudes; Henan Agricultural University: Zhengzhou, China, 2010; p. 38. [Google Scholar]
- Xu, J.; Zhou, S.; Liu, L.Y.; He, X.N.; Nan, Z.W.; Meng, W.W.; Wang, N.; Han, W.; Wang, X.Q.; Liu, K.C. Effects of Harvest and Sowing Dates on Annual Yield and Resource Utilization Efficiency of Wheat and Maize. Shandong Agric. Sci. 2020, 10, 100–107. [Google Scholar]
- Dakhil, M.A.; Halmy, M.; Hassan, W.A.; El-Keblawy, A.; Pan, K.; Abdelaal, M. Endemic Juniperus Montane Species Facing Extinction Risk under Climate Change in Southwest China: Integrative Approach for Conservation Assessment and Prioritization. Biology 2021, 10, 63. [Google Scholar] [CrossRef] [PubMed]
- Bigler, C.; Bugmann, H. Climate-induced shifts in leaf unfolding and frost risk of European trees and shrubs. Sci. Rep. 2018, 8, 9865. [Google Scholar] [CrossRef] [PubMed] [Green Version]
- Deng, Z.Y.; Zhang, Q.; Pu, J.Y.; Liu, D.X.; Guo, H.; Wang, Q.F.; Zhao, H.; Wang, H.L. Impact of climate warming on crop planting and production in northwest china. Acta Ecol. Sin. 2008, 28, 3760–3768. [Google Scholar] [CrossRef]
- Li, P.F.; Ma, B.L.; Xiong, Y.C. Modern hexaploid wheat differs from diploid and tetraploid ancestors in the importance of stress tolerance versus stress avoidance. Crop Pasture Sci. 2018, 69, 265–277. [Google Scholar] [CrossRef]
- Winfield, M.; Lu, C.; Wilson, I.; Coghill, J.; Edwards, K. Plant responses to cold: Transcriptome analysis of wheat. Plant Bio-Technol. J. 2010, 8, 749–771. [Google Scholar] [CrossRef] [Green Version]


| Varieties | Latitude | Treatment | 2017–2018 | 2018–2019 | ||||||||
|---|---|---|---|---|---|---|---|---|---|---|---|---|
| SO-EM | EM-JO | JO-HE | HE-MA | Whole Growth Period | SO-EM | EM-JO | JO-HE | HE-MA | Whole Growth Period | |||
| YM23 | HL | S1 | 141 | 495 | 480 | 830 | 1970 | 122 | 564 | 498 | 811 | 1995 |
| S2 | 147 | 476 | 415 | 804 | 1868 | 133 | 505 | 458 | 835 | 1931 | ||
| S3 | 163 | 461 | 384 | 795 | 1803 | 146 | 469 | 453 | 790 | 1858 | ||
| S4 | 175 | 438 | 375 | 783 | 1743 | 151 | 461 | 409 | 774 | 1796 | ||
| S5 | 197 | 428 | 369 | 777 | 1743 | 178 | 403 | 399 | 778 | 1758 | ||
| S6 | 224 | 413 | 366 | 779 | 1732 | 199 | 389 | 410 | 768 | 1766 | ||
| LL | S1 | 119 | 610 | 449 | 870 | 2048 | 114 | 636 | 461 | 888 | 2098 | |
| S2 | 124 | 541 | 411 | 862 | 1938 | 119 | 578 | 460 | 832 | 1989 | ||
| S3 | 133 | 487 | 382 | 846 | 1849 | 127 | 544 | 412 | 822 | 1905 | ||
| S4 | 142 | 435 | 399 | 813 | 1789 | 142 | 509 | 381 | 799 | 1831 | ||
| S5 | 154 | 443 | 365 | 807 | 1770 | 152 | 453 | 384 | 789 | 1779 | ||
| S6 | 170 | 441 | 361 | 794 | 1766 | 167 | 430 | 384 | 790 | 1771 | ||
| YM25 | HL | S1 | 141 | 514 | 477 | 839 | 1970 | 122 | 594 | 491 | 835 | 2041 |
| S2 | 147 | 502 | 409 | 810 | 1868 | 133 | 547 | 444 | 829 | 1953 | ||
| S3 | 163 | 471 | 397 | 801 | 1832 | 146 | 506 | 437 | 794 | 1882 | ||
| S4 | 175 | 459 | 370 | 794 | 1798 | 151 | 493 | 399 | 778 | 1821 | ||
| S5 | 197 | 440 | 377 | 779 | 1792 | 178 | 425 | 410 | 768 | 1781 | ||
| S6 | 224 | 424 | 374 | 780 | 1802 | 199 | 434 | 402 | 755 | 1790 | ||
| LL | S1 | 119 | 640 | 433 | 879 | 2071 | 114 | 673 | 452 | 910 | 2148 | |
| S2 | 124 | 561 | 410 | 867 | 1962 | 119 | 604 | 452 | 867 | 2042 | ||
| S3 | 133 | 526 | 399 | 837 | 1895 | 127 | 567 | 422 | 843 | 1960 | ||
| S4 | 142 | 480 | 369 | 823 | 1813 | 142 | 530 | 385 | 830 | 1887 | ||
| S5 | 154 | 494 | 332 | 813 | 1794 | 152 | 480 | 371 | 803 | 1807 | ||
| S6 | 170 | 457 | 364 | 799 | 1790 | 167 | 459 | 370 | 798 | 1794 | ||
| Varieties | Latitude | Treatment | 2017–2018 | 2018–2019 | ||||||||
|---|---|---|---|---|---|---|---|---|---|---|---|---|
| SO-EM | EM-JO | JO-HE | HE-MA | Whole Growth Period | SO-EM | EM-JO | JO-HE | HE-MA | Whole Growth Period | |||
| YM23 | HL | S1 | 14.10 | 3.21 | 14.54 | 20.24 | 8.81 | 12.16 | 3.90 | 13.09 | 20.80 | 8.95 |
| S2 | 8.18 | 3.32 | 14.81 | 20.61 | 8.70 | 9.48 | 3.67 | 13.48 | 21.41 | 8.99 | ||
| S3 | 2.39 | 5.26 | 16.00 | 20.93 | 8.73 | 9.71 | 3.51 | 14.16 | 21.95 | 9.03 | ||
| S4 | 1.13 | 10.43 | 17.05 | 21.16 | 8.82 | 1.55 | 7.18 | 14.62 | 22.10 | 9.13 | ||
| S5 | 1.45 | 11.25 | 16.79 | 21.57 | 9.27 | 1.50 | 11.19 | 15.33 | 22.22 | 9.42 | ||
| S6 | 1.87 | 12.52 | 17.40 | 21.63 | 9.71 | 1.91 | 11.80 | 15.75 | 22.59 | 9.99 | ||
| LL | S1 | 14.84 | 4.53 | 13.21 | 19.77 | 9.49 | 16.26 | 5.11 | 12.45 | 18.89 | 9.81 | |
| S2 | 11.27 | 4.13 | 14.68 | 20.05 | 9.37 | 11.93 | 4.83 | 13.51 | 19.35 | 9.71 | ||
| S3 | 6.34 | 4.21 | 15.28 | 20.15 | 9.35 | 11.56 | 4.70 | 14.21 | 19.56 | 9.73 | ||
| S4 | 4.26 | 4.61 | 15.34 | 20.33 | 9.48 | 6.38 | 5.08 | 14.65 | 19.98 | 9.80 | ||
| S5 | 1.71 | 9.24 | 15.21 | 20.70 | 9.86 | 2.87 | 7.04 | 14.78 | 20.77 | 10.01 | ||
| S6 | 2.01 | 10.75 | 15.02 | 20.90 | 10.37 | 2.75 | 8.77 | 14.78 | 21.35 | 10.51 | ||
| YM25 | HL | S1 | 14.10 | 3.30 | 14.90 | 20.45 | 8.77 | 12.16 | 4.04 | 13.26 | 21.41 | 9.08 |
| S2 | 8.18 | 3.47 | 15.14 | 20.77 | 8.66 | 9.48 | 3.92 | 13.45 | 21.83 | 9.05 | ||
| S3 | 2.39 | 5.31 | 16.55 | 21.08 | 8.83 | 9.71 | 3.74 | 14.55 | 22.07 | 9.11 | ||
| S4 | 1.13 | 10.68 | 16.80 | 21.47 | 9.07 | 1.55 | 7.33 | 15.33 | 22.22 | 9.21 | ||
| S5 | 1.45 | 11.27 | 17.15 | 21.63 | 9.49 | 1.50 | 11.19 | 15.75 | 22.59 | 9.50 | ||
| S6 | 1.87 | 12.47 | 17.83 | 21.66 | 10.06 | 1.91 | 12.05 | 16.08 | 22.88 | 10.07 | ||
| LL | S1 | 14.84 | 4.69 | 13.12 | 19.98 | 9.56 | 16.26 | 5.24 | 12.91 | 19.36 | 9.96 | |
| S2 | 11.27 | 4.23 | 15.20 | 20.15 | 9.44 | 11.93 | 4.97 | 13.68 | 19.70 | 9.87 | ||
| S3 | 6.34 | 4.49 | 15.34 | 20.42 | 9.49 | 11.56 | 4.82 | 14.54 | 20.08 | 9.91 | ||
| S4 | 4.26 | 4.96 | 15.35 | 20.58 | 9.56 | 6.38 | 5.20 | 14.79 | 20.74 | 9.99 | ||
| S5 | 1.71 | 9.68 | 15.11 | 20.85 | 9.94 | 2.87 | 7.24 | 14.84 | 21.14 | 10.11 | ||
| S6 | 2.01 | 10.63 | 15.83 | 21.02 | 10.46 | 2.75 | 9.01 | 14.81 | 21.56 | 10.59 | ||
| Varieties | Latitude | Treatment | 2017–2018 | 2018–2019 | ||||||||
|---|---|---|---|---|---|---|---|---|---|---|---|---|
| SO-EM | EM-JO | JO-HE | HE-MA | Whole Growth Period | SO-EM | EM-JO | JO-HE | HE-MA | Whole Growth Period | |||
| YM23 | HL | S1 | 148 | 1176 | 568 | 681 | 2578 | 92 | 1122 | 595 | 720 | 2528 |
| S2 | 176 | 1157 | 483 | 622 | 2462 | 122 | 1105 | 528 | 716 | 2472 | ||
| S3 | 487 | 868 | 439 | 614 | 2409 | 92 | 1163 | 503 | 668 | 2426 | ||
| S4 | 740 | 611 | 375 | 612 | 2310 | 470 | 837 | 419 | 643 | 2369 | ||
| S5 | 697 | 603 | 384 | 586 | 2247 | 679 | 614 | 404 | 643 | 2341 | ||
| S6 | 723 | 506 | 402 | 568 | 2167 | 676 | 575 | 427 | 621 | 2300 | ||
| LL | S1 | 115 | 1042 | 459 | 626 | 2243 | 67 | 810 | 555 | 670 | 2101 | |
| S2 | 71 | 1007 | 458 | 596 | 2131 | 82 | 834 | 525 | 591 | 2032 | ||
| S3 | 190 | 910 | 416 | 583 | 2100 | 84 | 854 | 439 | 610 | 1988 | ||
| S4 | 272 | 791 | 400 | 570 | 2033 | 119 | 844 | 353 | 623 | 1939 | ||
| S5 | 498 | 540 | 375 | 555 | 1967 | 351 | 647 | 330 | 607 | 1935 | ||
| S6 | 479 | 509 | 372 | 537 | 1898 | 356 | 603 | 308 | 621 | 1888 | ||
| YM25 | HL | S1 | 148 | 1213 | 553 | 663 | 2578 | 92 | 1153 | 590 | 716 | 2551 |
| S2 | 176 | 1189 | 474 | 623 | 2462 | 122 | 1159 | 498 | 721 | 2501 | ||
| S3 | 487 | 889 | 438 | 622 | 2436 | 92 | 1221 | 472 | 657 | 2442 | ||
| S4 | 740 | 629 | 378 | 614 | 2361 | 470 | 870 | 404 | 643 | 2387 | ||
| S5 | 697 | 607 | 406 | 568 | 2279 | 679 | 642 | 427 | 621 | 2369 | ||
| S6 | 723 | 519 | 394 | 575 | 2210 | 676 | 627 | 405 | 621 | 2329 | ||
| LL | S1 | 115 | 1052 | 474 | 620 | 2262 | 67 | 857 | 535 | 686 | 2146 | |
| S2 | 71 | 1036 | 444 | 607 | 2158 | 82 | 864 | 499 | 642 | 2087 | ||
| S3 | 190 | 952 | 400 | 596 | 2138 | 84 | 894 | 409 | 655 | 2042 | ||
| S4 | 272 | 837 | 371 | 578 | 2059 | 119 | 887 | 329 | 654 | 1990 | ||
| S5 | 498 | 578 | 343 | 561 | 1980 | 351 | 680 | 303 | 626 | 1959 | ||
| S6 | 479 | 518 | 389 | 524 | 1910 | 356 | 632 | 292 | 613 | 1893 | ||
| Varieties | Latitude | Treatment | 2017-2018 | 2018-2019 | ||||||||
|---|---|---|---|---|---|---|---|---|---|---|---|---|
| SO-EM | EM-JO | JO-HE | HE-MA | Whole Growth Period | SO-EM | EM-JO | JO-HE | HE-MA | Whole Growth Period | |||
| YM23 | HL | S1 | 14.81 | 8.97 | 17.21 | 16.61 | 11.99 | 9.16 | 8.70 | 15.65 | 18.46 | 11.70 |
| S2 | 9.79 | 9.56 | 17.27 | 15.95 | 11.95 | 8.74 | 9.13 | 15.54 | 18.37 | 11.89 | ||
| S3 | 8.40 | 11.13 | 18.29 | 16.17 | 12.17 | 6.13 | 10.03 | 15.71 | 18.55 | 12.19 | ||
| S4 | 8.40 | 14.56 | 17.03 | 16.54 | 12.22 | 7.34 | 13.28 | 14.97 | 18.38 | 12.47 | ||
| S5 | 8.30 | 15.87 | 17.46 | 16.28 | 12.48 | 8.08 | 17.06 | 15.54 | 18.39 | 12.93 | ||
| S6 | 8.93 | 15.33 | 19.13 | 15.78 | 12.67 | 8.56 | 17.44 | 16.43 | 18.27 | 13.37 | ||
| LL | S1 | 14.41 | 8.34 | 13.51 | 14.22 | 10.63 | 9.56 | 6.69 | 15.00 | 14.26 | 9.91 | |
| S2 | 6.42 | 8.39 | 16.36 | 13.86 | 10.55 | 8.20 | 7.19 | 15.45 | 13.75 | 10.01 | ||
| S3 | 9.07 | 8.67 | 16.64 | 13.89 | 10.88 | 7.67 | 7.63 | 15.15 | 14.53 | 10.25 | ||
| S4 | 8.25 | 9.31 | 15.37 | 14.24 | 11.05 | 5.40 | 8.70 | 13.59 | 15.58 | 10.48 | ||
| S5 | 7.78 | 11.25 | 15.61 | 14.22 | 11.24 | 7.30 | 10.12 | 12.70 | 15.97 | 10.99 | ||
| S6 | 7.61 | 12.42 | 15.52 | 14.12 | 11.43 | 6.47 | 12.31 | 11.83 | 16.79 | 11.30 | ||
| YM25 | HL | S1 | 14.81 | 9.12 | 17.29 | 16.18 | 11.93 | 9.16 | 8.73 | 15.94 | 18.37 | 11.70 |
| S2 | 9.79 | 9.67 | 17.54 | 15.98 | 11.89 | 8.74 | 9.35 | 15.09 | 18.98 | 11.97 | ||
| S3 | 8.40 | 11.26 | 18.25 | 16.36 | 12.24 | 6.13 | 10.26 | 15.73 | 18.24 | 12.21 | ||
| S4 | 8.40 | 14.64 | 17.19 | 16.58 | 12.42 | 7.34 | 13.17 | 15.54 | 18.39 | 12.50 | ||
| S5 | 8.30 | 15.58 | 18.46 | 15.78 | 12.59 | 8.08 | 16.89 | 16.43 | 18.27 | 13.02 | ||
| S6 | 8.93 | 15.26 | 18.75 | 15.97 | 12.85 | 8.56 | 17.41 | 16.21 | 18.81 | 13.46 | ||
| LL | S1 | 14.41 | 8.28 | 14.36 | 14.10 | 10.67 | 9.56 | 6.86 | 15.28 | 14.60 | 10.03 | |
| S2 | 6.42 | 8.49 | 16.44 | 14.11 | 10.63 | 8.20 | 7.32 | 15.13 | 14.59 | 10.18 | ||
| S3 | 9.07 | 8.90 | 15.37 | 14.53 | 10.96 | 7.67 | 7.84 | 14.11 | 15.59 | 10.42 | ||
| S4 | 8.25 | 9.51 | 15.47 | 14.46 | 11.13 | 5.40 | 8.96 | 12.67 | 16.36 | 10.64 | ||
| S5 | 7.78 | 11.33 | 15.60 | 14.40 | 11.25 | 7.30 | 10.30 | 12.11 | 16.47 | 11.07 | ||
| S6 | 7.61 | 12.05 | 16.89 | 13.80 | 11.44 | 6.47 | 12.39 | 11.67 | 16.58 | 11.27 | ||
| Variety | Latitude | Treatment | 2017–2018 | 2018–2019 | ||||||
|---|---|---|---|---|---|---|---|---|---|---|
| Panicles (× 104 ha−1) | Grain per Panicle | 1000-Grain Weight (g) | Yield (t·ha−1) | Panicles (× 104 ha−1) | Grain per Panicle | 1000-Grain Weight (g) | Yield (t·ha−1) | |||
| YM23 | HL | S1 | 482.98 cd | 37.62 a | 41.62 ab | 7.40 b | 480.38 c | 37.72 a | 42.17 bc | 7.51 b |
| S2 | 477.35 cd | 37.27 a | 41.28 b | 7.17 c | 477.31 c | 36.89 bc | 41.69 bcd | 7.29 c | ||
| S3 | 484.26 bcd | 35.95 b | 40.30 c | 6.85 e | 484.88 bc | 35.34 d | 40.94 de | 6.89 d | ||
| S4 | 485.24 bcd | 35.17 c | 39.17 d | 6.57 fg | 490.88 abc | 34.88 de | 39.53 gh | 6.62 e | ||
| S5 | 493.83 abc | 34.50 d | 38.42 e | 6.24 h | 486.38 bc | 33.96 fg | 39.28 gh | 6.38 fg | ||
| S6 | 497.07 ab | 33.70 e | 37.75 f | 6.17 h | 505.75 ab | 33.60 g | 38.44 i | 6.19 h | ||
| LL | S1 | 485.50 bcd | 37.67 a | 42.10 a | 7.56 a | 486.63 bc | 37.30 ab | 43.70 a | 7.69 a | |
| S2 | 490.52 abc | 36.33 b | 41.64 ab | 7.32 b | 491.58 abc | 36.55 c | 42.46 b | 7.47 b | ||
| S3 | 490.23 abc | 35.75 bc | 41.24 b | 7.00 d | 498.70 abc | 35.10 de | 41.51 cd | 7.19 c | ||
| S4 | 495.05 abc | 34.40 d | 40.56 c | 6.68 f | 505.10 ab | 34.60 ef | 40.42 ef | 6.91 d | ||
| S5 | 500.20 a | 33.40 ef | 39.43 d | 6.47 g | 509.00 a | 33.35 g | 39.99 fg | 6.49 ef | ||
| S6 | 502.90 a | 32.87 f | 38.97 de | 6.23 h | 509.83 a | 32.35 h | 38.98 hi | 6.32 gh | ||
| YM25 | HL | S1 | 480.91 c | 37.72 a | 41.90 a | 7.46 b | 488.51 cd | 37.55 a | 41.99 b | 7.57 ab |
| S2 | 486.89 bc | 36.62 b | 41.06 b | 7.17 d | 493.24 bc | 36.44 b | 40.85 cd | 7.32 cd | ||
| S3 | 489.13 abc | 35.70 c | 40.63 bc | 6.79 e | 497.93 bc | 35.45 c | 40.49 cde | 6.81 e | ||
| S4 | 500.50 ab | 34.47 d | 39.33 de | 6.59 fg | 493.95 bc | 34.21 d | 40.03 def | 6.58 f | ||
| S5 | 507.10 a | 33.45 e | 38.54 fg | 6.32 h | 512.43 ab | 32.79 e | 39.19 f | 6.33 g | ||
| S6 | 508.02 a | 32.97 e | 37.73 g | 6.16 i | 504.24 abc | 32.44 e | 39.16 f | 6.20 g | ||
| LL | S1 | 486.65 bc | 37.77 a | 42.26 a | 7.61 a | 486.30 d | 37.35 a | 43.76 a | 7.72 a | |
| S2 | 487.15 bc | 36.60 b | 41.89 a | 7.34 c | 493.55 bc | 36.04 bc | 42.83 b | 7.40 bc | ||
| S3 | 496.05 abc | 35.74 c | 40.94 b | 7.07 d | 494.45 bc | 35.18 c | 42.03 b | 7.22 d | ||
| S4 | 502.88 ab | 34.47 d | 40.05 cd | 6.68 ef | 507.80 abc | 34.03 d | 40.96 c | 6.90 e | ||
| S5 | 507.30 a | 33.25 e | 39.42 de | 6.54 g | 514.63 a | 32.74 e | 40.76 cde | 6.55 f | ||
| S6 | 506.73 a | 33.03 e | 39.16 ef | 6.28 h | 510.00 ab | 32.14 e | 39.94 ef | 6.33 g | ||
| 2017–2018 | 2018–2019 | |||||||
|---|---|---|---|---|---|---|---|---|
| Panicles | Grain per Panicle | Grain Weight | Yield | Panicles | Grain per Panicle | Grain Weight | Yield | |
| latitude (L) | 5.35 * | 12.91 ** | 87.59 ** | 102.88 ** | 6.83 * | 14.34 ** | 89.29 ** | 101.24 ** |
| Variety (V) | 8.79 ** | 6.91 * | 0.18 | 3.92 | 4.06 | 19.44 ** | 3.97 | 0 |
| Sowing (S) | 10.76 ** | 259.65 ** | 171.57 ** | 716.10 ** | 6.19 ** | 234.29 ** | 92.71 ** | 441.29 ** |
| L × V | 1.39 | 11.70 ** | 0.65 | 1.04 | 2.81 | 2.12 | 6.15 * | 0.35 |
| L × S | 0.13 | 1.41 | 2.44 | 2.16 | 0.42 | 0.67 | 1.41 | 3.75 * |
| V × S | 0.77 | 1.1 | 0.35 | 0.56 | 0.65 | 2.42 | 1.86 | 0.27 |
| P × V × S | 0.34 | 0.82 | 1.05 | 0.59 | 0.4 | 0.65 | 0.68 | 0.65 |
| Varieties | Latitude | Sowing | 2017–2018 | 2017–2018 | ||||
|---|---|---|---|---|---|---|---|---|
| JO | HE | MA | JO | HE | MA | |||
| YM23 | HL | S1 | 4.14 a | 9.64 a | 15.05 a | 4.24 a | 9.94 a | 15.24 a |
| S2 | 4.05 ab | 9.49 b | 14.76 b | 4.11 b | 9.73 b | 14.93 a | ||
| S3 | 3.77 c | 9.10 c | 14.13 c | 3.98 c | 9.51 c | 14.55 b | ||
| S4 | 3.64 d | 8.86 d | 13.73 d | 3.84 d | 9.25 d | 14.10 c | ||
| S5 | 3.50 e | 8.66 e | 13.30 e | 3.74 e | 9.10 e | 13.84 cd | ||
| S6 | 3.47 e | 8.61 e | 13.28 e | 3.70 e | 8.95 e | 13.56 d | ||
| LL | S1 | 4.43 a | 10.33 a | 15.68 a | 4.64 a | 10.62 a | 16.07 a | |
| S2 | 4.24 b | 10.06 b | 15.18 b | 4.47 b | 10.40 ab | 15.73 b | ||
| S3 | 4.14 bc | 9.82 c | 14.77 c | 4.22 c | 10.09 c | 15.23 c | ||
| S4 | 3.92 d | 9.61 d | 14.38 d | 3.99 d | 9.80 d | 14.74 d | ||
| S5 | 3.86 e | 9.40 e | 14.06 e | 3.65 e | 9.32 e | 13.99 e | ||
| S6 | 3.78 e | 9.23 f | 13.75 f | 3.58 e | 9.13 e | 13.69 e | ||
| YM25 | HL | S1 | 4.21 a | 9.85 a | 15.27 a | 4.33 a | 10.16 a | 15.52 a |
| S2 | 4.07 b | 9.71 b | 14.98 b | 4.22 a | 10.01 b | 15.22 b | ||
| S3 | 3.83 c | 9.45 c | 14.51 c | 4.07 b | 9.70 c | 14.71 c | ||
| S4 | 3.63 d | 9.26 d | 14.20 d | 3.88 c | 9.42 d | 14.23 d | ||
| S5 | 3.50 ed | 9.04 e | 13.74 e | 3.72 d | 9.16 e | 13.82 e | ||
| S6 | 3.33 e | 8.86 f | 13.42 f | 3.62 d | 9.02 f | 13.60 e | ||
| LL | S1 | 4.49 a | 10.60 a | 15.94 a | 4.79 a | 10.81 a | 16.32 a | |
| S2 | 4.34 b | 10.27 b | 15.43 b | 4.59 b | 10.56 b | 15.88 b | ||
| S3 | 4.20 c | 10.06 c | 15.10 bc | 4.53 b | 10.40 b | 15.62 b | ||
| S4 | 4.04 d | 9.81 d | 14.55 c | 4.25 c | 10.06 c | 15.08 c | ||
| S5 | 3.91 e | 9.59 e | 14.30 cd | 4.03 d | 9.73 d | 14.54 d | ||
| S6 | 3.82 e | 9.38 f | 13.94 d | 3.87 e | 9.43 e | 14.09 e | ||
| EM-JO | JO-HE | HE-MA | Whole Growth Period | |
|---|---|---|---|---|
| EAT | 0.9501 ** | 0.6463 ** | 0.9745 ** | 0.9451 ** |
| Tmean | −0.9444 ** | −0.6159 * | −0.9579 ** | −0.7970 ** |
| CSR | 0.9666 ** | 0.6324 * | 0.9823 ** | 0.9862 ** |
| Rmean | −0.9630 ** | −0.3131 | 0.3365 | −0.9445 ** |
| EM-JO | JO-HE | HE-MA | Whole Growth Period | |
|---|---|---|---|---|
| EAT | 0.9762 ** | 0.8576 ** | 0.9712 ** | 0.9063 ** |
| Tmean | −0.7918 ** | −0.7183 ** | −0.9288 ** | −0.7363 ** |
| CSR | 0.9156 ** | 0.8644 ** | 0.8702 ** | 0.9899 ** |
| Rmean | −0.8977 ** | 0.5891 * | −0.7970 ** | −0.9390 ** |
Publisher’s Note: MDPI stays neutral with regard to jurisdictional claims in published maps and institutional affiliations. |
© 2022 by the authors. Licensee MDPI, Basel, Switzerland. This article is an open access article distributed under the terms and conditions of the Creative Commons Attribution (CC BY) license (https://creativecommons.org/licenses/by/4.0/).
Share and Cite
Zhang, Z.; Zhou, N.; Xing, Z.; Liu, B.; Tian, J.; Wei, H.; Gao, H.; Zhang, H. Effects of Temperature and Radiation on Yield of Spring Wheat at Different Latitudes. Agriculture 2022, 12, 627. https://doi.org/10.3390/agriculture12050627
Zhang Z, Zhou N, Xing Z, Liu B, Tian J, Wei H, Gao H, Zhang H. Effects of Temperature and Radiation on Yield of Spring Wheat at Different Latitudes. Agriculture. 2022; 12(5):627. https://doi.org/10.3390/agriculture12050627
Chicago/Turabian StyleZhang, Zhenzhen, Nianbing Zhou, Zhipeng Xing, Bingliang Liu, Jinyu Tian, Haiyan Wei, Hui Gao, and Hongcheng Zhang. 2022. "Effects of Temperature and Radiation on Yield of Spring Wheat at Different Latitudes" Agriculture 12, no. 5: 627. https://doi.org/10.3390/agriculture12050627