
An Integrated Nitrogen Management Strategy Promotes Open-Field Pepper Yield, Crop Nitrogen Uptake, and Nitrogen Use Efficiency in Southwest China

Abstract
:1. Introduction
2. Materials and Methods
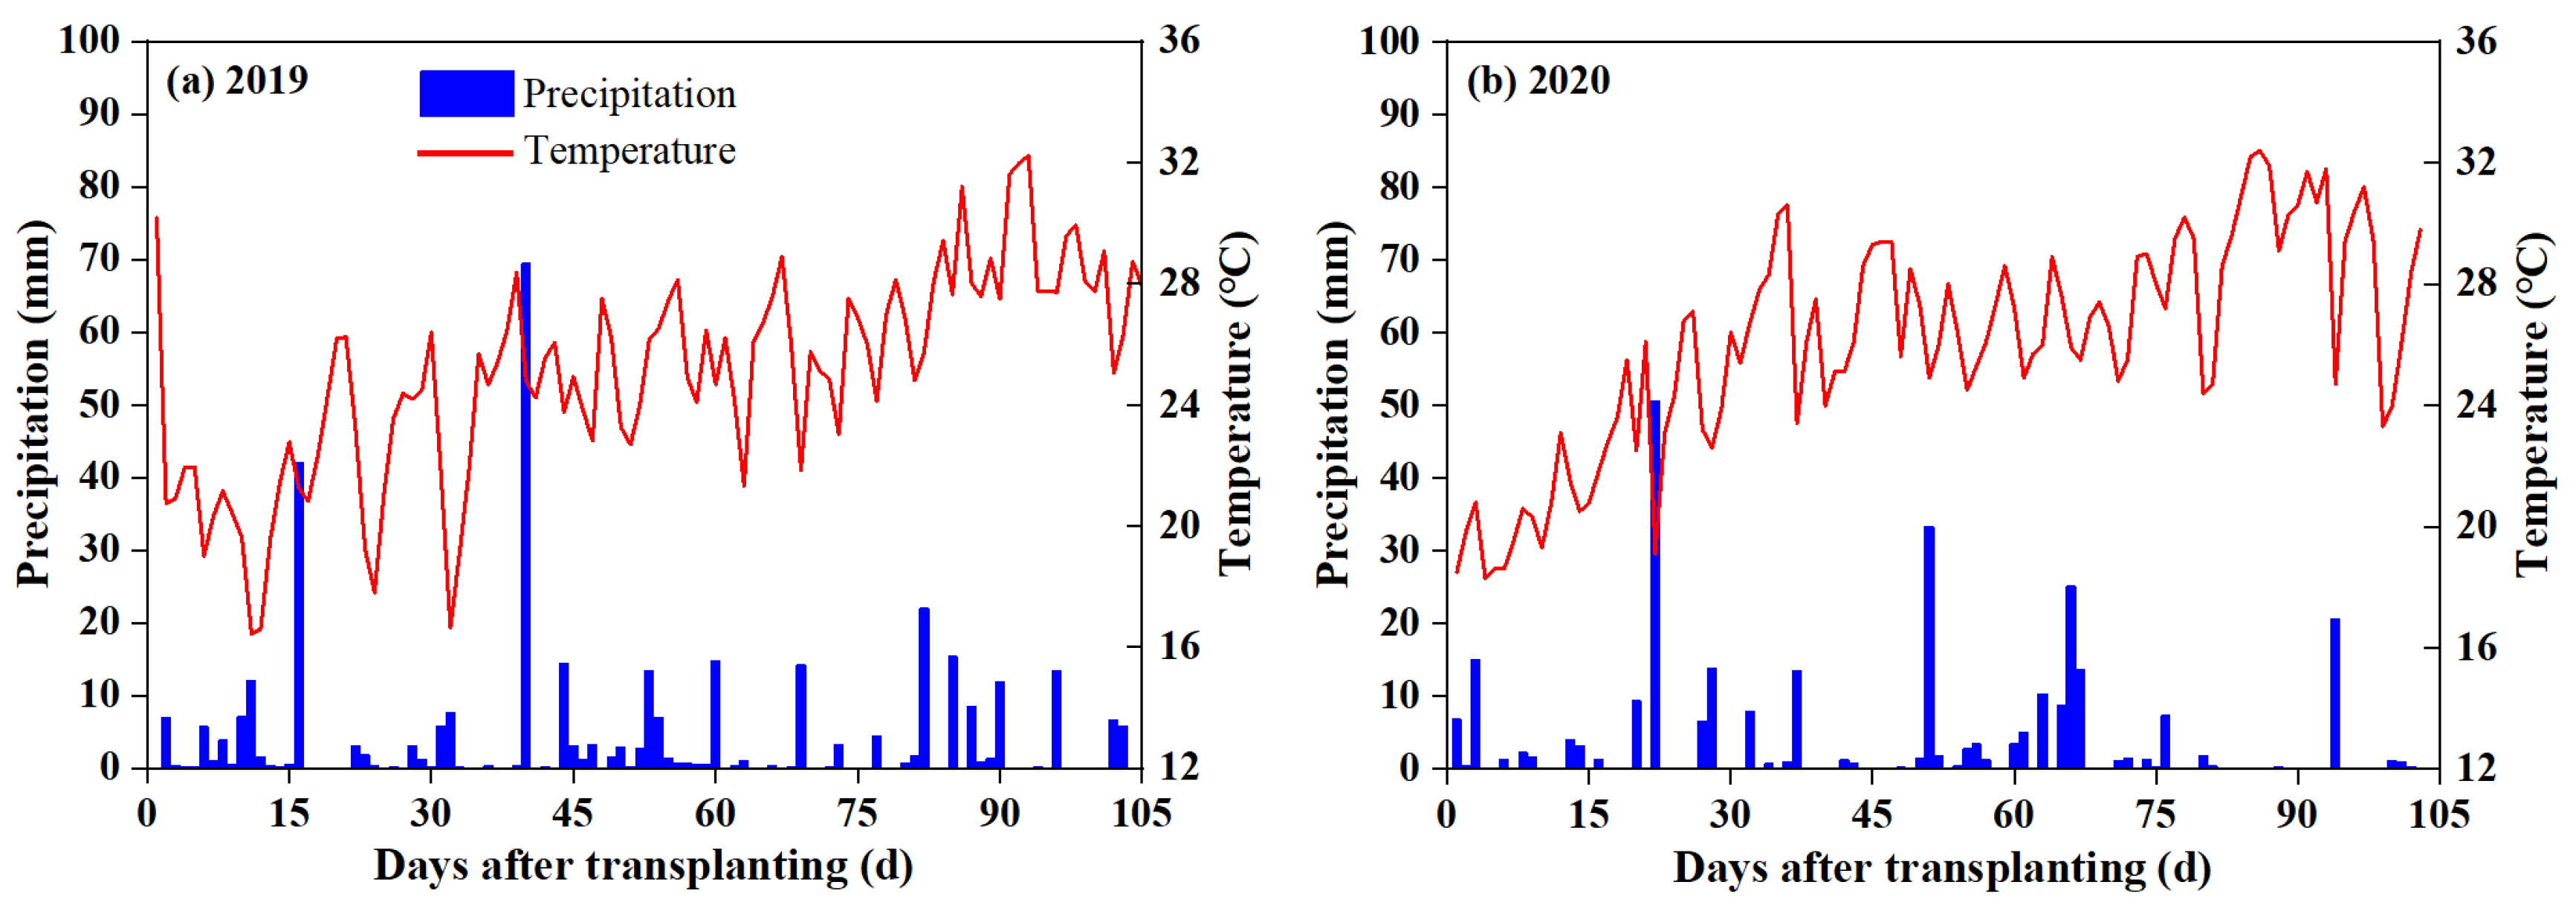
2.1. Experimental Site Information
2.2. Experimental Treatments and Crop Management
2.3. Sample Collection and Analysis
- (1)
- REN (%) = (total plant N accumulation in N application treatment − total plant N accumulation in CK treatment)/N rate × 100.
- (2)
- AEN (kg kg−1) = (fruit yield in N application treatment–fruit yield in CK treatment)/N rate.
- (3)
- PFPN (kg kg−1) = fruit yield in N application treatment/N rate.
2.4. Statistical Analysis
3. Results
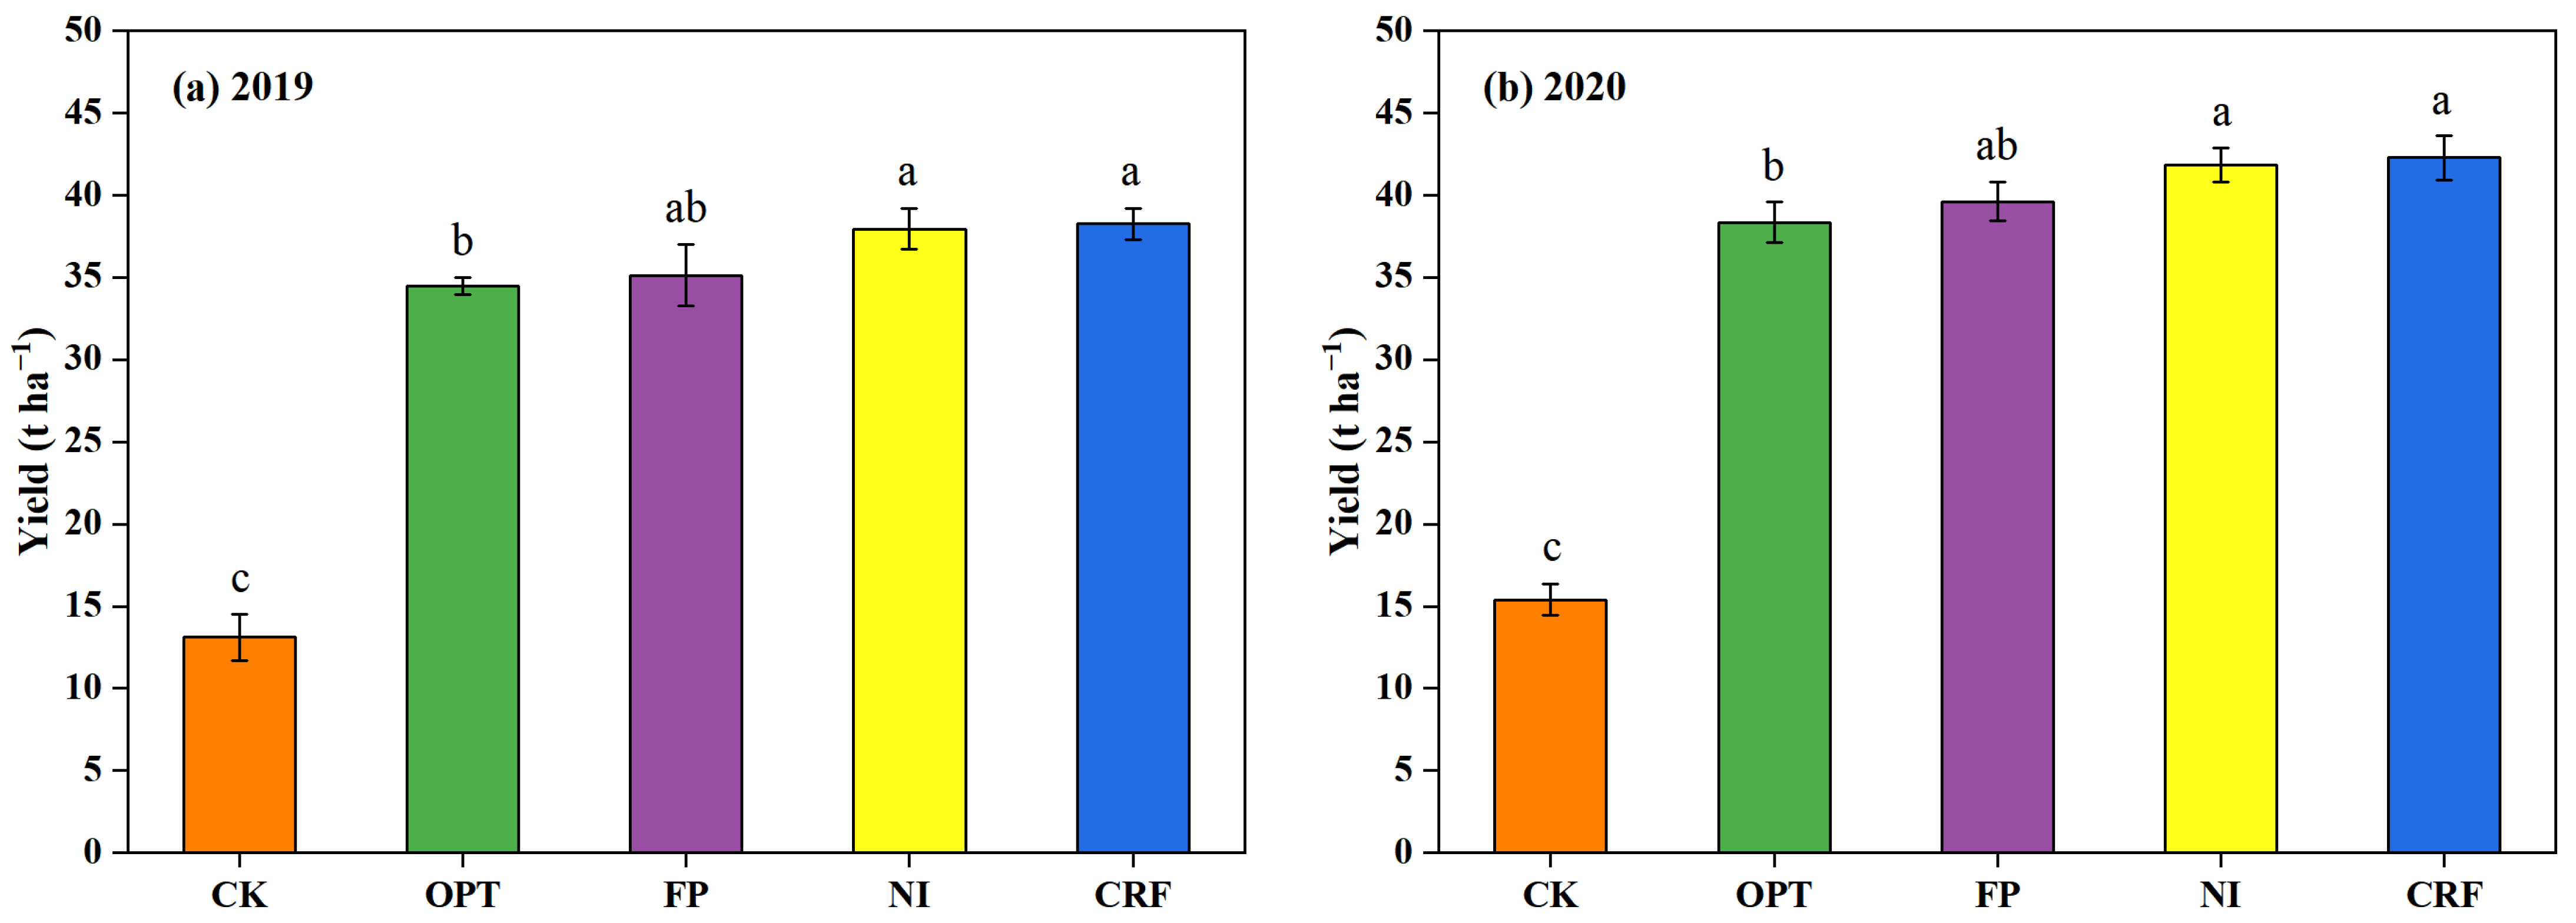
3.1. Yields
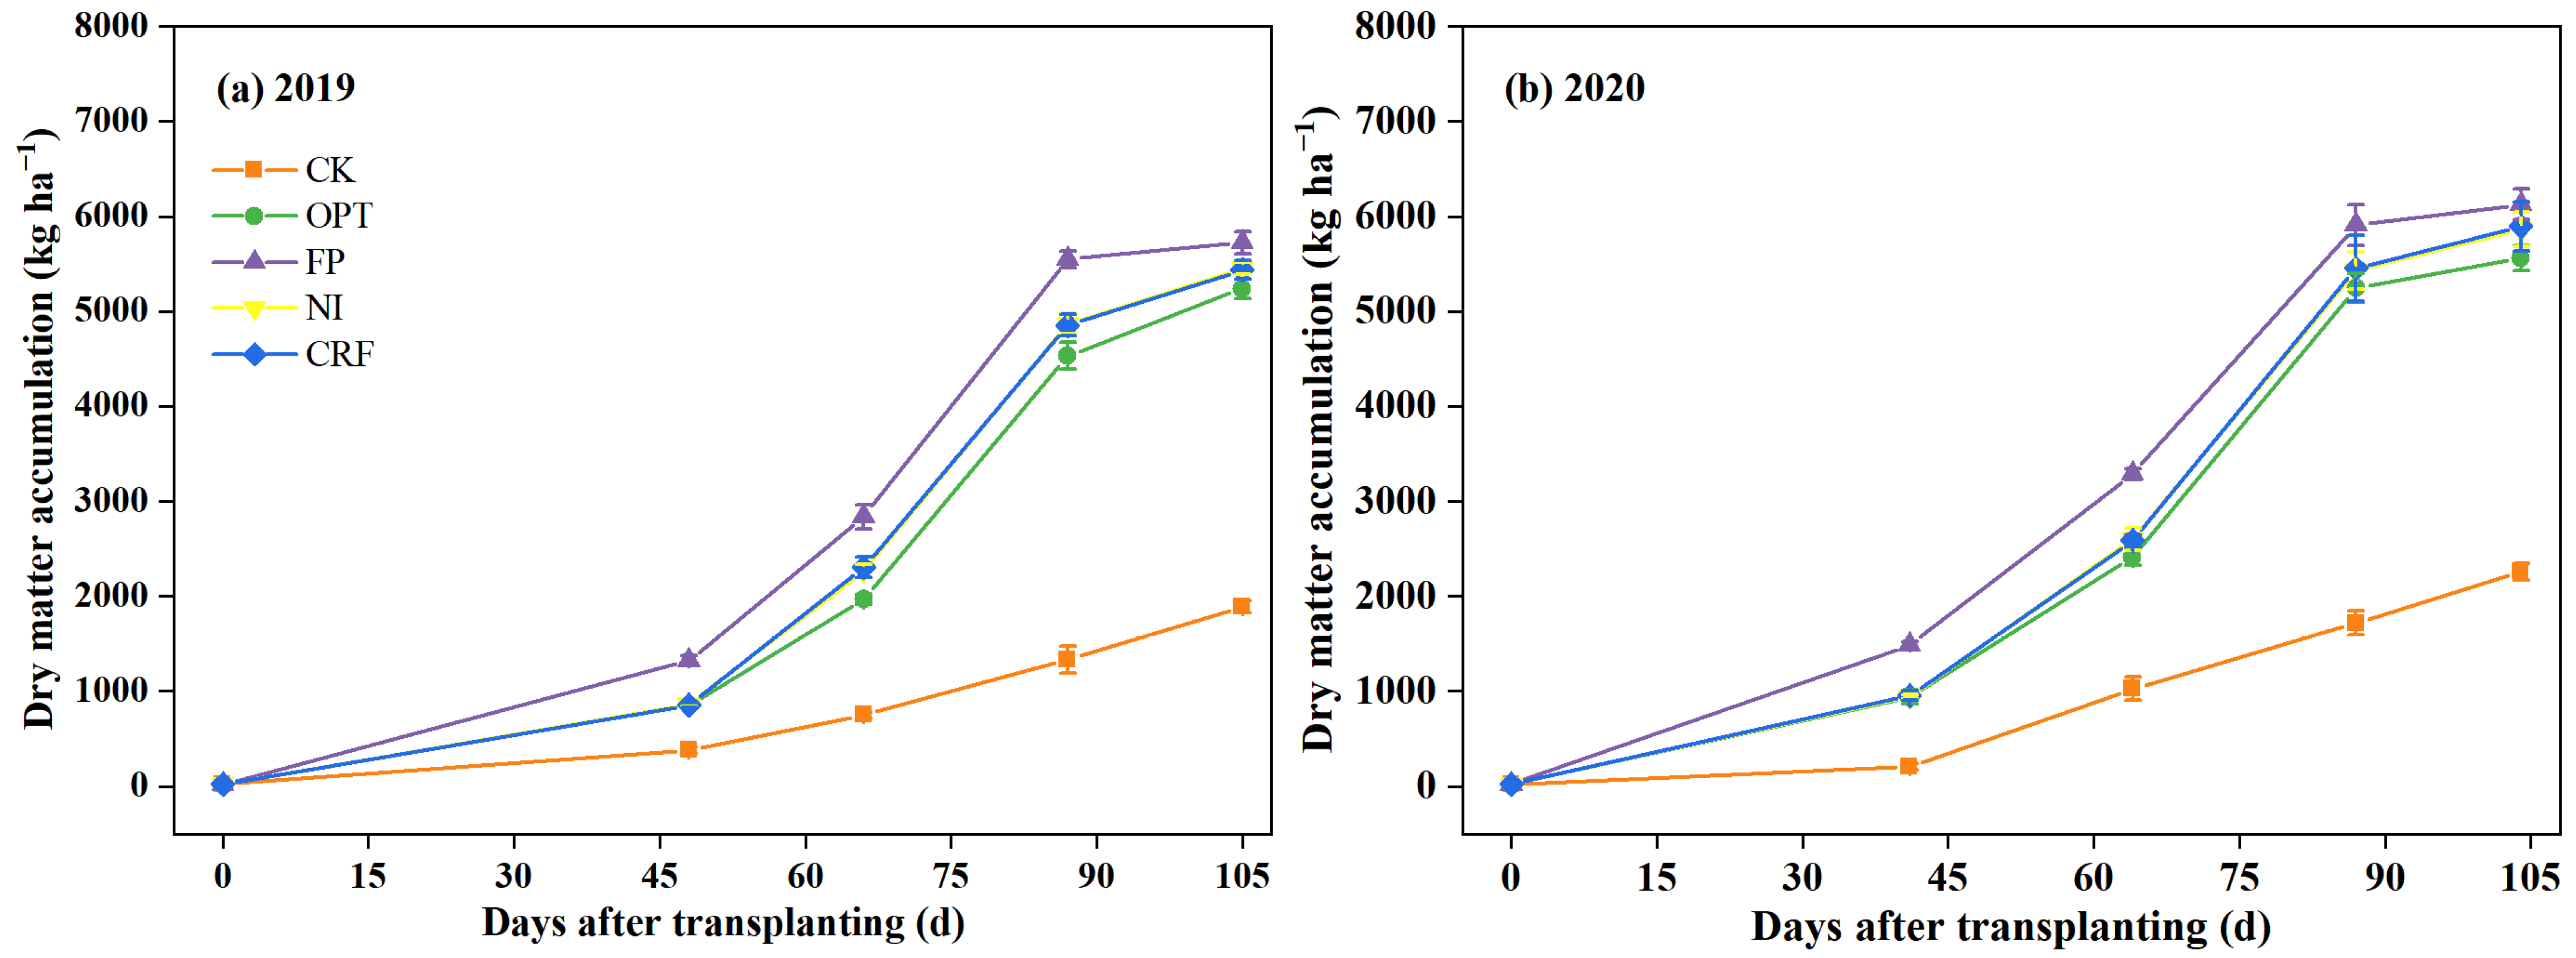
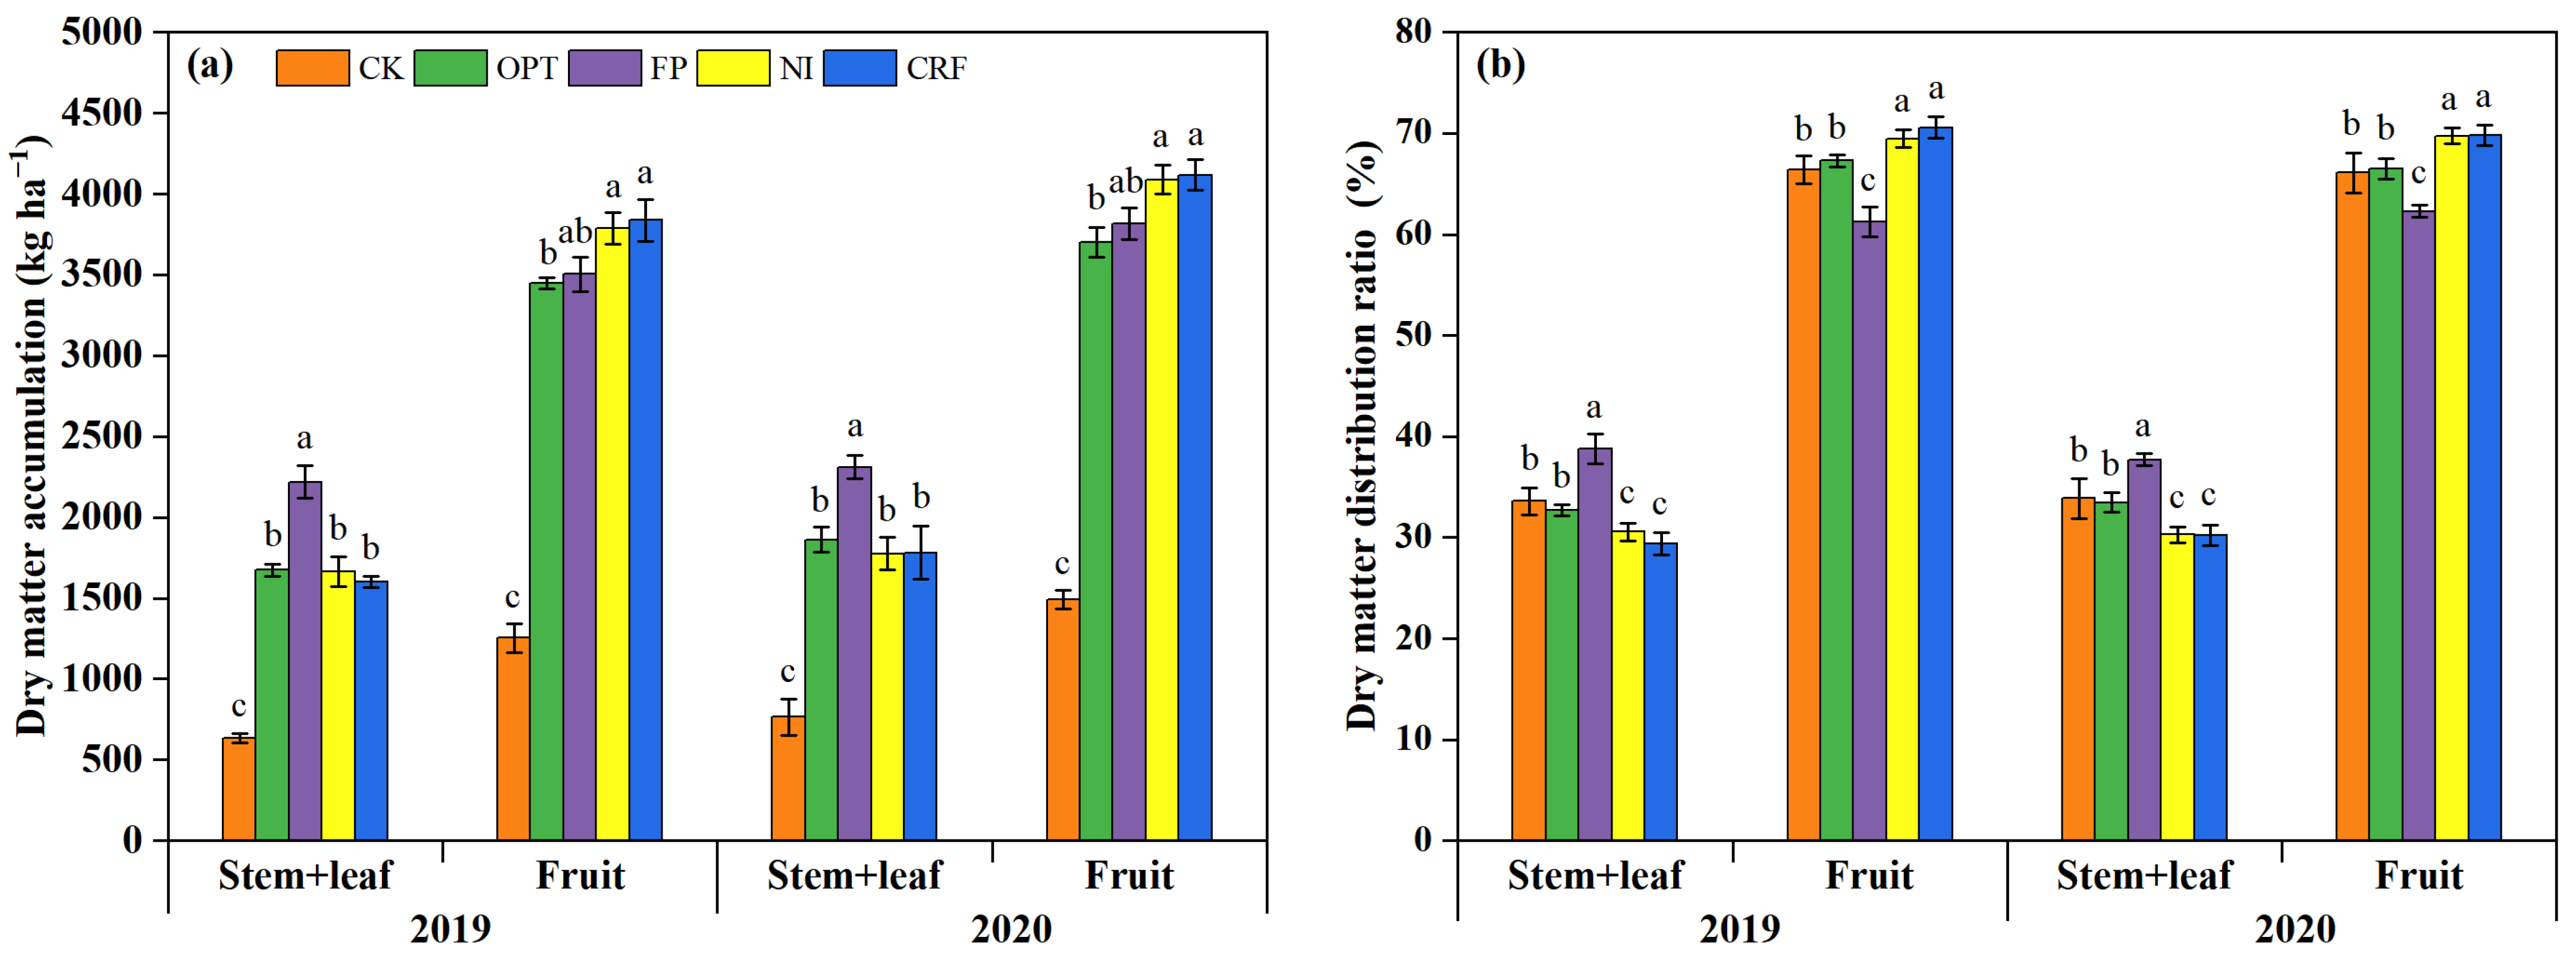
3.2. Biomass Accumulation and Partitioning
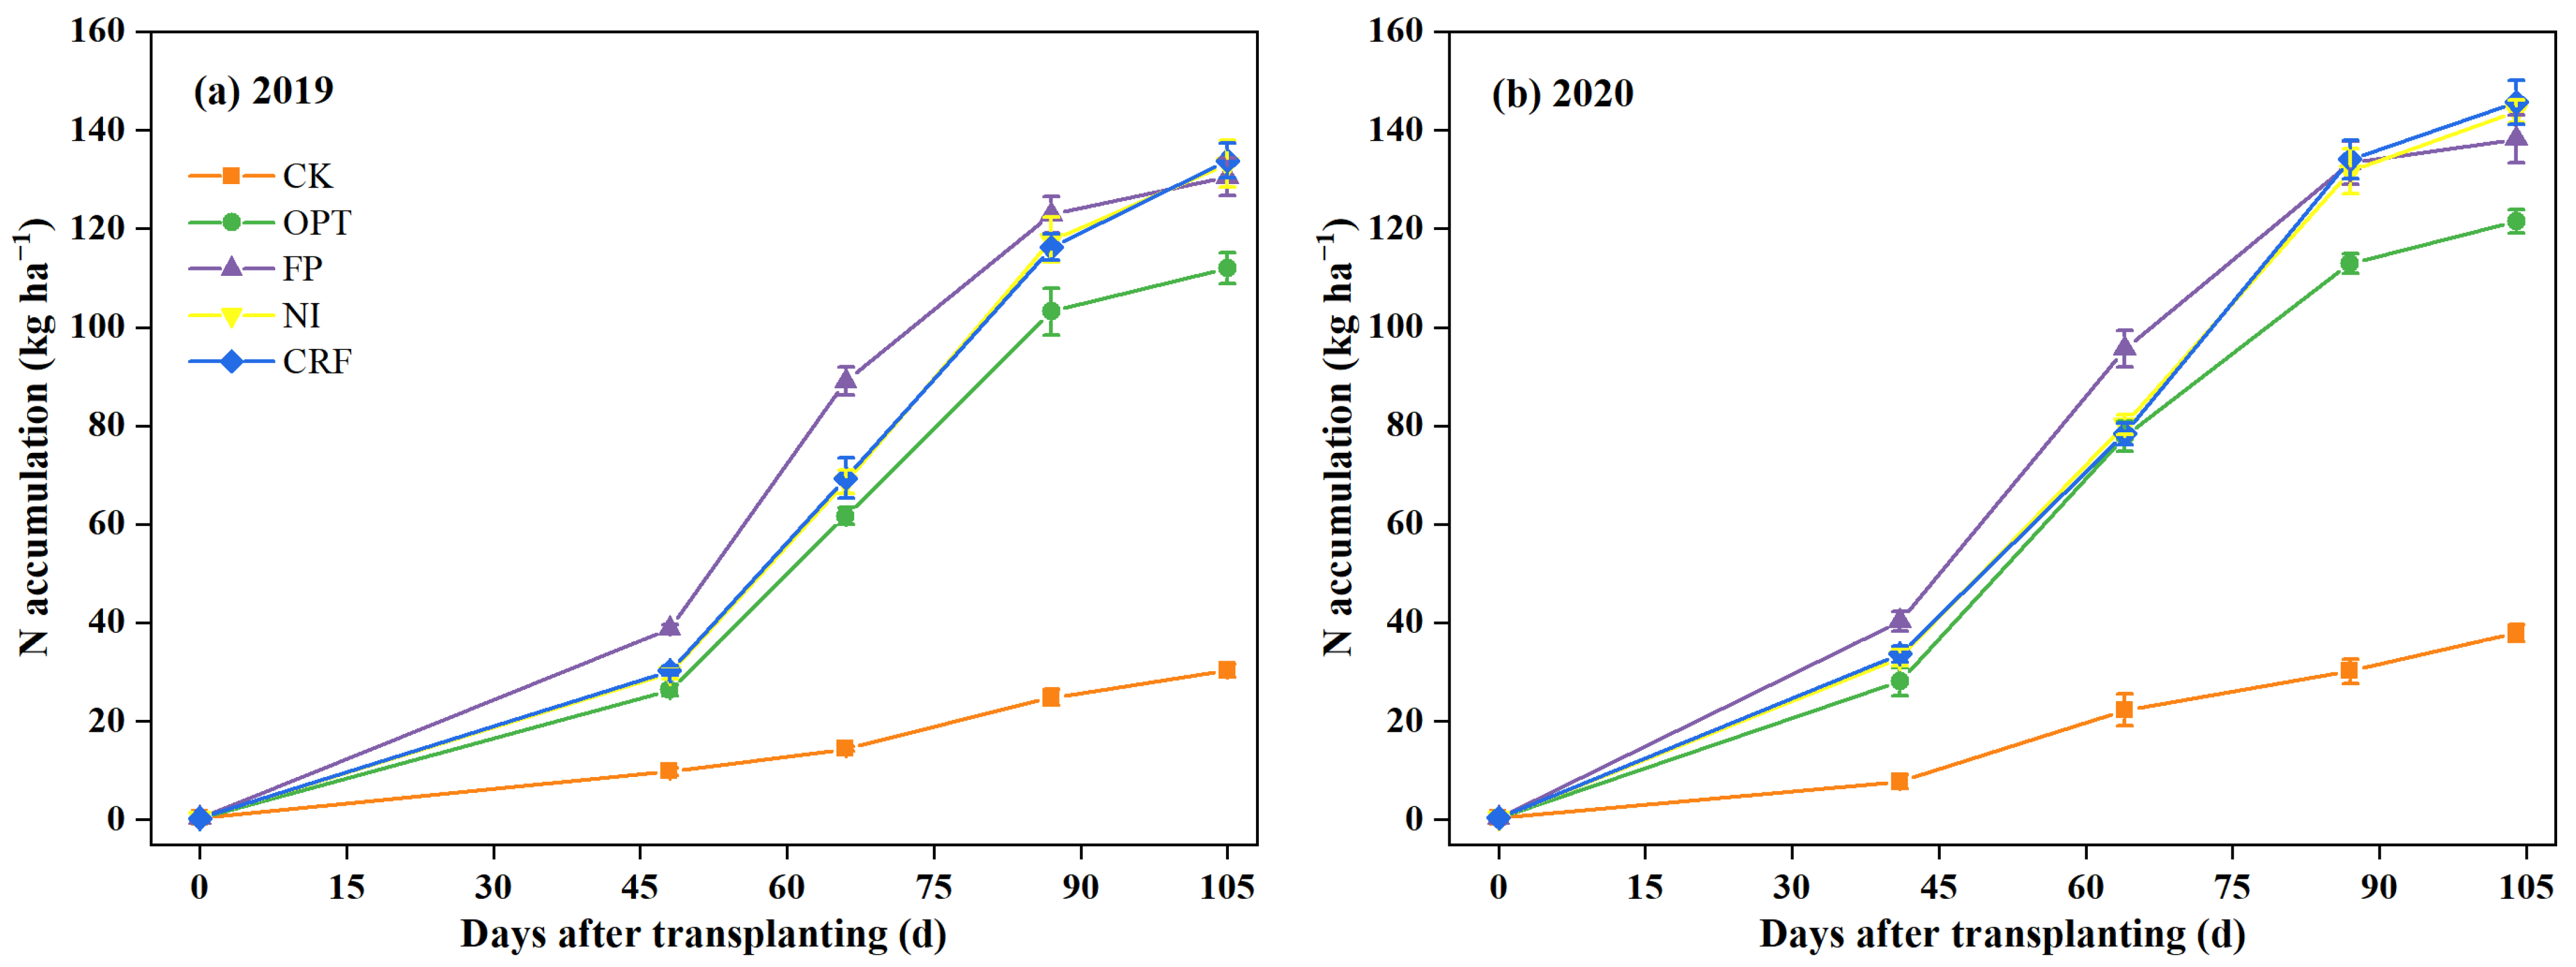
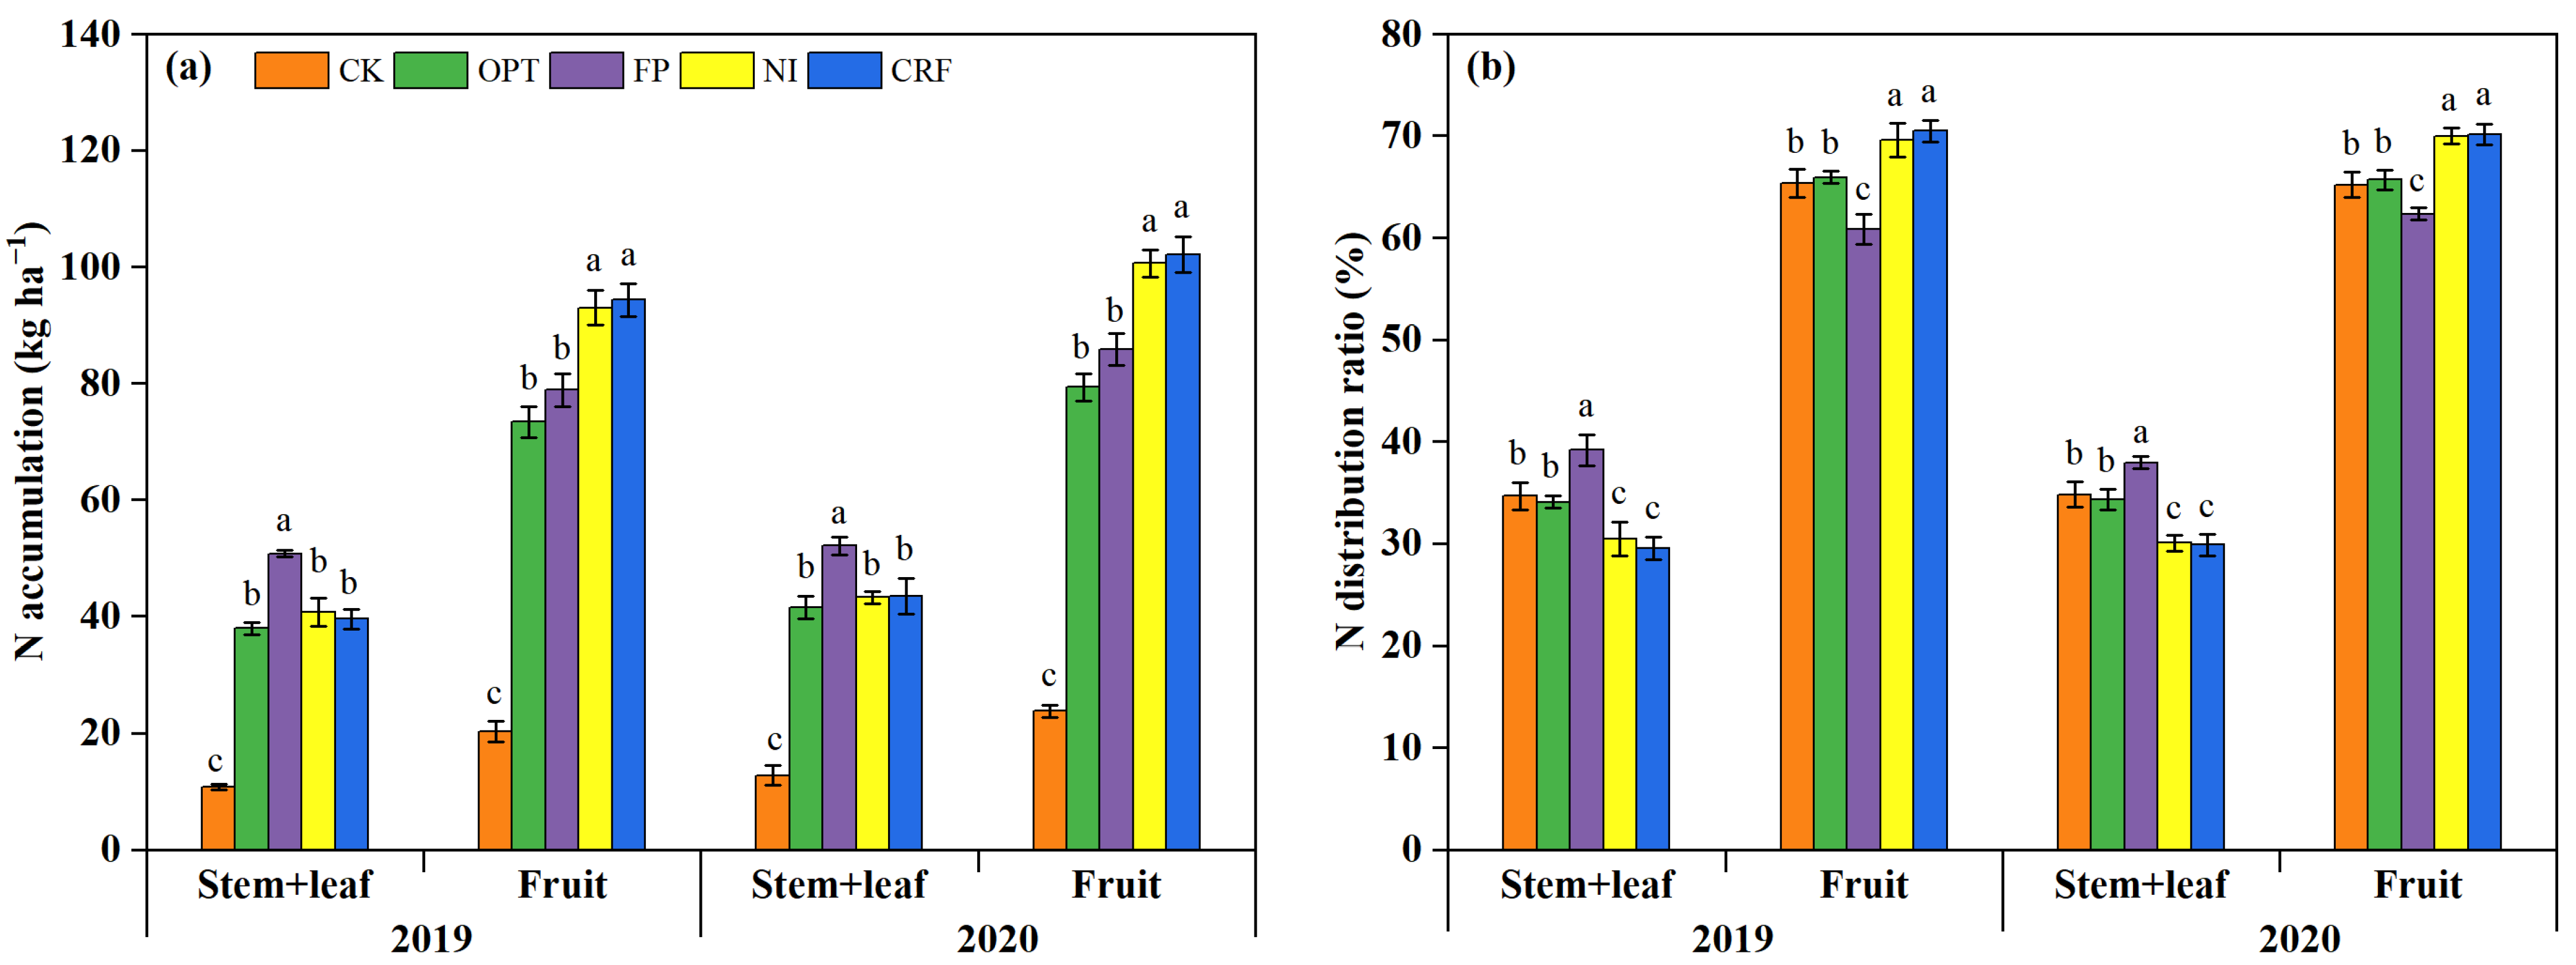
3.3. Nitrogen Accumulation and Partitioning
3.4. Nitrogen Use Efficiencies
4. Discussion
5. Conclusions
Author Contributions
Funding
Conflicts of Interest
References
- Schreinemachers, P.; Simmons, E.B.; Wopereis, M.C.S. Tapping the economic and nutritional power of vegetables. Glob. Food Secur.-Agric. Policy 2018, 16, 36–45. [Google Scholar] [CrossRef]
- Wang, Y.; Dannenmann, M.; Lin, S.; Lv, H.; Li, G.; Lian, X.; Wang, Z.; Wang, J.; Butterbach-Bahl, K. Improving soil respiration while maintaining soil C stocks in sunken plastic greenhouse vegetable production systems—Advantages of straw application and drip fertigation. Agric. Ecosyst. Environ. 2021, 316, 107464. [Google Scholar] [CrossRef]
- Liu, Q.; Qin, Y.; Zou, J.; Guo, Y.; Gao, Z. Annual nitrous oxide emissions from open-air and greenhouse vegetable cropping systems in China. Plant Soil 2013, 370, 223–233. [Google Scholar] [CrossRef]
- Wang, X.; Dou, Z.; Shi, X.; Zou, C.; Liu, D.; Wang, Z.; Guan, X.; Sun, Y.; Wu, G.; Zhang, B.; et al. Innovative management programme reduces environmental impacts in Chinese vegetable production. Nat. Food 2020, 2, 47–53. [Google Scholar] [CrossRef]
- Chen, X.; Cui, Z.; Fan, M.; Vitousek, P.; Zhao, M.; Ma, W.; Wang, Z.; Zhang, W.; Yan, X.; Yang, J.; et al. Producing more grain with lower environmental costs. Nature 2014, 514, 486–489. [Google Scholar] [CrossRef] [PubMed]
- Zhang, J.; He, P.; Ding, W.; Ullah, S.; Abbas, T.; Li, M.; Ai, C.; Zhou, W. Identifying the critical nitrogen fertilizer rate for optimum yield and minimum nitrate leaching in a typical field radish cropping system in China. Environ. Pollut. 2021, 268, 115004. [Google Scholar] [CrossRef] [PubMed]
- Ti, C.; Luo, Y.; Yan, X. Characteristics of nitrogen balance in open-air and greenhouse vegetable cropping systems of China. Environ. Sci. Pollut. Res. 2015, 22, 18508–18518. [Google Scholar] [CrossRef]
- Zhang, F.; Liu, F.; Ma, X.; Guo, G.; Liu, B.; Cheng, T.; Liang, T.; Tao, W.; Chen, X.; Wang, X. Greenhouse gas emissions from vegetables production in China. J. Clean. Prod. 2021, 317, 128449. [Google Scholar] [CrossRef]
- Liu, X.; Vitousek, P.; Chang, Y.; Zhang, W.; Matson, P.; Zhang, F. Evidence for a historic change occurring in China. Environ. Sci. Technol. 2016, 50, 505–506. [Google Scholar] [CrossRef]
- Farneselli, M.; Tosti, G.; Onofri, A.; Benincasa, P.; Guiducci, M.; Pannacci, E.; Tei, F. Effects of N sources and management strategies on crop growth, yield and potential N leaching in processing tomato. Eur. J. Agron. 2018, 98, 46–54. [Google Scholar] [CrossRef]
- Shan, L.; He, Y.; Chen, J.; Huang, Q.; Lian, X.; Wang, H.; Liu, Y. Nitrogen surface runoff losses from a Chinese cabbage field under different nitrogen treatments in the Taihu Lake Basin, China. Agric. Water Manag. 2015, 159, 255–263. [Google Scholar] [CrossRef]
- Zhao, Y.; Luo, J.; Chen, X.; Zhang, X.; Zhang, W. Greenhouse tomato–cucumber yield and soil N leaching as affected by reducing N rate and adding manure: A case study in the Yellow River Irrigation Region China. Nutr. Cycl. Agroecosys 2012, 94, 221–235. [Google Scholar] [CrossRef]
- Qu, Z.; Qi, X.; Wang, J.; Chen, Q.; Li, C. Effects of nitrogen application rate and topdressing times on yield and quality of Chinese cabbage and soil nitrogen dynamics. Environ. Pollut. Bioavail. 2019, 31, 1–8. [Google Scholar] [CrossRef] [Green Version]
- He, F.; Chen, Q.; Jiang, R.; Chen, X.; Zhang, F. Yield and nitrogen balance of greenhouse tomato (Lycopersicum esculentum Mill.) with conventional and site-specific nitrogen management in Northern China. Nutr. Cycl. Agroecosys 2007, 77, 1–14. [Google Scholar] [CrossRef]
- Hartmann, T.E.; Yue, S.; Schulz, R.; He, X.; Chen, X.; Zhang, F.; Müller, T. Yield and N use efficiency of a maize–wheat cropping system as affected by different fertilizer management strategies in a farmer’s field of the North China Plain. Field Crop. Res. 2015, 174, 30–39. [Google Scholar] [CrossRef]
- Guo, R.; Li, X.; Christie, P.; Chen, Q.; Jiang, R.; Zhang, F. Influence of root zone nitrogen management and a summer catch crop on cucumber yield and soil mineral nitrogen dynamics in intensive production systems. Plant Soil 2008, 313, 55–70. [Google Scholar] [CrossRef] [Green Version]
- Ren, T.; Christie, P.; Wang, J.; Chen, Q.; Zhang, F. Root zone soil nitrogen management to maintain high tomato yields and minimum nitrogen losses to the environment. Sci. Hortic. 2010, 125, 25–33. [Google Scholar] [CrossRef] [Green Version]
- Zhang, B.; Li, M.; Li, Q.; Cao, J.; Zhang, C.; Zhang, F.; Song, Z.; Chen, X. Accumulation and distribution characteristics of biomass and nitrogen in bitter gourd (Momordica charantia L.) under different fertilization strategies. J. Sci. Food. Agric. 2018, 98, 2681–2688. [Google Scholar] [CrossRef]
- Wang, X.; Zou, C.; Gao, X.; Guan, X.; Zhang, Y.; Shi, X.; Chen, X. Nitrate leaching from open-field and greenhouse vegetable systems in China: A meta-analysis. Environ. Sci. Pollut. Res. 2018, 25, 31007–31016. [Google Scholar] [CrossRef]
- Wang, X.; Zou, C.; Gao, X.; Guan, X.; Zhang, W.; Zhang, Y.; Shi, X.; Chen, X. Nitrous oxide emissions in Chinese vegetable systems: A meta-analysis. Environ. Pollut. 2018, 239, 375–383. [Google Scholar] [CrossRef]
- Cui, Z.; Wang, G.; Yue, S.; Wu, L.; Zhang, W.; Zhang, F.; Chen, X. Closing the N-use efficiency gap to achieve food and environmental security. Environ. Sci. Technol. 2014, 48, 5780–5787. [Google Scholar] [CrossRef] [PubMed]
- Zhu, J.H.; Li, X.L.; Christie, P.; Li, J.L. Environmental implications of low nitrogen use efficiency in excessively fertilized hot pepper (Capsicum frutescens L.) cropping systems. Agric. Ecosyst. Environ. 2005, 111, 70–80. [Google Scholar] [CrossRef] [Green Version]
- Beeckman, F.; Motte, H.; Beeckman, T. Nitrification in agricultural soils: Impact, actors and mitigation. Curr. Opin. Biotechnol. 2018, 50, 166–173. [Google Scholar] [CrossRef] [PubMed]
- Yang, M.; Zhu, X.; Bai, Y.; Sun, D.; Zou, H.; Fang, Y.; Zhang, Y. Coated controlled-release urea creates a win-win scenario for producing more staple grains and resolving N loss dilemma worldwide. J. Clean. Prod. 2021, 288, 125660. [Google Scholar] [CrossRef]
- Fan, C.; Li, B.; Xiong, Z. Nitrification inhibitors mitigated reactive gaseous nitrogen intensity in intensive vegetable soils from China. Sci. Total Environ. 2018, 612, 480–489. [Google Scholar] [CrossRef]
- Zhang, M.; Fan, C.H.; Li, Q.L.; Li, B.; Zhu, Y.Y.; Xiong, Z.Q. A 2-yr field assessment of the effects of chemical and biological nitrification inhibitors on nitrous oxide emissions and nitrogen use efficiency in an intensively managed vegetable cropping system. Agric. Ecosyst. Environ. 2015, 201, 43–50. [Google Scholar] [CrossRef]
- Incrocci, L.; Maggini, R.; Cei, T.; Carmassi, G.; Botrini, L.; Filippi, F.; Clemens, R.; Terrones, C.; Pardossi, A. Innovative controlled-release polyurethane-coated urea could reduce N leaching in tomato crop in comparison to conventional and stabilized fertilizers. Agronomy 2020, 10, 1827. [Google Scholar] [CrossRef]
- Shan, L.; He, Y.; Chen, J.; Huang, Q.; Wang, H. Ammonia volatilization from a Chinese cabbage field under different nitrogen treatments in the Taihu Lake Basin, China. J. Environ. Sci. China 2015, 38, 14–23. [Google Scholar] [CrossRef]
- Bai, X.; Zhang, Z.; Cui, J.; Liu, Z.; Chen, Z.; Zhou, J. Strategies to mitigate nitrate leaching in vegetable production in China: A meta-analysis. Environ. Sci. Pollut. Res. 2020, 27, 18382–18391. [Google Scholar] [CrossRef]
- Gao, J.; Luo, J.; Lindsey, S.; Shi, Y.; Sun, Z.; Wei, Z.; Wang, L. Benefits and risks for the environment and crop production with application of nitrification inhibitors in China. J. Soil Sci. Plant Nutr. 2021, 21, 497–512. [Google Scholar] [CrossRef]
- Li, T.; Zhang, W.; Yin, J.; Chadwick, D.; Norse, D.; Lu, Y.; Liu, X.; Chen, X.; Zhang, F.; Powlson, D.; et al. Enhanced-efficiency fertilizers are not a panacea for resolving the nitrogen problem. Glob. Change Biol. 2017, 24, e511–e521. [Google Scholar] [CrossRef] [PubMed]
- Abalos, D.; Jeffery, S.; Sanz-Cobena, A.; Guardia, G.; Vallejo, A. Meta-analysis of the effect of urease and nitrification inhibitors on crop productivity and nitrogen use efficiency. Agric. Ecosyst. Environ. 2014, 189, 136–144. [Google Scholar] [CrossRef]
- Wang, X.; Zou, C.; Zhang, Y.; Shi, X.; Liu, J.; Fan, S.; Liu, Y.; Du, Y.; Zhao, Q.; Tan, Y.; et al. Environmental impacts of pepper (Capsicum annuum L.) production affected by nutrient management: A case study in southwest China. J. Clean. Prod. 2018, 171, 934–943. [Google Scholar] [CrossRef]
- Badr, M.A.; Abou-Hussein, S.D.; El-Tohamy, W.A. Tomato yield, nitrogen uptake and water use efficiency as affected by planting geometry and level of nitrogen in an arid region. Agric. Water. Manag. 2016, 169, 90–97. [Google Scholar] [CrossRef]
- Min, J.; Zhang, H.; Shi, W. Optimizing nitrogen input to reduce nitrate leaching loss in greenhouse vegetable production. Agric. Water. Manag. 2012, 111, 53–59. [Google Scholar] [CrossRef]
- Suter, H.; Pandey, A.; Lam, S.K.; Davies, R.; Hassan, R.; Riches, D.; Chen, D. Opportunities to improve nitrogen use efficiency in an intensive vegetable system without compromising yield. J. Environ. Qual. 2021, 50, 791–798. [Google Scholar] [CrossRef]
- Chen, H.; Zhou, J.; Li, B.; Xiong, Z. Yield-scaled N2O emissions as affected by nitrification inhibitor and overdose fertilization under an intensively managed vegetable field: A three-year field study. Atmos. Environ. 2019, 206, 247–257. [Google Scholar] [CrossRef]
- Yan, P.; Yue, S.; Meng, Q.; Pan, J.; Ye, Y.; Chen, X.; Cui, Z. An Understanding of the accumulation of biomass and nitrogen is benefit for Chinese maize production. Agron. J. 2016, 108, 895–904. [Google Scholar] [CrossRef]
- Miao, Q.; Zhang, J.; Chen, Y.; Xue, Y.; Cui, Z. Integrated nitrogen amount and sources maximize maize nitrogen efficiency in the saline soils. Agron. J. 2021, 113, 1183–1196. [Google Scholar] [CrossRef]
- Min, J.; Sun, H.; Kronzucker, H.J.; Wang, Y.; Shi, W. Comprehensive assessment of the effects of nitrification inhibitor application on reactive nitrogen loss in intensive vegetable production systems. Agric. Ecosyst. Environ. 2021, 307, 107227. [Google Scholar] [CrossRef]
- Gao, X.; Li, C.; Zhang, M.; Wang, R.; Chen, B. Controlled release urea improved the nitrogen use efficiency, yield and quality of potato (Solanum tuberosum L.) on silt loamy soil. Field Crop. Res 2015, 181, 60–68. [Google Scholar] [CrossRef]
- Akiyama, H.; Yan, X.; Yagi, K. Evaluation of effectiveness of enhanced-efficiency fertilizers as mitigation options for N2O and NO emissions from agricultural soils: Meta-analysis. Global Chang. Biol. 2010, 16, 1837–1846. [Google Scholar] [CrossRef]
- Tilman, D.; Balzer, C.; Hill, J.; Befort, B.L. Global food demand and the sustainable intensification of agriculture. Proc. Natl. Acad. Sci. USA 2011, 108, 20260–20264. [Google Scholar] [CrossRef] [PubMed] [Green Version]


| Treatment | Fertilizer Application Rates (N-P2O5-K2O) | ||||
|---|---|---|---|---|---|
| Seedling Period | Blooming and Fruit-Setting Period | Mid-Fruiting Period | Full-Fruiting Period | Total | |
| CK | 0–70–60 | 0–70–80 | 0–0–80 | 0–0–80 | 0–140–300 |
| OPT | 100–70–60 | 50–70–80 | 50–0–80 | 50–0–80 | 250–140–300 |
| FP | 280–145–115 | 120–145–115 | 0–0–0 | 0–0–0 | 400–290–230 |
| NI | 100–70–60 | 50–70–80 | 50–0–80 | 50–0–80 | 250–140–300 |
| CRF | 250–70–60 | 0–70–80 | 0–0–80 | 0–0–80 | 250–140–300 |
| Year | Treatment | PFPN (kg kg−1) | AEN (kg kg−1) | REN (%) |
|---|---|---|---|---|
| 2019 | CK | —— | —— | —— |
| OPT | 138 a | 85.6 a | 32.1 b | |
| FP | 87.8 b | 55.1 b | 24.7 c | |
| NI | 152 a | 99.4 a | 41.1 a | |
| CRF | 153 a | 101 a | 41.2 a | |
| 2020 | CK | —— | —— | —— |
| OPT | 153 a | 91.8 a | 33.7 b | |
| FP | 99.0 b | 60.6 b | 25.4 c | |
| NI | 167 a | 106 a | 42.9 a | |
| CRF | 169 a | 108 a | 43.6 a | |
| Analysis of variance | ||||
| Year | * | * | NS | |
| Treatment | * | * | * | |
| Year × Treatment | NS | NS | NS | |
Publisher’s Note: MDPI stays neutral with regard to jurisdictional claims in published maps and institutional affiliations. |
© 2022 by the authors. Licensee MDPI, Basel, Switzerland. This article is an open access article distributed under the terms and conditions of the Creative Commons Attribution (CC BY) license (https://creativecommons.org/licenses/by/4.0/).
Share and Cite
Ma, X.; Zhang, F.; Liu, F.; Guo, G.; Cheng, T.; Wang, J.; Shen, Y.; Liang, T.; Chen, X.; Wang, X. An Integrated Nitrogen Management Strategy Promotes Open-Field Pepper Yield, Crop Nitrogen Uptake, and Nitrogen Use Efficiency in Southwest China. Agriculture 2022, 12, 524. https://doi.org/10.3390/agriculture12040524
Ma X, Zhang F, Liu F, Guo G, Cheng T, Wang J, Shen Y, Liang T, Chen X, Wang X. An Integrated Nitrogen Management Strategy Promotes Open-Field Pepper Yield, Crop Nitrogen Uptake, and Nitrogen Use Efficiency in Southwest China. Agriculture. 2022; 12(4):524. https://doi.org/10.3390/agriculture12040524
Chicago/Turabian StyleMa, Xiao, Fen Zhang, Fabo Liu, Guangzheng Guo, Taihong Cheng, Junjie Wang, Yuanpeng Shen, Tao Liang, Xinping Chen, and Xiaozhong Wang. 2022. "An Integrated Nitrogen Management Strategy Promotes Open-Field Pepper Yield, Crop Nitrogen Uptake, and Nitrogen Use Efficiency in Southwest China" Agriculture 12, no. 4: 524. https://doi.org/10.3390/agriculture12040524