Article

Quantifying and Mapping Human Appropriation of Net Primary Productivity in Qinghai Grasslands in China

1
Key Laboratory of Restoration Ecology for Cold Regions Laboratory in Qinghai, Northwest Institute of Plateau Biology, Chinese Academy of Sciences, Xining 810008, China
2
Key Laboratory of Adaptation and Evolution of Plateau Biota, Northwest Institute of Plateau Biology, Chinese Academy of Sciences, Xining 810008, China
3
University of the Chinese Academy of Sciences, Beijing 100049, China
4
State Key Laboratory of Desert and Oasis Ecology, Xinjiang Institute of Ecology and Geography, Chinese Academy of Sciences, Urumqi 830011, China
5
College of Natural Resources and Environment, Northwest A&F University, Yangling, Xianyang 712100, China
*
Author to whom correspondence should be addressed.
Agriculture 2022, 12(4), 483; https://doi.org/10.3390/agriculture12040483
Submission received: 17 February 2022 / Revised: 24 March 2022 / Accepted: 28 March 2022 / Published: 29 March 2022

Abstract

:
Human appropriation of net primary productivity (HANPP) is an important indicator for assessing ecological sustainability. However, the spatiotemporal dynamics of HANPP in the Qinghai grasslands remain unclear. In this study, we used the spatially explicit Biome-BGCMuSo model to quantify and map HANPP in the Qinghai grasslands from 1979 to 2018. Generally, the actual net primary productivity (NPPact) was slightly lower than the potential net primary productivity (NPPpot), and the difference between the NPPpot and NPPact increased slightly over time. From 1979 to 2001, the NPPpot and NPPact were relatively stable; however, from 2001 to 2018, both showed significant fluctuating upward trends. From 1979 to 2018, HANPP showed a fluctuating upward trend from 6.36 to 31.85 gC/m2/yr, with an average increase of 2.14 gC/m2/yr. The average HANPP was 16.90 gC/m2/yr, which represented 18.80% of the NPPpot of Qinghai grasslands. High HANPP mainly occurred in eastern Qinghai, whereas it was low in central and western Qinghai. Conversely, from 1979 to 2018, the HANPP efficiency decreased in a fluctuating way from 98.28% to 72.05%, with an average annual decrease of 0.66%. The interannual variations in the HANPP efficiency and harvest were negatively correlated, with a correlation coefficient of −0.46 (p < 0.01). The average HANPP efficiency was 85.33%, and the values in most grids were between 80% and 100%, being relatively low in southern and eastern Qinghai. In rare cases, the HANPP efficiency was greater than 1. This study clarifies the details of spatiotemporal dynamics of HANPP in the Qinghai grasslands and indicates the need to optimize local management of grassland resources to ensure future ecological sustainability.

1. Introduction

The sustainability of ecosystem services is the basis of human survival and sustainable development [1,2]. However, the carrying capacity of natural ecosystems is limited. Excessive disturbance inevitably destroys ecosystem structure and functioning, leading to the decline and loss of ecosystem services [3]. Previous studies have shown that environmental change and human activities are changing ecosystem patterns and processes in different regions on earth [4,5,6]. These changes inevitably affect human survival and global sustainable development [7,8]. Thus, it has become urgent for future global development to increase ecological security and achieve sustainable natural resource utilization. In particular, assessing ecosystem sustainability is a core issue in sustainable development research [7,9].
Several quantitative methods have been used to assess ecological sustainability [10,11,12,13]. Among them, human appropriation of net primary productivity (HANPP) is one of the popular methods of assessing ecological sustainability [13,14,15]. HANPP is the difference between the potential net primary productivity (NPPpot) and the net primary productivity (NPP) remaining in the ecosystem after human extraction of resources [14,15]. It directly uses the total NPP as the index factor to comprehensively consider the ecological processes of an ecosystem and the direct (or indirect) interference of human activities [14,16]. It reflects the interaction between the ecosystem and human activities from the perspective of resource supply and demand and intuitively displays the degree of utilization of the ecosystem for human activities. In addition, HANPP is a method that is simple and easy to use [15,17,18]. Therefore, it has been widely used in research on related topics.
Qinghai, located in the northeastern part of the Qinghai–Tibet Plateau, is the source of the Yellow, Yangtze, and Lancang Rivers [19]. It has an extremely important and strategic ecological position [20,21]. Grassland ecosystems are widely distributed in this region, accounting for 58.11% of the total land area, and they have high ecological and economic values [20,22,23,24]. As a basis for animal husbandry, grazing is the most important human activity in the Qinghai grasslands [9,25]. Over the past few decades, part of these grassland ecosystems has been severely degraded by overgrazing [26,27]. Overgrazing in Qinghai grassland ecosystems indicates that they have been over-utilized by humans [28,29]. Excessive HANPP reduces the available resources for other species and affects the biodiversity, carbon–water cycle, and ecosystem services, resulting in serious ecological and environmental problems [17,29,30]. Previous studies have suggested that moderate grazing increases the NPP when compared to ungrazed areas [31,32]. Thus, assessing the HANPP of grassland ecosystems is conducive to understanding the impact of anthropogenic stressors on them. It helps authorities scientifically guide human activities to utilize and protect ecosystems and achieve harmonious development of the social economy and natural environment [15,33]. However, an estimation of HANPP is lacking for the Qinghai grassland ecosystem.
Although HANPP estimations have been conducted at global, national, and regional scales, there are relatively few specific or systematic reports on the spatiotemporal dynamics of HANPP in grassland ecosystems [15,16,33,34,35]. In addition, previous studies on grassland HANPP estimation did not effectively consider the effects of grazing or the specific natural environment on grass growth, leading to considerable uncertainty in the HANPP estimation of grazing grasslands [14,16,31]. To overcome this, we selected the Biome-BGCMuSo model to estimate the storage and fluxes of carbon in Qinghai grasslands. This is a mechanistic model developed from the Biome-BGC that has been successfully applied in many regions, including the Qinghai–Tibet Plateau [31,36,37,38]. The Biome-BGCMuSo model can better simulate grass growth than the Biome-BGC model, especially when considering the impact of certain physiological and ecological processes on grass productivity under energy and water stress; both of these stress conditions are in accordance with the characteristics of alpine environments and the wide distribution of arid and semi-arid grasslands in Qinghai [39]. In addition, the Biome-BGCMuSo model also effectively considers the grazing process [39,40]. Based on the Biome-BGCMuSo model, we aimed to estimate the HANPP and explore its spatiotemporal dynamics in the Qinghai grasslands from 1979 to 2018. This will further our knowledge of the HANPP in grasslands and provide theoretical guidance and data support for future local grassland management.

2. Materials and Methods
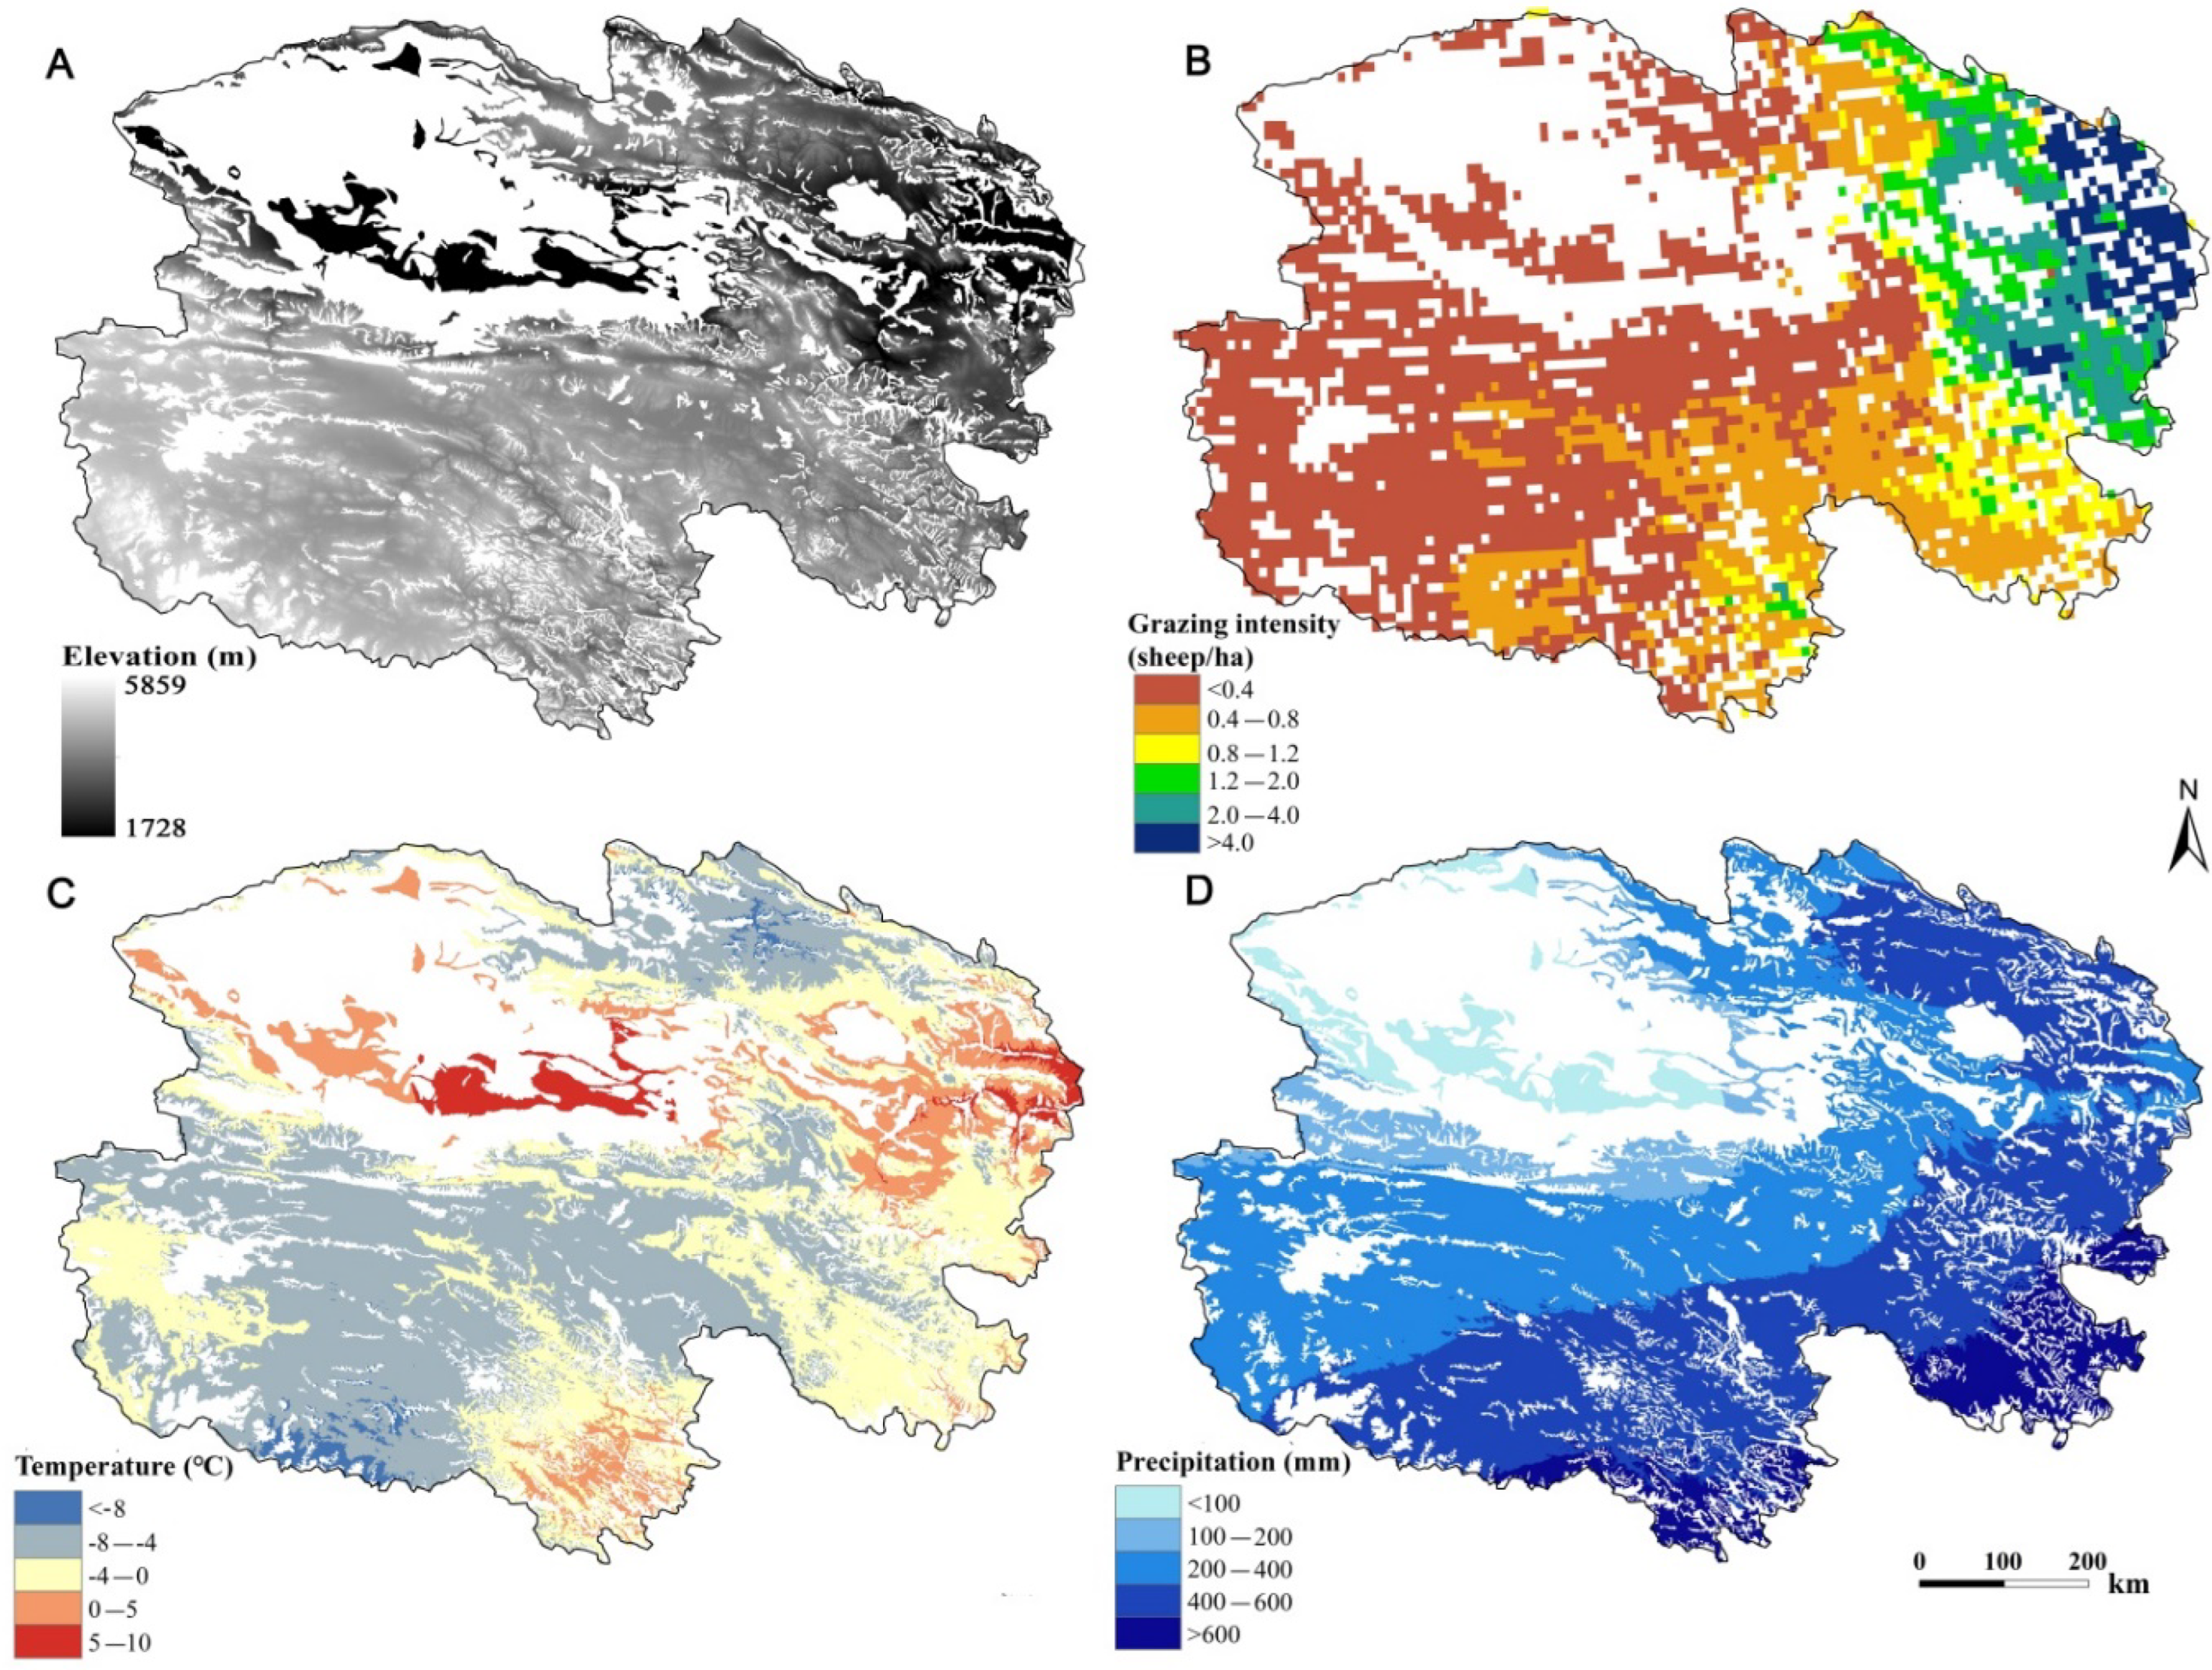
2.1. Study Area

Qinghai is located in the northeastern part of the Qinghai–Tibet Plateau, which is called “the roof of the world” [19], and has an average altitude of 3000–4000 m a.s.l. It experiences a plateau continental climate, with an average annual temperature of 1.37 °C and average annual precipitation of 365.70 mm. Its climate is characterized by a low temperature, large temperature differences between the day and night, low but concentrated rainfall, long sunshine duration, and strong solar radiation. Winters are cold and long, and summers are cool and short. Qinghai has a grassland area of 41.9 million hm2, accounting for 58.11% of the total land area [20,22,23,24]. Grasslands are mainly distributed in the southern Qinghai Plateau, Qaidam Basin, and around Qinghai Lake. The plants occurring in this region grow under energy stress, and arid and semi-arid grasslands are also widespread. The grassland ecosystem in this region is sensitive and vulnerable to climate change and anthropogenic activities. Parts of the grassland ecosystems in Qinghai have been severely degraded over the past few decades due to grazing disturbance (Figure 1) [22,24,26,27].

2.2. Methods

In the present study, as proposed by Haberl et al. [14] and Huang et al. [31], HANPP was defined as the sum of the harvest and the difference between NPPpot and the actual net primary productivity (NPPact). In Qinghai, the grasslands are mainly used for grazing, and other human disturbances are very weak and difficult to quantify because the necessary data are lacking. Thus, when estimating HANPP in Qinghai grasslands, we assumed that grazing was the only human disturbance [9,25].
The Biome-BGCMuSo model is a process-based ecosystem model developed from the Biome-BGC model to improve its ability to simulate the carbon cycle in managed ecosystems by integrating the multilayer soil module, soil-moisture-related plant senescence, dynamic phenology, grazing, and so on. A detailed description of the Biome-BGCMuSo model can be found in Hidy et al. [39]. In this model, HANPP and HANPP efficiency were calculated step by step as follows.
The total NPPpot (NPP under a non-grazed scenario (gC/m2)) was calculated as follows:
NPPpot = Cveg + Clitter
where Cveg is the vegetative carbon and Clitter is the litter carbon.
This model defines grazing based on the “livestock unit” (LSU) terminology, where 1 LSU refers to an average animal. The grass eaten by domestic animals is considered to be harvested by humans. Thus, the total NPPact (NPP under the grazed scenario (gC/m2)) was calculated as follows:
NPPact = Cveg + Clitter + harvest
where harvest (g C/ha) is the carbon consumed by domestic animals.
Furthermore, HANPP was calculated as follows:
HANPP = NPPpot – NPPact + harvest
HANPP efficiency was calculated as described by Fetzel et al. [41]:
HANPP efficiency = harvest/HANPP
HANPP efficiency is used to express how efficiently the key natural resource NPP entered the socio-ecological system and is closely related to the rationality of land use [41,42].
The Biome-BGCMuSo model developed by Hidy et al. [39] was originally used for simulation at the site scale. In the present study, to apply the Biome-BGCMuSo model over a large area, we assumed that the Qinghai grasslands consisted of many grids with a spatial resolution of 10 × 10 km. A loop program was designed to run the Biome-BGCMuSo model in each grid before the outputs of the Qinghai grasslands could be acquired. Then, the spatiotemporal dynamics of HANPP and HANPP efficiency could be acquired according to the statistics of the model outputs.
In the present study, we compared the simulated NPP with the observed NPP to further validate the suitability of this model for the Qinghai grasslands. We found that the Biome-BGCMuSo model performed well in the NPP simulation under both the grazed (R2 = 0.92) and non-grazed (R2 = 0.96) scenarios (Figure 2).

2.3. Data

The data used in the present study included the observed NPP, grazing, meteorological, and ancillary data. The observed NPP data were used as model validation data, and other data were used to drive the model. To facilitate the operation of the Biome-BGCMuSo model at different grids, all regional data were extracted and smoothed to a 10 × 10 km resolution using Python and R.

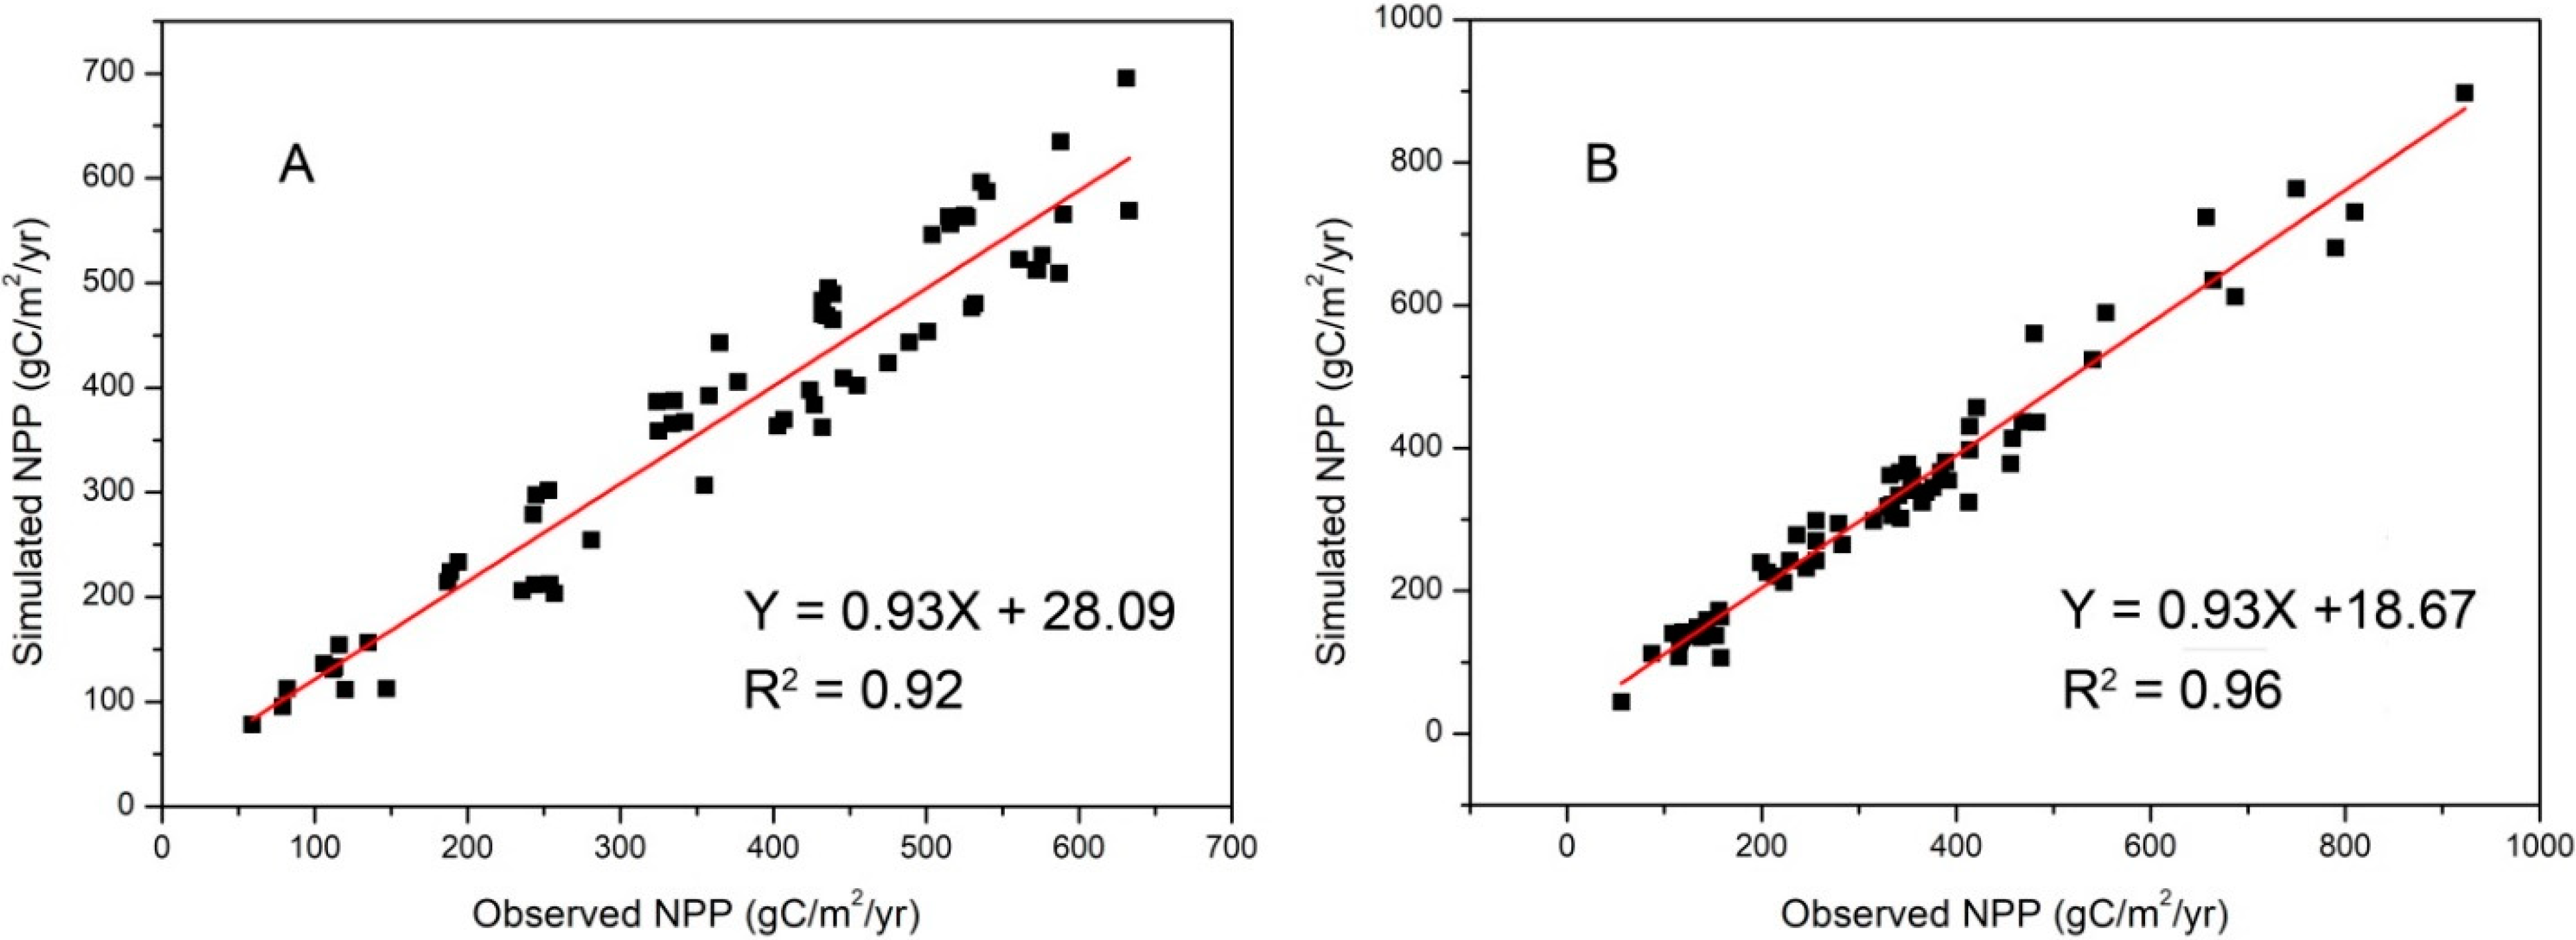
2.3.1. Observed NPP Data

The observed NPP data were collected from previous publications [43,44] and field observations of the Qinghai grasslands. A total of 55 plots were used to sample the annual NPP data, among which 24 and 31 plots were used to collect annual NPP data outside and inside the enclosure under the grazing and non-grazing scenarios, respectively. Among all the sampling sites, five were used to collect annual NPP data under both the grazed (outside the enclosure) and non-grazed (inside the enclosure) scenarios. We collected the aboveground and belowground biomass at each plot at the end of the growing season. The annual total biomass was then converted into the annual observed NPP by multiplying the value by 0.45, which was the conversion coefficient adopted by JingYun and Wei [45]. In this study, the observed NPP values were compared with the simulated NPP values to validate the reliability of the simulation results.

2.3.2. Grazing Data

Grazing data were produced by integrating multi-source data. The grazing intensity data for 2010 were extracted from the Food and Agriculture Organization (FAO) page “Gridded Livestock of the World” (GLW) (12 June 2021). The GLW uses the reference year of 2010 for global distributions of livestock, with a spatial resolution of 5 min of arc (approximately 10 km at the equator). Moreover, it is a peer-reviewed spatial dataset. The average spatial resolutions of the underlying census data are between 100 and 250 km2 in Qinghai, China. In each of the census polygons, the livestock numbers were divided by the surface area of the administrative unit polygon to estimate the densities of livestock, and they were corrected by a mask excluding unsuitable areas [46]. To produce a time series of the grazing intensity data for the years from 1979 to 2018, we corrected these data using livestock statistics from the local government in different administrative regions from 1979 to 2018, which also further ensured a high accuracy of the grazing intensity data. A grazing calendar was created using the information obtained from herders in the Qinghai grasslands. In the present study, all livestock were converted into sheep units (a female sheep that eats 1.8 kg of hay with 14% moisture per day) using the conversion coefficient provided by the Ministry of Agriculture of the People’s Republic of China (16 June 2021) and the data obtained from a survey of local herders—one cattle equals six sheep, one yak equals 4.5 sheep, one horse equals six sheep, one goat equals 0.9 sheep, and one camel equals eight sheep.

2.3.3. Meteorological Data

Meteorological data included the daily values of air temperature, precipitation, humidity, radiation, and day length. The regional meteorological data for the Qinghai grasslands in the period from 1979 to 2018 were derived from the China Meteorological Forcing Dataset because their data were evaluated according to the observed data and proved to be more accurate than the existing reanalysis data worldwide [47]. This dataset was produced by integrating multi-source data (including ground-based observations and several gridded datasets from remote sensing and reanalysis) and can provide driving data for land surface process simulations in China [47]. The Biome-BGCMuSo code assumes that all years have 365 days; therefore, we omitted December 31 from leap years within the study period.

2.3.4. Ancillary Data

Soil data, including the texture and PH, were derived from the Harmonized World Soil Database (HWSD) (10 January 2021). The HWSD is a 30 arc-second raster database. In this database, the soil data for the China region were obtained from the second national land survey by the Nanjing Soil Institute, Chinese Academy of Sciences. Elevation data were derived from the Shuttle Radar Topography Mission (SRTM) (12 January 2021) with a 30-m resolution. Ecophysiological parameters were mainly derived from the default parameters of the model plant (C3 grass), which were acquired from a large number of ecophysiological studies [48]. In the present study, some key parameters were corrected in accordance with the field investigations in the Qinghai grasslands.

3. Results

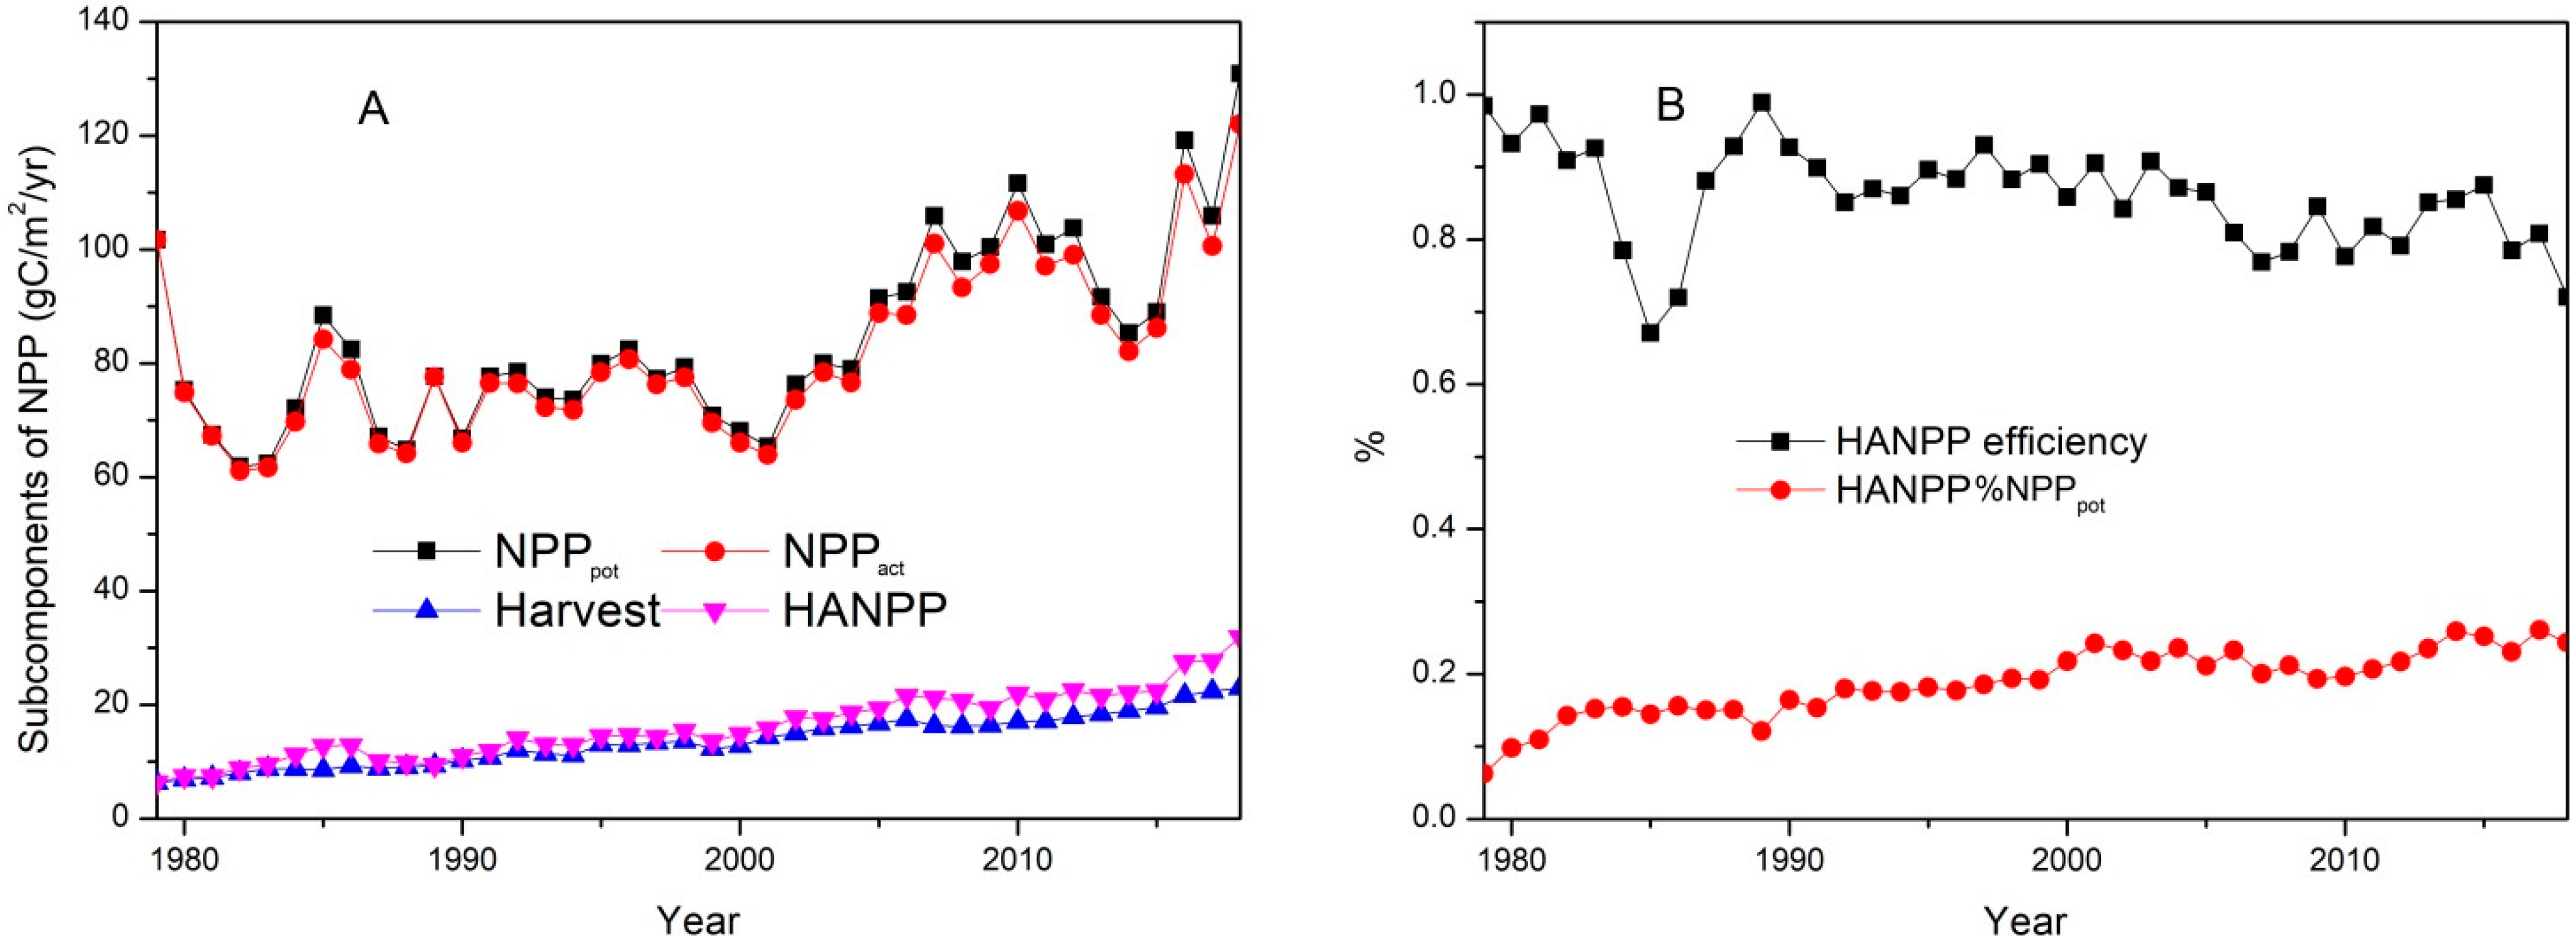
3.1. Interannual Variation in HANPP in Qinghai Grasslands

Figure 3A shows the interannual variations in the NPP components (HANPP, NPPpot, NPPact, and harvest) in the Qinghai grasslands from 1979 to 2018. Generally, the NPPact was slightly lower than the NPPpot, and the difference between the NPPpot and NPPact (NPPpot minus NPPact) increased slightly as the grazing intensity increased from 1979 to 2018. From 1979 to 2001, the NPPpot and NPPact were both relatively stable; the NPPpot fluctuated around 74.58 gC/m2/yr, while the NPPact fluctuated around 73.15 gC/m2/yr. From 2001 to 2018, the NPPpot and NPPact both showed fluctuating upward trends; the NPPpot increased from 65.41 to 130.91 gC/m2/yr, with an average increase of 3.64 gC/m2/yr, while the NPPact increased from 63.91 to 122.01 gC/m2/yr, with an average increase of 3.23 gC/m2/yr. From 1979 to 2018, HANPP increased in a fluctuating way from 6.36 to 31.85 gC/m2/yr, with an average increase of 2.14 gC/m2/yr. On an annual temporal scale, harvest was the main contributor to HANPP in the Qinghai grasslands from 1979 to 2018. The interannual variations in HANPP and harvest had a significant positive correlation, with a correlation coefficient of 0.98 (p < 0.001).
Figure 3B shows the interannual variations in HANPP efficiency and HANPP%NPPpot (the percentage that HANPP accounted for NPPpot) in the Qinghai grasslands from 1979 to 2018. The HANPP efficiency showed a weak fluctuating downward trend from 1979 to 2018 (98.28% to 72.05%), with an average annual decrease of 0.66%. The interannual variations in HANPP efficiency and harvest showed a negative correlation, with a correlation coefficient of -0.46 (p < 0.01). HANPP%NPPpot showed a fluctuating upward trend from 1979 to 2018 (6.25% to 24.33%), with an average annual increase of 0.45%. The interannual variations in HANPP%NPPpot and harvest had a significant positive correlation, with a correlation coefficient of 0.90 (p < 0.001).

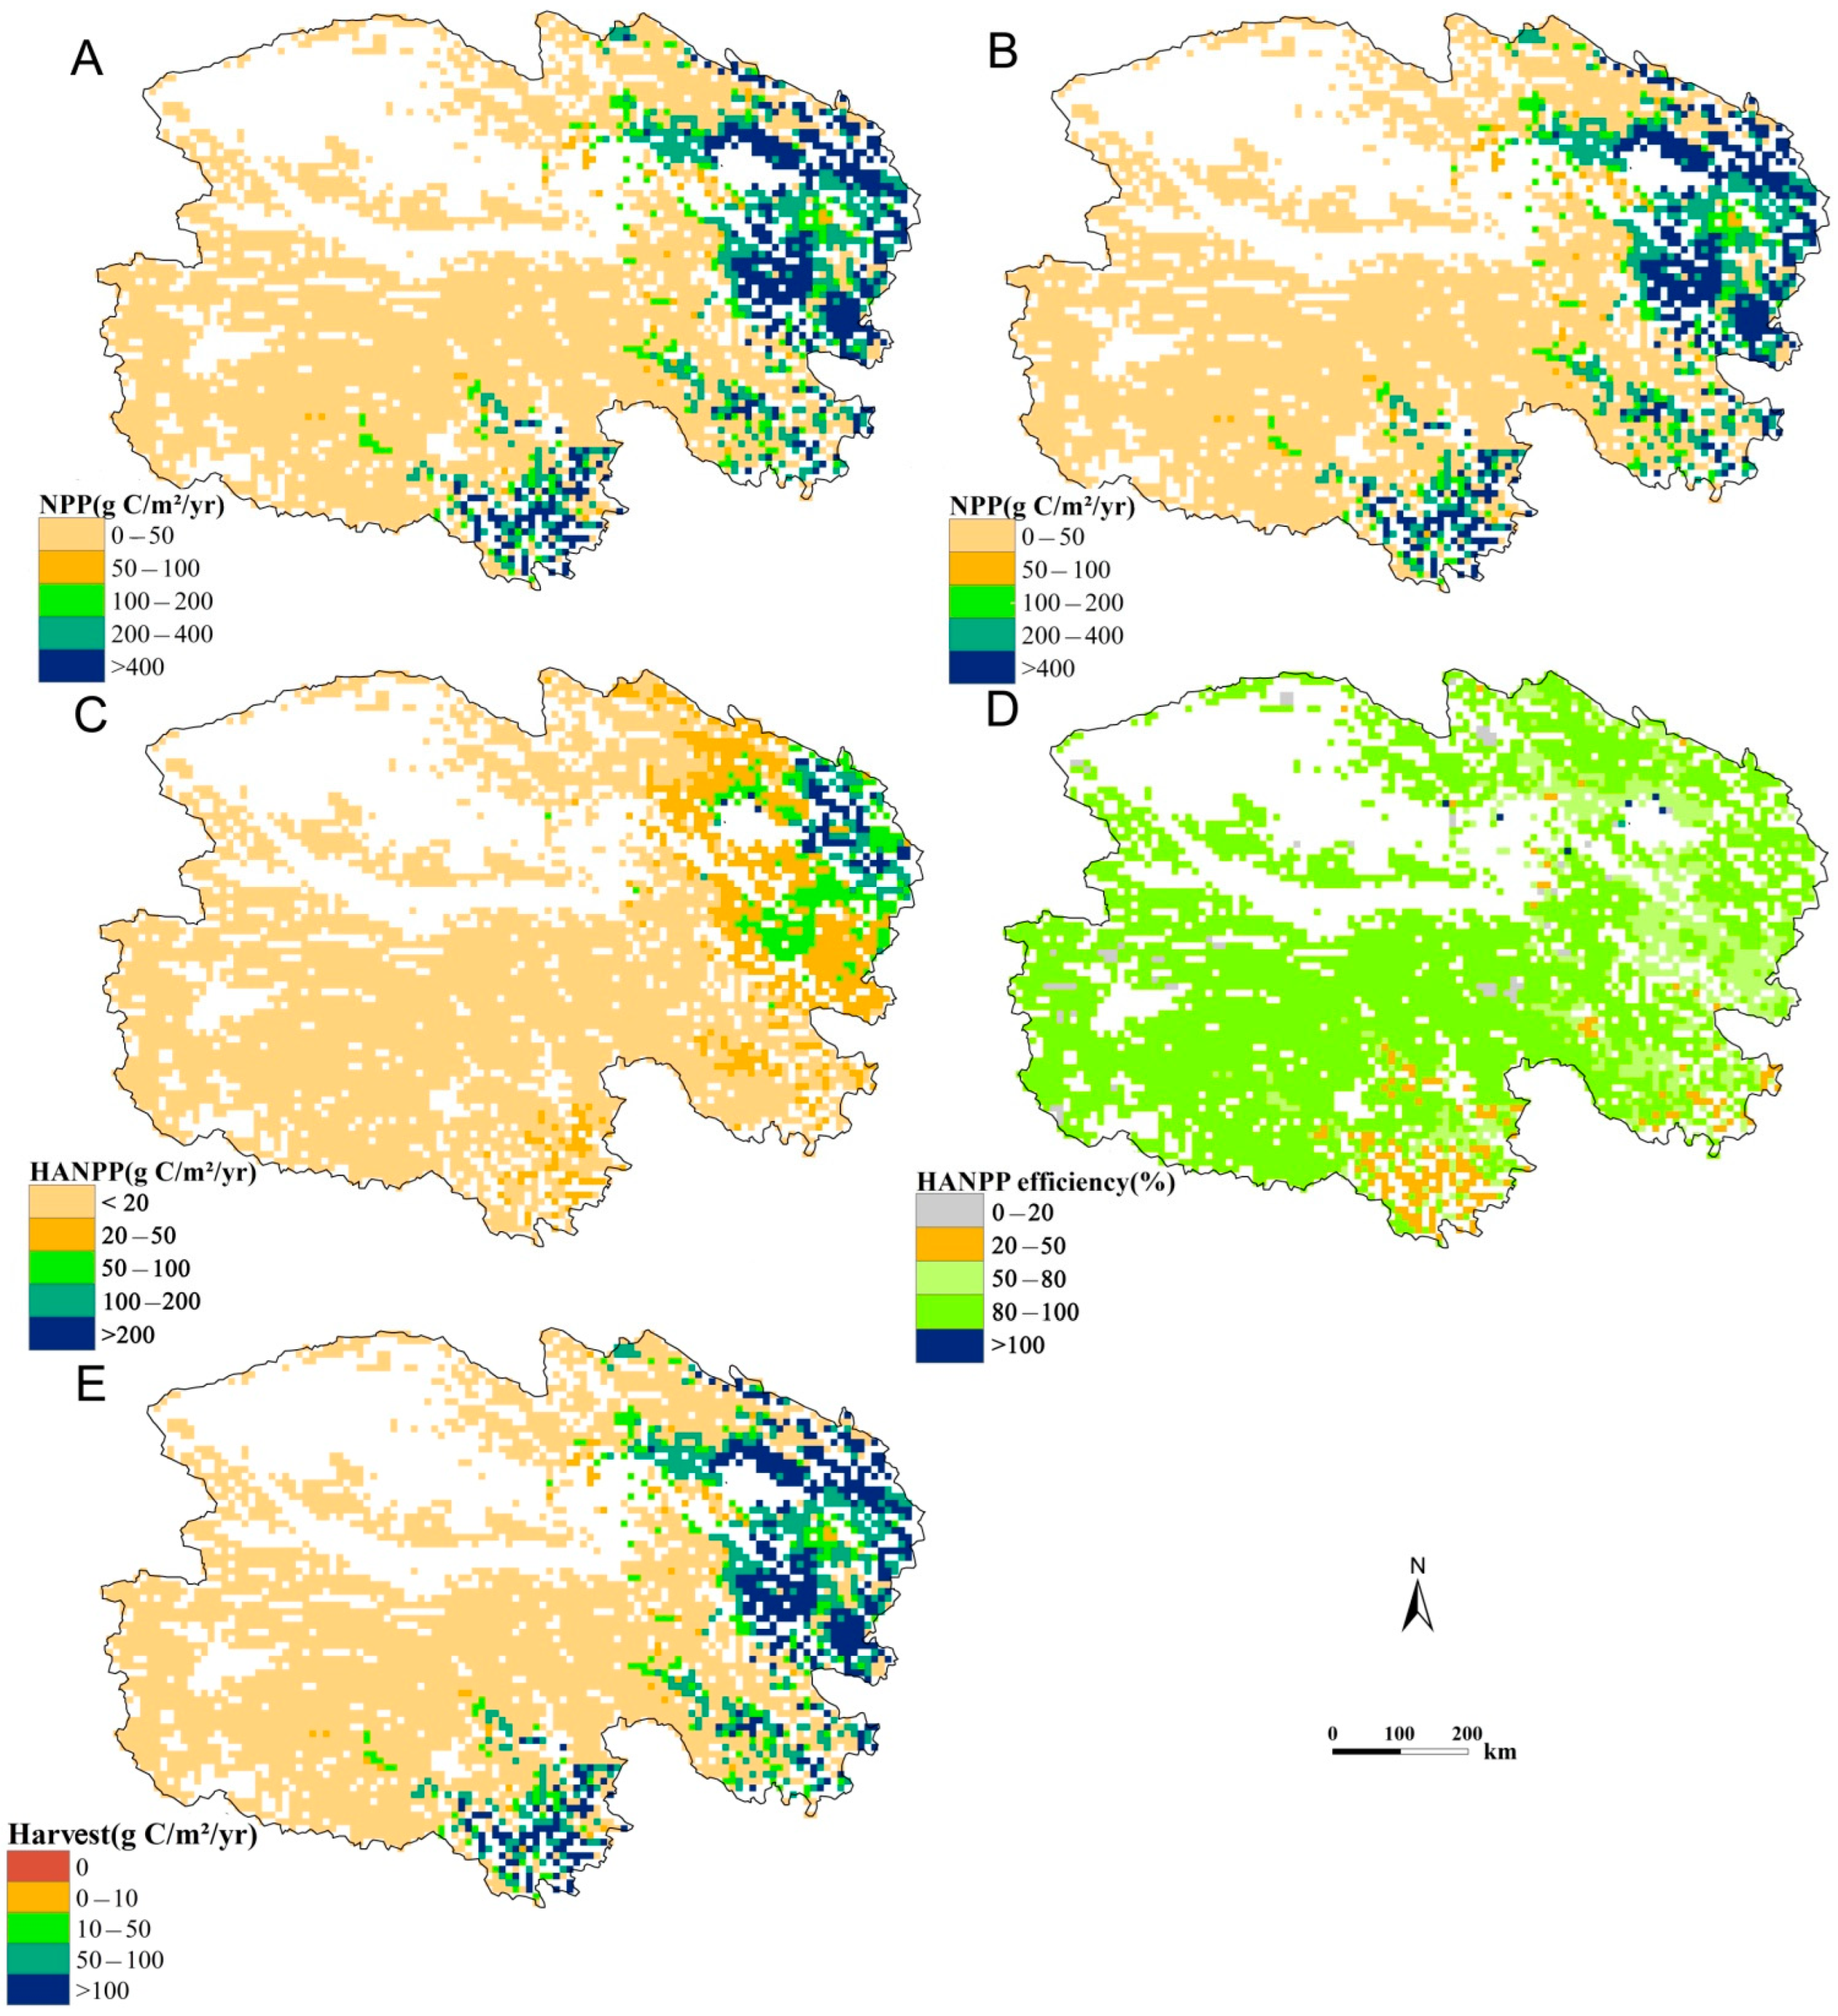
3.2. Spatial Pattern of HANPP in Qinghai Grasslands

The NPPpot and NPPact followed similar spatial patterns in the Qinghai grasslands. High values mainly occurred in eastern and southeastern Qinghai, whereas low values mainly occurred in central and western Qinghai (Figure 4A,B). In general, HANPP is used to evaluate the extent to which humans disturb ecosystems. Our estimates show that the average HANPP was 16.90 gC/m2/yr, representing 18.80% of the Qinghai grassland NPPpot. High HANPP mainly occurred in eastern Qinghai, whereas low HANPP mainly occurred in central and western Qinghai (Figure 4C). The average HANPP declined with increasing altitude, as follows: 56.61 (<3000 m), 38.56 (3000–4000 m), and 6.97 gC/m2/yr (>4000 m). The HANPP efficiency was used to evaluate the efficiency of the human utilization of ecosystems. We found that, in most grids, the average annual HANPP efficiency values were between 80% and 100%; they were relatively low in southern and eastern Qinghai and at different altitudes, as follows: 90.09 (<3000 m), 82.59 (3000–4000 m), and 90.04 (>4000 m) (Figure 4D). In rare cases, the HANPP efficiency was greater than 1. Overall, the average harvest in the Qinghai grasslands was 14.43 gC/m2/yr, contributing 85.38% to HANPP. High harvest mainly occurred in eastern Qinghai, whereas low harvest mainly occurred in central and western Qinghai (Figure 4E). At different altitudes, the average annual harvest decreased with increasing altitude, as follows: 51.25 (<3000 m), 31.49 (3000–4000 m), and 5.99 gC/m2 (>4000 m) (Table 1).

4. Discussion

4.1. Uncertainties in the Results

In the present study, the outputs of the Biome-BGCMuSo model were compared with the observed data, which proved the reliability of the research results. However, uncertainties in the present study were still inevitable due to the complexity of carbon cycling in reality [49,50,51,52].
First, uncertainty was introduced by the method itself. In this study, we assumed that grazing was the only human-related disturbance in the study area, which resulted in uncertainties in the HANPP estimates. We assumed that grazing was the only human-related disturbance due to the lack of sufficient data for assessing the impacts of other human disturbances in this region. Although the grasslands in Qinghai were mainly used for grazing, and other human disturbances contributed much less to the HANPP estimates [9,25], ignoring other human disturbances would inevitably introduce uncertainty. In addition, the model structure itself introduced uncertainty. All models are simplified representations of the real world, which means the complex carbon cycle cannot be fully considered in the Biome-BGCMuSo model. For example, the freezing–thawing cycle that substantially influences plant growth could not be fully considered in the Biome-BGCMuSo model because few studies have quantified its underlying effect on plant productivity in alpine grasslands. Livestock trampling has an indirect impact on plant growth by directly influencing soil compaction, water, and so on. However, the trampling effect could not be included in the Biome-BGCMuSo model because it has been challenging to quantify in previous studies [39,40].
Second, the model input data can be an important limiting factor when estimating the HANPP. The accuracy of the model simulation results is directly related to the accuracy of the model input data. Previous studies have shown that meteorological input data have the greatest impact on the accuracy of model simulation results [39,40,49]. Although the meteorological data used in the present study were validated with observed data (including observed data in Qinghai), showing that this dataset has higher accuracy than other available reanalysis data [47], the accuracy of the data was still lower than that of the observed data, which inevitably led to uncertainty in the results. The grazing data were the key inputs used to estimate the grazing effects. The livestock distribution data for 2010 were extracted from the GLW database (12 June 2021), which was developed to provide a statistically-informed estimate of how livestock may be distributed within a given census unit. Although we corrected the data according to survey statistics from the government to further ensure high precision, uncertainty was inevitable due to the macroscopic nature of livestock statistics from the government.

4.2. Interannual Variation in HANPP in Qinghai Grasslands

HANPP showed a fluctuating upward trend from 1979 to 2018, and the difference between the NPPpot and NPPact (NPPpot minus NPPact) increased slightly in the Qinghai grasslands during this period, indicating that the grazing pressure on the grassland ecosystems increased [34,49]. In addition, we found that the NPPpot and NPPact significantly increased in a fluctuating way from 2001 to 2018; we inferred that climate change led to improvements in the ecological environment of the Qinghai grasslands in recent years. This conclusion is inconsistent with some previous studies that have shown that the Qinghai grasslands have been somewhat restored in recent years by effective government-led ecological restoration measures [53,54,55,56]. Apart from the increase in HANPP, we found that the HANPP%NPPpot slightly increased from 1979 to 2018. This also indicates that grazing pressure increased during this period. However, the NPPact showed a clear increase from 2001 to 2018 due to climate change, which alleviated grazing pressure on the grassland ecosystem (Figure 3A). High HANPP would notably alter ecosystem energy flows, and excessive HANPP would inevitably lead to a reduction in biodiversity and ecological degradation [14,34]. In the present study, we found that HANPP efficiency showed a weak fluctuating downward trend from 1979 to 2018, indicating that irrational utilization of grassland resources was increasing in Qinghai during this period [41,42]. Nevertheless, government efforts cannot be denied, and we believe that the situation would have been worse without them. Implementing more effective measures to reduce anthropogenic pressures on the grassland ecosystem in Qinghai is still required because the future impacts of climate change are uncertain. To ensure future sustainable ecological improvements, scientific and effective management measures must be implemented.

4.3. Spatial Pattern of HANPP in Qinghai Grasslands

Generally, in the Qinghai grasslands, the spatial pattern of HANPP was similar to that of grazing intensity, indicating that the strong regional variation in HANPP was mainly caused by the difference in grazing intensity. There were distinct differences in the natural environments (climate, terrain, and so on) and government management practices among the different regions within the Qinghai grasslands, which accounted for the difference in grazing densities (Figure 1) [20,22,31,57]. Generally, grass growth was better in eastern Qinghai because of relatively good hydrothermal conditions. Thus, more livestock were supported in these regions, leading to higher HANPP. In contrast, grass growth in central and western Qinghai was worse due to the relatively poor hydrothermal conditions. In addition, the government implemented strict ecological protection measures in the central and western regions, resulting in lower grazing intensity and HANPP [57,58]. To a large extent, the spatial patterns of HANPP efficiency were opposite to those of HANPP (Figure 4). A low HANPP efficiency was mainly observed in the southern and eastern Qinghai grasslands, whereas a high HANPP efficiency was mainly observed in the central and western Qinghai grasslands. There was relatively high vegetation growth and dense residents in the eastern and southern Qinghai grasslands, which explains the low HANPP efficiency. Excessive grazing activities in the eastern and southern regions became widespread due to the need to support human survival and economic interests, resulting in severe and widespread grassland degradation [20,22,58]. However, in the central and western Qinghai grasslands, grazing intensity was low due to the poor vegetation growth and stricter ecological protection in these regions, resulting in low ecological degradation [22]. In rare cases, the HANPP efficiency was greater than 1, indicating that overcompensation occurred due to moderate grazing [31,49].

4.4. Significance

To date, HANPP has been estimated on different scales [15,16,33,34,35]. However, there are relatively few specific or systematic reports on this topic in grassland ecosystems [15,16,33,34,35]. Baeza and Paruelo [59] studied the HANPP in 2001/2002 and 2012/2013 in the Rio de la Plata grasslands of South America, which showed that HANPP accounted for more than 40% of the annual productivity. In their study, the NPPpot was assumed to be equal to the NPPact in perennial forage resources, indicating that the effect of grazing on productivity was not considered, whereas the NPPact estimates were based on official agricultural statistics or modeled from a time series of satellite images. The harvest in perennial forage resources was calculated as a fixed proportion of the aboveground NPP using the biomass harvest index by domestic herbivores. Notably, the estimate of HANPP through the combined application of multiple methods inevitably increased the uncertainty of the results due to the methodological differences [16,17,31]. Huang et al. [31] estimated and analyzed the spatiotemporal patterns of HANPP in Central Asian grasslands using the Biome-BGC model, which showed that HANPP was 47 gC/m2/yr, accounting for 34% of grassland productivity. In their study, the NPPpot, NPPact, and harvest were estimated using the same Biome-BGC model, adopting a functionally holistic approach. In the present study, to obtain more accurate results, we selected the Biome-BGCMuSo model and designed a loop program to run this model over a large area to estimate and analyze the spatiotemporal patterns of HANPP from 1979 to 2018 in the Qinghai grasslands. The Biome-BGCMuSo model is an upgrade of the Biome-BGC model that can obtain a more accurate simulation of vegetation productivity in terrestrial ecosystems, especially under energy and water stress [39]. In this study, the NPPpot, NPPact, and harvest were estimated using the same Biome-BGCMuSo method when estimating HANPP, which is also a functionally holistic approach. Our study contributes to a deep understanding of grassland HANPP and provides more reliable and detailed data to support the scientific management of local grassland resources.

5. Conclusions

In the present study, we quantitatively assessed the spatial and temporal distribution of HANPP in the Qinghai grasslands from 1979 to 2018 using the spatially explicit Biome-BGCMuSo model. HANPP and HANPP%NPPpot showed fluctuating upward trends, and the difference between the NPPpot and NPPact (NPPpot minus NPPact) slightly increased in the Qinghai grasslands from 1979 to 2018, indicating an increase in grazing pressure on this grassland ecosystem. From 2001 to 2018, the NPPpot and NPPact both showed fluctuating upward trends, indicating that climate change has improved the ecological environment of the Qinghai grasslands in recent years. The HANPP efficiency showed a weak fluctuating downward trend from 1979 to 2018, indicating that irrational utilization of the Qinghai grasslands was increasing during this period. There was a strong regional variation in HANPP, mainly caused by the difference in grazing intensity. High HANPP mainly occurred in eastern Qinghai, with high grazing intensity, whereas low HANPP mainly occurred in central and western Qinghai, with low grazing intensity. The average harvest contributed 85.38% to HANPP in the Qinghai grasslands. The HANPP efficiency values in most grids were between 80% and 100%, being relatively low in southern and eastern Qinghai with relatively high plant productivity and density of residents, indicating that grazing was relatively irrational in this region. In rare cases, the HANPP efficiency was greater than 1, indicating that moderate grazing promoted plant growth in this region. This study furthers our knowledge of HANPP in grasslands and indicates that local management of grassland resources should be optimized to ensure sustainable ecological resource use in the future.

Author Contributions

Conceptualization, X.H.; methodology, X.H. and C.C.; software, X.H. and C.C.; validation, X.H.; formal analysis, X.H.; investigation, X.H., L.M. and H.Z. (Huakun Zhou); resources, X.H. and Y.Y.; data curation, X.H., C.C. and H.Z. (Hongfei Zhao); writing—original draft preparation, X.H.; writing—review and editing, X.H., B.Y. and Z.M.; visualization, C.C. and X.H.; supervision, X.H. and C.C.; project administration, X.H.; funding acquisition, X.H. and Y.Y. All authors have read and agreed to the published version of the manuscript.

Funding

This research was funded by the Chinese Academy of Science (CAS) “Light of West China” Program (2018), “The effect of grazing on grassland productivity in the basin of Qinghai Lake”, National Natural Science Foundation of China (U21A20185), State Key Laboratory of Desert and Oasis Ecology (G2022-02-02) and National Natural Science Foundation of China (31971507), Joint Grant from Chinese Academy of Sciences-People’s Government of Qinghai Province on Sanjiangyuan National Park (LHZX-2020-10).

Institutional Review Board Statement

Not applicable.

Informed Consent Statement

Not applicable.

Data Availability Statement

The original contributions presented in the study are included in the article; further inquiries can be directed to the corresponding author.

Conflicts of Interest

There are no conflicts of interest to declare.

References

  1. Chen, H. The ecosystem service value of maintaining and expanding terrestrial protected areas in China. Sci. Total Environ. 2021, 781, 146768. [Google Scholar] [CrossRef] [PubMed]
  2. Gomes, E.; Inacio, M.; Bogdzevi, K.; Kalinauskas, M.; Karnauskait, D.; Pereira, P. Future land-use changes and its impacts on terrestrial ecosystem services: A review. Sci. Total Environ. 2021, 781, 146716. [Google Scholar] [CrossRef] [PubMed]
  3. Yee, J.Y.; Loc, H.H.; Poh, Y.L.; Vo-Thanh, T.; Park, E. Socio-geographical evaluation of ecosystem services in an ecotourism destination: PGIS application in Tram Chim National Park, Vietnam. J. Environ. Manag. 2021, 291, 112656. [Google Scholar] [CrossRef]
  4. Wilcke, W.; Velescu, A.; Leimer, S.; Blotevogel, S.; Alvarez, P.; Valarezo, C. Total organic carbon concentrations in ecosystem solutions of a remote tropical montane forest respond to global environmental change. Glob. Chang. Biol. 2020, 26, 6989–7005. [Google Scholar] [CrossRef]
  5. Naylor, R.L.; Hardy, R.W.; Buschmann, A.H.; Bush, S.R.; Cao, L.; Klinger, D.H.; Little, D.C.; Lubchenco, J.; Shumway, S.E.; Troell, M. A 20-year retrospective review of global aquaculture. Nature 2021, 593, E12. [Google Scholar] [CrossRef] [PubMed]
  6. Emadodin, I.; Corral, D.E.F.; Reinsch, T.; Kluss, C.; Taube, F. Climate Change Effects on Temperate Grassland and Its Implication for Forage Production: A Case Study from Northern Germany. Agriculture 2021, 11, 232. [Google Scholar] [CrossRef]
  7. Abad-Segura, E.; Gonzalez-Zamar, M.-D. Sustainable economic development in higher education institutions: A global analysis within the SDGs framework. J. Clean. Prod. 2021, 294, 126133. [Google Scholar] [CrossRef]
  8. Jesus Belmonte-Urena, L.; Antonio Plaza-Ubeda, J.; Vazquez-Brust, D.; Yakovleva, N. Circular economy, degrowth and green growth as pathways for research on sustainable development goals: A global analysis and future agenda. Ecol. Econ. 2021, 185, 107050. [Google Scholar] [CrossRef]
  9. Dong, S.; Shang, Z.; Gao, J.; Boone, R.B. Enhancing sustainability of grassland ecosystems through ecological restoration and grazing management in an era of climate change on Qinghai-Tibetan Plateau. Agric. Ecosyst. Environ. 2020, 287, 106684. [Google Scholar] [CrossRef]
  10. Pan, Y.; Zhang, B.; Wu, Y.; Tian, Y. Sustainability assessment of urban ecological-economic systems based on emergy analysis: A case study in Simao, China. Ecol. Indic. 2021, 121, 107157. [Google Scholar] [CrossRef]
  11. Dong, H.; Feng, Z.; Yang, Y.; Li, P.; You, Z. Dynamic assessment of ecological sustainability and the associated driving factors in Tibet and its cities. Sci. Total Environ. 2021, 759, 143552. [Google Scholar] [CrossRef]
  12. Li, M.; Zhou, Y.; Wang, Y.; Singh, V.P.; Li, Z.; Li, Y. An ecological footprint approach for cropland use sustainability based on multi-objective optimization modelling. J. Environ. Manag. 2020, 273, 111147. [Google Scholar] [CrossRef] [PubMed]
  13. Ma, T.; Zhou, C.; Pei, T. Simulating and estimating tempo-spatial patterns in global human appropriation of net primary production (HANPP): A consumption-based approach. Ecol. Indic. 2012, 23, 660–667. [Google Scholar] [CrossRef]
  14. Haberl, H.; Erb, K.H.; Krausmann, F.; Gaube, V.; Bondeau, A.; Plutzar, C.; Gingrich, S.; Lucht, W.; Fischer-Kowalski, M. Quantifying and mapping the human appropriation of net primary production in earth’s terrestrial ecosystems. Proc. Natl. Acad. Sci. USA 2007, 104, 12942–12945. [Google Scholar] [CrossRef] [PubMed] [Green Version]
  15. Mahbub, R.B.; Ahmed, N.; Rahman, S.; Hossain, M.M.; Sujauddin, M. Human appropriation of net primary production in Bangladesh, 1700–2100. Land Use Policy 2019, 87, 104067. [Google Scholar] [CrossRef]
  16. Krausmann, F.; Erb, K.-H.; Gingrich, S.; Haberl, H.; Bondeau, A.; Gaube, V.; Lauk, C.; Plutzar, C.; Searchinger, T.D. Global human appropriation of net primary production doubled in the 20th century. Proc. Natl. Acad. Sci. USA 2013, 110, 10324–10329. [Google Scholar] [CrossRef] [Green Version]
  17. Lorel, C.; Plutzar, C.; Erb, K.-H.; Mouchet, M. Linking the human appropriation of net primary productivity-based indicators, input cost and high nature value to the dimensions of land-use intensity across French agricultural landscapes. Agric. Ecosyst. Environ. 2019, 283, 106565. [Google Scholar] [CrossRef]
  18. Chen, A.; Li, R.; Wang, H.; He, B. Quantitative assessment of human appropriation of aboveground net primary production in China. Ecol. Model. 2015, 312, 54–60. [Google Scholar] [CrossRef] [Green Version]
  19. Li, X.; Long, D.; Han, Z.; Scanlon, B.R.; Sun, Z.; Han, P.; Hou, A. Evapotranspiration Estimation for Tibetan Plateau Headwaters Using Conjoint Terrestrial and Atmospheric Water Balances and Multisource Remote Sensing. Water Resour. Res. 2019, 55, 8608–8630. [Google Scholar] [CrossRef]
  20. Liu, S.; Zhang, Y.; Cheng, F.; Hou, X.; Zhao, S. Response of Grassland Degradation to Drought at Different Time-Scales in Qinghai Province: Spatio-Temporal Characteristics, Correlation, and Implications. Remote Sens. 2017, 9, 1329. [Google Scholar] [CrossRef] [Green Version]
  21. Feng, Y.; Lu, Q.; Tokola, T.; Liu, H.; Wang, X. Assessment of grassland degradation in Guinan county, Qinghai province, China, in the past 30 years. Land Degrad. Dev. 2009, 20, 55–68. [Google Scholar] [CrossRef]
  22. Liu, M.; Jiao, J.; Pan, J.; Song, J.; Che, Y.; Li, L. Spatial and temporal patterns of planting NPP and its driving factors in Qinghai Province. Acta Ecol. Sin. 2020, 40, 5306–5317. [Google Scholar]
  23. Zhao, H.; Li, X.; Zhang, D.; Xiao, R. Aboveground biomass in grasslands in Qinghai Province estimated from MODIS data and its influencing factors. Acta Pratacult. Sin. 2020, 29, 5–16. [Google Scholar]
  24. Gao, J.L.; Huang, X.D.; Ma, X.F.; Feng, Q.S.; Liang, T.G.; Xie, H.J. Snow Disaster Early Warning in Pastoral Areas of Qinghai Province, China. Remote Sens. 2017, 9, 475. [Google Scholar] [CrossRef] [Green Version]
  25. Li, Y.; Dong, S.; Gao, Q.; Zhang, Y.; Liu, S.; Ganjurjav, H.; Hu, G.; Wang, X.; Yan, Y.; Wu, H.; et al. Rotational grazing promotes grassland aboveground plant biomass and its temporal stability under changing weather conditions on the Qinghai-Tibetan plateau. Land Degrad. Dev. 2020, 31, 2662–2671. [Google Scholar] [CrossRef]
  26. Li, C.; de Jong, R.; Schmid, B.; Wulf, H.; Schaepman, M.E. Changes in grassland cover and in its spatial heterogeneity indicate degradation on the Qinghai-Tibetan Plateau. Ecol. Indic. 2020, 119, 106641. [Google Scholar] [CrossRef]
  27. Liu, X.; Wang, Z.; Zheng, K.; Han, C.; Li, L.; Sheng, H.; Ma, Z. Changes in soil carbon and nitrogen stocks following degradation of alpine grasslands on the Qinghai-Tibetan Plateau: A meta-analysis. Land Degrad. Dev. 2021, 32, 1262–1273. [Google Scholar] [CrossRef]
  28. Gao, X.; Dong, S.; Li, S.; Xu, Y.; Liu, S.; Zhao, H.; Yeomans, J.; Li, Y.; Shen, H.; Wu, S.; et al. Using the random forest model and validated MODIS with the field spectrometer measurement promote the accuracy of estimating aboveground biomass and coverage of alpine grasslands on the Qinghai-Tibetan Plateau. Ecol. Indic. 2020, 112, 106114. [Google Scholar] [CrossRef]
  29. Running, S.W. A regional look at HANPP: Human consumption is increasing, NPP is not. Environ. Res. Lett. 2014, 9, 111003. [Google Scholar] [CrossRef]
  30. Haberl, H.; Schulz, N.B.; Plutzar, C.; Erb, K.H.; Krausmann, F.; Loibl, W.; Moser, D.; Sauberer, N.; Weisz, H.; Zechmeister, H.G.; et al. Human appropriation of net primary production and species diversity in agricultural landscapes. Agric. Ecosyst. Environ. 2004, 102, 213–218. [Google Scholar] [CrossRef]
  31. Huang, X.; Luo, G.; Han, Q. Temporospatial patterns of human appropriation of net primary production in Central Asia grasslands. Ecol. Indic. 2018, 91, 555–561. [Google Scholar] [CrossRef]
  32. Luo, G.; Han, Q.; Zhou, D.; Li, L.; Chen, X.; Li, Y.; Hu, Y.; Li, B.L. Moderate grazing can promote aboveground primary production of grassland under water stress. Ecol. Complex. 2012, 11, 126–136. [Google Scholar] [CrossRef]
  33. Imhoff, M.L.; Bounoua, L.; Ricketts, T.; Loucks, C.; Harriss, R.; Lawrence, W.T. Global patterns in human consumption of net primary production. Nature 2004, 429, 870–873. [Google Scholar] [CrossRef] [PubMed] [Green Version]
  34. Morel, A.C.; Sasu, M.A.; Adu-Bredu, S.; Quaye, M.; Moore, C.; Asare, R.A.; Mason, J.; Hirons, M.; McDermott, C.L.; Robinson, E.J.Z.; et al. Carbon dynamics, net primary productivity and human-appropriated net primary productivity across a forest-cocoa farm landscape in West Africa. Glob. Chang. Biol. 2019, 25, 2661–2677. [Google Scholar] [CrossRef] [PubMed]
  35. Haberl, H.; Erb, K.-H.; Krausmann, F. Human Appropriation of Net Primary Production: Patterns, Trends, and Planetary Boundaries. Annu. Rev. Environ. Resour. 2014, 39, 363–391. [Google Scholar] [CrossRef]
  36. Mao, F.; Zhou, G.; Li, P.; Du, H.; Xu, X.; Shi, Y.; Mo, L.; Zhou, Y.; Tu, G. Optimizing selective cutting strategies for maximum carbon stocks and yield of Moso bamboo forest using BIOME-BGC model. J. Environ. Manag. 2017, 191, 126–135. [Google Scholar] [CrossRef] [PubMed]
  37. Sanchez-Ruiz, S.; Chiesi, M.; Fibbi, L.; Carrara, A.; Maselli, F.; Amparo Gilabert, M. Optimized Application of Biome-BGC for Modeling the Daily GPP of Natural Vegetation Over Peninsular Spain. J. Geophys. Res.-Biogeosci. 2018, 123, 531–546. [Google Scholar] [CrossRef]
  38. You, Y.; Wang, S.; Ma, Y.; Wang, X.; Liu, W. Improved Modeling of Gross Primary Productivity of Alpine Grasslands on the Tibetan Plateau Using the Biome-BGC Model. Remote Sens. 2019, 11, 1287. [Google Scholar] [CrossRef] [Green Version]
  39. Hidy, D.; Barcza, Z.; Marjanovic, H.; Sever, M.Z.O.; Dobor, L.; Gelybo, G.; Fodor, N.; Pinter, K.; Churkina, G.; Running, S.; et al. Terrestrial ecosystem process model Biome-BGCMuSo v4.0: Summary of improvements and new modeling possibilities. Geosci. Model Dev. 2016, 9, 4405–4437. [Google Scholar] [CrossRef] [Green Version]
  40. Hidy, D.; Barcza, Z.; Haszpra, L.; Churkina, G.; Pinter, K.; Nagy, Z. Development of the Biome-BGC model for simulation of managed herbaceous ecosystems. Ecol. Model. 2012, 226, 99–119. [Google Scholar] [CrossRef]
  41. Fetzel, T.; Gradwohl, M.; Erb, K.-H. Conversion, intensification, and abandonment: A human appropriation of net primary production approach to analyze historic land-use dynamics in New Zealand 1860–2005. Ecol. Econ. 2014, 97, 201–208. [Google Scholar] [CrossRef]
  42. Fetzel, T.; Niedertscheider, M.; Haberl, H.; Krausmann, F.; Erb, K.-H. Patterns and changes of land use and land-use efficiency in Africa 1980–2005: An analysis based on the human appropriation of net primary production framework. Reg. Environ. Chang. 2016, 16, 1507–1520. [Google Scholar] [CrossRef]
  43. Dai, L.; Ke, X.; Du, Y.; Zhang, F.; Li, Y.; Li, Q.; Lin, L.; Peng, C.; Shu, K.; Cao, G.; et al. Nitrogen controls the net primary production of an alpine Kobresia meadow in the northern Qinghai-Tibet Plateau. Ecol. Evol. 2019, 9, 8865–8875. [Google Scholar] [CrossRef] [Green Version]
  44. Li, H.; Zhang, F.; Li, Y.; Zhao, X.; Cao, G. Thirty-year variations of above-ground net primary production and precipitation-use efficiency of an alpine meadow in the north-eastern Qinghai-Tibetan Plateau. Grass Forage Sci. 2016, 71, 208–218. [Google Scholar] [CrossRef]
  45. Jing Yun, F.; Wei, W. Soil respiration as a key belowground process: Issues and perspectives. Acta Phytoecol. Sin. 2007, 31, 345–347. [Google Scholar] [CrossRef] [Green Version]
  46. Gilbert, M.; Nicolas, G.; Cinardi, G.; Van Boeckel, T.P.; Vanwambeke, S.O.; Wint, G.R.W.; Robinson, T.P. Global distribution data for cattle, buffaloes, horses, sheep, goats, pigs, chickens and ducks in 2010. Sci. Data 2018, 5, 180227. [Google Scholar] [CrossRef] [Green Version]
  47. He, J.; Yang, K.; Tang, W.; Lu, H.; Qin, J.; Chen, Y.; Li, X. The first high-resolution meteorological forcing dataset for land process studies over China. Sci. Data 2020, 7, 1–11. [Google Scholar] [CrossRef] [Green Version]
  48. White, M.A.; Thornton, P.E.; Running, S.W.; Nemani, R.R. Parameterization and sensitivity analysis of the Biome-BGC terrestrial ecosystem model: Net primary production controls. Earth Interact. 2000, 4, 1–85. [Google Scholar] [CrossRef]
  49. Han, Q.; Luo, G.; Li, C.; Shakir, A.; Wu, M.; Saidov, A. Simulated grazing effects on carbon emission in Central Asia. Agric. For. Meteorol. 2016, 216, 203–214. [Google Scholar] [CrossRef]
  50. Cheng, Y.; Tjaden, N.B.; Jaeschke, A.; Thomas, S.M.; Beierkuhnlein, C. Using centroids of spatial units in ecological niche modelling: Effects on model performance in the context of environmental data grain size. Glob. Ecol. Biogeogr. 2021, 30, 611–621. [Google Scholar] [CrossRef]
  51. Tian, H.; Xu, R.; Canadell, J.G.; Thompson, R.L.; Winiwarter, W.; Suntharalingam, P.; Davidson, E.A.; Ciais, P.; Jackson, R.B.; Janssens-Maenhout, G.; et al. A comprehensive quantification of global nitrous oxide sources and sinks. Nature 2020, 586, 248–256. [Google Scholar] [CrossRef] [PubMed]
  52. Tian, H.; Lu, C.; Ciais, P.; Michalak, A.M.; Canadell, J.G.; Saikawa, E.; Huntzinger, D.N.; Gurney, K.R.; Sitch, S.; Zhang, B.; et al. The terrestrial biosphere as a net source of greenhouse gases to the atmosphere. Nature 2016, 531, 225–228. [Google Scholar] [CrossRef] [PubMed] [Green Version]
  53. Wei, X.; Yan, C.; Wei, W. Grassland Dynamics and the Driving Factors Based on Net Primary Productivity in Qinghai Province, China. ISPRS Int. J. Geo-Inf. 2019, 8, 73. [Google Scholar] [CrossRef] [Green Version]
  54. Xu, H.-J.; Wang, X.-P.; Zhang, X.-X. Alpine grasslands response to climatic factors and anthropogenic activities on the Tibetan Plateau from 2000 to 2012. Ecol. Eng. 2016, 92, 251–259. [Google Scholar] [CrossRef]
  55. Xiao, T.; Wang, C.; Feng, M.; Qu, R.; Zhai, J. Dynamic Characteristic of Vegetation Coverage in the Three-River Source Region from 2000 to 2011. Acta Agrestia Sin. 2014, 22, 39–45. [Google Scholar]
  56. Sun, Q.; Li, B.; Xu, L.; Zhang, T.; Ge, J.; Li, F. Analysis of NDVI Change Trend and Its Impact Factors in the Three-River Headwater Region from 2000 to 2013. J. Geo-Inf. Sci. 2016, 18, 1707–1716. [Google Scholar]
  57. Zhang, L.; Fan, J.; Zhou, D.; Zhang, H. Ecological Protection and Restoration Program Reduced Grazing Pressure in the Three-River Headwaters Region, China. Rangel. Ecol. Manag. 2017, 70, 540–548. [Google Scholar] [CrossRef]
  58. Wang, S.; Fan, J.; Li, Y.; Wu, D.; Zhang, Y.; Huang, L. Dynamic response of water retention to grazing activity on grassland over the Three River Headwaters region. Agric. Ecosyst. Environ. 2019, 286, 106662. [Google Scholar] [CrossRef]
  59. Baeza, S.; Paruelo, J.M. Spatial and temporal variation of human appropriation of net primary production in the Rio de la Plata grasslands. ISPRS J. Photogramm. Remote Sens. 2018, 145, 238–249. [Google Scholar] [CrossRef]
Figure 1. Distribution of elevation (A), average annual grazing intensity (B), average annual temperature (C), and average annual precipitation (D) in Qinghai grasslands in the period of 1979 to 2018.
Agriculture 12 00483 g001
Figure 2. Comparisons of the annual NPP between the simulated and observed data under grazed (A) and non-grazed (B) conditions in Qinghai grasslands (NPP—net primary productivity).
Agriculture 12 00483 g002
Figure 3. Interannual variations in the (A) components of NPP and (B) HANPP efficiency and HANPP%NPPpot (percentage that HANPP accounted for NPPpot) in Qinghai grasslands in the period of 1979 to 2018 (NPP—net primary productivity; NPPpot—potential net primary productivity; NPPact—actual net primary productivity; HANPP—human appropriation of net primary productivity).
Agriculture 12 00483 g003
Figure 4. Spatial distribution of the (A) average annual potential net primary productivity (NPPpot), (B) average annual actual net primary productivity (NPPact), (C) average annual human appropriation of net primary productivity (HANPP), (D) average annual HANPP efficiency and (E) average annual harvest in Qinghai grasslands in the period of 1979 to 2018.
Agriculture 12 00483 g004
Table 1. NPPpot, NPPact, HANPP, HANPP efficiency, and harvest (consumed by livestock) at different altitudes in Qinghai grasslands in the period of 1979 to 2018.
<3000 m3000–4000 m>4000 mWhole Area
NPPpot (gC/m2/yr)157.86244.4133.4884.93
NPPact (gC/m2/yr)152.50237.3232.5582.45
HANPP (gC/m2/yr)56.6138.566.9716.90
HANPP efficiency (%)90.0982.5990.0485.33
Harvest (gC/m2/yr)51.2531.495.9914.43
NPPpot—potential net primary productivity; NPPact—actual net primary productivity; HANPP—human appropriation of net primary productivity.
Publisher’s Note: MDPI stays neutral with regard to jurisdictional claims in published maps and institutional affiliations.

