
Individual and Interactive Effects of Multiple Abiotic Stress Treatments on Early-Season Growth and Development of Two Brassica Species

 , ,
, ,  , ,
, ,
Abstract
:1. Introduction
2. Materials and Methods
2.1. Seed Material and Experiment Conditions
2.2. Treatments
2.3. Measurements
2.3.1. Phenology and Growth
2.3.2. Root Image Acquisition and Analysis
2.4. Data Analysis
2.4.1. Combined Stress Response Index (CSRI)
2.4.2. Statistical Analysis
3. Results
3.1. Shoot Growth and Developmental Attributes
3.1.1. Plant Height
3.1.2. Leaf Number
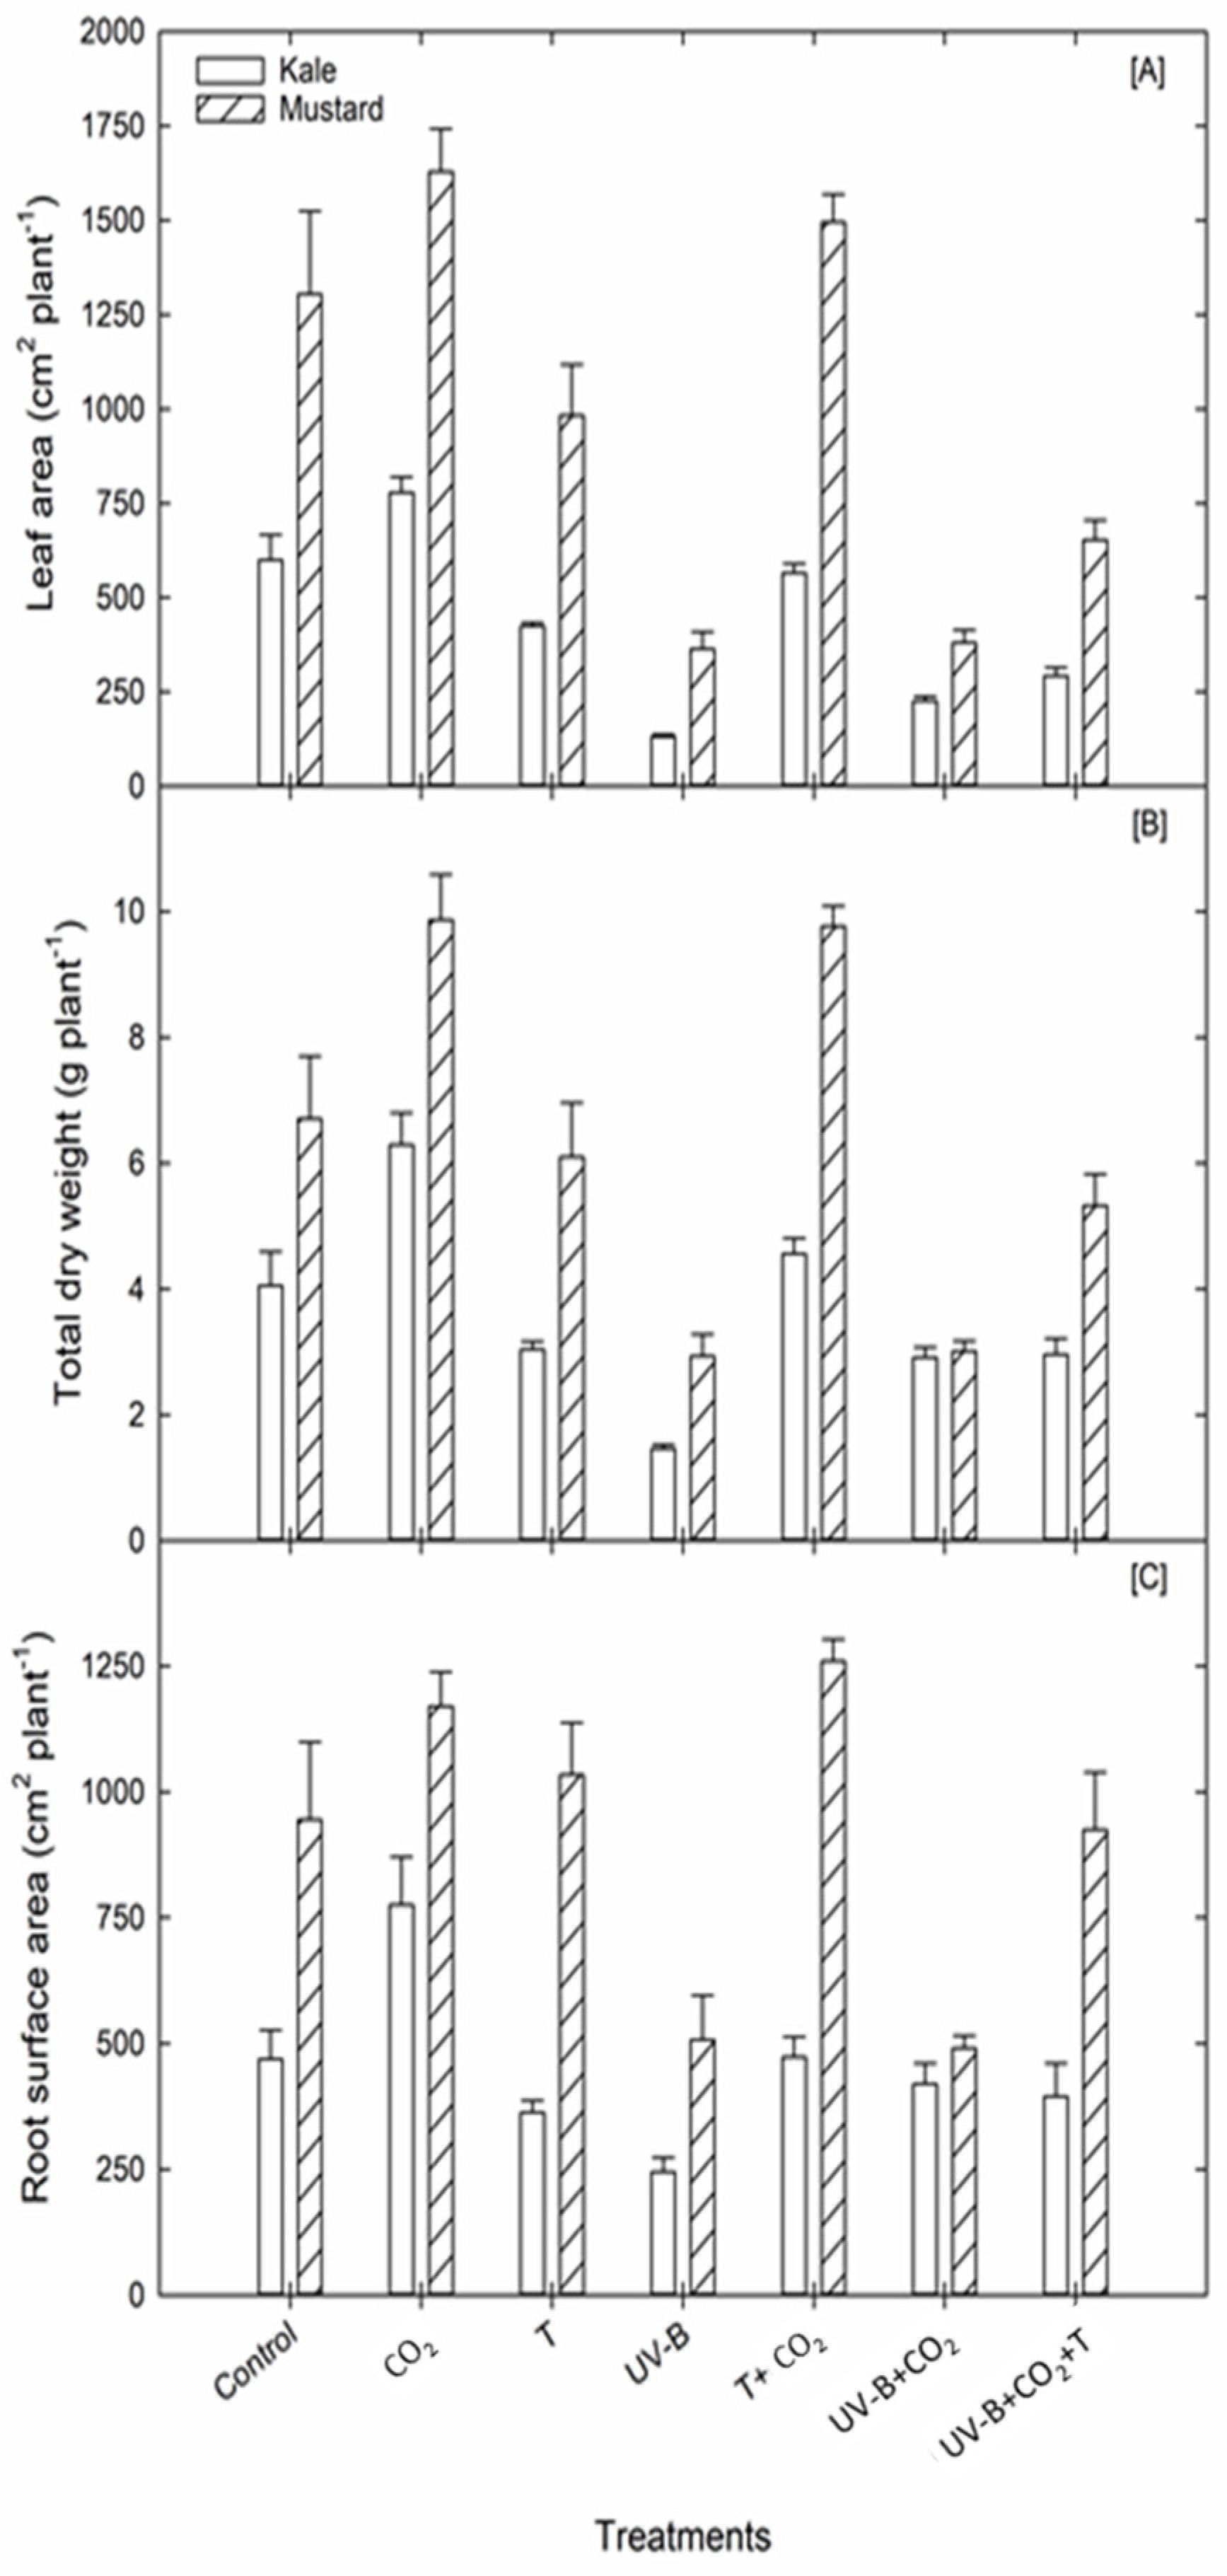
3.1.3. Leaf Area
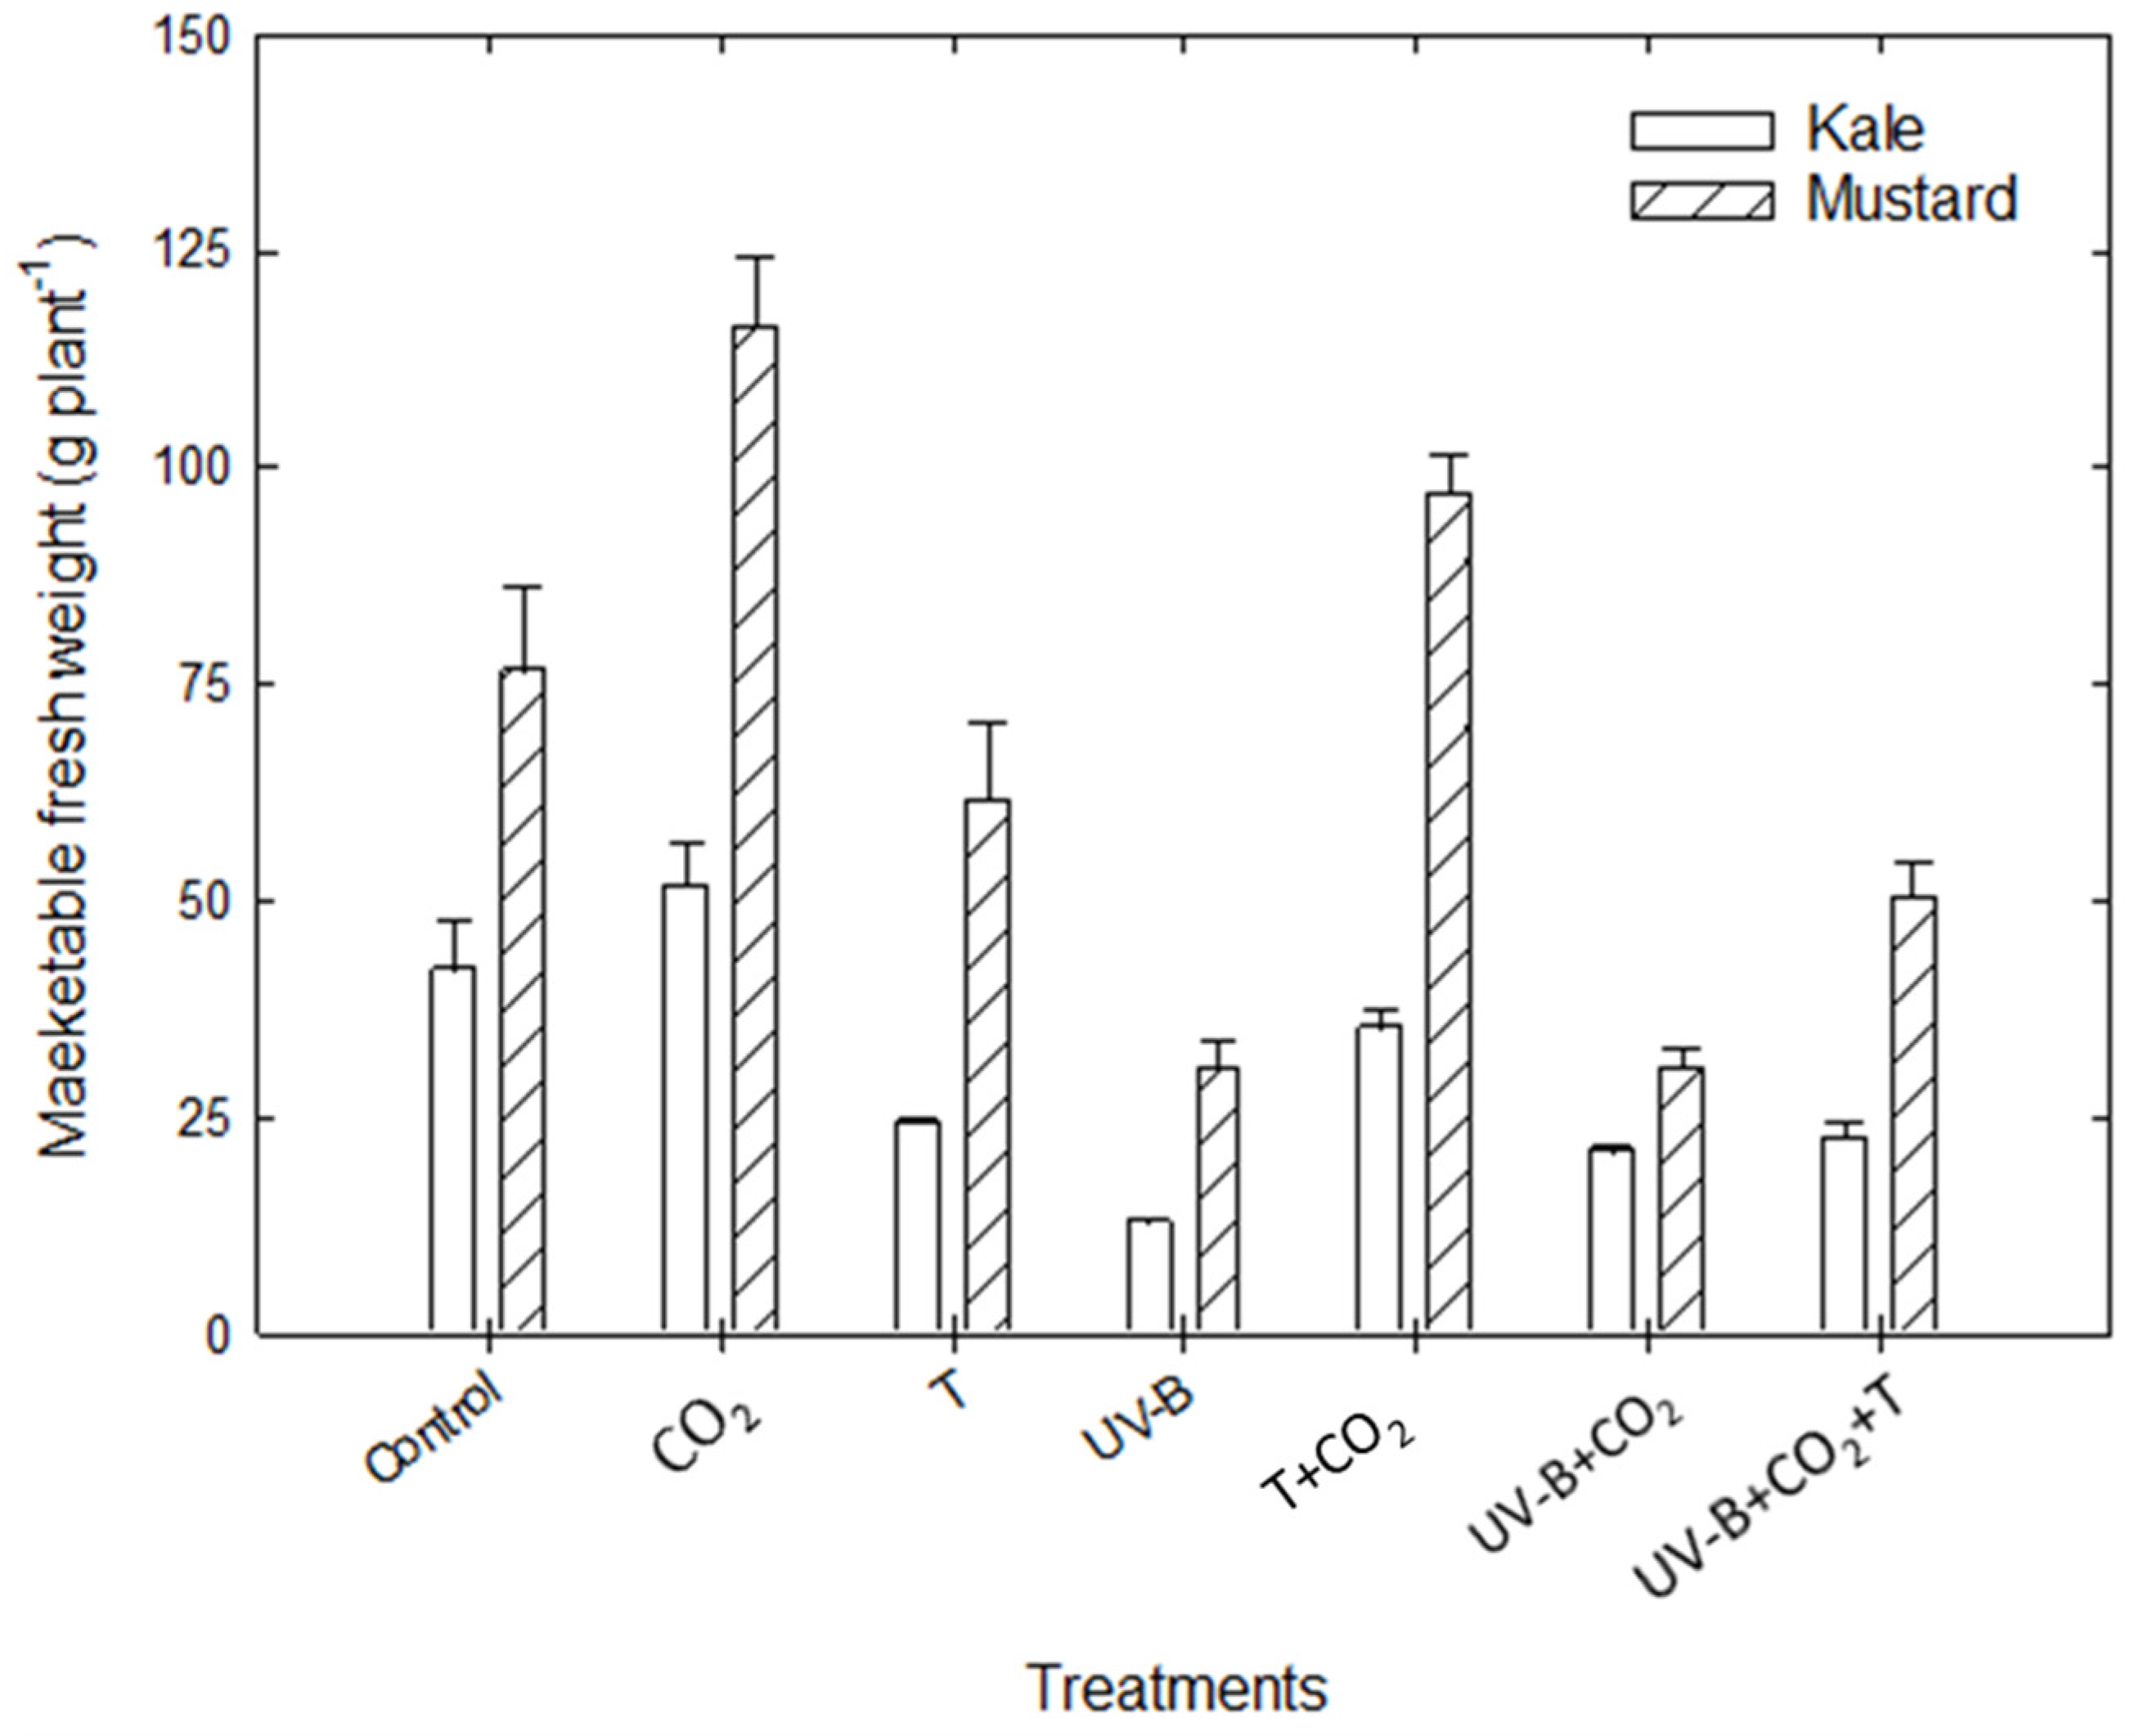
3.1.4. Marketable Fresh Weight
3.1.5. Dry Weight Components
3.2. Root Growth and Developmental Attributes
3.2.1. Root Growth Traits
3.2.2. Root Developmental Traits
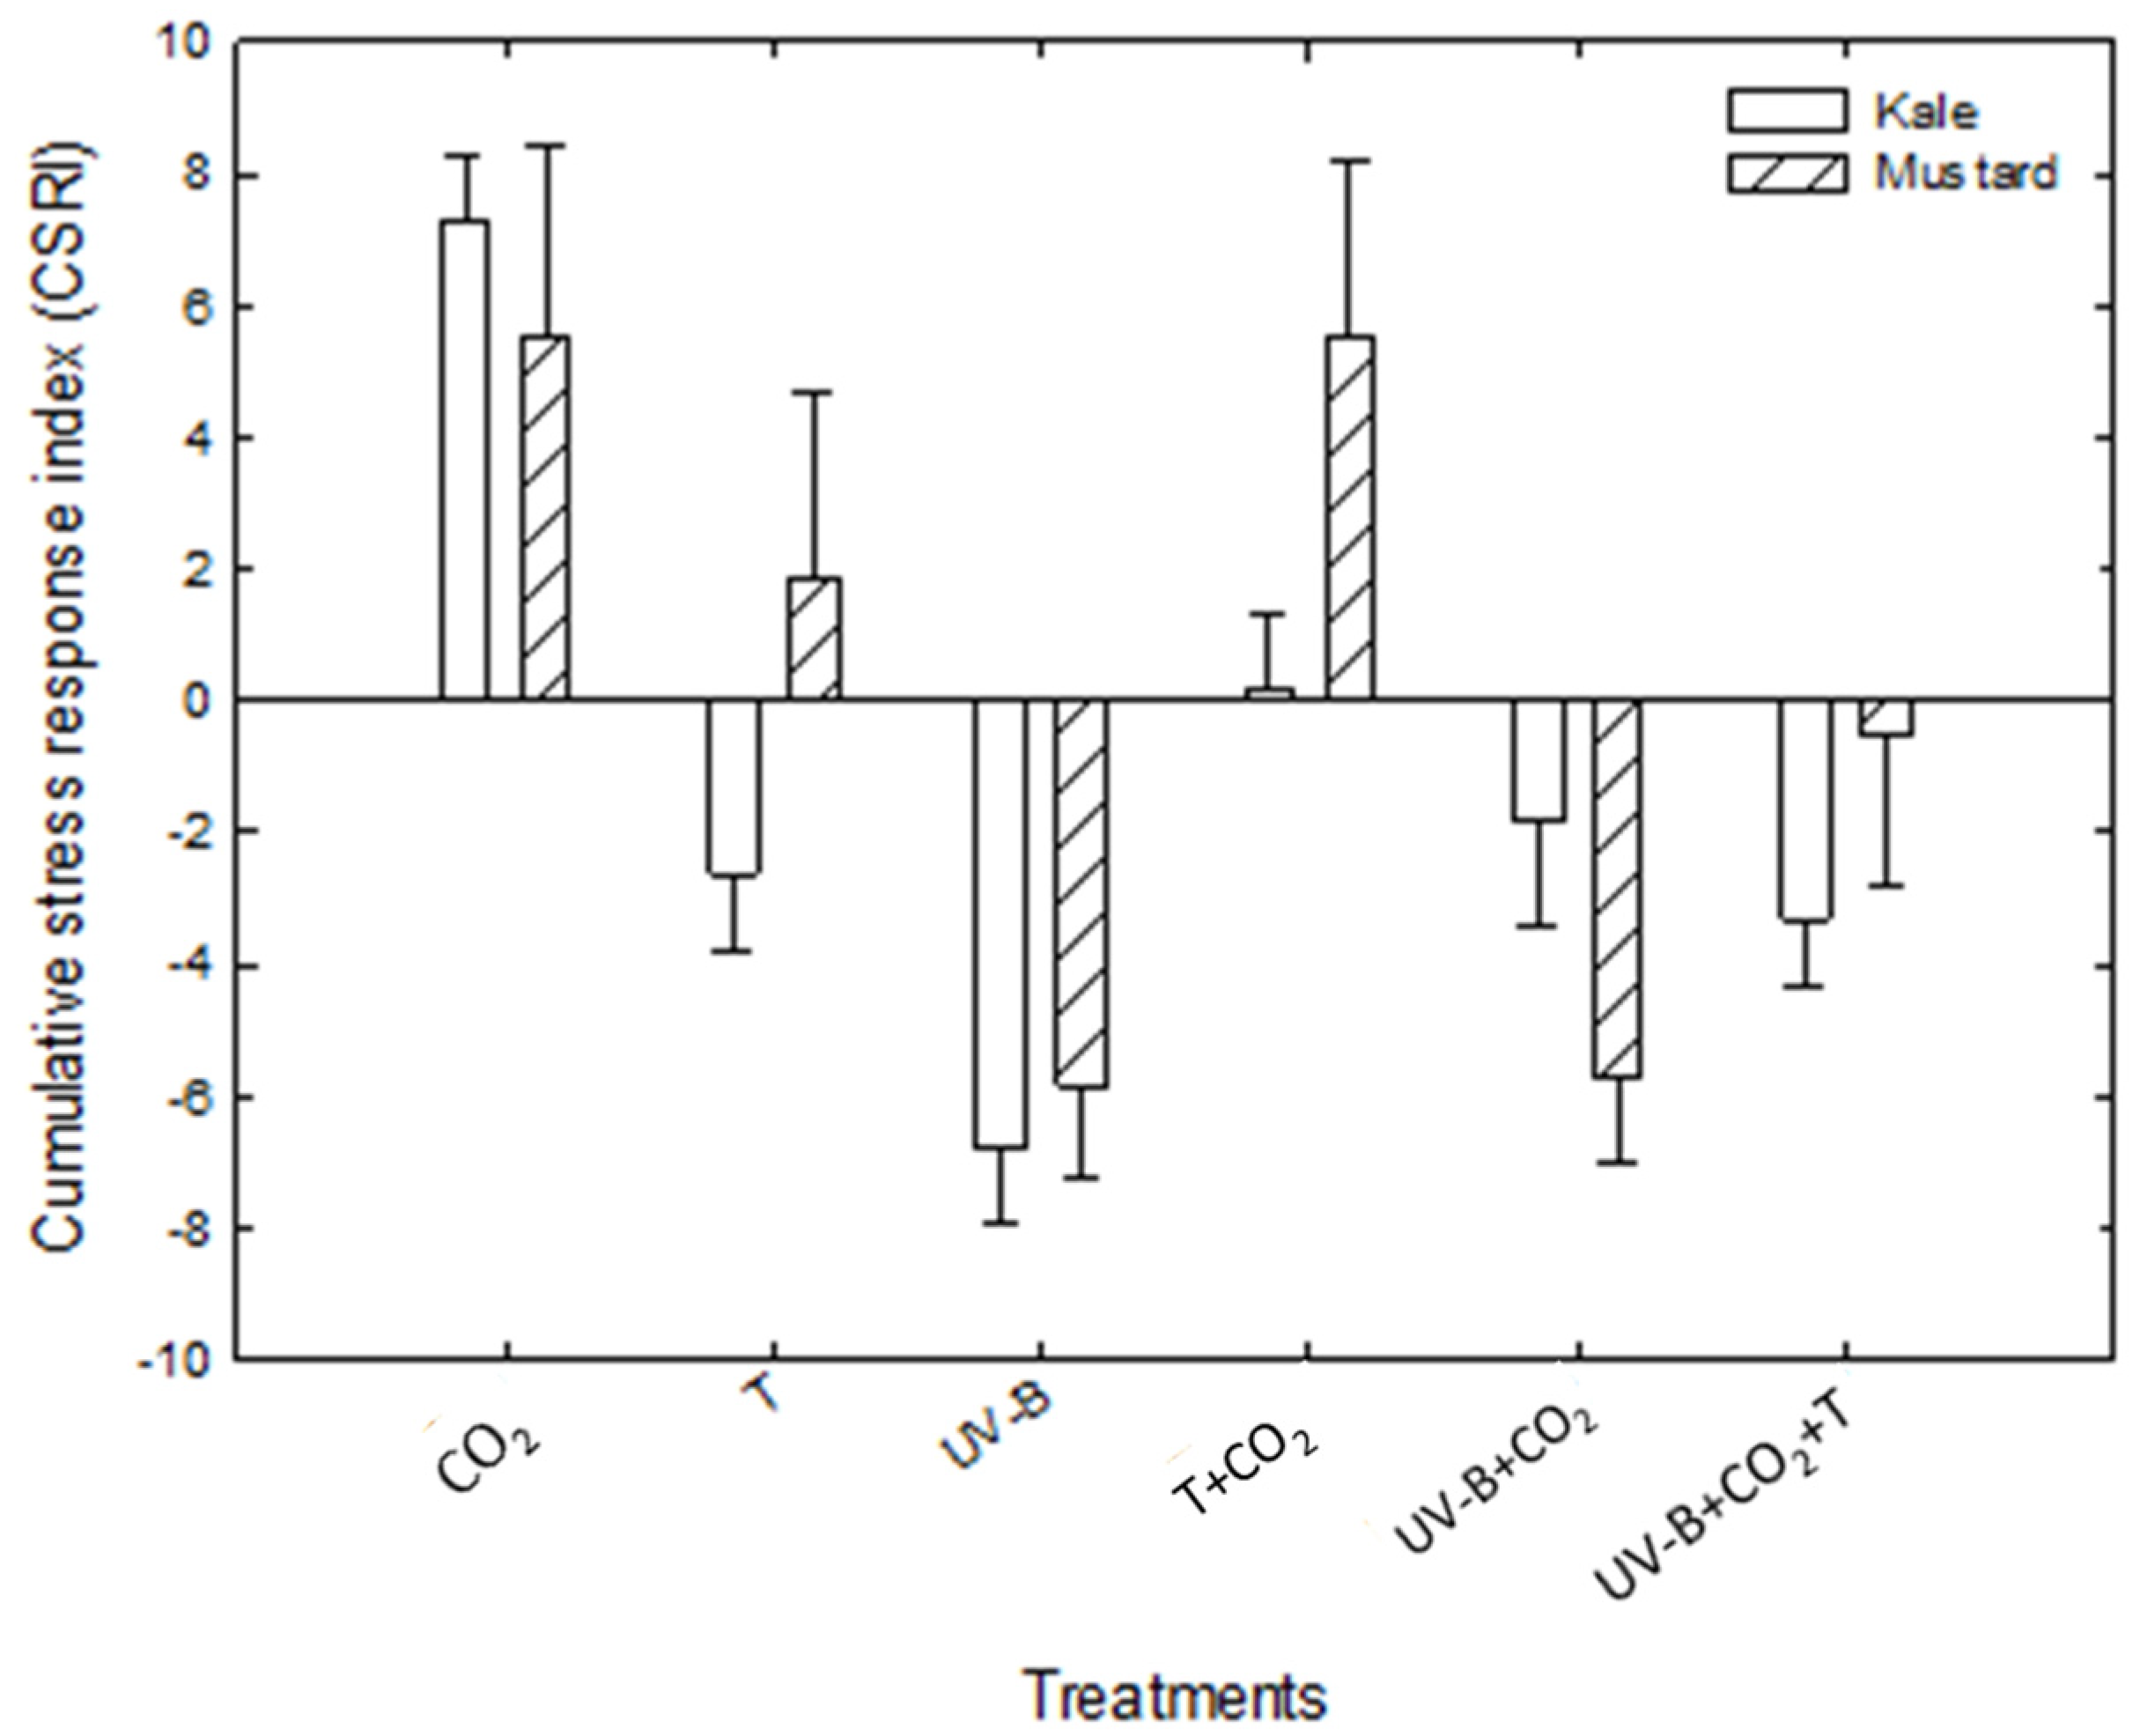
3.3. Combined Stress Response Indices (CSRI)
4. Discussion
5. Conclusions
Author Contributions
Funding
Institutional Review Board Statement
Informed Consent Statement
Data Availability Statement
Acknowledgments
Conflicts of Interest
References
- Lobell, D.B.; Field, C.B. Global scale climate–crop yield relationships and the impacts of recent warming. Environ. Res. Lett. 2007, 2, 014002. [Google Scholar] [CrossRef]
- Battisti, D.S.; Naylor, R.L. Historical warnings of future food insecurity with unprecedented seasonal heat. Science 2009, 323, 240–244. [Google Scholar] [CrossRef] [PubMed] [Green Version]
- Lobell, D.B.; Schlenker, W.; Costa-Roberts, J. Climate trends and global crop production since 1980. Science 2011, 333, 616–620. [Google Scholar] [CrossRef] [PubMed] [Green Version]
- Deryng, D.; Conway, D.; Ramankutty, N.; Price, J.; Warren, R. Global crop yield response to extreme heat stress under multiple climate change futures. Environ. Res. Lett. 2014, 9, 034011. [Google Scholar] [CrossRef] [Green Version]
- Lesk, C.; Rowhani, P.; Ramankutty, N. Influence of extreme weather disasters on global crop production. Nature 2016, 529, 84–87. [Google Scholar] [CrossRef]
- Intergovernmental Panel on Climate Change, IPCC. Global warming of 1.5 °C. An IPCC special report on the impacts of global warming of 1.5 °C above pre-industrial levels and related global greenhouse gas emission pathways. In The Context of Strengthening the Global Response to the Threat of Climate Change, Sustainable Development, and Efforts to Eradicate Poverty; IPCC: Geneva, Switzerland, 2018. [Google Scholar]
- Sewelam, N.; Brilhaus, D.; Bräutigam, A.; Alseekh, S.; Fernie, A.R.; Maurino, V.G. Molecular plant responses to combined abiotic stresses put a spotlight on unknown and abundant genes. J. Exp. Bot. 2020, 71, 5098–5112. [Google Scholar] [CrossRef]
- Ahuja, I.; de Vos, R.C.; Bones, A.M.; Hall, R.D. Plant molecular stress responses face climate change. Trend Plant Sci. 2010, 15, 664–674. [Google Scholar] [CrossRef]
- Ahammed, G.J.; Li, X.; Liu, A.; Chen, S. Physiological and defense responses of tea plants to elevated CO2: A review. Front. Plant Sci. 2020, 11, 305. [Google Scholar] [CrossRef]
- Satheesh, N.; Fanta, S. Kale: Review on nutritional composition, bioactive compounds, anti-nutritional factors, health beneficial properties and value-added products. Cogent Food Agric. 2020, 6, 1811048. [Google Scholar] [CrossRef]
- Cartea, M.E.; Francisco, M.; Soengas, P.; Velasco, P. Phenolic compounds in Brassica vegetables. Molecules 2011, 16, 251–280. [Google Scholar] [CrossRef]
- Lin, L.Z.; Harnly, J.M. Identification of the phenolic components of collard greens, kale, and Chinese broccoli. J. Agric. Food Chem. 2009, 57, 7401–7408. [Google Scholar] [CrossRef] [PubMed]
- Fahey, J.W. Brassica Encyclopedia of Food Sciences and Nutrition; Caballero, B., Ed.; Academic Press: London, UK, 2003; pp. 606–615. [Google Scholar]
- Cleary, B.V.M. Dietary fibre analysis. Proc. Nutr. Soc. 2003, 62, 3–9. [Google Scholar] [CrossRef]
- Kim, Y.T.; Kim, B.K.; Park, K.Y. Antimutagenic and anti-cancer effects of leaf mustard and leaf mustard kimchi. Prev. Nutr. Food Sci. 2007, 12, 84–88. [Google Scholar] [CrossRef]
- Dinkova-Kostova, A.T.; Kostov, R.V. Glucosinolates and isothiocyanates in health and disease. Trends Mol. Med. 2012, 18, 337–347. [Google Scholar] [CrossRef] [PubMed]
- Tian, Y.; Deng, F. Phytochemistry and biological activity of Mustard (Brassica juncea): A review. CyTA-J. Food. 2020, 18, 704–718. [Google Scholar] [CrossRef]
- Brandenberger, L.; Shrefler, J.; Rebek, E.; Damicone, J. Cool Season Greens Production (Spinach, Collard, Kale, Mustard, Turnip, Leaf Lettuce); Decision of Agricultural Science and Natural Resources; Oklahoma State University: Stillwater, OK, USA, 2016; pp. 1–5. [Google Scholar]
- Banadyga, A.A. Greens or “Potherbs”-Chard, Collards, Kale, Mustard, Spinach, New Zealand Spinach. Agric. Inf. Bull.-US Dept. Agric. 1977, 409, 163–170. Available online: https://naldc.nal.usda.gov/catalog/IND44315407 (accessed on 18 March 2022).
- Allen, L.H., Jr.; Boote, K.J. Crop ecosystem responses to climatic change: Soybean. In Climate Change and Global Crop Productivity; Reddy, K.R., Hodges, H.F., Eds.; CABI Publishing: Wallingford, UK, 2000; pp. 133–160. [Google Scholar] [CrossRef]
- Reddy, K.R.; Hodges, H.F. Crop ecosystem responses to climatic change: Cotton. In Climate Change and Global Crop Productivity; CABI Publishing: Wallingford, UK, 2000; pp. 161–187. [Google Scholar]
- Ainsworth, E.A.; Davey, P.A.; Bernacchi, C.J.; Dermody, O.C.; Heaton, E.A.; Moore, D.J.; Long, S.P. A meta-analysis of elevated [CO2] effects on soybean (Glycine max) physiology, growth and yield. Glob. Change Biol. 2002, 8, 695–709. [Google Scholar] [CrossRef]
- Kakani, V.G.; Reddy, K.R.; Zhao, D.; Mohammed, A.R. Effects of ultraviolet-B radiation on cotton (Gossypium hirsutum L.) morphology and anatomy. Ann. Bot. 2003, 91, 817–826. [Google Scholar] [CrossRef]
- Kakani, V.G.; Reddy, K.R.; Zhao, D.; Sailaja, K. Field crop responses to ultraviolet-B radiation: A review. Agric. For. Meteorol. 2003, 120, 191–218. [Google Scholar] [CrossRef]
- Li, Y.; He, L.; Zu, Y. Intraspecific variation in sensitivity to ultraviolet-B radiation in endogenous hormones and photosynthetic characteristics of 10 wheat cultivars grown under field conditions. S. Afr. J. Bot. 2010, 76, 493–498. [Google Scholar] [CrossRef] [Green Version]
- Reddy, K.R.; Singh, S.K.; Koti, S.; Kakani, V.G.; Zhao, D.; Gao, W.; Reddy, V.R. Quantifying corn growth and physiological responses to ultraviolet-B radiation for modeling. Agron. J. 2013, 105, 1367–1377. [Google Scholar] [CrossRef]
- Singh, S.K.; Reddy, K.R.; Reddy, V.R.; Gao, W. Maize growth and developmental responses to temperature and ultraviolet-B radiation interaction. Photosynthetica 2014, 52, 262–271. [Google Scholar] [CrossRef]
- Kataria, S.; Jajoo, A.; Guruprasad, K.N. Impact of increasing ultraviolet-B (UV-B) radiation on photosynthetic processes. J. Photochem. Photobiol. B 2014, 137, 55–66. [Google Scholar] [CrossRef] [PubMed]
- Franco, J.A.; Bañón, S.; Vicente, M.J.; Miralles, J.; Martínez-Sánchez, J.J. Root development in horticultural plants grown under abiotic stress conditions—A review. J. Hortic. Sci. Biotechnol. 2011, 86, 543–556. [Google Scholar] [CrossRef]
- Regent Instruments. WinRHIZO Pro Software; Version 2009c; Regent Instruments, Inc.: Québec, QC, Canada, 2009. [Google Scholar]
- Reddy, K.R.; Kakani, V.G.; Zhao, D.; Koti, S.; Gao, W. Interactive effects of ultraviolet-B radiation and temperature on cotton physiology, growth, development and hyperspectral reflectance. Photochem. Photobiol. 2004, 79, 416–427. [Google Scholar] [CrossRef]
- Koti, S.; Reddy, K.R.; Reddy, V.R.; Kakani, V.G.; Zhao, D. Interactive effects of carbon dioxide, temperature, and ultraviolet-B radiation on soybean (Glycine max L.) flower and pollen morphology, pollen production, germination, and tube lengths. J. Exp. Bot. 2005, 56, 725–736. [Google Scholar] [CrossRef] [Green Version]
- Koti, S.; Reddy, K.R.; Kakani, V.G.; Zhao, D.; Gao, W. Effects of carbon dioxide, temperature and ultraviolet-B radiation and their interactions on soybean (Glycine max L.) growth and development. Environ. Exp. Bot. 2007, 60, 1–10. [Google Scholar] [CrossRef]
- Reddy, K.R.; Kakani, V.G.; Hodges, H.F. Exploring the use of the environmental productivity index concept for crop production and modeling. In Response of Crops to Limited Water: Understanding and Modeling Water Stress Effects on Plant Growth Processes; Ahuja, L.R., Reddy, V.R., Saseendran, S.A., Yu, Q., Eds.; ASA-CSSA-SSSA: Madison, WI, USA, 2008; Volume 1, pp. 387–410. [Google Scholar] [CrossRef] [Green Version]
- Reddy, K.R.; Hodges, H.F.; Read, J.J.; McKinion, J.M.; Baker, J.T.; Tarpley, L.; Reddy, V.T. Soil-Plant-Atmosphere-Research (SPAR) facility: A tool for plant research and modeling. Biotronics 2001, 30, 27–50. Available online: https://www.spar.msstate.edu/class/EPP-2008/Chapter%201/Reading%20material/Facilities/SPAR_Biotronics.pdf (accessed on 18 March 2022).
- Murray, F.W. On the computation of saturation vapor pressure. J. Appl. Meteorol. 1967, 6, 203–204. [Google Scholar] [CrossRef]
- Hewitt, E.J. Sand and water culture methods used in the study of plant nutrition. In Technical Communications; CABI Publishing: Wallingford, UK, 1952; p. 241. [Google Scholar]
- McKinion, J.M.; Hodges, H.F. Automated system for measurement of evapotranspiration from closed environmental growth chambers. Trans. ASAE 1985, 28, 1825–1828. [Google Scholar] [CrossRef]
- Timlin, D.; Fleisher, D.; Kim, S.H.; Reddy, V.; Baker, J. Evapotranspiration measurement in controlled environment chambers. Agron. J. 2007, 99, 166–173. [Google Scholar] [CrossRef]
- SAS Institute. SAS Guide to Macro Processing; SAS Inst.: Cary, NC, USA, 2011; Volume 11. [Google Scholar]
- Qaderi, M.M.; Reid, D.M. Growth and physiological responses of canola (Brassica napus) to UV-B and CO2 under controlled environment conditions. Physiol. Plant. 2005, 125, 247–259. [Google Scholar] [CrossRef]
- Rodríguez-Calzada, T.; Qian, M.; Strid, Å.; Neugart, S.; Schreiner, M.; Torres-Pacheco, I.; Guevara-González, R.G. Effect of UV-B radiation on morphology, phenolic compound production, gene expression, and subsequent drought stress responses in chili pepper (Capsicum annuum L.). Plant Physiol. Biochem. 2019, 134, 94–102. [Google Scholar] [CrossRef]
- Lercari, B.; Sodi, F.; Di Paola, M.L. Photomorphogenic responses to UV radiation: Involvement of phytochrome and UV photoreceptors in the control of hypocotyl elongation in Lycopersicon esculentum. Physiol. Plant 1990, 79, 668–672. [Google Scholar] [CrossRef]
- Corlett, J.E. Assessing the impact of UV-B radiation on the growth and yield of field crops. In Plants and UV-B: Responses to Environmental Change; Woodfin, R., Mepsted, R., Paul, N.D., Eds.; Cambridge University Press: Cambridge, UK, 1997; pp. 195–211. [Google Scholar]
- Conner, J.K.; Zangori, L.A. A garden study of the effects of ultraviolet-B radiation on pollination success and lifetime female fitness in Brassica. Oecologia 1997, 111, 388–395. [Google Scholar] [CrossRef] [PubMed]
- Mazza, C.A.; Boccalandro, H.E.; Giordano, C.V.; Battista, D.; Scopel, A.L.; Ballaré, C.L. Functional significance and induction by solar radiation of ultraviolet-absorbing sunscreens in field-grown soybean crops. Plant Physiol. 2000, 122, 117–126. [Google Scholar] [CrossRef] [PubMed] [Green Version]
- Amudha, P.; Jayakumar, M.; Kulandaivelu, G. Impacts of ambient solar UV (280–400 nm) radiation on three tropical legumes. J. Plant Biol. 2005, 48, 284–291. [Google Scholar] [CrossRef]
- Guruprasad, K.; Bhattacharjee, S.; Kataria, S.; Yadav, S.; Tiwari, A.; Baroniya, S.; Mohanty, P. Growth enhancement of soybean (Glycine max) upon exclusion of UV-B and UV-B/A components of solar radiation: Characterization of photosynthetic parameters in leaves. Photosynth. Res. 2008, 96, 115–115. [Google Scholar] [CrossRef] [Green Version]
- Kataria, S.; Guruprasad, K.N. Exclusion of solar UV components improves growth and performance of Amaranthus tricolor varieties. Sci. Hortic. 2014, 174, 36–45. [Google Scholar] [CrossRef]
- Teramura, A.H.; Ziska, L.H.; Sztein, A.E. Changes in growth and photosynthetic capacity of rice with increased UV-B radiation. Physiol. Plant. 1991, 83, 373–380. [Google Scholar] [CrossRef]
- Sharma, S.; Chatterjee, S.; Kataria, S.; Joshi, J.; Datta, S.; Vairale, M.G.; Veer, V. A review on responses of plants to UV-B radiation related stress. In UV-B Radiation: From Environmental Stressor to Regulator of Plant Growth; Singh, V.P., Singh, S., Prasad, S.M., Parihar, P., Eds.; John Wiley & Sons: West Sussex, UK, 2017; pp. 75–97. [Google Scholar]
- Giordano, C.V.; Galatro, A.; Puntarulo, S.; Ballaré, C.L. The inhibitory effects of UV-B radiation (280–315 nm) on Gunneramagellanica growth correlate with increased DNA damage but not with oxidative damage to lipids. Plant Cell Environ. 2004, 27, 1415–1423. [Google Scholar] [CrossRef]
- Wahid, A.; Gelani, S.; Ashraf, M.; Foolad, M.R. Heat tolerance in plants: An overview. Environ. Exp. Bot. 2007, 61, 199–223. [Google Scholar] [CrossRef]
- Prasad, P.V.V.; Staggenborg, S.A.; Ristic, Z. Impacts of drought and/or heat stress on physiological, developmental, growth, and yield processes of crop plants. In Response of Crops to Limited Water: Understanding and Modeling Water Stress Effects on Plant Growth Processes; Ahuja, L.R., Reddy, V.R., Saseendran, S.A., Yu, Q., Eds.; ASA-CSSA-SSSA: Madison, WI, USA, 2008; pp. 301–355. [Google Scholar] [CrossRef] [Green Version]
- Chauhan, J.S.; Meena, M.L.; Saini, M.K.; Meena, D.R.; Singh, M.; Meena, S.S.; Singh, K.H. Heat stress effects on morpho-physiological characters of Indian Mustard (Brassica juncea L.). In Proceedings of the 16th Australian Research Assembly on Brassicas, Ballarat, Australia, 14–16 September 2009; pp. 91–97. [Google Scholar]
- Schaarschmidt, S.; Lawas, L.M.F.; Glaubitz, U.; Li, X.; Erban, A.; Kopka, J.; Zuther, E. Season affects yield and metabolic profiles of rice (Oryza sativa) under high night temperature stress in the field. Int. J. Mol. Sci. 2020, 21, 3187. [Google Scholar] [CrossRef] [PubMed]
- Poulson, M.E.; Boeger, M.R.T.; Donahue, R.A. Response of photosynthesis to high light and drought for Arabidopsis thaliana grown under a UV-B enhanced light regime. Photosynth. Res. 2006, 90, 79–90. [Google Scholar] [CrossRef]
- Wijewardana, C.; Henry, W.B.; Gao, W.; Reddy, K.R. Interactive effects on CO2, drought, and ultraviolet-B radiation on maize growth and development. J. Photochem. Photobiol. 2016, 160, 198–209. [Google Scholar] [CrossRef]
- Wanzeler, R.B.; Zanetti, L.V.; Fantinato, D.E.; Gama, V.N.; Arrivabene, H.P.; de Almeida Leite, I.T.; Milanez, C.R.D. How does UV-B radiation affect the initial growth of common bean (Phaseolus vulgaris L.)? Physiological and structural aspects. Braz. J. Dev. 2019, 5, 26947–26958. [Google Scholar] [CrossRef] [Green Version]
- Chen, Z.; Gao, W.; Reddy, K.R.; Chen, M.; Taduri, S.; Meyers, S.L.; Shankle, M.W. Ultraviolet (UV) B effects on growth and yield of three contrasting sweet potato cultivars. Photosynthetica 2020, 58, 37–44. [Google Scholar] [CrossRef] [Green Version]
- Wargent, J.J.; Moore, J.P.; Roland Ennos, A.; Paul, N.D. Ultraviolet radiation as a limiting factor in leaf expansion and development. Photochem. Photobiol. 2009, 85, 279–286. [Google Scholar] [CrossRef]
- Nogués, S.; Allen, D.J.; Morison, J.I.; Baker, N.R. Characterization of stomatal closure caused by ultraviolet-B radiation. Plant Physiol. 1999, 121, 489–496. [Google Scholar] [CrossRef] [Green Version]
- Raghuvanshi, R.; Sharma, R.K. Response of two cultivars of Phaseolus vulgaris L. (French beans) plants exposed to enhanced UV-B radiation under mountain ecosystem. Environ. Sci. Pollut. Res. 2016, 23, 831–842. [Google Scholar] [CrossRef]
- Morales, L.O.; Brosché, M.; Vainonen, J.; Jenkins, G.I.; Wargent, J.J.; Sipari, N.; Aphalo, P.J. Multiple roles for UV RESISTANCE LOCUS8 in regulating gene expression and metabolite accumulation in Arabidopsis under solar ultraviolet radiation. Plant Physiol. 2013, 161, 744–759. [Google Scholar] [CrossRef] [PubMed] [Green Version]
- Nedunchezhian, N.; Kulandaivelu, G. Changes induced by ultraviolet-B (280–320 nm) to vegetative growth and photosynthetic characteristics in filed grown Vigna unguiculate L. Plant Sci. 1997, 123, 85–92. [Google Scholar] [CrossRef]
- Sakalauskaite, J.; Viškelis, P.; Duchovskis, P.; Dambrauskiene, E.; Sakalauskiene, S.; Samuoliene, G.; Brazaityte, A. Supplementary UV-B irradiation effects on basil (Ocimum basilicum L.) growth and phytochemical properties. J. Food Agric. Environ. 2012, 10, 342–346. [Google Scholar]
- Wang, W.; Cai, C.; He, J.; Gu, J.; Zhu, G.; Zhang, W.; Liu, G. Yield, dry matter distribution and photosynthetic characteristics of rice under elevated CO2 and increased temperature conditions. Field Crops Res. 2020, 248, 107605. [Google Scholar] [CrossRef]
- Son, K.H.; Ide, M.; Goto, E. Growth characteristics and phytochemicals of canola (Brassica napus) grown under UV radiation and low root zone temperature in a controlled environment. Hortic. Environ. Biotechnol. 2020, 61, 267–277. [Google Scholar] [CrossRef]
- Daymond, A.J.; Wheeler, T.R.; Hadley, P.; Ellis, R.H.; Morison, J.I.L. The growth, development and yield of onion (Allium cepa L.) in response to temperature and CO2. J. Hortic. Sci. 1997, 72, 135–145. [Google Scholar] [CrossRef]
- Wurr, D.C.E.; Hand, D.W.; Edmondson, R.N.; Fellows, J.R.; Hannah, M.A.; Cribb, D.M. Climate change: A response surface study of the effects of CO2 and temperature on the growth of beetroot, carrots and onions. J. Agric. Sci. 1998, 131, 125–133. [Google Scholar] [CrossRef]
- Mamatha, H.; Rao, N.S.; Laxman, R.H.; Shivashankara, K.S.; Bhatt, R.M.; Pavithra, K.C. Impact of elevated CO2 on growth, physiology, yield, and quality of tomato (Lycopersicon esculentum Mill) cv. Arka Ashish. Photosynthetica 2014, 52, 519–528. [Google Scholar] [CrossRef]
- Kumar, S.N.; Bai, K.V.; Rajagopal, V.; Aggarwal, P.K. Simulating coconut growth, development and yield using infocrop-coconut model. Tree Physiol. 2008, 28, 1049–1058. [Google Scholar] [CrossRef] [Green Version]
- Malhotra, S.K. Horticultural crops and climate change: A review. Indian J. Agric. Sci. 2017, 87, 12–22. [Google Scholar]
- Teramura, A.H. Effects of ultraviolet-B radiation on the growth and yield of crop plants. Physiol. Plant. 1983, 58, 415–427. [Google Scholar] [CrossRef]
- Boeger, M.R.T.; Poulson, M. Effects of ultraviolet-B radiation on leaf morphology of Arabidopsis thaliana (L.) Heynh. (Brassicaceae). Acta Bot. Bras. 2006, 20, 329–338. [Google Scholar] [CrossRef]
- Karvansara, P.R.; Razavi, S.M. Physiological and biochemical responses of sugar beet (Beta vulgaris L.) to ultraviolet-B radiation. PeerJ 2019, 7, e6790. [Google Scholar] [CrossRef] [PubMed]
- Dai, Q.; Peng, S.; Chavez, A.Q.; Vergara, B.S. Effects of UVB radiation on stomatal density and opening in rice (Oryza sativa L.). Ann. Bot. 1995, 76, 65–70. [Google Scholar] [CrossRef]
- Zuk-Golaszewska, K.; Upadhyaya, M.K.; Golaszewski, J. The effect of UV-B radiation on plant growth and development. Plant Soil Environ. 2003, 49, 135–140. [Google Scholar] [CrossRef] [Green Version]
- Al-Oudat, M.; Baydoun, S.A.; Mohammad, A. Effects of enhanced UV-B on growth and yield of two Syrian crops wheat (Triticum durum var. Horani) and broad beans (Vicia faba) under field conditions. Environ. Exp. Bot. 1998, 40, 11–16. [Google Scholar] [CrossRef]
- Zhang, X.R.; Chen, Y.H.; Guo, Q.S.; Wang, W.M.; Liu, L.; Fan, J.; Li, C. Short-term UV-B radiation effects on morphology, physiological traits and accumulation of bioactive compounds in Prunella vulgaris L. J. Plant Interact. 2017, 12, 348–354. [Google Scholar] [CrossRef]
- Hideg, É.; Jansen, M.A.; Strid, Å. UV-B exposure, ROS, and stress: Inseparable companions or loosely linked associates? Trend Plant Sci. 2013, 18, 107–115. [Google Scholar] [CrossRef] [Green Version]
- Al Jaouni, S.; Saleh, A.M.; Wadaan, M.A.; Hozzein, W.N.; Selim, S.; Abd Elgawad, H. Elevated CO2 induces a global metabolic change in basil (Ocimum basilicum L.) and peppermint (Mentha piperita L.) and improves their biological activity. J. Plant Physiol. 2018, 224, 121–131. [Google Scholar] [CrossRef]
- Yang, X. Plants and Microclimate: A quantitative approach to environmental plant physiology. Agric. For. Meteorol. 1993, 66, 267–268. [Google Scholar] [CrossRef]
- Shah, N.H.; Paulsen, G.M. Interaction of drought and high temperature on photosynthesis and grain-filling of wheat. Plant Soil. 2003, 257, 219–226. [Google Scholar] [CrossRef]
- Angadi, S.V.; Cutforth, H.W.; Miller, P.R.; McConkey, B.G.; Entz, M.H.; Brandt, S.A.; Volkmar, K.M. Response of three Brassica species to high temperature stress during reproductive growth. Can. J. Plant Sci. 2000, 80, 693–701. [Google Scholar] [CrossRef] [Green Version]
- Rodríguez, V.M.; Soengas, P.; Alonso-Villaverde, V.; Sotelo, T.; Cartea, M.E.; Velasco, P. Effect of temperature stress on the early vegetative development of Brassica oleracea L. BMC Plant Biol. 2015, 15, 145. [Google Scholar] [CrossRef] [PubMed] [Green Version]
- Choi, E.Y.; Seo, T.C.; Lee, S.G.; Cho, I.H.; Stangoulis, J. Growth and physiological responses of Chinese cabbage and radish to long-term exposure to elevated carbon dioxide and temperature. Hortic. Environ. Biotechnol. 2011, 52, 376. [Google Scholar] [CrossRef]
- Hinojosa, L.; Matanguihan, J.B.; Murphy, K.M. Effect of high temperature on pollen morphology, plant growth and seed yield in quinoa (Chenopodium quinoa Willd.). J. Agron. Crops Sci. 2019, 205, 33–45. [Google Scholar] [CrossRef] [Green Version]
- Sun, P.; Mantri, N.; Lou, H.; Hu, Y.; Sun, D.; Zhu, Y.; Lu, H. Effects of elevated CO2 and temperature on yield and fruit quality of strawberry (Fragaria × ananassa Duch.) at two levels of nitrogen application. PLoS ONE 2012, 7, e41000. [Google Scholar] [CrossRef]
- Kumari, M.; Verma, S.C.; Bhardwaj, S.K. Effect of elevated CO2 and temperature on crop growth and yield attributes of bell pepper (Capsicum annuum L.). J. Agrometeorol. 2019, 21, 1–6. [Google Scholar] [CrossRef]
- Rangaswamy, T.C.; Sridhara, S.; Ramesh, N.; Gopakkali, P.; El-Ansary, D.O.; Mahmoud, E.A.; Abdel-Hamid, A.M. Assessing the impact of higher levels of CO2 and temperature and their interactions on tomato (Solanum lycopersicum L.). Plants 2021, 10, 256. [Google Scholar] [CrossRef]
- Teramura, A.H.; Sullivan, J.H.; Ziska, L.H. Interaction of elevated ultraviolet-B radiation and CO2 on productivity and photosynthetic characteristics in wheat, rice, and soybean. Plant Physiol. 1990, 94, 470–475. [Google Scholar] [CrossRef] [Green Version]
- Sullivan, J.H.; Teramura, A.H. The effects of UV-B radiation on loblolly pine. Interaction with CO2 enhancement. Plant Cell Environ. 1994, 17, 311–317. [Google Scholar] [CrossRef]
- Wand, S.J.; Midgley, G.F.; Musil, C.F. Physiological and growth responses of two African species, Acacia karroo and Themedatriandra, to combined increases in CO2 and UV-B radiation. Physiol. Plant 1996, 98, 882–890. [Google Scholar] [CrossRef]
- Gwynn-Jones, D.; Lee, J.A.; Callaghan, T.V. Effects of enhanced UV-B radiation and elevated carbon dioxide concentrations on a sub-arctic forest heath ecosystem. Plant Ecol. 1997, 128, 242–249. [Google Scholar] [CrossRef]
- Visser, A.J.; Tosserams, M.; Groen, M.W.; Magendans, G.W.H.; Rozema, J. The combined effects of CO2 concentration and solar UV-B radiation on faba bean grown in open-top chambers. Plant Cell Environ. 1997, 20, 189–199. [Google Scholar] [CrossRef] [PubMed]
- Tosserams, M.; Visser, A.; Groen, M.; Kalis, G.; Magendans, E.; Rozema, J. Combined effects of CO2concentration and enhanced UV-B radiation on faba bean. Plant Ecol. 2001, 154, 197–210. [Google Scholar] [CrossRef]
- Ziska, L.H.; Teramura, A.H. CO2 enhancement of growth and photosynthesis in rice (Oryza sativa): Modification by increased ultraviolet-B radiation. Plant Physiol. 1992, 99, 473–481. [Google Scholar] [CrossRef] [Green Version]
- Van de Staaij, J.W.M.; Lenssen, G.M.; Stroetenga, M.; Rozema, J. The combined effects of elevated CO2 levels and UV-B radiation on growth characteristics of Elymus athericus (=E. pycnanathus). Vegetatio 1993, 104, 433–439. [Google Scholar] [CrossRef]
- Brand, D.; Wijewardana, C.; Gao, W.; Reddy, K.R. Interactive effects of carbon dioxide, low temperature, and ultraviolet-B radiation on cotton seedling root and shoot morphology and growth. Front. Earth Sci. 2016, 10, 607–620. [Google Scholar] [CrossRef]
- Qaderi, M.M.; Basraon, N.K.; Chinnappa, C.C.; Reid, D.M. Combined effects of temperature, ultraviolet-B radiation, and watering regime on growth and physiological processes in canola (Brassica napus) seedlings. Int. J. Plant Sci. 2010, 171, 466–481. [Google Scholar] [CrossRef]
- Wijewardana, C.; Hock, M.; Henry, B.; Reddy, K.R. Screening corn hybrids for cold tolerance using morphological traits for early-season seeding. Crop Sci. 2015, 55, 851–867. [Google Scholar] [CrossRef] [Green Version]
- Reddy, K.R.; Brand, D.; Wijewardana, C.; Gao, W. Temperature effects on cotton seedling emergence, growth, and development. Agron. J. 2017, 109, 1379–1387. [Google Scholar] [CrossRef]
- Singh, B.; Norvell, E.; Wijewardana, C.; Wallace, T.; Chastain, D.; Reddy, K.R. Assessing morphological characteristics of elite cotton lines from different breeding programmes for low temperature and drought tolerance. J. Agron. Crop Sci. 2018, 204, 467–476. [Google Scholar] [CrossRef]
- Pritchard, S.G.; Prior, S.A.; Rogers, H.H.; Davis, M.A.; Runion, G.B.; Popham, T.W. Effects of elevated atmospheric CO2 on root dynamics and productivity of sorghum grown under conventional and conservation agricultural management practices. Agric. Ecosyst. Environ. 2006, 113, 175–183. [Google Scholar] [CrossRef]
- Cohen, I.; Rapaport, T.; Berger, R.T.; Rachmilevitch, S. The effects of elevated CO2 and nitrogen nutrition on root dynamics. Plant Sci. 2018, 272, 294–300. [Google Scholar] [CrossRef] [PubMed]
- Arnone, J.A.; Zaller, J.G.; Spehn, E.M.; Niklaus, P.A.; Wells, C.E.; Körner, C. Dynamics of root systems in native grasslands: Effects of elevated atmospheric CO2. New Phyol. 2000, 147, 73–85. [Google Scholar] [CrossRef]
- Milchunas, D.G.; Morgan, J.A.; Mosier, A.R.; LeCain, D.R. Root dynamics and demography in shortgrass steppe under elevated CO2, and comments on minirhizotron methodology. Glob. Change Biol. 2005, 11, 1837–1855. [Google Scholar] [CrossRef]
- Sindhøj, E.; Hansson, A.C.; Andrén, O.; Kätterer, T.; Marissink, M.; Pettersson, R. Root dynamics in a semi-natural grassland in relation to atmospheric carbon dioxide enrichment, soil water and shoot biomass. Plant Soil. 2000, 223, 255–265. [Google Scholar] [CrossRef]
- Ostonen, I.; Püttsepp, Ü.; Biel, C.; Alberton, O.; Bakker, M.R.; Lõhmus, K.; Brunner, I. Specific root length as an indicator of environmental change. Plant Biosyst. 2007, 141, 426–442. [Google Scholar] [CrossRef]
- Costa, C.; Dwyer, L.M.; Zhou, X.; Dutilleul, P.; Hamel, C.; Reid, L.M. Root morphology of contrasting maize genotypes. Agron. J. 2002, 94, 96–101. [Google Scholar] [CrossRef]
- Canbay, S.; Polat, E. The effects of UV-B irradiation on development and quality of tomato, cucumber and eggplant seedlings. Mediterr. Agric. Sci. 2019, 32, 79–84. [Google Scholar] [CrossRef]
- Wu, W.; Duncan, R.W.; Ma, B.L. Quantification of canola root morphological traits under heat and drought stresses with electrical measurements. Plant Soil. 2017, 415, 229–244. [Google Scholar] [CrossRef]
- Gowda, V.R.; Henry, A.; Vadez, V.; Shashidhar, H.E.; Serraj, R. Water uptake dynamics under progressive drought stress in diverse accessions of the Oryza SNP panel of rice (Oryza sativa). Funct. Plant Biol. 2012, 39, 402–411. [Google Scholar] [CrossRef] [PubMed]
- Rozema, J.; Van de Staaij, J.; Björn, L.O.; Caldwell, M. UV-B as an environmental factor in plant life: Stress and regulation. Trend Ecol. Evol. 1997, 12, 22–28. [Google Scholar] [CrossRef]


| Treatments | Measured Temperature (°C) | CO2 (µmol mol−1) | VPD (kPa) | Mean ET (L H2O d−1) | |||
|---|---|---|---|---|---|---|---|
| Day | Night | Day/Night | Day | Day | Night | Day/Night | |
| Control | 24.8 ± 0.03 | 17.5 ± 0.04 | 21.6 ± 0.03 | 434.3 ± 1.77 | 1.4 ± 0.01 | 0.98 ± 0.01 | 8.6 ± 0.45 |
| +CO2 | 25 ± 0.03 | 17.6 ± 0.03 | 21.8 ± 0.02 | 723.6 ± 0.33 | 1.4 ± 0.01 | 1 ± 0.01 | 7.4 ± 0.67 |
| +T | 30 ± 0.88 | 22.4 ± 0.88 | 26.7± 0.87 | 435.1 ± 1.76 | 2.1 ± 0.15 | 1.5 ± 0.11 | 8.5 ± 0.63 |
| +UV-B | 24.7 ±0.04 | 17.4 ± 0.04 | 21.5 ± 0.03 | 436.9 ± 2.44 | 1.4 ± 0.01 | 1 ± 0.01 | 6.6 ± 0.24 |
| +T+CO2 | 30.3 ± 0.94 | 22.6 ± 0.93 | 27 ± 0.92 | 724 ± 0.36 | 2.6± 0.15 | 1.7 ± 0.12 | 8.7 ± 0.81 |
| +UV-B+CO2 | 24.8 ± 0.03 | 17.4 ± 0.03 | 21.5 ± 0.03 | 720.5 ± 0.55 | 1.3 ± 0.02 | 0.93 ± 0.01 | 5.2 ± 0.47 |
| +UV-B+CO2+T | 30 ± 0.89 | 22.4 ± 0.88 | 26.7 ± 0.87 | 733.2 ±0.49 | 2.6 ± 0.19 | 1.8 ± 0.14 | 6.91 ± 0.59 |
| Source of Variance | PH | LN | LA | MFW | ADW | RDW | TDW | LRL | TRL | RSA | RAD | RLPV | RV | RT | RF | RC |
|---|---|---|---|---|---|---|---|---|---|---|---|---|---|---|---|---|
| Treatment | *** | *** | *** | *** | *** | *** | *** | * | *** | *** | *** | *** | *** | *** | *** | *** |
| Crop | ** | *** | *** | *** | *** | *** | *** | *** | *** | *** | *** | *** | *** | *** | *** | *** |
| Trt × Crop | NS | *** | *** | *** | ** | ** | ** | * | ** | ** | *** | ** | ** | *** | ** | ** |
| Traits | Crop | Treatments | |||||||
|---|---|---|---|---|---|---|---|---|---|
| Control | 0 | +T | +UV-B | +T+CO2 | +UV-B+CO2 | +UV-B+CO2+T | |||
| PH (cm plant−1) | Kale | 30.8 | 33.3 (+8%) | 27.2 (−11.7%) | 14.3 (−53%) | 29.8 (−3.3%) | 17.3 (−43.8%) | 18.5 (−40%) | |
| Mustard | 31.9 | 35.8 (+12%) | 28 (−12%) | 19.3 (−39%) | 31.3 (−1.8%) | 19.5 (−38.8%) | 22.3 (−30%) | ||
| LN (plant−1) | Kale | 9.33 | 9.7 (+3.9%) | 8.7 (−8.8%) | 9.5 (+1.8%) | 9 (−3.5%) | 17.3 (−43.8%) | 18.5 (−40%) | |
| Mustard | 11.7 | 12.7 (+8.5%) | 9.7 (+17%) | 10.8 (−7.6%) | 15.8 (+35%) | 19.5 (−38.8%) | 22.3 (−30%) | ||
| LA (cm2 plant−1) | Kale | 600.5 | 779.3 (+29.8%) | 424.5 (−29.3%) | 131.7 (−78%) | 565.7 (−5.7%) | 226.3 (−62.3%) | 292.9 (−51.2%) | |
| Shoot Traits | Mustard | 1305.1 | 1629.6 (+24.8%) | 983.9 (−24.6%) | 363.5 (−72%) | 1495.5 (−8.2%) | 380.5 (−70.8%) | 653.5 (−50%) | |
| MFW (g plant−1) | Kale | 42 | 51.5 (+22.7%) | 24 (−42.7%) | 12.7 (−69.7%) | 35 (−16.9%) | 20.9 (−50%) | 22.5 (−46.3%) | |
| Mustard | 76.3 | 116.2 (+52%) | 61.3 (−19.7%) | 30.4 (−60.2%) | 96.9 (26.8%) | 30.6 (−60%) | 50 (−34.5%) | ||
| ADW (g plant−1) | Kale | 3.69 | 5.7 (+55%) | 2.8 (−24.6%) | 1.3 (−64%) | 4.2 (+13.7%) | 2.6 (−28.4%) | 2.7 (−27.6%) | |
| Mustard | 5.93 | 8.8 (+48%) | 5.4 (−9.5%) | 2.6 (−56.8%) | 8.6 (+45.7%) | 2.7 (−54.5%) | 4.6 (−22.4%) | ||
| RDW (g plant−1) | Kale | 0.37 | 0.6 (+55.2%) | 0.3 (−30%) | 0.1 (−63%) | 0.4 (0%) | 0.3 (−65.6%) | 0.3 (−20%) | |
| Dry weight traits | Mustard | 0.79 | 1 (+32.8%) | 0.7 (−5.9%) | 0.4 (−52.7%) | 1.1 (+43.4%) | 0.3 (−60%) | 0.7 (−7%) | |
| TDW (g plant−1) | Kale | 4.05 | 6.3 (+55.3%) | 3 (−25%) | 1.5 (−64%) | 4.6 (+12.5%) | 2.9 (−28%) | 3 (−27%) | |
| Mustard | 6.71 | 9.9 (+47%) | 6.1 (−9%) | 2.9 (−60%) | 9.8 (+45.6%) | 3 (−55%) | 5.3 (−20%) | ||
| Root Traits | Crop | Treatments | ||||||
|---|---|---|---|---|---|---|---|---|
| Control | +CO2 | +T | +UV-B | +T+CO2 | +UV-B+CO2 | +UV-B+CO2+T | ||
| LRL (cm plant−1) | Kale | 38.3 | 44 (+14.7%) | 31.5 (−17.8%) | 29 (−24.3%) | 29.8 (−22%) | 39 (+1.7%) | 31.7 (−17.3%) |
| Mustard | 41.2 | 42.7 (+3.6%) | 48.2 (+17%) | 34.2 (−17%) | 42 (+2%) | 39.8 (−3.2%) | 45.7 (+10.9%) | |
| TRL (cm plant−1) | Kale | 3389 | 5327.1 (+57%) | 2961.7 (−12.6%) | 1924.7 (−43%) | 3443.1 (+1.6%) | 3352.3 (−1%) | 2953.5 (−13%) |
| Mustard | 5717.9 | 5659.8 (−1%) | 7012 (+22.6%) | 3477.3 (−39%) | 6011.6 (+5%) | 3626 (−36.5%) | 5665.1 (−1%) | |
| RSA (cm2 plant−1) | Kale | 469.1 | 775.1 (+65%) | 362.9 (−22.6%) | 244.9 (−47.7%) | 473 (+1%) | 419.5 (−10.5%) | 394.7 (−15.8%) |
| Mustard | 944.8 | 1169.9 (+24%) | 1033.7 (+9.4%) | 507.3 (−46.3%) | 1259.2 (+33%) | 491 (−48%) | 924.6 (−2%) | |
| RAD (mm plant−1) | Kale | 0.4 | 0.5 (+4.3%) | 0.4 (−11%) | 0.4 (−7%) | 0.4 (−1%) | 0.4 (−9.2%) | 0.4 (−1%) |
| Mustard | 0.5 | 0.7 (+28.7%) | 0.5 (−10%) | 0.4 (−12%) | 0.7 (+30%) | 0.4 (−16.5%) | 0.5 (−1%) | |
| RLPV (cm m−3) | Kale | 3389 | 5327.1 (+57%) | 2961.7 (−12.6%) | 1924.7 (−43%) | 3443.1 (+1.5%) | 3352.3 (−1%) | 2953.5 (−13%) |
| Mustard | 5717.9 | 5659.8 (−1%) | 7012 (+22.6%) | 3477.3 (−39%) | 6011.6 (+5%) | 3626 (−36.5%) | 5655.1 (−1%) | |
| RV (cm3 plant−1) | Kale | 5.2 | 9.1 (+75%) | 3.5 (−31.5%) | 2.5 (−52%) | 5.2 (+0.6%) | 4.2 (−19%) | 4.2 (−19%) |
| Mustard | 12.5 | 19.9 (+58%) | 12.2 (−2.5%) | 5.9 (−52.5%) | 21.1 (+68%) | 5.3 (−57.4%) | 12.1 (−3.3%) | |
| RT (no. plant−1) | Kale | 10,272.3 | 12,891.5 (+25.4%) | 7382 (−28%) | 7738.5 (−24.6%) | 6579.3 (−36%) | 7855.2 (−23.5%) | 6836.8(−33.4%) |
| Mustard | 14,876 | 12,958.2 (−13%) | 15,573.3 (+4.6%) | 10,666.7 (−28%) | 11,595.7 (−22%) | 9788.2 (−34%) | 11,546.1(−22.3%) | |
| RF (no. plant−1) | Kale | 31,897.8 | 12,891.5 (+25.4%) | 23,822.2 (−25.3%) | 15,334.3 (−52%) | 31,979 (−0.3%) | 30,935.3 (−3%) | 24,168 (−24%) |
| Mustard | 64,775.2 | 77,329.1 (+19.3%) | 77,665.8 (+20%) | 36,247.7 (−44%) | 83,101.7 (+28.3%) | 37,047.7 (−43%) | 62,078.5 (−4%) | |
| RC (no. plant−1) | Kale | 2791.2 | 4958.2 (+77.6%) | 2619.8 (−6%) | 1628.2 (−41.6%) | 3037.5 (+9%) | 3403.3 (+22%) | 2380.6 (−14.7%) |
| Mustard | 4531 | 4387.2 (−3%) | 6458.2 (+42.5%) | 2830.2 (−37.5%) | 4713.3 (+4%) | 3436.7 (−24%) | 4552. 83 (+0.5%) | |
Publisher’s Note: MDPI stays neutral with regard to jurisdictional claims in published maps and institutional affiliations. |
© 2022 by the authors. Licensee MDPI, Basel, Switzerland. This article is an open access article distributed under the terms and conditions of the Creative Commons Attribution (CC BY) license (https://creativecommons.org/licenses/by/4.0/).
Share and Cite
Sehgal, A.; Reddy, K.R.; Walne, C.H.; Barickman, T.C.; Brazel, S.; Chastain, D.; Gao, W. Individual and Interactive Effects of Multiple Abiotic Stress Treatments on Early-Season Growth and Development of Two Brassica Species. Agriculture 2022, 12, 453. https://doi.org/10.3390/agriculture12040453
Sehgal A, Reddy KR, Walne CH, Barickman TC, Brazel S, Chastain D, Gao W. Individual and Interactive Effects of Multiple Abiotic Stress Treatments on Early-Season Growth and Development of Two Brassica Species. Agriculture. 2022; 12(4):453. https://doi.org/10.3390/agriculture12040453
Chicago/Turabian StyleSehgal, Akanksha, Kambham Raja Reddy, Charles Hunt Walne, T. Casey Barickman, Skyler Brazel, Daryl Chastain, and Wei Gao. 2022. "Individual and Interactive Effects of Multiple Abiotic Stress Treatments on Early-Season Growth and Development of Two Brassica Species" Agriculture 12, no. 4: 453. https://doi.org/10.3390/agriculture12040453