Article

Nutrient Characterization in Soil Aggregate Fractions with Different Fertilizer Treatments in Greenhouse Vegetable Cultivation

School of Agriculture and Biology, Shanghai Jiao Tong University, 800 Dongchuan Road, Shanghai 200240, China
*
Author to whom correspondence should be addressed.
Agriculture 2022, 12(4), 440; https://doi.org/10.3390/agriculture12040440
Submission received: 15 February 2022 / Revised: 18 March 2022 / Accepted: 19 March 2022 / Published: 22 March 2022

Abstract

:
Fertilization affects the formation and stability of soil aggregate, as well as the nutrient status of soil aggregate. However, the potential effect of compost on soil aggregate and its nutrient characteristics is still unclear. In view of this, we conducted a greenhouse vegetable cultivation experiment to evaluate soil water-stable aggregate (WSA) and its stability indices and aggregate nutrient stoichiometry characteristics at 0 to 20 cm soil depth with four treatments: (1) no fertilizer (CK), (2) chemical fertilizer (CF), (3) organic fertilizer (OF), and (4) chemical fertilizer plus organic fertilizer (CO). The results showed that the proportion of the 2 to 0.25 mm fraction was the greatest, followed by 0.25 to 0.053 mm, which accounted for 41.83 to 49.53% and 28.60 to 31.88% by weight, respectively. The mean weight diameter (MWD) value and the proportion of the >0.25 mm fraction in the CF, OF, and CO treatments were significantly higher than in the CK treatment. Within the fertilization treatments, the MWD and the proportion of the >0.25 mm fraction in the CO were significantly higher than those in CF and OF. Among all the aggregates, the soil organic carbon (SOC), total nitrogen (TN), and total phosphorus (TP) contents were the highest in the fraction of 0.25 to 0.053 mm. The CF, OF, and CO treatments significantly increased the SOC, TN, and TP contents compared with the CK treatment. The SOC content of fractions >2 mm and 0.25 to 0.053 mm in the CO treatment was significantly higher than that of the CF and OF treatments, and the TN and TP contents in all the aggregates (except < 0.053 mm) were the highest in the CO treatment. The SOC, TN, and TP contents in the 2 to 0.25 mm and 0.25 to 0.053 mm components contributed greatly to the soil SOC, TN, and TP reserves. There was no noticeable difference in the nutrient stoichiometry of the soil aggregate between the different treatments. Redundancy analysis (RDA) revealed that the soil physicochemical factors, including SOC, TN, TP, and pH, significantly explained the stability of the soil aggregate. To summarize, chemical fertilizer combined with organic fertilizer positively affected the stability and nutrient accumulation of soil aggregates in greenhouse dryland.

1. Introduction

As a highly intensive agricultural system, greenhouse cultivation has been put into production in many countries, such as the Netherlands, Israel, Japan, etc. [1]. In China, greenhouse cultivation has developed rapidly, with the cultivated area increasing from 5.3 × 10³ hm2 in 1980 to 3.86 × 10⁶ hm2 in 2015, and it is still increasing at an annual rate of 10% [2] and has developed into an important agricultural pillar industry in China [1]. However, with the industry development, inappropriate agricultural practices, such as continuous application of single or compound chemical fertilizers, decrease soil organic matter (SOM) content and increase soil organic contamination, resulting in massive soil ecological pressures [3,4]. Therefore, the development of more environmentally friendly and sustainable agricultural practices is needed. Organic fertilizer (OF) is derived from several organic wastes and contains a large amount of humus. Humus is composed of fulvic and humic acid, continuously releasing carbon and nitrogen nutrients into the soil environment. Consequently, applying OF modifiers provides an effective way to enhance soil quality and is also conducive to the recycling of organic solid wastes [5,6]. For example, studies have shown that OF application resulted in increased soil organic carbon (SOC), total nitrogen (TN), and phosphorus (P), and ensured the sustainability of crop production [7]. Moreover, complex adhesives will be formed through the combination of SOM and mineral particles, which contributes to improve soil aggregate stability [8]. Additionally, applying OF to the soil provides a wealth of active microorganisms, accelerating the disaggregation and agglomeration of soil aggregate, thereby contributing to the aggregate formation [9,10].
The soil structure is usually characterized by the size distribution and stability of the soil aggregate [11]. As fundamental units of soil structure, soil aggregates have a vital effect on various physicochemical properties of soil and are important carriers to stabilize and protect SOC and nutrients [12]. Using 0.25 mm as the boundary, soil aggregate can be divided into macro-aggregate (>0.25 mm) and micro-aggregate (<0.25 mm). Generally, the aggregate with a diameter > 0.25 mm is ideal, which has a good capacity for fertilizer and water conservation and aeration [13]. Additionally, the mean weight diameter (MWD) can be used as a key indicator to evaluate the stability of a soil aggregate. In agricultural soils, fertilization affects the size and quantity distribution of a soil aggregate [14]. Specifically, the soil aggregate stability can be enhanced due to alterations in the distribution of the soil aggregate by adding manure or organic materials [15,16]. Studies have also shown that the micro-aggregate ratio displayed a significant increase when composting was applied [17]. Moreover, the nutrient level of a soil aggregate not only improves soil fertility but also changes the soil aggregate distribution, thereby influencing the stability of the soil aggregate [18,19]. Aggregates with different particle sizes have different abilities in maintaining and supplying SOC and nutrients [20]. The SOC and TN contents were mainly accumulated in macro-aggregate in the surface soil, as reported in a study [21]. Previous studies reported that approximately 90% of the SOC is stored in aggregate in the topsoil, which is considered the key factor of soil carbon storage, and macro-aggregate is considered to be the most important aggregate fraction for storing SOC [22,23]. Accordingly, it is interesting to investigate the composition and distribution of aggregate in agricultural soil and clarify the content and distribution of SOC and nutrients in soil aggregate fractions, which is useful for us to better understand the coupling and balance mechanism of nutrients in soil aggregate.
C, N, and P play an indispensable role in soil ecosystem functions and services, such as nutrient cycling and transformation, habitat variability, and mineral mineralization [24,25]. Ecological stoichiometry, a comprehensive method to study the dynamic balance and coupling of C, N, and P in the ecosystem, can analyze the composition and proportion of C, N, and P in the ecosystem and clarify the characteristics and driving mechanism of nutrient cycling [26]. Soil ecostoichiometry is highly significant in revealing nutrient availability and limiting conditions, and exploring the biogeochemical cycle of C, N, and P [27,28]. Additionally, the dynamics of SOM may be influenced by nutrient stoichiometry. Nutrients such as N and P affect the growth and turnover of soil microorganisms and are particularly important for subsequent C sequestration [29]. The soil nutrient stoichiometry is influenced by soil characteristics, management practices, and climate conditions [30]. Presently, research on soil nutrient stoichiometry primarily focuses on grassland [30], woodland [31,32], global or national scale [33,34], as well as the whole soil of cultivated land [35]. However, there is a lack of a systematic comparison of studies on nutrients and stoichiometry at the scale of soil aggregate in greenhouse dryland under different fertilizers. With this in mind, an investigation regarding the response of nutrients and stoichiometry to different fertilizers in soil aggregate fractions is necessary, which has practical significance for guiding rational fertilization and improving soil quality.
A greenhouse vegetable cultivation soil with four fertilization treatments was selected for this study to investigate different fertilization treatments’ effects on soil aggregate stability and nutrients. The purposes of our study were: (1) to reveal different fertilization treatments’ effects on soil aggregate distribution and stability and aggregate-associated SOC, TN, and TP, and (2) to analyze the stoichiometric characteristics of aggregate-associated nutrients and soil physicochemical factors’ effects on aggregate stability following different fertilization treatments. We hypothesized that: (1) fertilization will affect the soil aggregate distribution and increase soil aggregate stability, and the combined application of chemical and organic fertilizer would perform better than either fertilizer alone in increasing aggregate stability; (2) the change in soil aggregate distribution will affect its nutrient distribution; (3) the improvement in soil stability will contribute to the increase in SOC, TN, and TP. The study provides a reference for the quality management of cultivated soil, the rational application of fertilizers, and the sustainable development of agriculture.

2. Materials and Methods

2.1. Experimental Site

A greenhouse cultivation experiment was conducted between February and December 2020 in Jiading District (31°27′ N, 121°15′ E), Shanghai, China. The climate in this area is north subtropical southeast monsoon. Average temperature, average precipitation, and mean sunshine time in 2020 are 17.8 °C, 1650 mm, and 1900 h, respectively. The highest mean monthly temperature (27.5 °C) and the maximum rainfall (948 mm) in 2020 are from June to August. The soil type is dry ditch mud, and the soil texture is silt soil. The primary soil physicochemical characteristics of the plow layer (0–20 cm) are shown in Table S1.

2.2. Experimental Design

The greenhouse cultivation experiment was designed with four treatments: (1) CK, no fertilizer; (2) CF, chemical fertilizer; (3) OF, organic fertilizer (source from cattle manure and fruit and vegetable peel); (4) CO, chemical fertilizer (50% N) plus organic fertilizer (50% N). The experiment was arranged in a completely randomized block design with triplicate plots for each. Each treatment plot was 2 m (width) and 16 m (length), and a 50 cm ditch was set to avoid the interaction between the plots. Vegetables were planted in each plot. The detailed fertilization number of the treatments is shown in Table 1. Organic fertilizer was made by natural composting from a local OF production company. The physicochemical characteristics of organic fertilizer are shown in Table S2. The amount of organic fertilizer applied is calculated using the pure nitrogen of chemical fertilizer, equal to that of chemical fertilizer. Nitrogen fertilizer (as urea) was used twice during the experiment, with two-thirds urea used as basal fertilizer and one-third urea used as topdressing. Organic fertilizer, phosphate fertilizer (as calcium superphosphate), and potassium fertilizer (as potassium sulfate) were all used as basal fertilizer. The chemical fertilizer and organic fertilizer were applied twice per annum, evenly broadcast on the soil surface, and then plowed into a depth of 20 cm before planting. Both fertilization and crop harvest were conducted manually, and other field management was conducted according to local habits.

2.3. Sample Collection

Topsoil (0–20 cm) samples from 12 plots were collected using a soil corer (5 cm in diameter) in December 2020 (after vegetable harvest). The samples used in determining the original physicochemical characteristics of soil were collected before the experiment in February 2020. All soil samples were gently broken after being randomly collected from five cores in each plot, crop residues were carefully removed, and a composite soil sample was obtained. The mixed soil samples were placed in rectangular plastic boxes to minimize physical disturbance and were immediately brought to the laboratory. All the samples were manually divided into two parts: one part for the analysis of soil aggregate fractions, and the other part was used to determine the physicochemical properties after air-drying.

2.4. Soil Aggregate Fractions

The method of wet-sieving was used to obtain water-stable aggregate (WSA) with different size fractions [36]. Four size aggregate fractions including macro-aggregate (>2 mm), middle aggregate (2–0.25 mm), micro-aggregate (0.25–0.053 mm), and clay and silt (<0.053-mm) were separated. Briefly, 100 g air-dried soil sample was placed on the 2 mm sieve, and 0.25 mm and 0.053 mm sieves were successively placed below. The whole sieve was gradually put into a bucket filled with two-thirds distilled water and soaked for five minutes on an aggregate analyzer (TPF-100, Technology Co., Ltd., Top Cloud-agri, Zhejiang, China). Then, the wet-sieving procedure was maintained for five minutes with an up and down of 3.5 cm amplitude at a speed of 30 times per minute. The sieved aggregate fractions were carefully washed into a pre-weighed aluminum box and oven-dried to constant weight at 60 °C. Therefore, the proportion of aggregate fraction on each sieve relative to the total sample weight was calculated. The MWD (mm) was calculated based on wet-sieving outcomes. MWD was calculated as follows:
M W D = i = 1 n X i W i
where Xi and Wi are the mean diameter and the mass ratio of the i-th aggregate particle size fraction, respectively.

2.5. Determination of Soil Physicochemical Properties

The soil bulk density (BD) was obtained by cutting ring method, while the soil pH was measured using a potentiometer in a soil water ratio of 1:2.5, w/v. The content of SOC, TN, and TP in soil aggregate were assayed using the potassium dichromate oxidation, Kjeldahl, and ammonium molybdate colorimetric method, respectively [37]. Therefore, SOC, TN, and TP stock can be calculated on the basis of the above measurement outcomes Equations, according to Fan et al. [38], as follows:
SOC stock (Mg C ha−1) = C × BD × D × 10
TN stock (Mg N ha−1) = N × BD × D × 10
TP stock (Mg P ha−1) = P × BD × D × 10
where C, N, P, BD, and D represent the SOC content (g kg−1), TN content (g kg−1), TP content (g kg−1), soil bulk density (Mg m−3), and soil depth (0.2 m), respectively; 10 is a factor to adjust units.

2.6. Data Statistical Analysis

The average value and standard error of experimental data were completed using Microsoft Office Excel 2019. One-way analysis of variance (ANOVA) was performed to assess the effects of different fertilization treatments on the soil aggregate fraction and stability, SOC, TN, and TP content using IBM SPSS 24.0 software (IBM, Armonk, the United States of America). Duncan’s multiple range test was used to determine the significant difference among treatments at the p < 0.05 level unless otherwise stated. All data are presented as mean ± standard error (SE). Pearson correlation analysis was conducted to investigate the relationship between nutrients and stoichiometry in soil aggregate. Redundancy analysis (RDA) was used to analyze relationships between soil physicochemical factors and MWD using CANOCO 4.5 software (Microcomputer Power, Ithaca, NY, USA). Additionally, all the figures were produced using OriginPro 2022.

3. Results

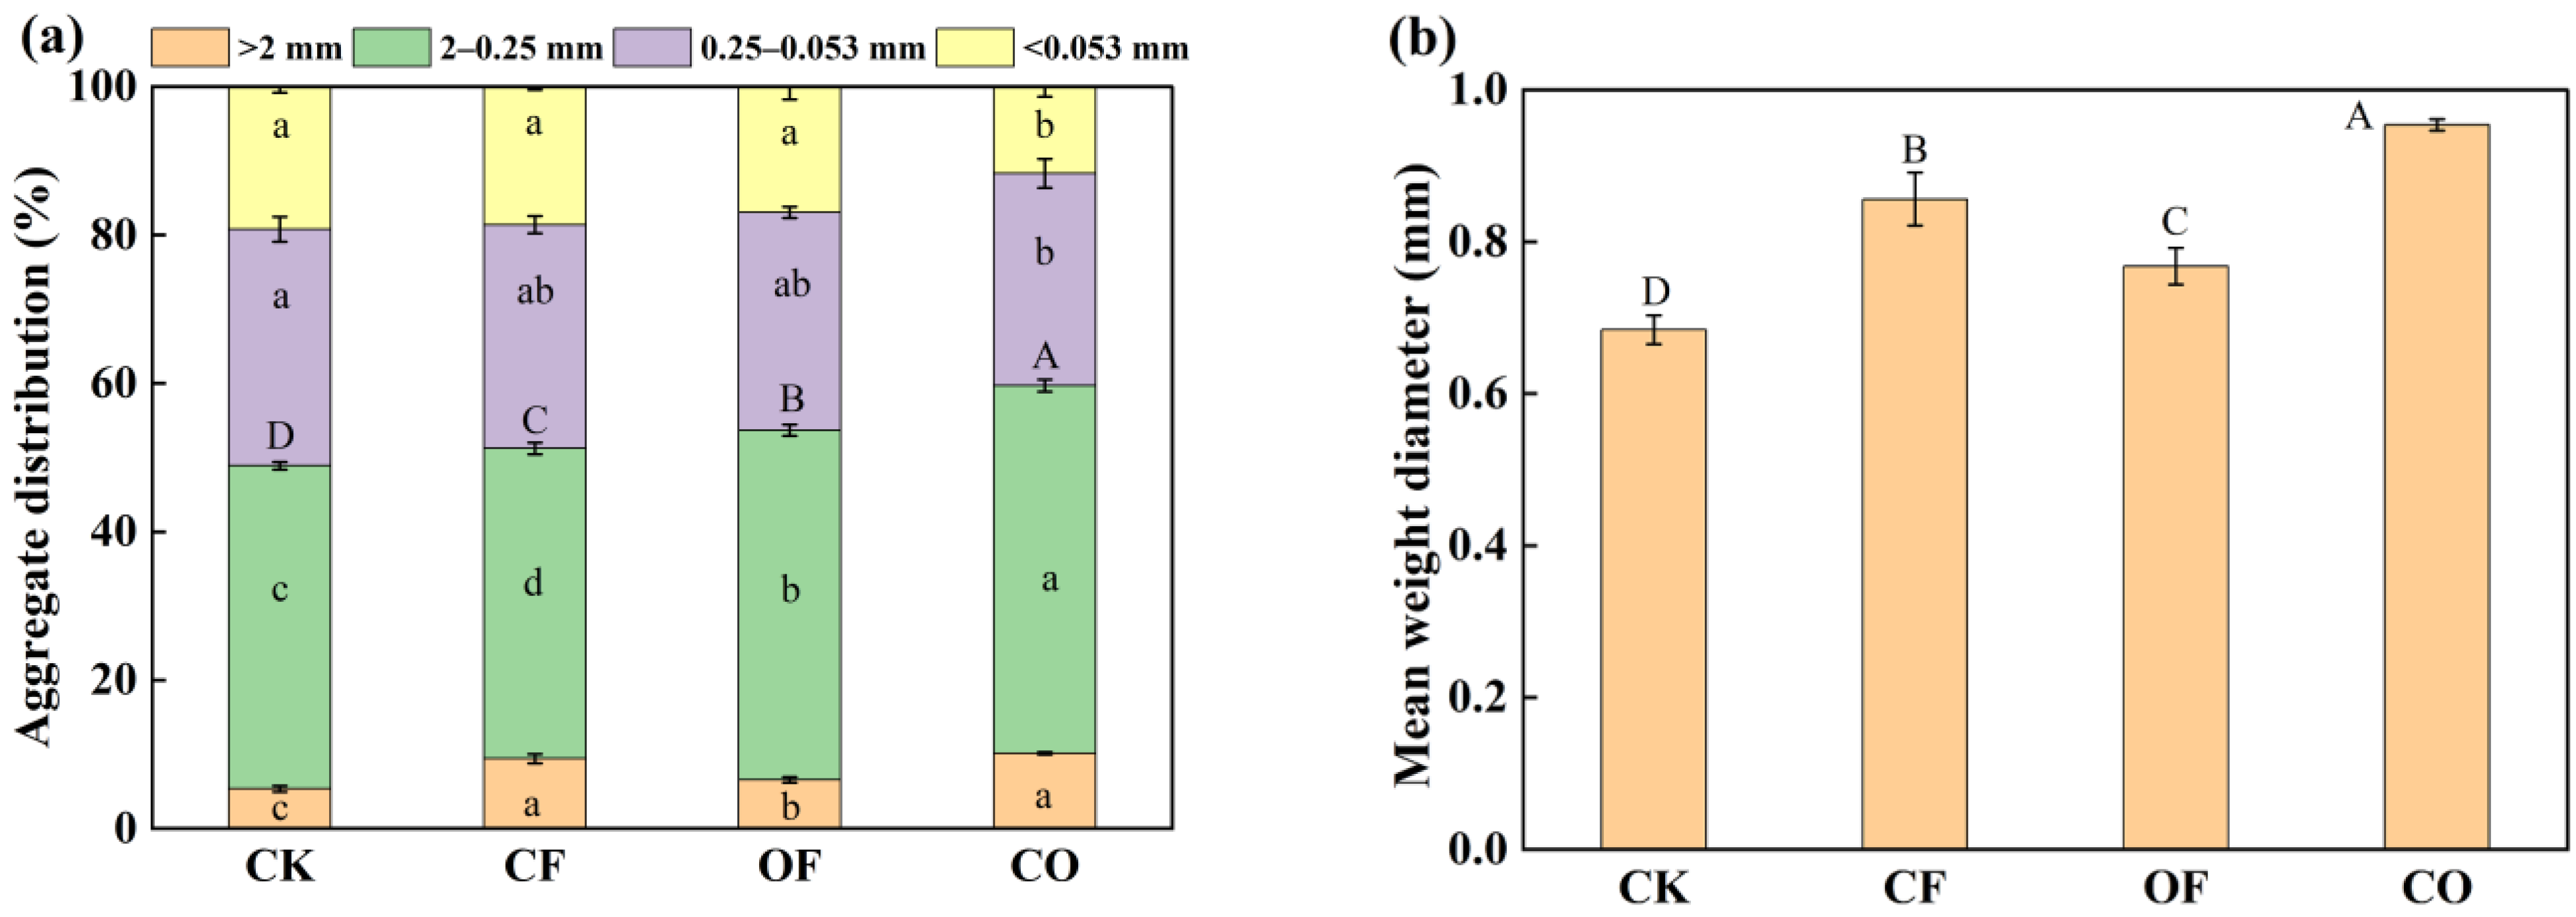
3.1. Fraction and Stability of Soil Aggregate

The fraction of 2 to 0.25 mm is the largest proportion in the soil aggregate (41.83–49.53%), followed by aggregate 0.25 to 0.053 mm (28.60–31.88%) (Figure 1). Fertilization treatments significantly increased the proportion of >2 mm compared with the CK treatment, and the CO treatment had the highest proportion. Additionally, the proportion of 2 to 0.25 mm aggregate in the CO treatment was significantly higher than that in other treatments. Therefore, the proportion of >0.25 mm aggregate in the CO treatment is the highest. The MWD was significantly increased by fertilization compared with CK, including a 26.47% increase in the CF treatment, a 13.24% increase in the OF treatment, and a 39.71% increase in the CO treatment. The MWD of the CO treatment was the highest, suggesting that chemical fertilizer combined with organic fertilizer was more conducive to the stability of the soil aggregate.

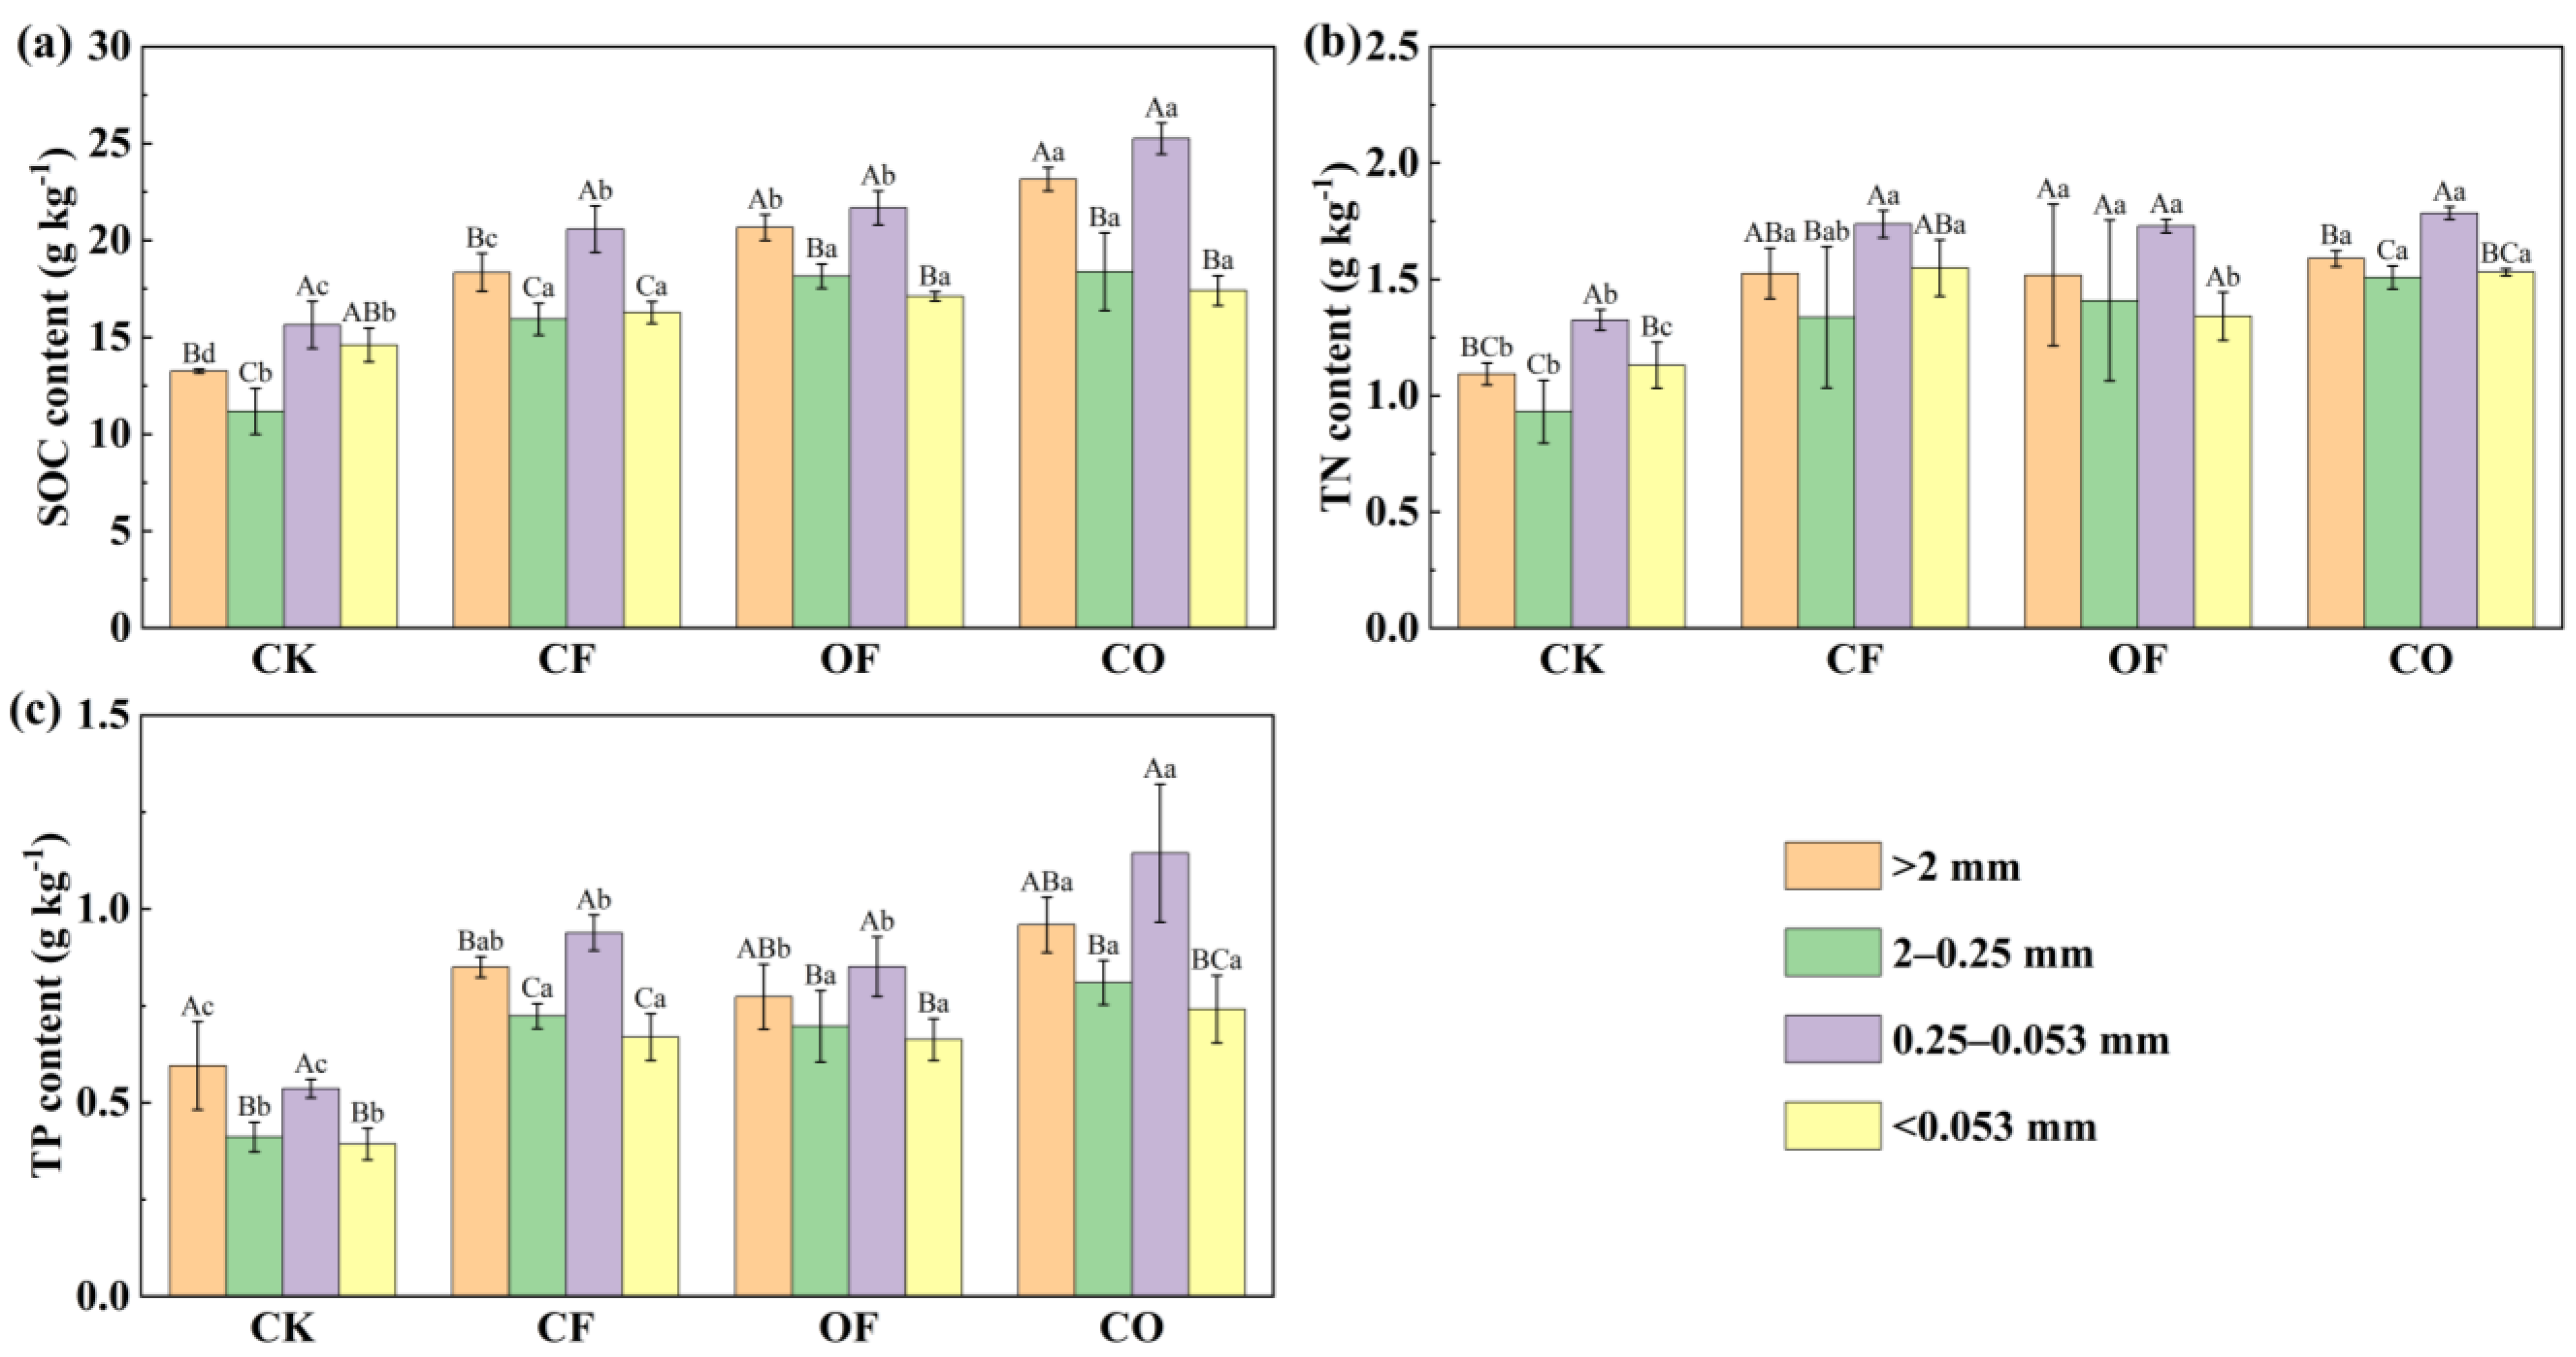
3.2. Nutrient Content in Soil Aggregate

The SOC contents in the soil aggregate fractions were significantly increased by the fertilization treatments compared to the CK treatment (Figure 2a). Among them, the CO treatment was the most significant. In detail, the CF, OF, and CO treatments significantly increased the SOC contents in the >2 mm fractions by 38.43%, 55.91%, and 74.70%, respectively. For the 2 to 0.25 mm fractions, the SOC contents were significantly increased by 42.55%, 62.39%, and 64.46% under the CF, OF, and CO treatments, respectively. The CF, OF, and CO treatments did not differ. Likewise, for clay and silt of <0.053 mm, the CF, OF, and CO treatments increased the SOC contents up to 11.46%, 17.23%, and 19.22%, respectively. For the 0.25 to 0.053 mm aggregate fraction, the CF, OF, and CO treatments resulted in a 31.55%, 38.57%, and 61.47% increase in SOC concentrations, respectively. Moreover, the SOC contents within the 0.25 to 0.053 mm aggregate fraction were generally highest among all the aggregate fractions, followed by macro-aggregate of >2 mm.
For the TN contents in the soil aggregate of different treatments, fertilization treatment resulted in significant variations in the TN contents compared to the CK (Figure 2b). The CF, OF, and CO treatments significantly increased the TN concentrations in aggregate sizes > 2 mm, increasing by 39.53%, 38.86%, and 45.29%, respectively. The TN contents in the 2 to 0.25 mm fraction increased significantly by 51.39% and 62.02% under the OF and CO treatments, respectively. For the 0.25 to 0.053 mm aggregate fractions, the TN contents were significantly increased by 31.09%, 30.45%, and 34.68% with the CF, OF, and CO treatments. For aggregate fractions of <0.053 mm, the CF, OF, and CO treatments increased the TN contents up to 36.95%, 18.58%, and 35.30%, respectively. Conversely, the 0.25 to 0.053 mm fraction had the highest TN contents among all the aggregates. The TN content in the CO treatment within 0.25 to 0.053 mm aggregate was significantly higher than that of other aggregates, but no significant difference was observed among the aggregate in the OF treatment.
Similarly, fertilization also significantly increased the TP contents in each aggregate compared with the CK (Figure 2c). The CF, OF, and CO treatments significantly increased the TP contents of >2 mm aggregate by 42.72%, 29.92%, and 61.01%, respectively. The TP contents for 2 to 0.25 mm fractions were significantly increased by 75.77%, 69.40%, and 96.71% under the CF, OF, and CO treatments, respectively. Similarly, for clay and silt of <0.053 mm, the TP contents were significantly increased by 70.23%, 68.69%, and 88.59% under the CF, OF, and CO treatments, respectively. The CF, OF, and CO treatments increased the TP contents within the 0.25 to 0.053 mm aggregate fraction by 74.96%, 58.71%, and 113.28%, respectively. Additionally, the TP content in the fraction of 0.25 to 0.053 mm was the highest among the fertilization treatments, followed by the aggregate of >2 mm size.

3.3. Aggregate Associated Nutrient Stock

We calculated the storage capacity of the SOC, TN, and TP in each aggregate fraction. (Figure 3). The results showed that the fertilization treatments increased the SOC, TN, and TP storage capacity of the soil aggregate, except for silt and clay of <0.053 mm under the CO treatment. In the fertilization treatments, the fraction of 2 to 0.25 mm stored more SOC, TN, and TP, displaying the highest SOC, TN, and TP storage capacity, followed by the fraction of 0.25 to 0.053 mm. More specifically, the SOC stock in the CO treatment within 2 to 0.25 mm aggregate was the highest, which was significantly increased by 85.58% and 31.17% compared with CK and CF, respectively, and by 7.53% compared to the OF treatment, but could not reach a significant level. Additionally, for the 0.25 to 0.053 mm aggregate fraction, the SOC stock of the CO treatment was significantly increased by 44.16%, 12.02%, and 14.78%, respectively, compared to the CK, CF, and OF treatments (Figure 3a). For the TN stock in soil aggregate, the 2 to 0.25 mm fraction of the CO treatment was the most abundant, which was significantly increased by 83.03% compared with the CK treatment and increased by 27.96% and 13.80% compared with the CF and OF treatments, respectively, without any significant difference. Among the 0.25 to 0.053 mm components, the CF treatment had the highest TN storage, which was 28.24% higher than the CK treatment, and there was no significant difference with the OF and CO treatments (Figure 3b). Regarding the TP stock in the soil aggregate, similarly, the TP storage in the 2 to 0.25 mm fraction was higher than that in other fractions. Relative to the CK, CF, and OF treatments, the CO treatment significantly increased the TP storage in the fraction of 2 to 0.25 mm by 122.02%, 27.14%, and 23.09%, respectively. For the 0.25 to 0.053 mm fraction, the TP storage of the CO treatment was also the highest, which was 90.66%, 11.74%, and 32.80% higher than that of the CK, CF, and OF treatments, respectively (Figure 3c).

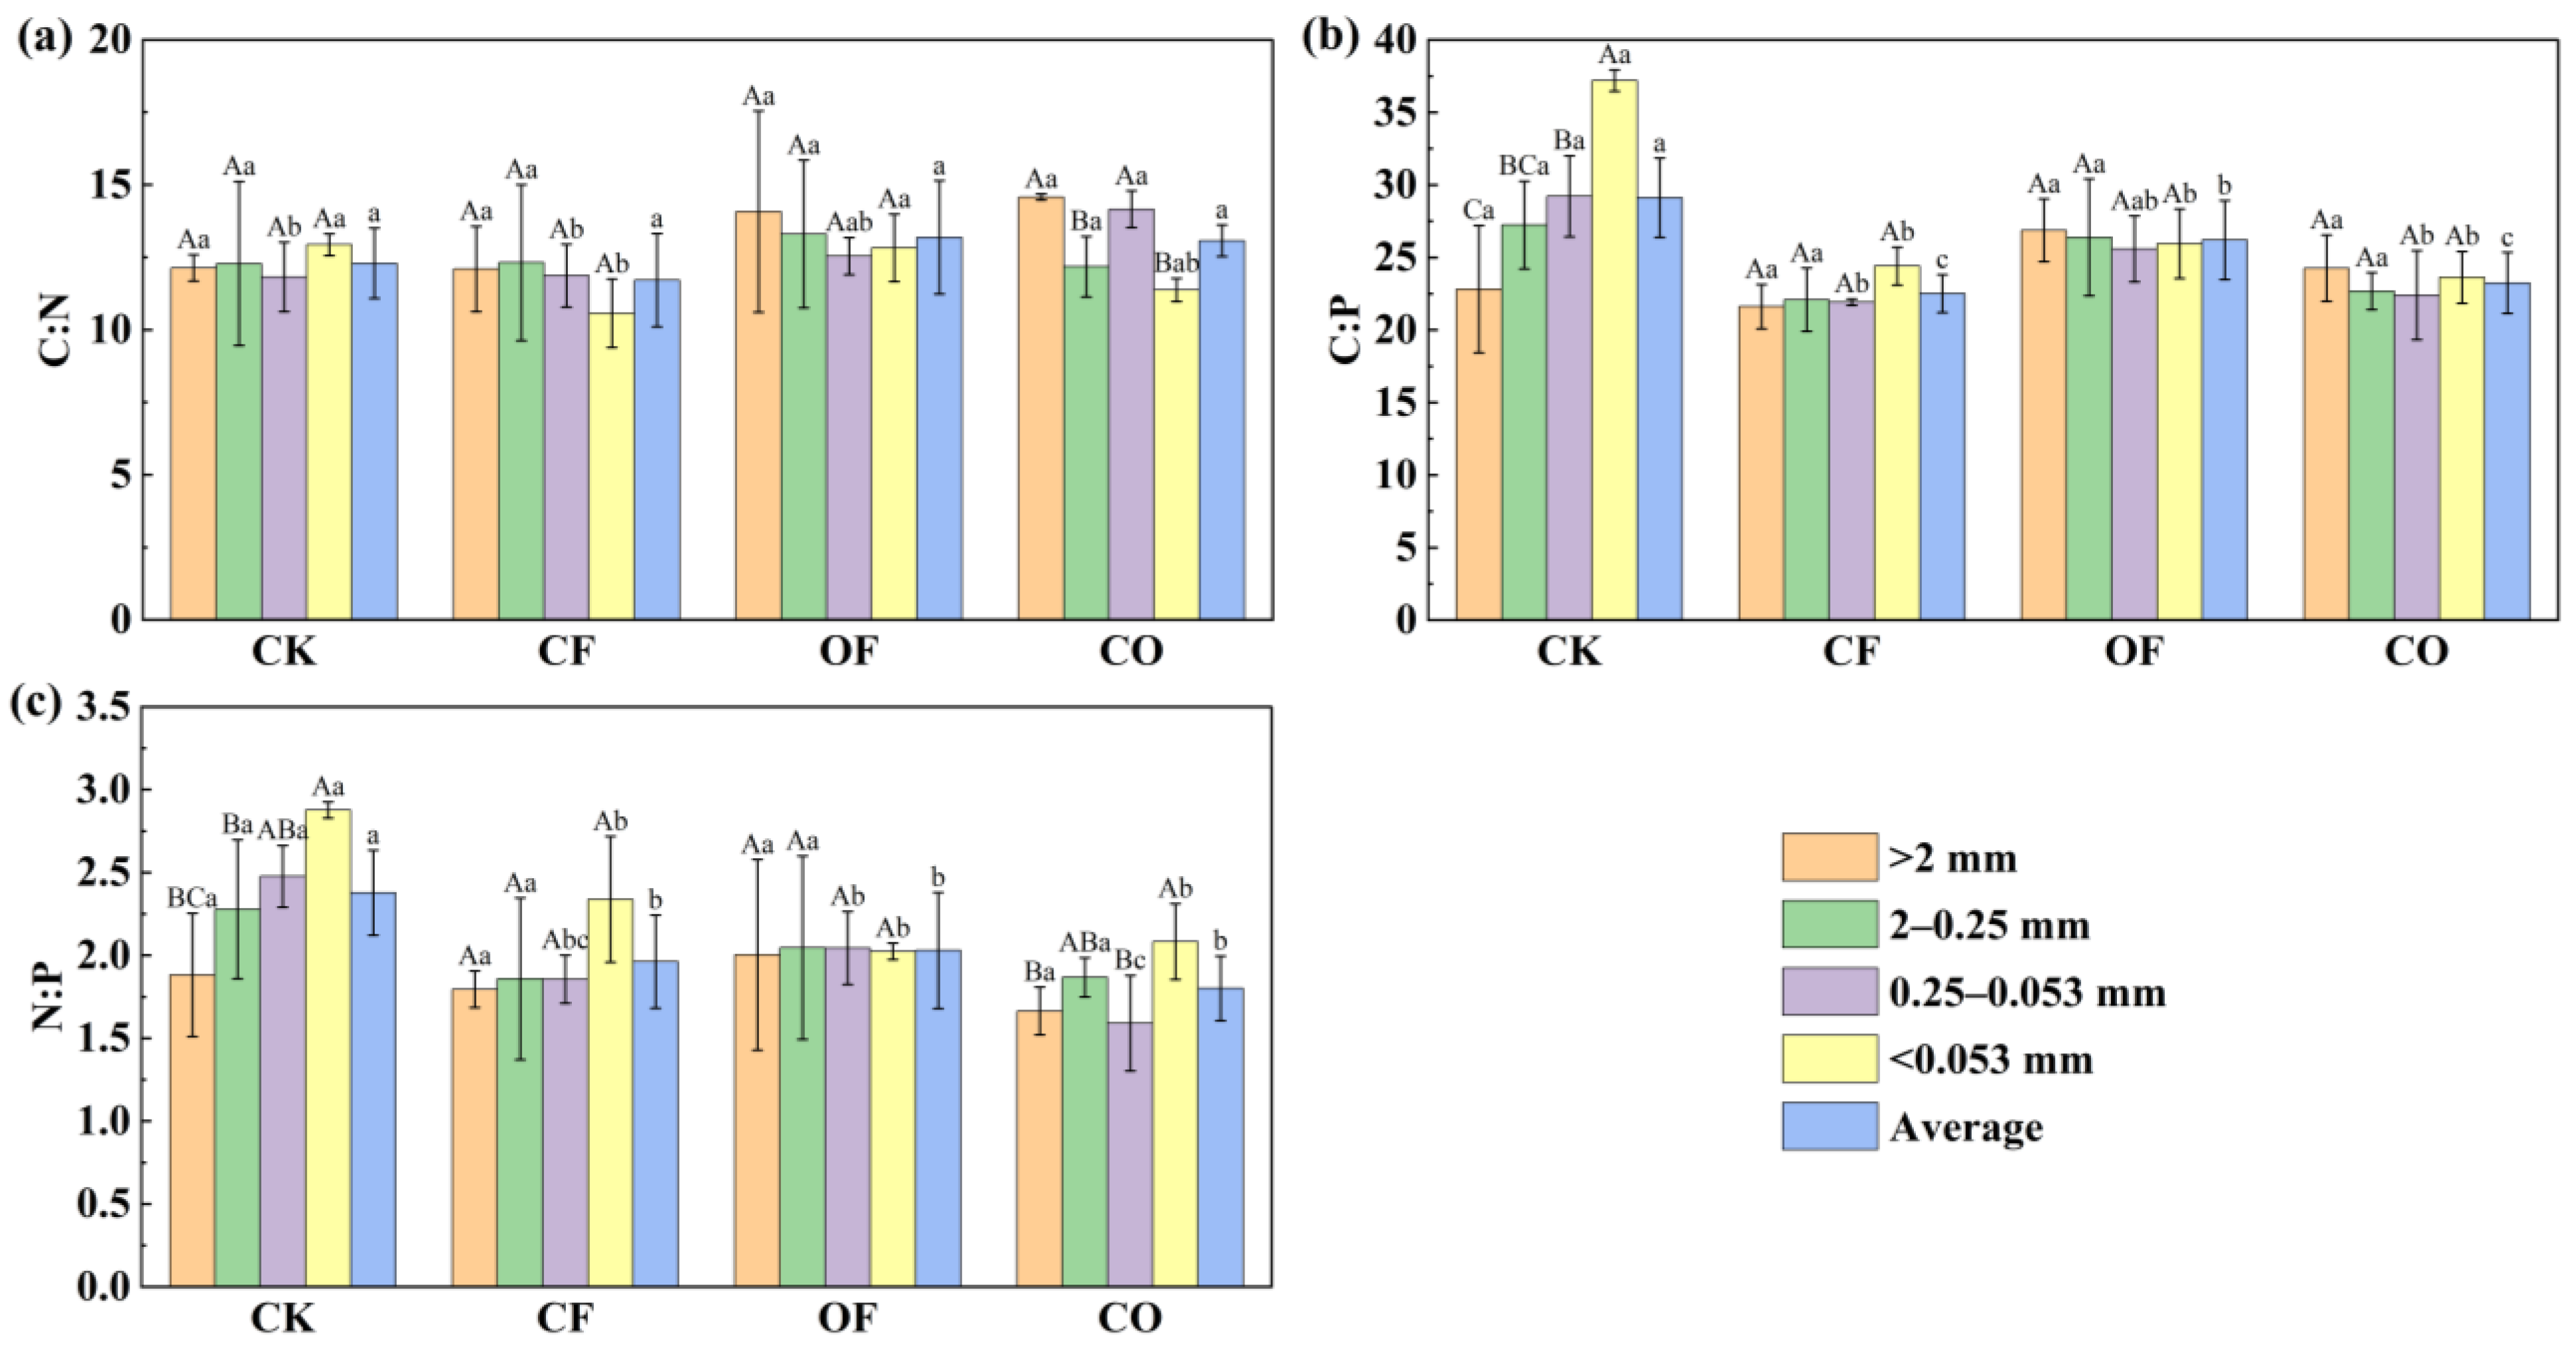
3.4. Nutrient Stoichiometry of Soil Aggregate

The stoichiometry of the C, N, and P in the soil aggregate under different fertilization treatments is shown in Figure 4. The C:N ratio value range of the >2 mm fraction was 12.09 to 14.57, and the value of the C:N ratio in the CO treatment was the highest, but there was no significant difference with other treatments. Likewise, the C:N ratio for the aggregate fraction between 2 and 0.25 mm did not differ significantly, ranging from 12.18 to 13.30. For the 0.25 to 0.053 mm fraction, the C:N ratio of the CO treatment was significantly higher than that of the CK and CF treatments. For the size of <0.053 mm, the C:N ratio was reduced by fertilization compared with CK, and the CF treatment was decreased the most. Generally, the average C:N ratio was the lowest in the CF treatment but had no significant difference with the other treatments (Figure 4a).
The differences in the C:P ratio were not obvious among the treatments in the fractions of >2 mm and 2 to 0.25 mm, with ranges of 21.61 to 26.87 and 22.09 to 27.24, respectively. For the aggregate sizes of 0.25 to 0.053 mm and <0.053 mm, the C:P ratio of the fertilization treatments was lower than that of CK, especially in silt and clay aggregate of <0.053 mm, the C:P ratio of the fertilization treatments was significantly lower than that of CK. For the average C:P ratio of all the aggregate fractions in each treatment, the fertilization treatments were significantly lower than the CK, showing that CK > OF > CO > CF (Figure 4b).
Similarly, the N:P ratio for the aggregate fractions > 2 mm and 2 to 0.25 mm did not differ significantly between the treatments, ranging from 1.66 to 2.00 and 1.86 to 2.28, respectively. The N:P ratio of the 0.25 to 0.053 mm and <0.053 mm fractions in the fertilization treatments were significantly lower than the CK treatment, and the CO treatment had the lowest N:P ratio in the fraction of 0.25 to 0.053 mm and the N:P ratio of <0.053 mm fraction. No significant changes among the CF, OF, and CO treatments were observed. The average N:P ratio of the fertilization treatments was significantly lower than that of the CK treatment, and the order was CK > OF > CF > CO (Figure 4c).

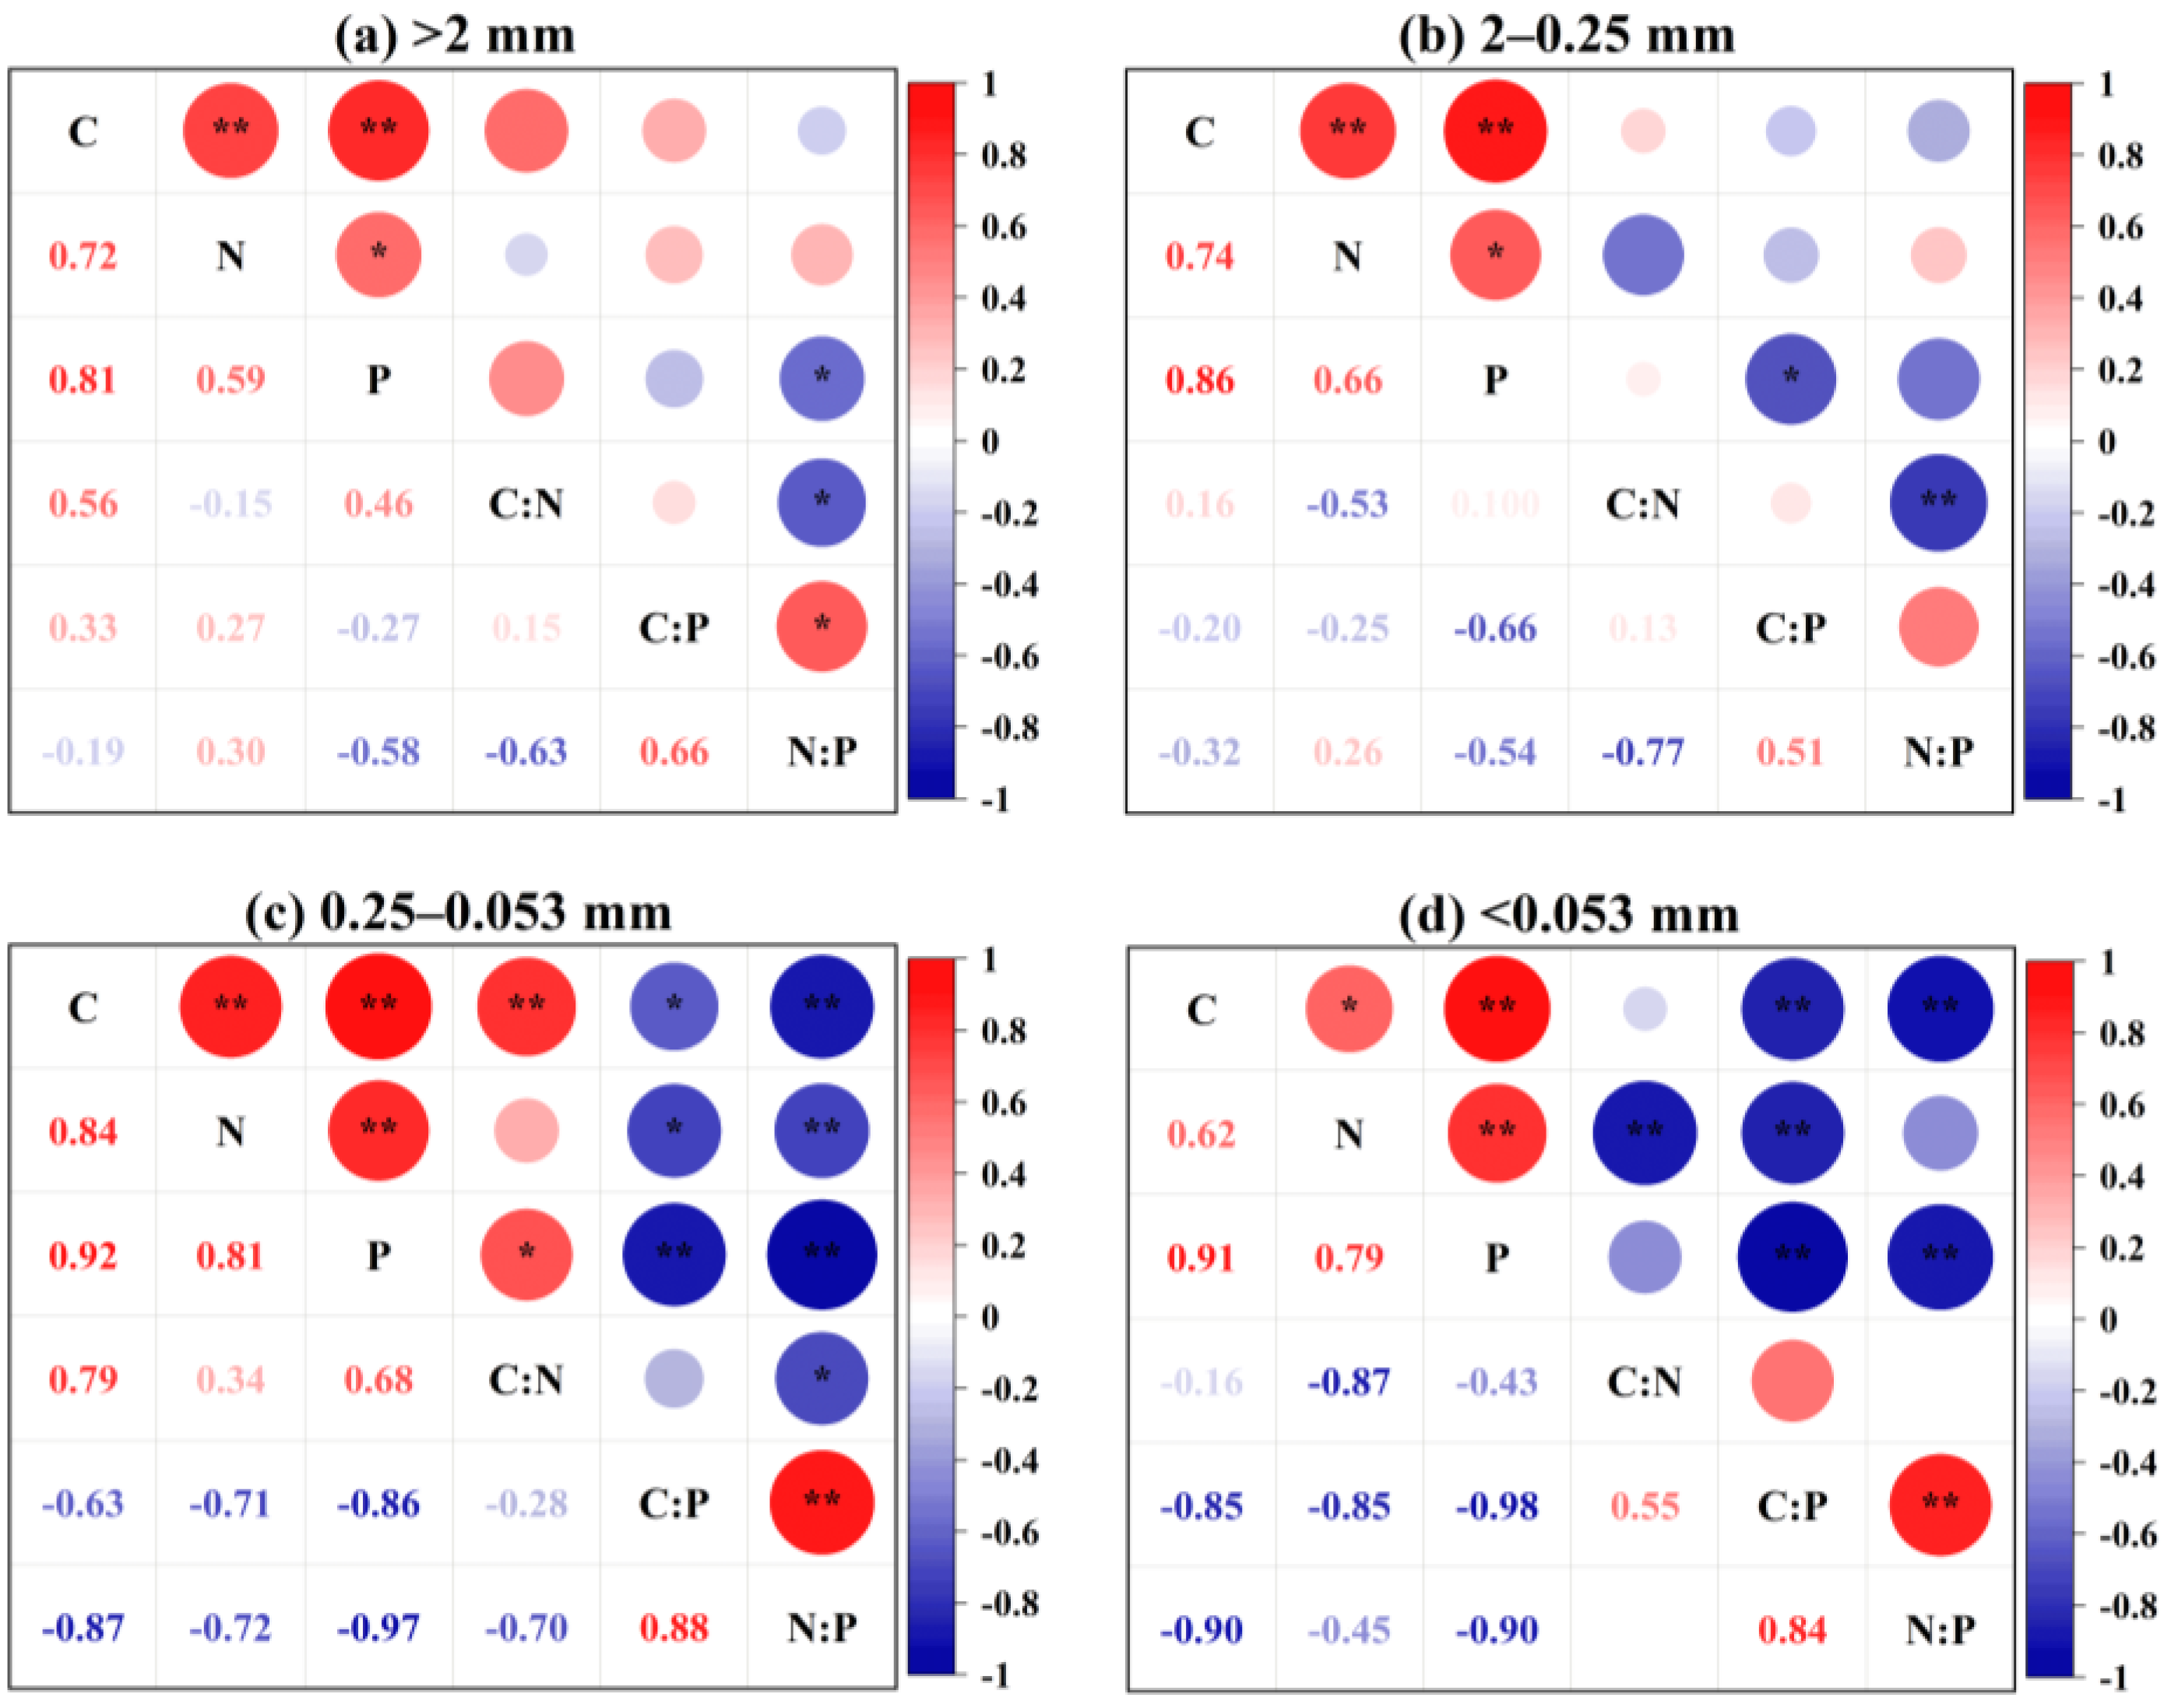
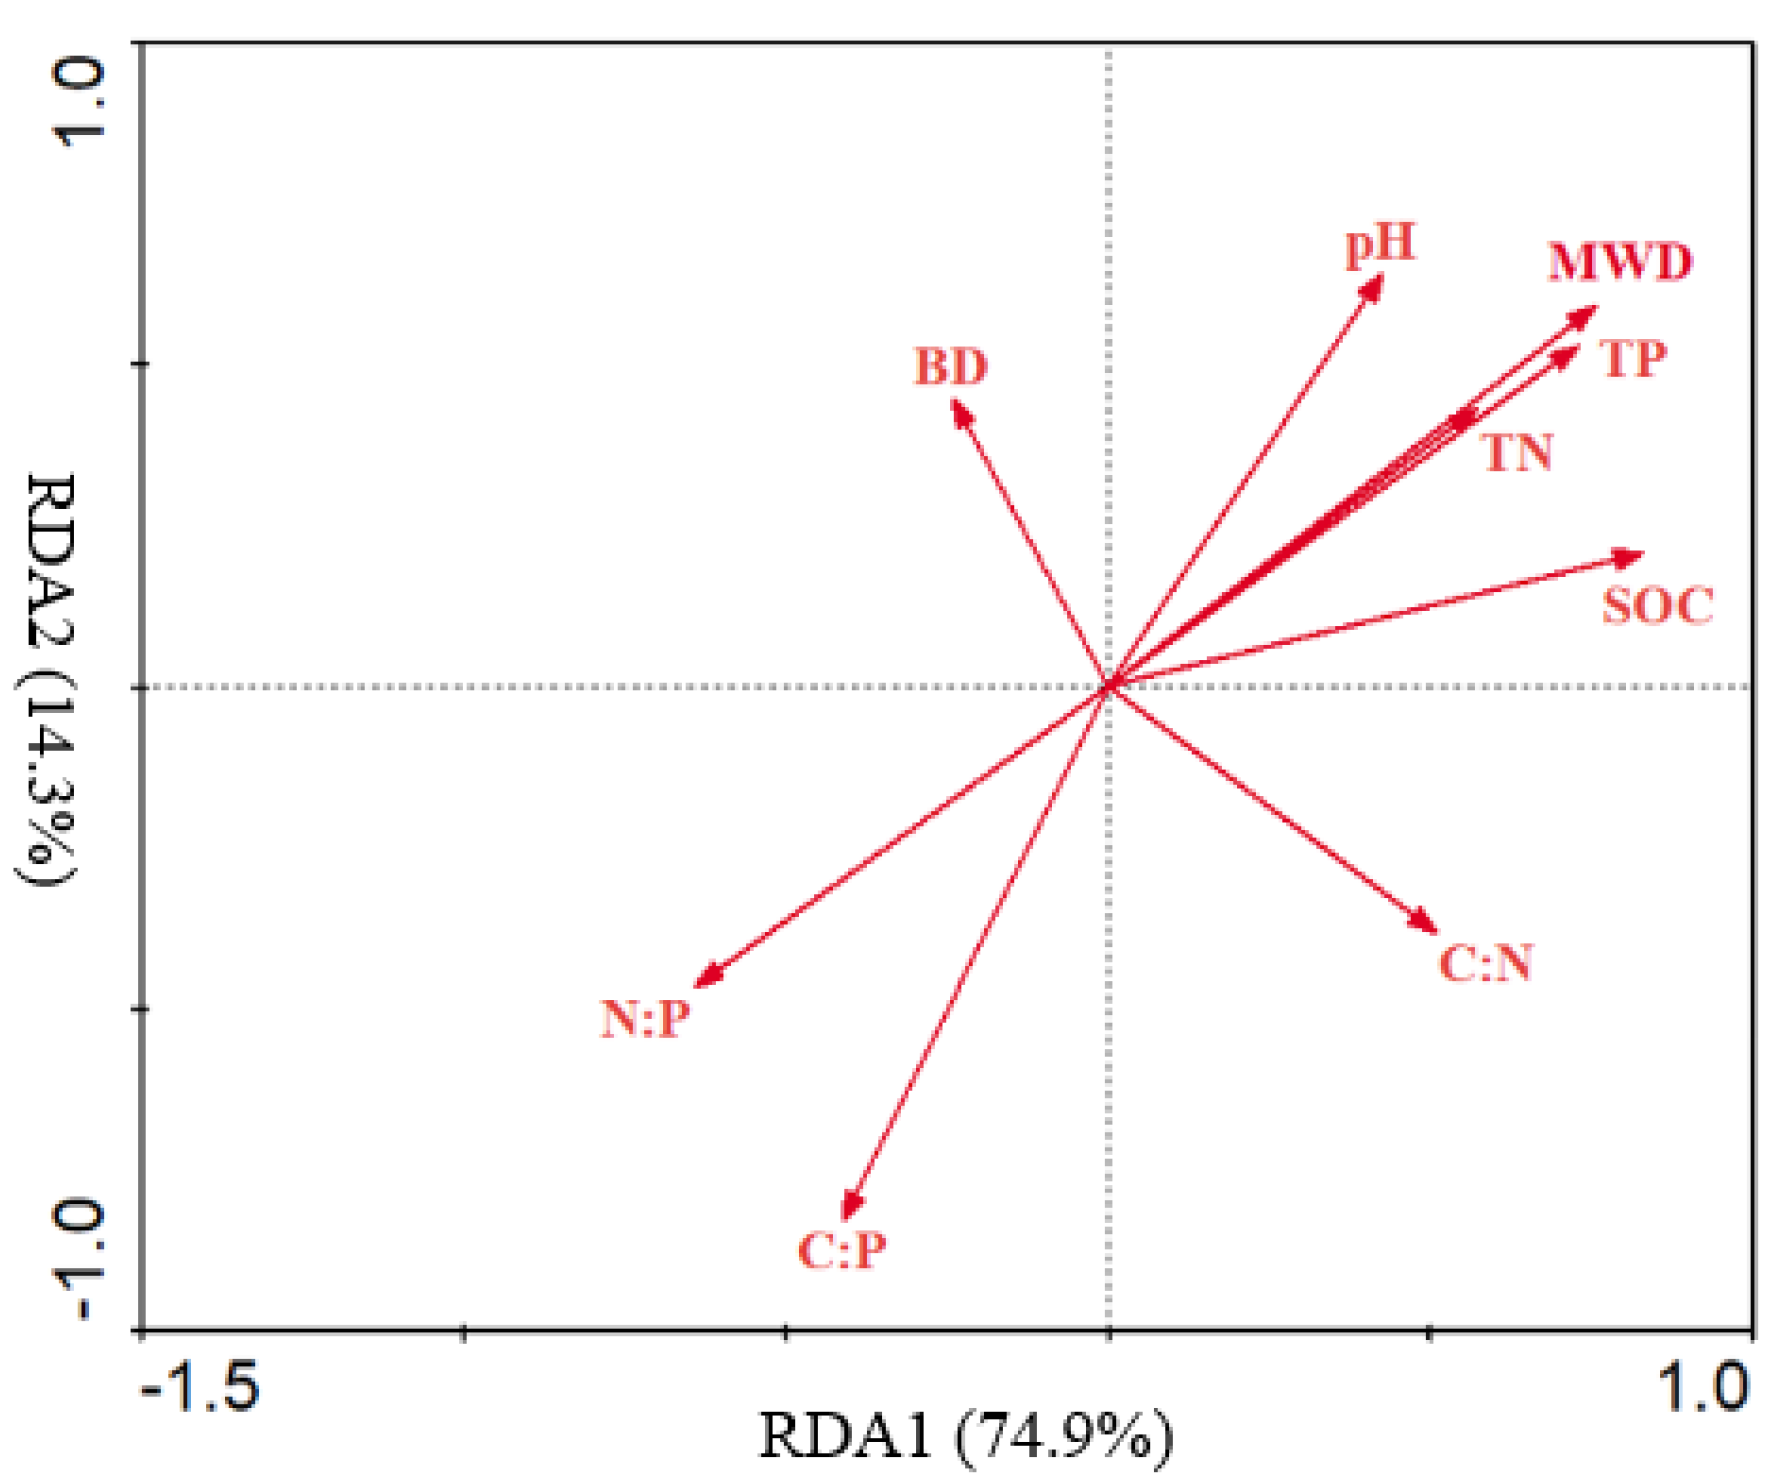
3.5. The Relationship between Nutrients and Stoichiometric Characteristics of Soil Aggregate

The relationship between the C, N, and P and stoichiometry of the soil aggregate was analyzed using Pearson correlation analysis (Figure 5). There was an extremely significant positive correlation between the SOC and TN among the size fractions of the aggregate (p < 0.01), except for the significant positive correlation in the particle size of <0.053 mm (p < 0.05). The SOC had a highly significant positive correlation with the TP in all the aggregate fractions (p < 0.01). The TN significantly correlated positively with the TP in the fractions of >2 mm and 2 to 0.25 mm (p < 0.05) and had an extremely significant positive correlation in the fractions of 0.25 to 0.053 mm and <0.053 mm (p < 0.01). The SOC had a highly significant positive correlation with the C:N ratio in the particle size of 0.25 to 0.053 mm (p < 0.01) and had an extremely significant positive correlation with the C:P ratio in the 0.25 to 0.053 mm (p < 0.05) and <0.053 mm (p < 0.01) fractions, but significantly correlated negatively with the C: P ratio in the fractions of 0.25 to 0.053 mm (p < 0.05) and <0.053 mm (p < 0.01), and showed an extremely significant negative correlation with the N: P ratio in the 0.25 to 0.053 mm and <0.053 mm aggregate fractions (p < 0.01). The TN had an extremely significant negative correlation with the C:N ratio in the fraction of <0.053 mm (p < 0.01) and significantly correlated negatively with the C:P ratio in the particle sizes of 0.25 to 0.053 mm (p < 0.05) and <0.053 mm (p < 0.01). Similarly, a significantly negative correlation existed between the TN and N:P ratio in the fraction of 0.25 to 0.053 mm (p < 0.01). The TP had a significant positive effect on the C:N ratio in the 0.25 to 0.053 mm aggregate fraction (p < 0.05) but had significant negative effects on the C: P ratio in the 2 to 0.25 mm (p < 0.05), 0.25 to 0.053 mm, and <0.053 mm aggregate fractions (p < 0.01), and had significant negative effects on the N:P ratio in the >2 mm (p < 0.05), 0.25 to 0.053 mm, and <0.053 mm aggregate fractions (p < 0.01).

3.6. Soil Physicochemical Factors’ Effects on Aggregate Stability

The RDA of the soil physicochemical factors and MWD is shown in Figure 6. The first two ordination axes provide 89.2% of the variation explained by the soil properties. A significant positive correlation between MWD and TP (p < 0.01), SOC (P < 0.01), TN (p < 0.01), and pH (p < 0.05) was detected, whereas a significant negative correlation existed between MWD and C:P (p < 0.01) and N:P (p < 0.01). The order of the contribution rate of soil physicochemical factors to aggregate stability is: TP > C:P> SOC> N:P > TN > pH > C:N > BD.

4. Discussion

The application of organic fertilizer can improve soil structure and contribute to soil aggregate stability [39,40]. The results from this study revealed that organic fertilizer treatments increased the MWD value and the proportion of aggregate > 0.25 mm, with the CO treatment being the most significant, indicating that organic fertilizer increased the soil organic matter content, which can form a composite binder by combining with mineral particles, enhancing the stability of the soil aggregate by reducing the soil wettability [41]. Moreover, organic fertilizer can provide the soil with abundant exogenous active organic substances, providing the necessary organic and inorganic cementing substances for the formation of aggregate through microorganism decomposition, and make small-sized aggregate cement to form large-sized aggregate by stimulating biologically active soil substances, thereby increasing the content of large aggregate and improving the stability [8]. Similar results showed that the addition of organic fertilizer contributed to the formation of >0.25 mm aggregate and increased the soil aggregate stability [42].
In this study, we hypothesized that soil stability improvement would contribute to the increase in nutrients. Based on the results, organic fertilizer application favored the SOC accumulated in aggregate, and the CO treatment had a better effect. The SOC content in the aggregate treated with CO was 19.22% to 74.70% higher than that of CK, and 6.96% to 26.20% higher than that of CF. It may be due to organic materials containing a great deal of organic matter, promoting the formation of macro-aggregate and increasing the organic carbon content of the aggregate [43,44]. A study found that soil aggregate associated with organic carbon was increased by 14% to 205% with compost application [45]. Additionally, soil aggregates with different particle sizes play different roles in nutrient supply and transformation [46]. As Zhang et al. [47] highlighted, the contribution of the macro-aggregate (>0.25 mm) to the SOC accumulation was greater than that of the other aggregate fractions. Moreover, the SOC, TN, and TP content in the aggregate showed a V-shaped change trend with decreasing particle size [48], and some of them showed an increasing trend with the decrease in particle size [49]. In this study, the SOC, TN, and TP content in the aggregate showed an inverted N-type change trend with the decrease in particle size. The fraction of 0.25 to 0.053 mm contained the highest SOC, TN, and TP, followed by the macro-aggregate of >2 mm, indicating that the trend of the nutrient supply in the aggregate was not affected by fertilization.
The nutrient storage capacity of the soil aggregate is of great significance for nutrient cycling and stability; approximately 90% of the SOC is stored in aggregate in the topsoil [22]. Different aggregate components exhibit different nutrient storage capacities. For example, the contribution of macro-aggregate (>0.25 mm) to the SOC storage was greater than that of other aggregate fractions, as reported in the Zhang et al. [47] study. Contrarily, Xie et al. [50] found that the SOC and TN were mainly fixed in micro-aggregate (<0.25 mm) through a 21-year field fertilization experiment. The study found that fertilization positively affects the storage of SOC, TN, and TP in soil aggregate, and 2 to 0.25 mm and 0.25 to 0.053 mm fractions are the main storage sites of SOC, TN, and TP. This may be because of the higher proportion of 2 to 0.25 mm and 0.25 to 0.053 mm fractions. In the 2 to 0.25 mm fraction, the SOC stock of the CO and OF treatments was significantly higher than that of the CF treatment. The CO treatment significantly increased the SOC stock of the micro-aggregate (0.25–0.053 mm) compared with the other treatments. The organic fertilizer treatments had a higher direct input of SOM into the soil, increasing the SOC storage capacity of the soil aggregate [51]. Regarding the TN stock, there was no obvious difference between fertilization treatments for either the 2 to 0.25 mm or 0.25 to 0.053 mm fraction, whereas Craswell et al. [52] reported similar results, and they probably have similar N mineralization rates. The TP stock of the 2 to 0.25 mm fraction treated with CO was significantly higher than that treated with CF and OF. Among the 0.25 to 0.053 mm fraction, the TP stock of the CO treatment was higher than that of the CF treatment and was significantly higher than that of the OF treatment, and, perhaps, CF accelerates the decomposition of both organic fertilizer and SOM, which is beneficial to the nutrient enrichment of these fractions [53].
The soil C:N, C:P, and N:P ratios are the coupling mechanism of the soil C, N, and P balance and are an important index reflecting the nutrient composition and quality of soil [52,54]. The mean C:N ratio, C:P ratio, and N:P ratio in the Chinese cultivated soil are 11.8, 38.1, and 3.4, respectively [27]. Our results showed that the C:N ratio range of the soil aggregate was 10.57 to 14.57, and the average range of the treatments was 11.71 to 13.18, which is generally higher than the national average level of cultivated soil. The average C:N ratio of the OF and CO treatments was relatively high. A direct reason may be that the organic fertilizer treatments had a higher C input into the soil [55]. Another potential explanation is that the SOM was at a low level of decomposition or mineralization when organic fertilizer was applied [56]. Additionally, the C:N ratio of the soil aggregate did not differ significantly among the different treatments, and a significant positive correlation between the C and N was found, indicating that the decomposition or mineralization rate of the SOM in different aggregate fractions was similar, or perhaps there is a close relationship between the C and N and their response to environmental changes was synchronized [25,57]. As described by Cleveland and Liptzin [58], the C and N are structural components, and their accumulation and consumption are relatively fixed. The C:P ratio of the soil aggregate ranged from 21.61 to 37.19 in this study, and the average range of the treatments was 22.51 to 29.11, which is lower than the national average level of cultivated soil. Regarding the average C:P ratio of the aggregate in the fertilization treatments, the OF treatment was the highest, followed by the CO and CF treatments. Although organic fertilizer treatments could directly input C into the soil, the P content of the aggregate in the OF treatment was lower than that in the CO and CF treatments. Additionally, organic fertilizer application may improve the soil P fixation by microorganisms and reduce the P mineralization potential [25,59,60] so that the effectiveness of P in the OF treatment was less than that in the CF treatment. Moreover, the C:P ratio in the >0.25 mm fraction did not differ significantly among the different treatments, but the fertilization treatments effectively decreased the C:P ratio in the <0.25 mm fraction. It may be that there were fewer microorganisms available for P fixation in the particle size of <0.25 mm, leading to the higher P availability [25]. The N:P ratio of the soil aggregate ranged from 1.59 to 2.88, and the average range of the treatments was 1.80 to 2.38, which is lower than the national average level of cultivated soil. The average soil N:P ratio of the OF treatment was the highest among the fertilization treatments, followed by the CF and CO treatments. One reason is that, as mentioned earlier, the decomposition or mineralization rate of the SOM under the OF treatment was slow, resulting in insufficient N or P released. Another reason may be that the nutrient content and type are relatively fixed in fertilization treatments, and individual nutrients for crop growth and development are insufficient and become the limiting element of soil nutrient [60,61]. The N:P ratio of the >0.25 mm aggregate fraction did not differ significantly under treatments, indicating that the response of the N and P in macro-aggregate to fertilization was similar, but the N:P ratio in the <0.25 mm aggregate fraction was significantly reduced under fertilization treatments; this may be, as mentioned above, that the P in micro-aggregate has a higher effectiveness under fertilization conditions, resulting in an increase in the P level and a decrease in the N:P ratio.
The RDA showed that the MWD was significantly positively correlated with the SOC, TN, TP, and pH, indicating that the SOC, TN, TP, and pH played an important role in promoting soil aggregate stability. SOC is regarded as an important binding agent due to its special functional group structure, which can cement with mineral particles to stabilize soil aggregate [62,63]. On the other hand, the changes in soil nutrients and pH value will regulate microbial activities and root behavior, resulting in the increase in soil biochemical mucilage, subsequently providing evidence for the stability of soil aggregate [64]. However, although much information is available on the relationship between soil aggregate stability and physicochemical factors, such as SOC, what and how physicochemical factors affect soil aggregate stability are not well understood yet. Accordingly, further investigations on aggregate stabilization mechanisms related to soil physicochemical factors are needed.

5. Conclusions

The soil aggregate distribution, stability, and nutrient content in greenhouse vegetable cultivation treated with different fertilizers were evaluated. The dominant grain size of the soil aggregate was 2 to 0.25 mm and 0.25 to 0.053 mm. Fertilization significantly increased the MWD and >0.25 mm aggregate proportion. Chemical fertilizer plus organic fertilizer (CO) treatment had the most significantly enhanced soil aggregate stability. The SOC, TN, and TP content in the 0.25 to 0.053 mm aggregate fraction was relatively high, and the SOC, TN, and TP stock in the 2 to 0.25 mm and 0.25 to 0.053 mm aggregate fractions were the primary sources of SOC, N, and P. Fertilization significantly increased the SOC, TN, and TP content in the soil aggregate, among which the CO treatment was the most significant. There was no obvious difference in the nutrient stoichiometry of the soil aggregate among the treatments. The redundancy analysis (RDA) revealed that the soil physicochemical factors, including SOC, TN, TP, and pH, significantly explained the stability of the soil aggregate. Therefore, chemical fertilizer, with organic fertilizer, can positively affect the stability and nutrient accumulation of soil aggregate in greenhouse dryland. However, the findings from this study are derived from short-term experiments, and long-term field experiments are needed in the future to consolidate these findings. The microbial change characteristics of soil aggregate should be investigated in the future to obtain more comprehensive information regarding aggregate change.

Supplementary Materials

The following supporting information can be downloaded at: https://www.mdpi.com/article/10.3390/agriculture12040440/s1, Table S1: Soil physicochemical characteristics in experimental site; Table S2: The physicochemical properties of organic fertilizer.

Author Contributions

Writing—original draft preparation, J.W.; writing—review and editing, J.W. and W.D.; conceptualization, J.W. and L.C.; validation, Z.S.; methodology, W.D. and H.G.; resources, K.F. and H.G.; funding acquisition and project administration, Z.S. and L.C. All authors have read and agreed to the published version of the manuscript.

Funding

This research was supported by the Shanghai Agriculture Applied Technology Development Program, China, grant number G20190308.

Institutional Review Board Statement

Not applicable.

Informed Consent Statement

Not applicable.

Data Availability Statement

Not applicable.

Conflicts of Interest

The authors declare no conflict of interest.

References

  1. Wang, T.Y.; Wu, G.X.; Chen, J.W.; Cui, P.; Chen, Z.X.; Yan, Y.Y.; Zhang, Y.; Li, M.C.; Niu, D.X.; Li, B.G.; et al. Integration of solar technology to modern greenhouse in China: Current status, challenges and prospect. Renew. Sustain. Energy Rev. 2017, 70, 1178–1188. [Google Scholar] [CrossRef]
  2. Peng, P.; Liang, L.; Li, H.L.; Zhao, G. Status, deficiency and development suggestions of protected agriculture in China. North. Hortic. 2019, 5, 161–168. [Google Scholar]
  3. Zhang, X.; Zhao, Y.; Zhu, L.J.; Cui, H.Y.; Jia, L.M.; Xie, X.Y.; Li, J.M.; Wei, Z.M. Assessing the use of composts from multiple sources based on the characteristics of carbon mineralization in soil. Waste Manag. 2017, 70, 30–36. [Google Scholar] [CrossRef]
  4. Dang, Q.L.; Wang, Y.; Xiong, S.G.; Yu, H.; Zhao, X.Y.; Tan, W.B.; Cui, D.Y.; Xi, B.D. Untangling the response of fungal community structure, composition and function in soil aggregate fractions to food waste compost addition. Sci. Total Environ. 2021, 769, 145248. [Google Scholar] [CrossRef]
  5. Pan, C.; Zhao, Y.; Zhao, L.; Wu, J.; Zhang, X.; Xie, X.; Kang, K.; Jia, L. Modified montmorillonite and illite adjusted the pref-erence of biotic and abiotic pathways of humus formation during chicken manure composting. Bioresour. Technol. 2021, 319, 124121. [Google Scholar] [CrossRef]
  6. Melero, S.; Porras, J.C.R.; Herencia, J.F.; Madejon, E. Chemical and biochemical properties in a silty loam soil under conventional and organic management. Soil Tillage Res. 2006, 90, 162–170. [Google Scholar] [CrossRef]
  7. Huang, S.; Zhang, W.; Yu, X. Effects of long-term fertilization on corn productivity and its sustainability in an Ultisol of southern China. Agric. Ecosyst. Environ. 2010, 138, 44–50. [Google Scholar] [CrossRef]
  8. Zhang, J.J.; Wei, Y.X.; Liu, J.Z.; Yuan, J.C.; Liang, Y.; Ren, J.; Cai, H.G. Effects of maize straw and its biochar application on organic and humic carbon in water-stable aggregates of a Mollisol in Northeast China: A five-year field experiment. Soil Tillage Res. 2019, 190, 1–9. [Google Scholar] [CrossRef]
  9. Zhang, C.; Gao, Z.; Shi, W.C.; Li, L.C.; Tian, R.M.; Huang, J.; Lin, R.S.; Wang, B.; Zhou, B. Material conversion, microbial community composition and metabolic functional succession during green soybean hull composting. Bioresour. Technol. 2020, 316, 123823. [Google Scholar] [CrossRef] [PubMed]
  10. Ye, G.P.; Banerjee, S.; He, J.Z.; Fan, J.B.; Wang, Z.H.; Wei, X.Y.; Hu, H.W.; Zheng, Y.; Duan, C.J.; Wan, S.; et al. Manure application increases microbiome complexity in soil aggregate fractions: Results of an 18-year field experiment. Agric. Ecosyst. Environ. 2021, 307, 107249. [Google Scholar] [CrossRef]
  11. Guber, A.K.; Pachepsky, Y.A.; Levkovsky, E.V. Fractal mass-size scaling of wetting soil aggregates. Ecol. Model. 2005, 182, 317–322. [Google Scholar] [CrossRef]
  12. Sarker, J.R.; Singh, B.P.; Cowie, A.L.; Fang, Y.Y.; Collins, D.; Dougherty, W.J.; Singh, B.K. Carbon and nutrient mineralisation dynamics in aggregate-size classes from different tillage systems after input of canola and wheat residues. Soil Biol. Bio-Chem. 2018, 116, 22–38. [Google Scholar] [CrossRef]
  13. Six, J.; Paustian, K. Aggregate-associated soil organic matter as an ecosystem property and a measurement tool. Soil Biol. Biochem. 2014, 68, 4–9. [Google Scholar] [CrossRef]
  14. Chai, Y.J.; Zeng, X.B.; Huang, T.; Che, Z.X.; Su, S.M.; Bai, L.Y. Response of soil organic carbon and its aggregate fractions to long-term fertilization in irrigated desert soil of China. J. Integr. Agric. 2014, 13, 2758–2767. [Google Scholar] [CrossRef]
  15. Wang, X.J.; Jia, Z.K.; Liang, L.Y.; Yang, B.P.; Ding, R.X.; Nie, J.F.; Wang, J.P. Maize straw effects on soil aggregation and other properties in arid land. Soil Tillage Res. 2015, 153, 131–136. [Google Scholar] [CrossRef]
  16. Yan, X.; Zhou, H.; Zhu, Q.H.; Wang, X.F.; Zhang, Y.Z.; Yu, X.C.; Peng, X. Carbon sequestration efficiency in paddy soil and upland soil under long-term fertilization in southern China. Soil Tillage Res. 2013, 130, 42–51. [Google Scholar] [CrossRef]
  17. Luo, G.W.; Friman, V.P.; Chen, H.; Liu, M.Q.; Wang, M.; Guo, S.W.; Ling, N.; Shen, Q.R. Long-term fertilization regimes drive the abundance and composition of N-cycling-related prokaryotic groups via soil particle-size differentiation. Soil Biol. Biochem. 2018, 116, 213–223. [Google Scholar] [CrossRef]
  18. Spohn, M.; Giani, L. Water-stable aggregates, glomalin-related soil protein, and carbohydrates in a chronosequence of sandy hydromorphic soils. Soil Biol. Biochem. 2010, 42, 1505–1511. [Google Scholar] [CrossRef]
  19. Zhong, Z.; Wu, S.; Lu, X.; Ren, Z.; Wu, Q.; Xu, M.; Ren, C.; Yang, G.; Han, X. Organic carbon, nitrogen accumulation, and soil aggregate dynamics as affected by vegetation restoration patterns in the Loess Plateau of China. Catena 2021, 196, 104867. [Google Scholar] [CrossRef]
  20. Arai, M.; Tayasu, I.; Komatsuzaki, M.; Uchida, M.; Shibata, Y.; Kaneko, N. Changes in soil aggregate carbon dynamics under no-tillage with respect to earthworm biomass revealed by radiocarbon analysis. Soil Tillage Res. 2013, 126, 42–49. [Google Scholar] [CrossRef]
  21. Yao, Y.F.; Ge, N.N.; Yu, S.; Wei, X.R.; Wang, X.; Jin, J.W.; Liu, X.T.; Shao, M.G.; Wei, Y.C.; Kang, L. Response of aggregate associated organic carbon, nitrogen and phosphorous to re-vegetation in agropastoral ecotone of northern China. Geoderma 2019, 341, 172–180. [Google Scholar] [CrossRef]
  22. Rabot, E.; Wiesmeier, M.; Schluter, S.; Vogel, H.J. Soil structure as an indicator of soil functions: A review. Geoderma 2018, 314, 122–137. [Google Scholar] [CrossRef]
  23. Kurmi, B.; Nath, A.J.; Lal, R.; Das, A.K. Water stable aggregates and the associated active and recalcitrant carbon in soil under rubber plantation. Sci. Total Environ. 2020, 703, 135498. [Google Scholar] [CrossRef] [PubMed]
  24. Hobbie, S.E. Plant species effects on nutrient cycling: Revisiting litter feedbacks. Trends Ecol. Evol. 2015, 30, 357–363. [Google Scholar] [CrossRef]
  25. Zhang, Y.; Li, P.; Liu, X.J.; Xiao, L.; Shi, P.; Zhao, B.H. Effects of farmland conversion on the stoichiometry of carbon, nitrogen, and phosphorus in soil aggregates on the Loess Plateau of China. Geoderma 2019, 351, 188–196. [Google Scholar] [CrossRef]
  26. Li, Y.F.; Liang, S.; Zhao, Y.Y.; Li, W.B.; Wang, Y.J. Machine learning for the prediction of L-chinensis carbon, nitrogen and phosphorus contents and understanding of mechanisms underlying grassland degradation. J. Environ. Manag. 2017, 192, 116–123. [Google Scholar] [CrossRef]
  27. Guo, X.; Jiang, Y.F. Spatial characteristics of ecological stoichiometry and their driving factors in farmland soils in Poyang Lake Plain, Southeast China. J. Soils Sediments 2019, 19, 263–274. [Google Scholar] [CrossRef]
  28. Niu, S.; Ren, L.; Song, L.; Duan, Y.; Hao, W. Plant stoichiometry characteristics and relationships with soil nutrients in robin-ia pseudoacacia communities of different planting ages. Acta Ecol. Sin. 2017, 37, 355–362. [Google Scholar] [CrossRef]
  29. Kirkby, C.A.; Richardson, A.E.; Wade, L.J.; Batten, G.D.; Kirkegaard, J.A. Carbon-nutrient stoichiometry to increase soil carbon sequestration. Soil Biol. Biochem. 2013, 60, 77–86. [Google Scholar] [CrossRef]
  30. Liu, D.D.; Ju, W.L.; Jin, X.L.; Li, M.D.; Shen, G.T.; Duan, C.J.; Guo, L.; Liu, Y.Y.; Zhao, W.; Fang, L.C. Associated soil aggregate nutrients and controlling factors on aggregate stability in semiarid grassland under different grazing prohibition timeframes. Sci. Total Environ. 2021, 777, 146104. [Google Scholar] [CrossRef]
  31. Xu, C.H.; Xiang, W.H.; Gou, M.M.; Chen, L.; Lei, P.F.; Fang, X.; Deng, X.W.; Ouyang, S. Effects of forest restoration on soil carbon, nitrogen, phosphorus, and their stoichiometry in Hunan, Southern China. Sustainability 2018, 10, 1874. [Google Scholar] [CrossRef] [Green Version]
  32. Hui, D.F.; Yang, X.T.; Deng, Q.; Liu, Q.; Wang, X.; Yang, H.; Ren, H. Soil C:N:P stoichiometry in tropical forests on Hainan Island of China: Spatial and vertical variations. Catena 2021, 201, 105228. [Google Scholar] [CrossRef]
  33. Elser, J.J.; Fagan, W.F.; Kerkhoff, A.J.; Swenson, N.G.; Enquist, B.J. Biological stoichiometry of plant production: Metabolism, scaling and ecological response to global change. New Phytol. 2010, 186, 593–608. [Google Scholar] [CrossRef] [PubMed] [Green Version]
  34. Yang, Y.; Liu, B.R.; An, S.S. Ecological stoichiometry in leaves, roots, litters and soil among different plant communities in a desertified region of Northern China. Catena 2018, 166, 328–338. [Google Scholar] [CrossRef]
  35. Li, Y.S.; Xie, Z.H.; Yu, Z.H.; Wang, Y.H.; Liu, C.K.; Wang, G.H.; Wu, J.J.; Jin, J.; Liu, X.B. Impact of surface soil manuring on particulate carbon fractions in relevant to nutrient stoichiometry in a Mollisol profile. Soil Tillage Res. 2021, 207, 104859. [Google Scholar] [CrossRef]
  36. Elliott, E.T. Aggregate structure and carbon, nitrogen, and phosphorus in native and cultivated soils1. Soil Sci. Soc. Am. J. 1986, 50, 627–633. [Google Scholar] [CrossRef]
  37. Bao, S.D. Soil and Agricultural Chemistry Analysis; China Agriculture Press: Beijing, China, 2000. [Google Scholar]
  38. Fan, J.L.; Ding, W.X.; Xiang, J.; Qin, S.W.; Zhang, J.B.; Ziadi, N. Carbon sequestration in an intensively cultivated sandy loam soil in the North China Plain as affected by compost and inorganic fertilizer application. Geoderma 2014, 230, 22–28. [Google Scholar] [CrossRef]
  39. Xie, J.; Peng, B.; Wang, R.; Batbayar, J.; Hoogmoed, M.; Yang, Y.; Zhang, S.; Yang, X.; Sun, B. Responses of crop productivity and physical protection of organic carbon by macroaggregates to long-term fertilization of an Anthrosol. Eur. J. Soil Sci. 2018, 69, 555–567. [Google Scholar] [CrossRef]
  40. Malhi, S.S.; Nyborg, M.; Goddard, T.; Puurveen, D. Long-term tillage, straw management, and nitrogen fertilization effects on organic matter and mineralizable carbon and nitrogen in a black chernozem soil. Commun. Soil Sci. Plant Anal. 2012, 43, 2679–2690. [Google Scholar] [CrossRef]
  41. Cheng, M.; Xiang, Y.; Xue, Z.J.; An, S.S.; Darboux, F. Soil aggregation and intra-aggregate carbon fractions in relation to vegetation succession on the Loess Plateau, China. Catena 2015, 124, 77–84. [Google Scholar] [CrossRef]
  42. Six, J.; Elliott, E.T.; Paustian, K. Aggregate and soil organic matter dynamics under conventional and no-tillage systems. Soil Sci. Soc. Am. J. 1999, 63, 1350–1358. [Google Scholar] [CrossRef] [Green Version]
  43. Six, J.; Elliott, E.T.; Paustian, K. Soil macroaggregate turnover and microaggregate formation: A mechanism for C sequestration under no-tillage agriculture. Soil Biol. Biochem. 2000, 32, 2099–2103. [Google Scholar] [CrossRef]
  44. Zhao, J.S.; Chen, S.; Hu, R.G.; Li, Y.Y. Aggregate stability and size distribution of red soils under different land uses integrally regulated by soil organic matter, and iron and aluminum oxides. Soil Tillage Res. 2017, 167, 73–79. [Google Scholar] [CrossRef] [Green Version]
  45. Yu, H.Y.; Ding, W.X.; Luo, J.F.; Geng, R.L.; Cai, Z.C. Long-term application of organic manure and mineral fertilizers on aggregation and aggregate-associated carbon in a sandy loam soil. Soil Tillage Res. 2012, 124, 170–177. [Google Scholar] [CrossRef]
  46. Chen, E.F.; Zhou, L.K.; Chen, L.J.; Li, R.H. Compositional proportion of soil characteristic microaggregates and soil fertility evaluation. Acta Pedol. Sin. 2001, 38, 49–53. [Google Scholar]
  47. Zhang, X.F.; Xin, X.L.; Zhu, A.N.; Zhang, J.B.; Yang, W.H. Effects of tillage and residue managements on organic C accumulation and soil aggregation in a sandy loam soil of the North China Plain. Catena 2017, 156, 176–183. [Google Scholar] [CrossRef]
  48. Qu, Q.; Xu, H.W.; Wu, X. Soil aggregate stability and its stoichiometric characteristics in robinia pseudoacacia forest within different vegetation zones on the Loess Plateau, China. Environ. Sci. 2019, 40, 2904–2911. [Google Scholar]
  49. Pan, J.; Liu, Y.Q.; Liu, X.J.; Gao, P.; Bai, T.J.; Cao, W.; Xie, J.Y.; Liu, C.M.; Yuan, X.Y. Distribution and stoichiometry of water-stable aggregates of different vegetation restoration patterns in degraded red soil regions. J. Soil Water Conserv. 2019, 33, 190–198. [Google Scholar]
  50. Xie, J.Y.; Hou, M.M.; Zhou, Y.T.; Wang, R.J.; Zhang, S.L.; Yang, X.Y.; Sun, B.H. Carbon sequestration and mineralization of aggregate-associated carbon in an intensively cultivated Anthrosol in north China as affected by long term fertilization. Ge-oderma 2017, 296, 1–9. [Google Scholar] [CrossRef]
  51. Dai, W.; Wang, J.; Fang, K.; Cao, L.; Sha, Z.; Cao, L. Wheat straw incorporation affecting soil carbon and nitrogen fractions in Chinese paddy soil. Agriculture 2021, 11, 803. [Google Scholar] [CrossRef]
  52. Craswell, E.T.; Saffigna, P.G.; Waring, S.A. The mineralization of organic nitrogen in dry soil aggregates of different sizes. Plant Soil 1970, 33, 383–392. [Google Scholar] [CrossRef]
  53. Khan, S.A.; Mulvaney, R.L.; Ellsworth, T.R.; Boast, C.W. The myth of nitrogen fertilization for soil carbon sequestration. J. Environ. Qual. 2007, 36, 1821–1832. [Google Scholar] [CrossRef] [PubMed] [Green Version]
  54. Wang, S.Q.; Yu, G.R. Ecological stoichiometry characteristics of ecosystem carbon, nitrogen and phosphorus elements. Acta Ecol. Sin. 2008, 8, 3937–3947. [Google Scholar]
  55. Manjaiah, K.M.; Voroney, R.P.; Sen, U. Soil organic carbon stocks, storage profile and microbial biomass under different crop management systems in a tropical agricultural ecosystem. Biol. Fertil. Soils 2000, 32, 273–278. [Google Scholar] [CrossRef]
  56. Zhang, J.; Liu, Y.; Zheng, T.; Zhao, X.; Liu, H.; Zhang, Y. Nutrient and stoichiometric characteristics of aggregates in a sloping farmland area under different tillage practices. Sustainability 2021, 13, 890. [Google Scholar] [CrossRef]
  57. Ma, R.T.; Hu, F.N.; Liu, J.F.; Wang, C.L.; Wang, Z.L.; Liu, G.; Zhao, S.W. Shifts in soil nutrient concentrations and C:N:P stoichiometry during long-term natural vegetation restoration. PeerJ 2020, 8, e8382. [Google Scholar] [CrossRef] [PubMed]
  58. Cleveland, C.C.; Liptzin, D. C:N:P stoichiometry in soil: Is there a “Redfield ratio” for the microbial biomass? Biogeochemistry 2007, 85, 235–252. [Google Scholar] [CrossRef]
  59. Zeng, Q.C.; Xin, L.I.; Dong, Y.H.; Ya-Yun, L.I.; Cheng, M.; Shao-Shan, A.N. Ecological stoichiometry characteristics and physical-chemical properties of soils at different latitudes on the loess plateau. J. Nat. Resour. 2015, 30, 870–879. [Google Scholar]
  60. Wang, L.; Wang, P.; Sheng, M.; Tian, J. Ecological stoichiometry and environmental influencing factors of soil nutrients in the karst rocky desertification ecosystem, southwest China. Glob. Ecol. Conserv. 2018, 16, e00449. [Google Scholar] [CrossRef]
  61. Bai, Y.T.; Wei, Z.J.; Dai, J.; Dai, J.Z.; Yan, R.R.; Liu, W.T.; Wang, T.L. Responses of plant and soil C:N:P stoichiometry to ferti-lization in Leymus chinensis mowing meadow. Ecol. Environ. Sci. 2017, 26, 620–627. [Google Scholar]
  62. Peltre, C.; Bruun, S.; Du, C.; Thomsen, I.K.; Jensen, L.S. Assessing soil constituents and labile soil organic carbon by mid-infrared photoacoustic spectroscopy. Soil Biol. Biochem. 2014, 77, 41–50. [Google Scholar] [CrossRef]
  63. Mizuta, K.; Taguchi, S.; Sato, S. Soil aggregate formation and stability induced by starch and cellulose. Soil Biol. Biochem. 2015, 87, 90–96. [Google Scholar] [CrossRef]
  64. Güsewell, S.; Gessner, M.O. N:P ratios influence litter decomposition and colonization by fungi and bacteria in microcosms. Funct. Ecol. 2009, 23, 211–219. [Google Scholar] [CrossRef]
Figure 1. Soil aggregate distribution (a); mean weight diameter of aggregate (b) under different fertilization treatments. (a) Different lowercase letters show significant differences between treatments for the same aggregate size (p < 0.05), while different uppercase letters indicate significant differences of >0.25 mm fraction proportion among fertilization treatments (p < 0.05). (b) Different uppercase letters indicate significant differences among fertilization treatments (p < 0.05). Values are means ± SE (n = 3). CK, no fertilizer; CF, chemical fertilizer; OF, organic fertilizer; CO, chemical fertilizer (50% N) plus organic fertilizer (50% N).
Agriculture 12 00440 g001
Figure 2. The content of SOC (a), TN (b), and TP (c) in soil aggregate following different treatments. Different uppercase letters indicate significant differences in aggregate fraction within the same treatment (p < 0.05), and different lowercase letters indicate significant differences between different treatments within the same aggregate fraction (p < 0.05). CK, no fertilizer; CF, chemical fertilizer; OF, organic fertilizer; CO, chemical fertilizer (50% N) plus organic fertilizer (50% N).
Agriculture 12 00440 g002
Figure 3. The stock of SOC (a), TN (b), and TP (c) in soil aggregate following different treatments. Different uppercase letters indicate significant differences in aggregate fraction within the same treatment (p < 0.05), and different lowercase letters indicate significant differences between different treatments within the same aggregate fraction (p < 0.05). CK, no fertilizer; CF, chemical fertilizer; OF, organic fertilizer; CO, chemical fertilizer (50% N) plus organic fertilizer (50% N).
Agriculture 12 00440 g003
Figure 4. Ecological stoichiometric characteristics of soil aggregate under different fertilization treatments. (a) C:N (SOC/TN); (b) C:P (SOC/TP); (c) N:P (TN/TP). Different uppercase letters indicate significant differences in aggregate fraction within the same treatment (p < 0.05), and different lowercase letters indicate significant differences between different treatments within the same aggregate fraction (p < 0.05). CK, no fertilizer; CF, chemical fertilizer; OF, organic fertilizer; CO, chemical fertilizer (50% N) plus organic fertilizer (50% N).
Agriculture 12 00440 g004
Figure 5. Correlation analysis between nutrients and stoichiometry in soil aggregate. (a) >2 mm; (b) 2–0.25 mm; (c) 0.25–0.053 mm; (d) <0.053 mm. Red circles represent positive correlation and blue circles represent negative correlation. The size of the circle is proportional to the r value. *, p < 0.05; **, p < 0.01. The correlation coefficients are in the lower left panel. C (SOC); N (TN); P (TP); C:N (SOC/TN); C:P (SOC/TP); N:P (TN/TP).
Agriculture 12 00440 g005
Figure 6. Redundancy analysis (RDA) between MWD and soil physicochemical factors. MWD: mean weight diameter. Soil physicochemical factors include SOC (soil organic carbon), TN (total nitrogen), TP (total phosphorus), C:N (SOC/TN), C:P (SOC/TP), N:P (TN/TP), pH, and BD (bulk density).
Agriculture 12 00440 g006
Table 1. Fertilizer application rate of each treatment.
TreatmentsChemical Fertilizer (kg ha−1)Organic Fertilizer (kg ha−1)
N P2O5 K2O
CK0000
CF4501801800
OF00019,500
CO2251801809750
CK, no fertilizer; CF, chemical fertilizer; OF, organic fertilizer; CO, chemical fertilizer (50% N) plus organic fertilizer (50% N).
Publisher’s Note: MDPI stays neutral with regard to jurisdictional claims in published maps and institutional affiliations.

