Article

Self-Sufficiency Assessment: Defining the Foodshed Spatial Signature of Supply Chains for Beef in Avignon, France

1
French National Institute for Research on Agriculture, Food and Environment (INRAE), UR-Ecodéveloppement, 228 route de l’aérodrome CS 40509, CEDEX 9, 84914 Avignon, France
2
Leibniz Centre for Agricultural Landscape Research (ZALF), Eberswalder Str. 84, 15374 Müncheberg, Germany
3
UMR ESPACE 7300, French National Centre for Scientific Research (CNRS), Campus Hannah Arendt, Avignon University, 74 Rue Louis Pasteur, 84029 Avignon, France
*
Author to whom correspondence should be addressed.
Agriculture 2022, 12(3), 419; https://doi.org/10.3390/agriculture12030419
Submission received: 14 February 2022 / Revised: 9 March 2022 / Accepted: 11 March 2022 / Published: 16 March 2022
(This article belongs to the Special Issue Reconnecting People with Nature through Agriculture)

Abstract

:
Foodshed approaches allow for the assessment of the theoretical food self-sufficiency capacity of a specific region based on biophysical conditions. Recent analyses show that the focus needs to be shifted from foodshed size portrayed as an isotropic circle to a commodity–group-specific spatial configuration of the foodshed that takes into account the socio-economic and biophysical conditions essential to the development of local food supply chains. We focused on a specific animal product (beef) and used an innovative modeling approach based on spatial analysis to detect the areas of the foodshed dedicated to beef feeding (forage, pasture, and grassland), considering the foodshed as a complex of complementary areas called an archipelago. We used available statistical data including a census to address the city-region of Avignon, France covering a 100 km radius. Our results showed that the factors driving the use of short supply chains for beef feeding areas are the foodshed archipelago’s number of patches, the connectivity between them, and the rugosity of the boundaries. In addition, our beef self-sufficiency assessment results differ depending on geographical context. For instance, being located within the perimeters of a nature park seems to help orient beef production toward short supply chains. We discuss possible leverage for public action to reconnect beef production areas to consumption areas (the city) via short supply chains (e.g., green, home-grown school food programs) to increase local food security through increased local food self-sufficiency.

1. Introduction

Food supply chains are vulnerable to social and economic risks and to natural hazards, as illustrated by the COVID-19 crisis. This is especially true in urban areas, which largely rely on food imported from the global market [1]. In fact, the population of urban areas has exceeded that of rural areas since 2008, and this proportion is expected to increase to 66% by 2050 [2]. Each disruption in global food supply chains has become a social and political issue, prompting a focus on the relocalization of food supply and regionalization of food systems [3]. However, peri-urban agricultural areas are not homogenous, and not every farming system is able to respond to local food demand in terms of foodstuff diversity or quantities [4,5,6]. In addition, geo-physical spatial heterogeneity means that soils differ in their suitability for agriculture. However, there are few tools available to inform public policies aimed at supporting the regionalization of food systems, particularly to identify the farmland areas where farmers can best respond to incentives.
Current research is highlighting foodshed approaches as a way of identifying the farmland areas functionally linked to cities that could be involved in new short food supply chains [7]. In this paper, we first briefly sketch the state-of-the-art concerning the notion of foodshed. Then, we describe a study case in southern France to which we applied a foodshed approach to analyze beef supply chains using a new methodology. Our method was based on spatial metrics grounded in theories of landscape ecology and on proximity relations in regional development processes. Finally, we present our results and discuss their implications for further research on the regionalization of food systems.

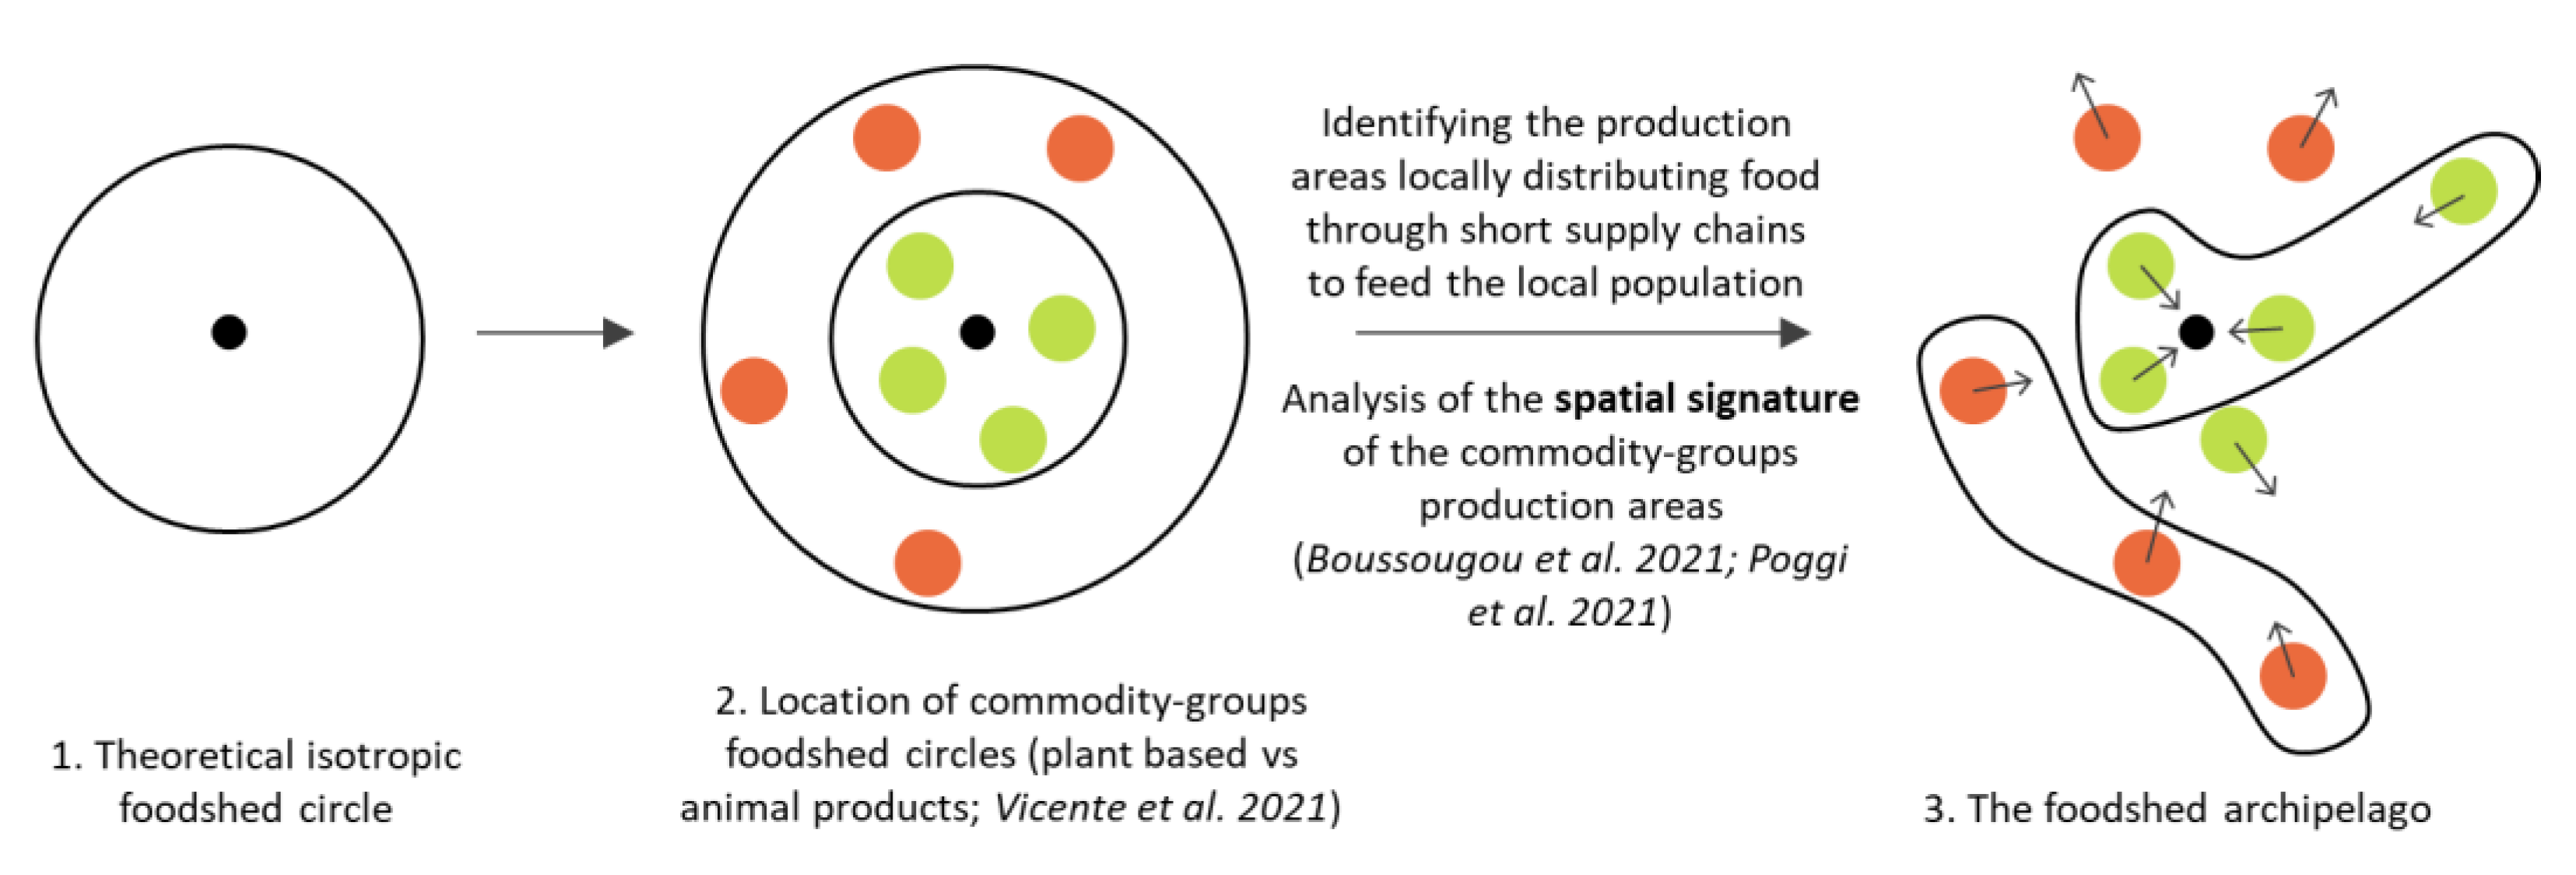
1.1. Foodshed Approaches

The notion of “foodshed” was first used by W. Hedden in 1929 in the book How Great Cities are Fed to describe “the geographic area from which food arrives in a community including the rural and urban farmlands, processing and distribution facilities, transportation systems, wholesalers, and retailers that make up a region’s food system” [8]. In October 1921, a planned nationwide railway strike threatened New York with the danger of interrupted food supplies to a large city dependent on distant food sources and the loss of nearby farmland to the suburbs. This prompted Walter P. Hedden, Head of the Port Authority of New York’s Bureau of Commerce, to write a comprehensive assessment of the city’s food supply. Hedden mapped food flows from different locations in the United States, looked at criteria such as seasonality or the origin of food, and studied the logistical infrastructure (rail lines, cooling and storage facilities, distribution centers, and food shops). In 1996, the term ‘foodshed analysis’ was proposed to inform policy decisions on local food sufficiency or insufficiency [9]. Foodshed analysis can be seen as a comprehensive approach to improving the sustainability of regional food systems [10]. For instance, by determining the potential and risks for agricultural production capacity from the analysis of bioclimatic variables (climate, soil type resources) [11], by assessing the environmental impact and vulnerability of local food systems depending on food origin [12], or by examining whether shortening food supply chains can help maintain agriculture close to urban areas [13].
In this paper, we defined the term “foodshed” as the geographical area in which food is grown to satisfy the food needs of a population from its own domestic production. The foodshed approaches vary depending on the scale of the analysis and the objective: to assess whether total local food demand can be met by local production capacity [14,15], or to assess the production capacity required to meet local food demand [16]. The foodshed approach has also been used to estimate the size of the foodshed required to meet a given rate of food self-sufficiency, taking into account different food system scenarios in terms of food groups, food production systems (conventional versus organic), diets, and levels of food loss and waste (e.g., the Metropolitan Foodshed and Self-sufficiency Scenario: MFSS; [17]). Thus, in addition to food production capacity based on biophysical conditions, our recent work considered socioeconomic features driving the flows and distribution networks of locally-grown food [7]. Our findings showed that analysis needs to be shifted from size assessment of the foodshed represented as an isotropic circle around the city to commodity–group-specific spatial configuration of the foodshed [7].
The aim of the present study was to explore foodshed assessment as a complex of complementary entities (i.e., the “foodshed archipelago”). To this end, we developed a framework grounded in landscape ecology, namely the island biogeography theory, the continent-island model theory, and the connectivity theory. In other words, we assumed that the foodshed is a set of specific food production areas containing patches of different sizes, spatially interconnected or not (i.e., the archipelago). The purpose of this foodshed is to distribute food through short supply chains to feed the local population. In this study, we focused on the landscape structure of the entities composing the foodshed archipelago. To test our hypothesis, we analyzed the beef foodshed of a study case located in Avignon, France. We intentionally focused on animal origin food products, which are little present in Mediterranean city surroundings such as Avignon, due to the prevailing pedo-climatic conditions (water and grassland scarcity). Our objective was to determine whether this beef foodshed archipelago had a specific spatial signature, different to that of beef production areas serving long supply chains. By “spatial signature”, we mean particular spatial structures whose arrangement is identifiable in space, resulting in a set of common characteristics such as crop plot shape, location of farmstead, border relationship between farming and urban zones, etc. [5,6,18].

1.2. Foodshed Analysis Based on Landscape Ecology and Proximity Theories

Our analytical framework is grounded in theories of landscape ecology and based on the proximity relations pertaining to regional development processes. The first landscape theory behind our work is the continent-island model theory, which maintains that a local habitat, called a “source,” provides individuals to other local habitats, called a “sink” [19]. Within this interplay of colonization and extinction, any habitat can be both “source” and “sink” [20]. Following this approach, we considered a “sink” located in Avignon, which can be portrayed as a large patch requiring resources (beef supply). The “sources” are the other patches, an assembly of pastoral and grassland areas within a radius of 100 km around Avignon. The assembled sources configure the foodshed archipelago.
Second, our analysis of the way they are assembled was based on the connectivity theory. Here, pastoral areas and grasslands are considered as spatial objects or “patches” that are heterogeneous in terms of size and shape. Their actual geographical distribution (i.e., density) is not homogeneous. In general, neighboring patches or adjacent plots are more likely to be connected to each other than an isolated plot. Landscape connectivity is thus defined as the degree to which the landscape facilitates or impedes movement between resource patches [21]. This definition highlights the impacts that the type, quantity, and arrangement of habitat or land use have on movement, and ultimately population dynamics and community structure. Landscape connectivity therefore describes both the physical structure of the landscape and the response of an organism to that structure [22].
From the perspective of the economic geography theory of proximity relations, short food supply chains can only be structured if the three dimensions of proximity are respected, namely, geographical proximity (i.e., distance), organized proximity (i.e., the different ways of being close to other stakeholders, referring to the arranged nature of human activities), and institutional proximity (i.e., the political dimension or adherence to a space that is defined by common rules of action, representations, thought patterns) [23,24]. Our aim here is to define the spatial signature of the beef production areas serving short supply chains in terms of the three dimensions of proximity. We analyzed an empirical case study in the Avignon foodshed using a 4-step methodology. Geographical proximity is measured by distance to the slaughterhouses (cf. 2.4.1.). Organized proximity is considered through geographical proximity and under an analytical framework inspired by landscape ecology, measuring the rugosity of the contours of beef production areas (cf. 2.4.2.) and dominance (cf. 2.4.3.) to account for the territorial embeddedness of these farms [25,26,27]. Finally, institutional proximity is considered according to whether or not the beef production areas lie within the perimeter of a regional or national nature park (cf. 2.4.4.).

2. Materials and Methods
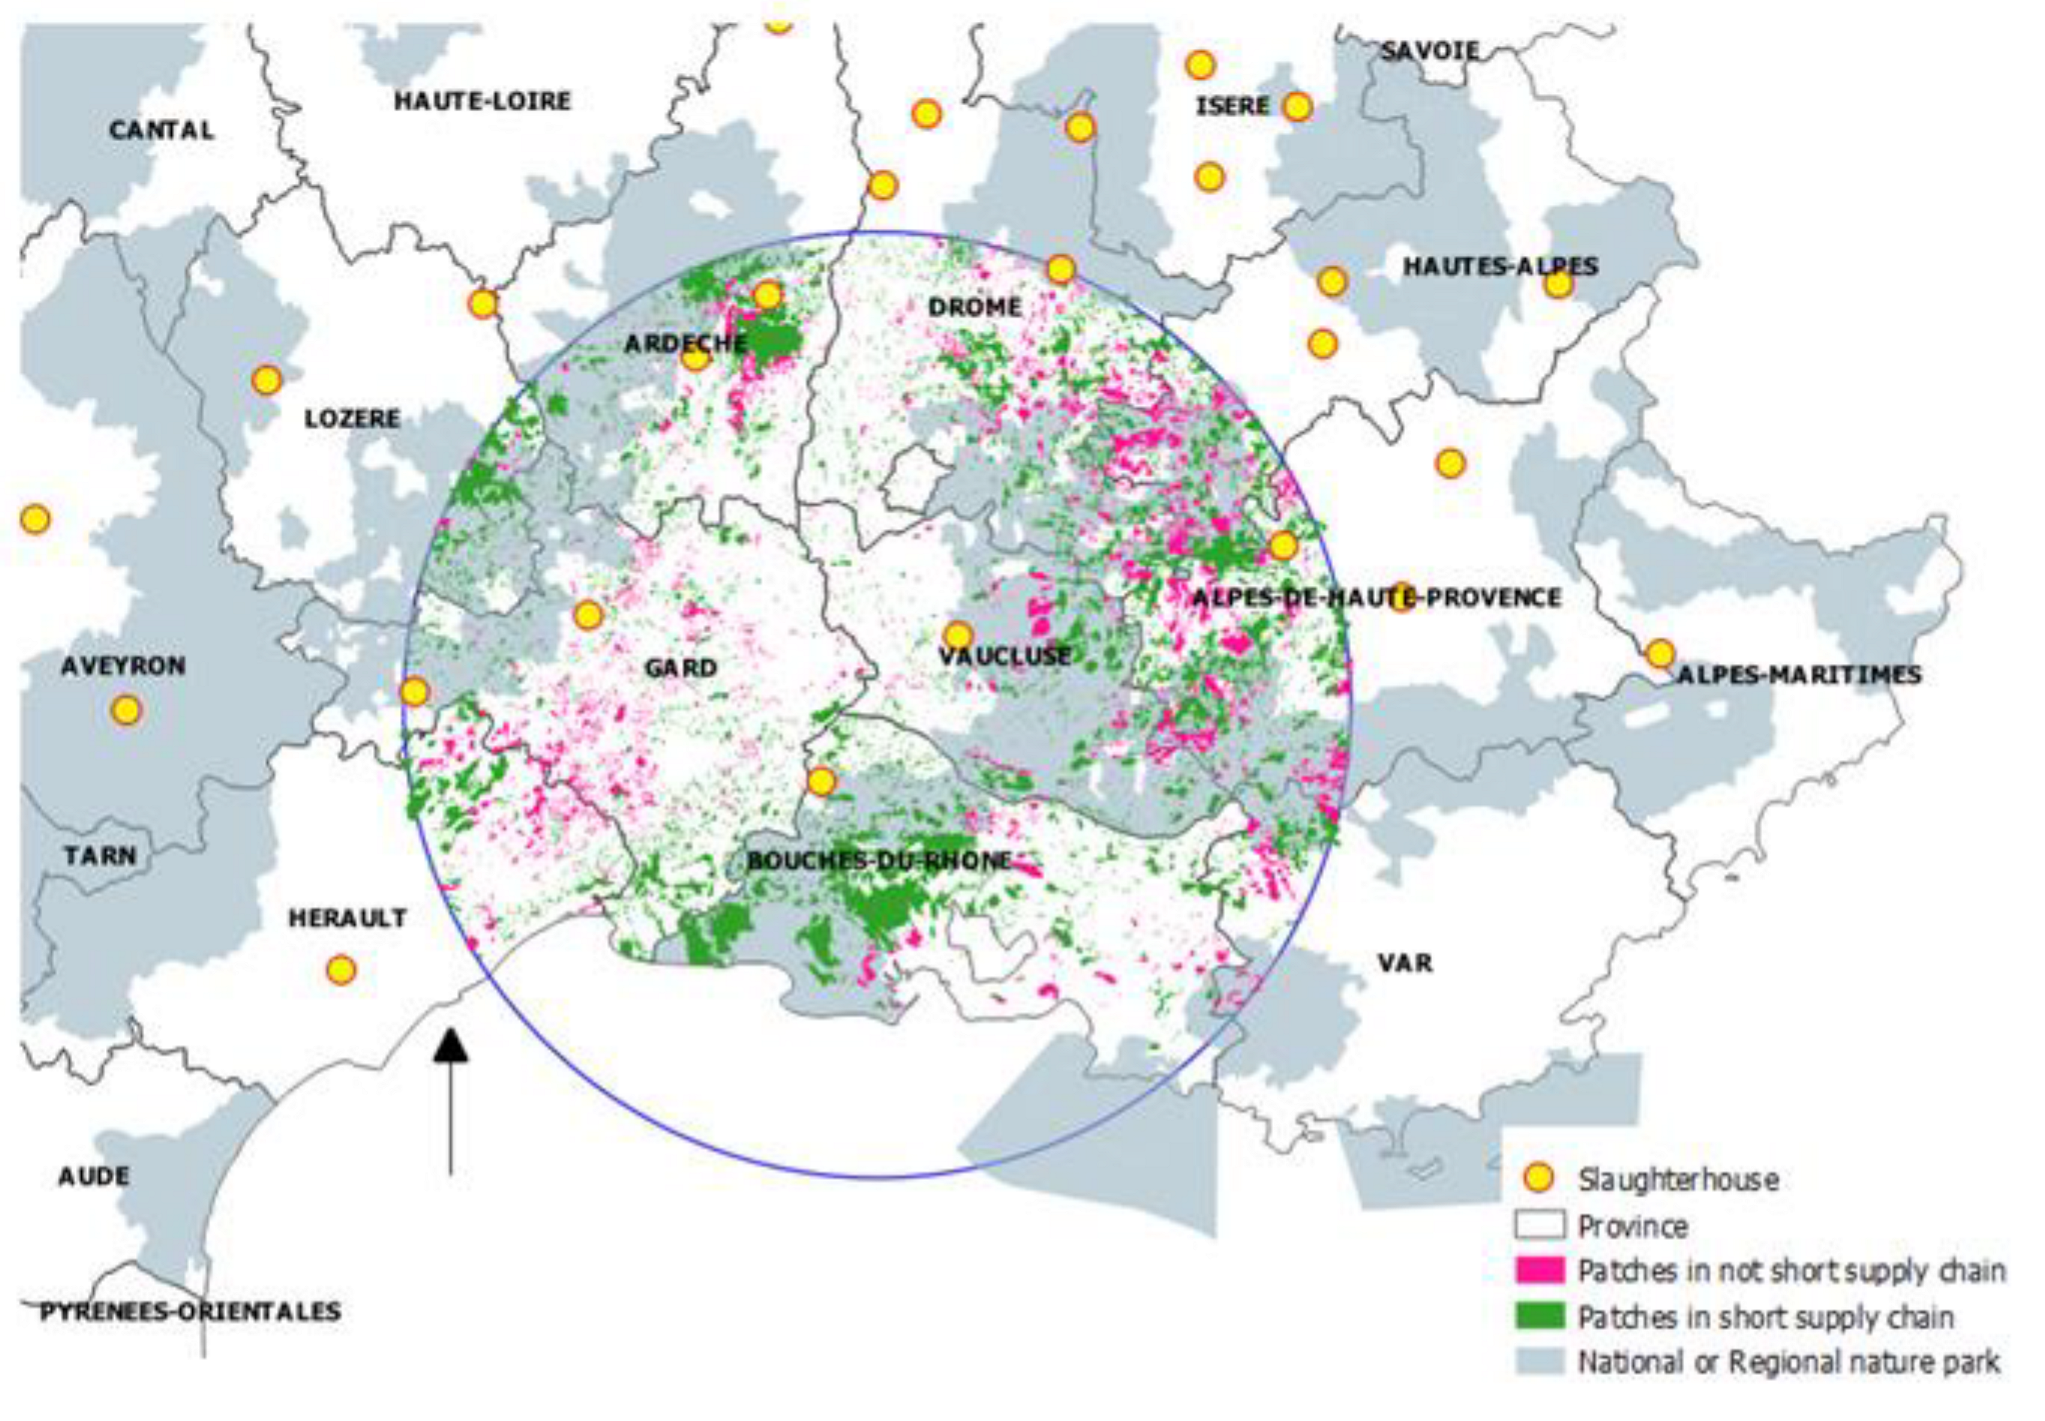
2.1. Study Area

Following previous work to assess the link between agricultural diversification and self-sufficiency on the Avignon foodshed [7], we defined a radius of 100 km around Avignon, which is a medium-sized city located in south-eastern France. The selected area incorporates three different administrative regions and ten different provinces: Bouches-du-Rhône, Vaucluse, Var, Hautes Alpes in the Provence-Alpes-Côte d’Azur region, Gard, Hérault, Lozère in the Occitanie region, and Ardèche and Drome in the Auvergne-Rhone-Alpes region. It numbers 1358 communes including 738 municipalities containing at least one beef farm selling part of its production in short supply chains. The Avignon peri-urban area is a fertile plain that has historically benefited from irrigation and transport infrastructure, fostering market gardening, fruit growing, and viticulture. More recently, part of Avignon’s agriculture has also turned to large-scale cash crops (cereal and lavender). There is a predominance of municipalities specialized in wine-growing in our study area, seeming to form a structured arc along the Rhône, in the Vaucluse, Gard, and Bouches-du-Rhône. In fact, viticulture is a strongly supported and structured sector [28]. Only by moving away from the Avignon conurbation and the arc formed by the wine-growing communes can substantial areas potentially suitable for the grassland and pastoralism linked to beef production be found. They are overwhelmingly concentrated in the north of our study area on the Plateau de Coiron (Ardèche), Lozère, and the Monts de Vaucluse (Vaucluse and Alpes de Haute-Provence).
Beef production in this region of France is based uniquely on extensive grazing systems. The basis of the animals’ food is the valorization of spontaneous grass (mountain pastures) and cultivated grass (permanent or temporary). There are no intensive production systems based on importing feeder cattle into feedlots and confining animals in a stall system. Concerning the commercial orientation of the production, farms can either serve short supply chains (SSC) or long supply chains (LSC) (Figure 1). Indeed, many farms supply local slaughterhouses that have existed for a long time and 30% of them sell directly to the consumer. On the other hand, some farms sell live cattle to a livestock trader who will sell beef abroad (e.g., to supermarkets) or export live young cattle to Italian finishers/feedlots where the animals do not return to France [29,30].
Finally, there is also extensive cattle breeding in the municipalities of Camargue and Crau located in the south of the study area. However, these communes specialize in rearing herds of Camargue races for recreational purposes (e.g., bullfighting festivals). They did not focus on food production, so their analysis was discussed (cf. 4.1.) with regard to this specific context.

2.2. Materials Used to Identify Beef Production Areas

To spatially identify grasslands and pastoral areas, we used the 2018 plot identification system (LPIS) graphically represented in the French Registre Parcellaire Graphique, which geolocates and informs on areas under different EU Common Agricultural Policy (CAP) aid schemes. This is a very accurate vectoral data source that relies on the farmers’ own hand-drawn outlines of their cultivated plots submitted when applying for CAP subsidies. We selected three categories of land used for beef feeding: mountain pastures and moors, permanent grasslands, and temporary grasslands (Table 1).
After aggregating these land-use categories, we considered patches as potentially serving short supply chains if they fell within the administrative boundary of municipalities with at least one beef farm partly selling through short supply chains, according to the 2010 general agricultural census (source https://www.agreste.agriculture.gouv.fr, accessed on 14 March 2022) at the municipal level. We analyzed patch connection using the “dilation/erosion” method described below. Other sources of complementary data used were the location of slaughterhouses [29,31,32] and the environmental protection perimeters of national and regional nature parks.

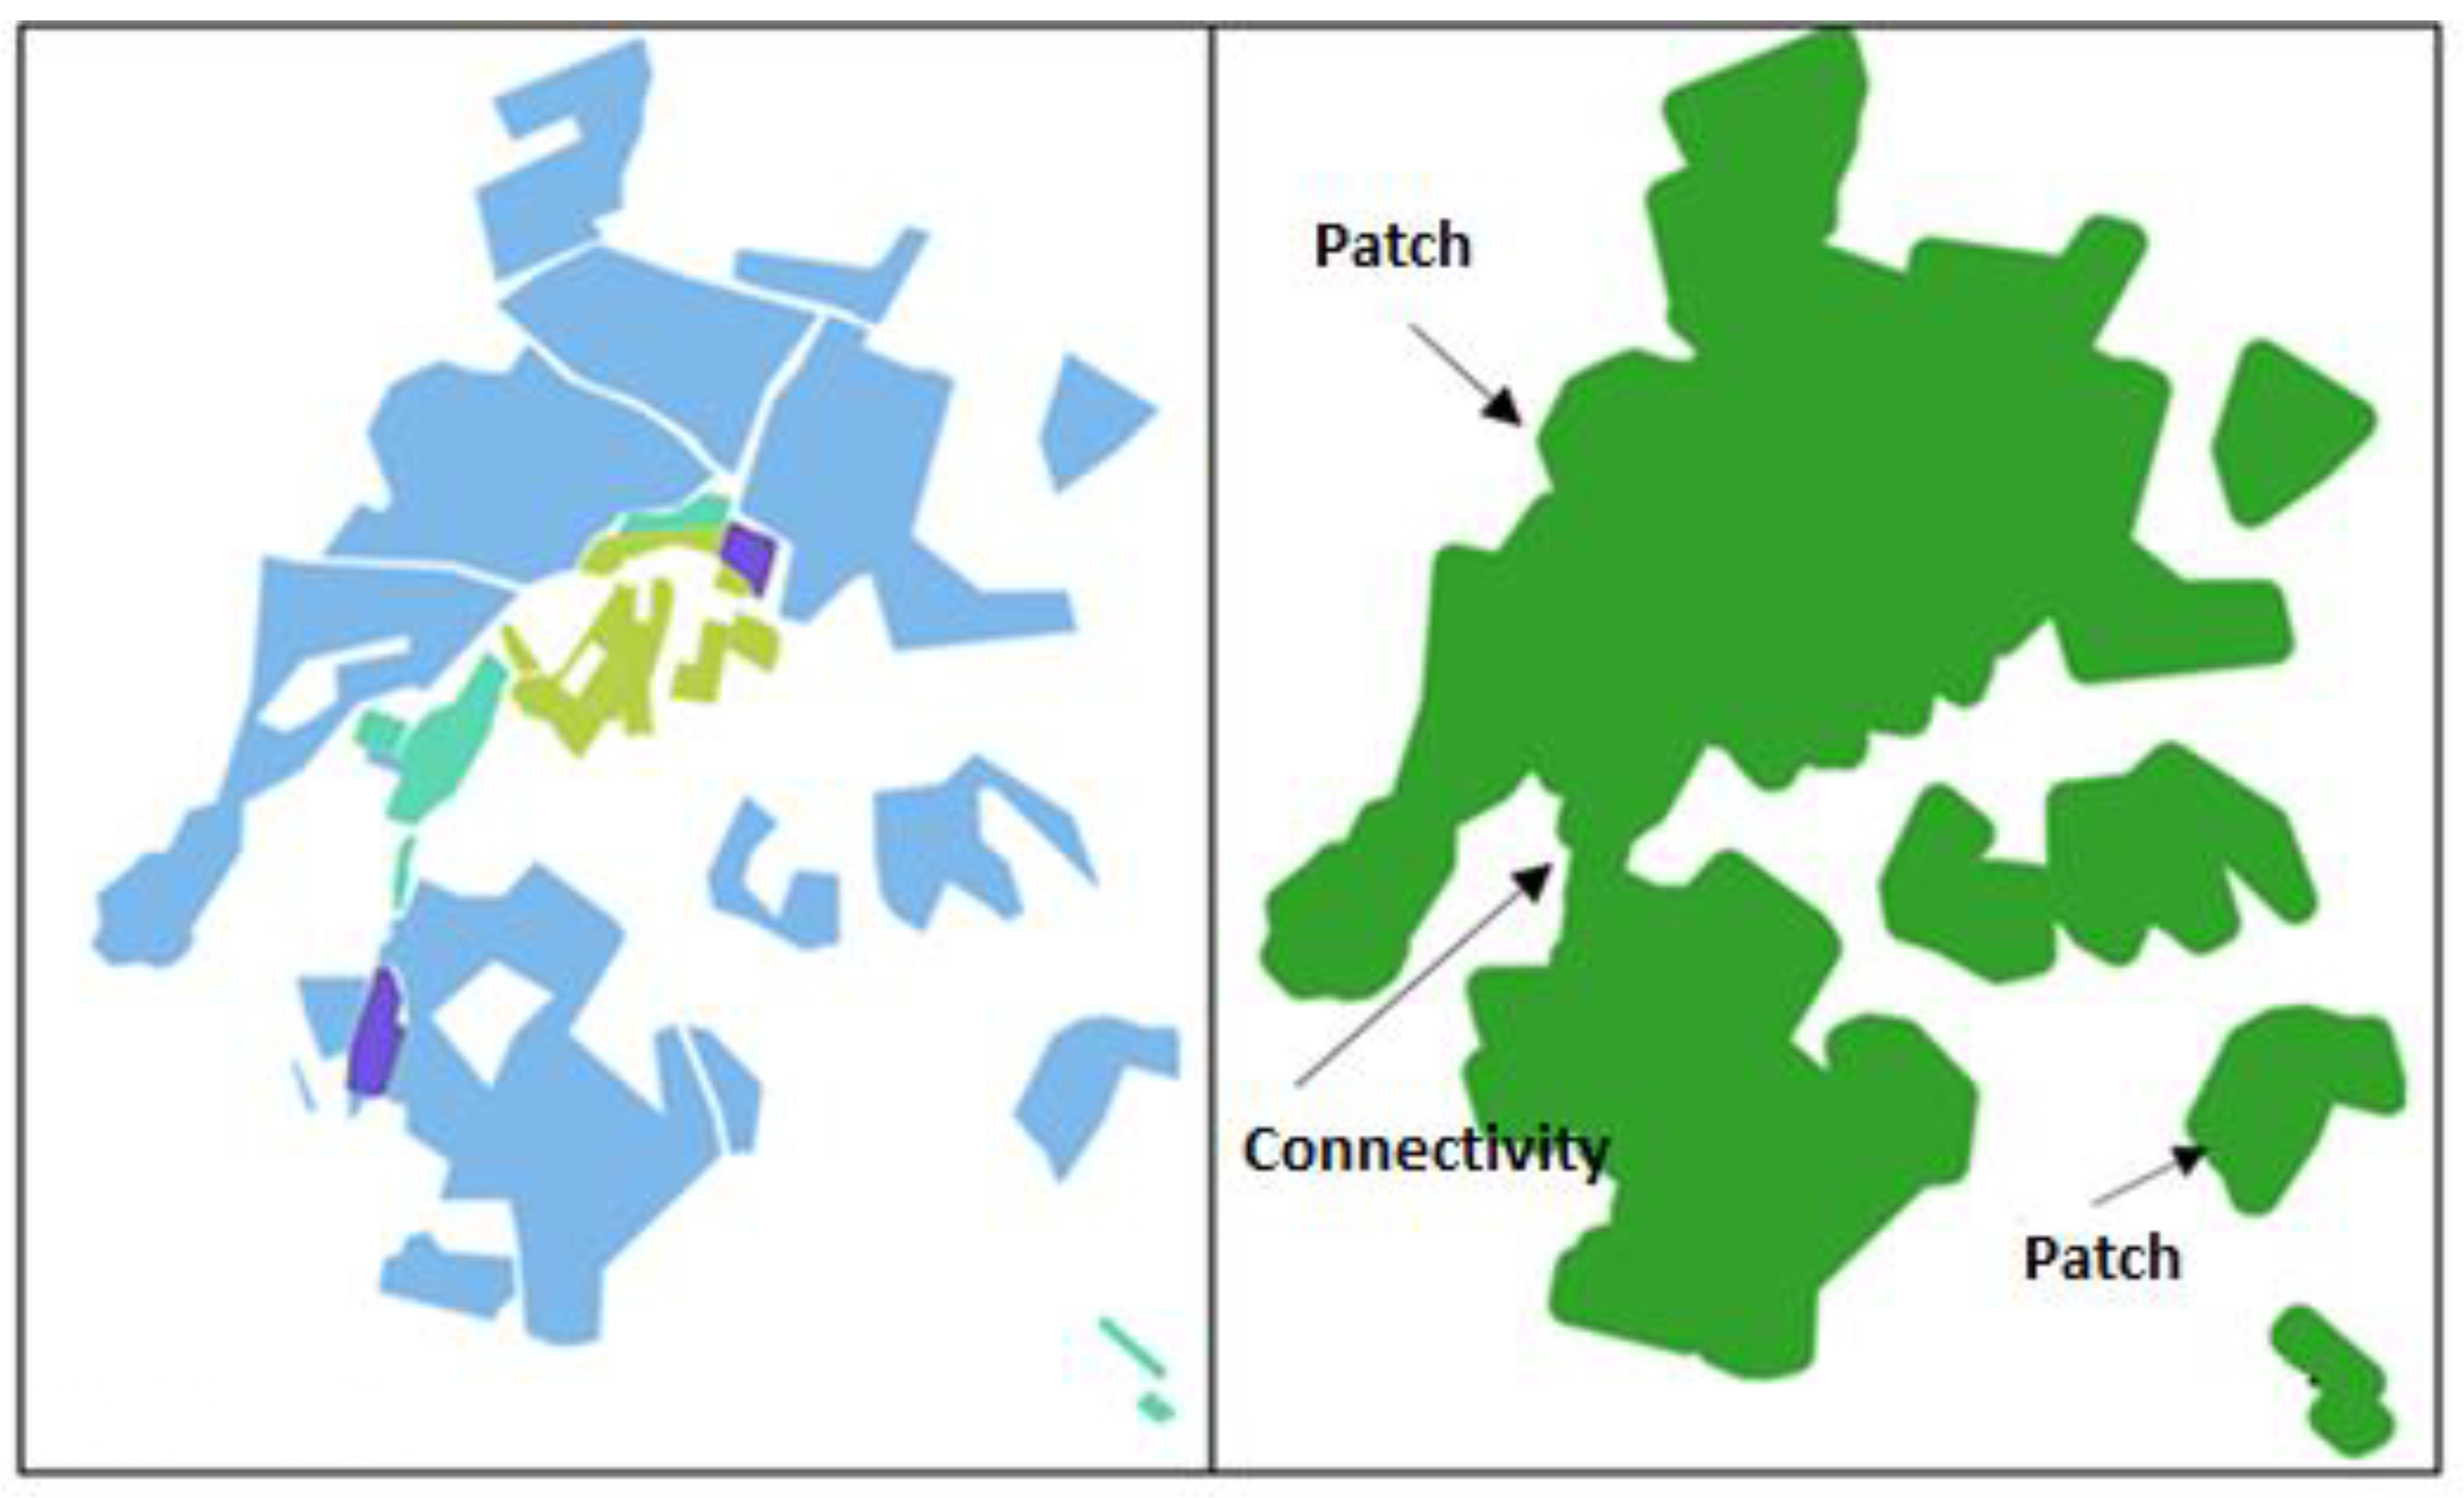
2.3. The Dilation/Erosion Methodology

The dilation/erosion methodology is grounded in landscape ecology and widely used for research in different disciplines including medicine and urban planning to analyze the morphology of geometric structures. Applications include the creation of a dilated envelope around built-up areas [33,34], and analysis of the distances between two natural areas to highlight the most direct paths to connect them in a “green and blue grid” [35]. This is based on algebra, topology, and probability concepts.
Here, we connected the vectorized plots of the three selected RPG categories of land use for beef feeding (mountain pastures—moors, permanent grassland, temporary grassland) at a minimum distance of 20 m, taken as the average rough width of roads and paths. The plots were grouped using the dilation method. Then, erosion was generated to refine the contours of the aggregated plots and create patches (Figure 2). Isolated plots more than 20 m away from their nearest neighbor were considered as patches in landscape ecology terms. Technically, a procedure was created using the spatial functions of the UrbanSimul project programmed in postgis, a plugin for PostgreSQL object-relational database used for executing spatial queries [36].
We mapped two sets of data: potential beef feeding areas oriented and not oriented toward short supply chains (Figure 3). The geographical entities of substantial size that are considered patches oriented toward beef short supply chains are shown in green. The largest such patches were located in Ardèche, Drome, Alpes de Haute Provence, areas producing beef breeds such as “Limousine” and “Charolais.” Another large patch in the Bouches du Rhône hosts Camargue herds raised for recreational purposes.

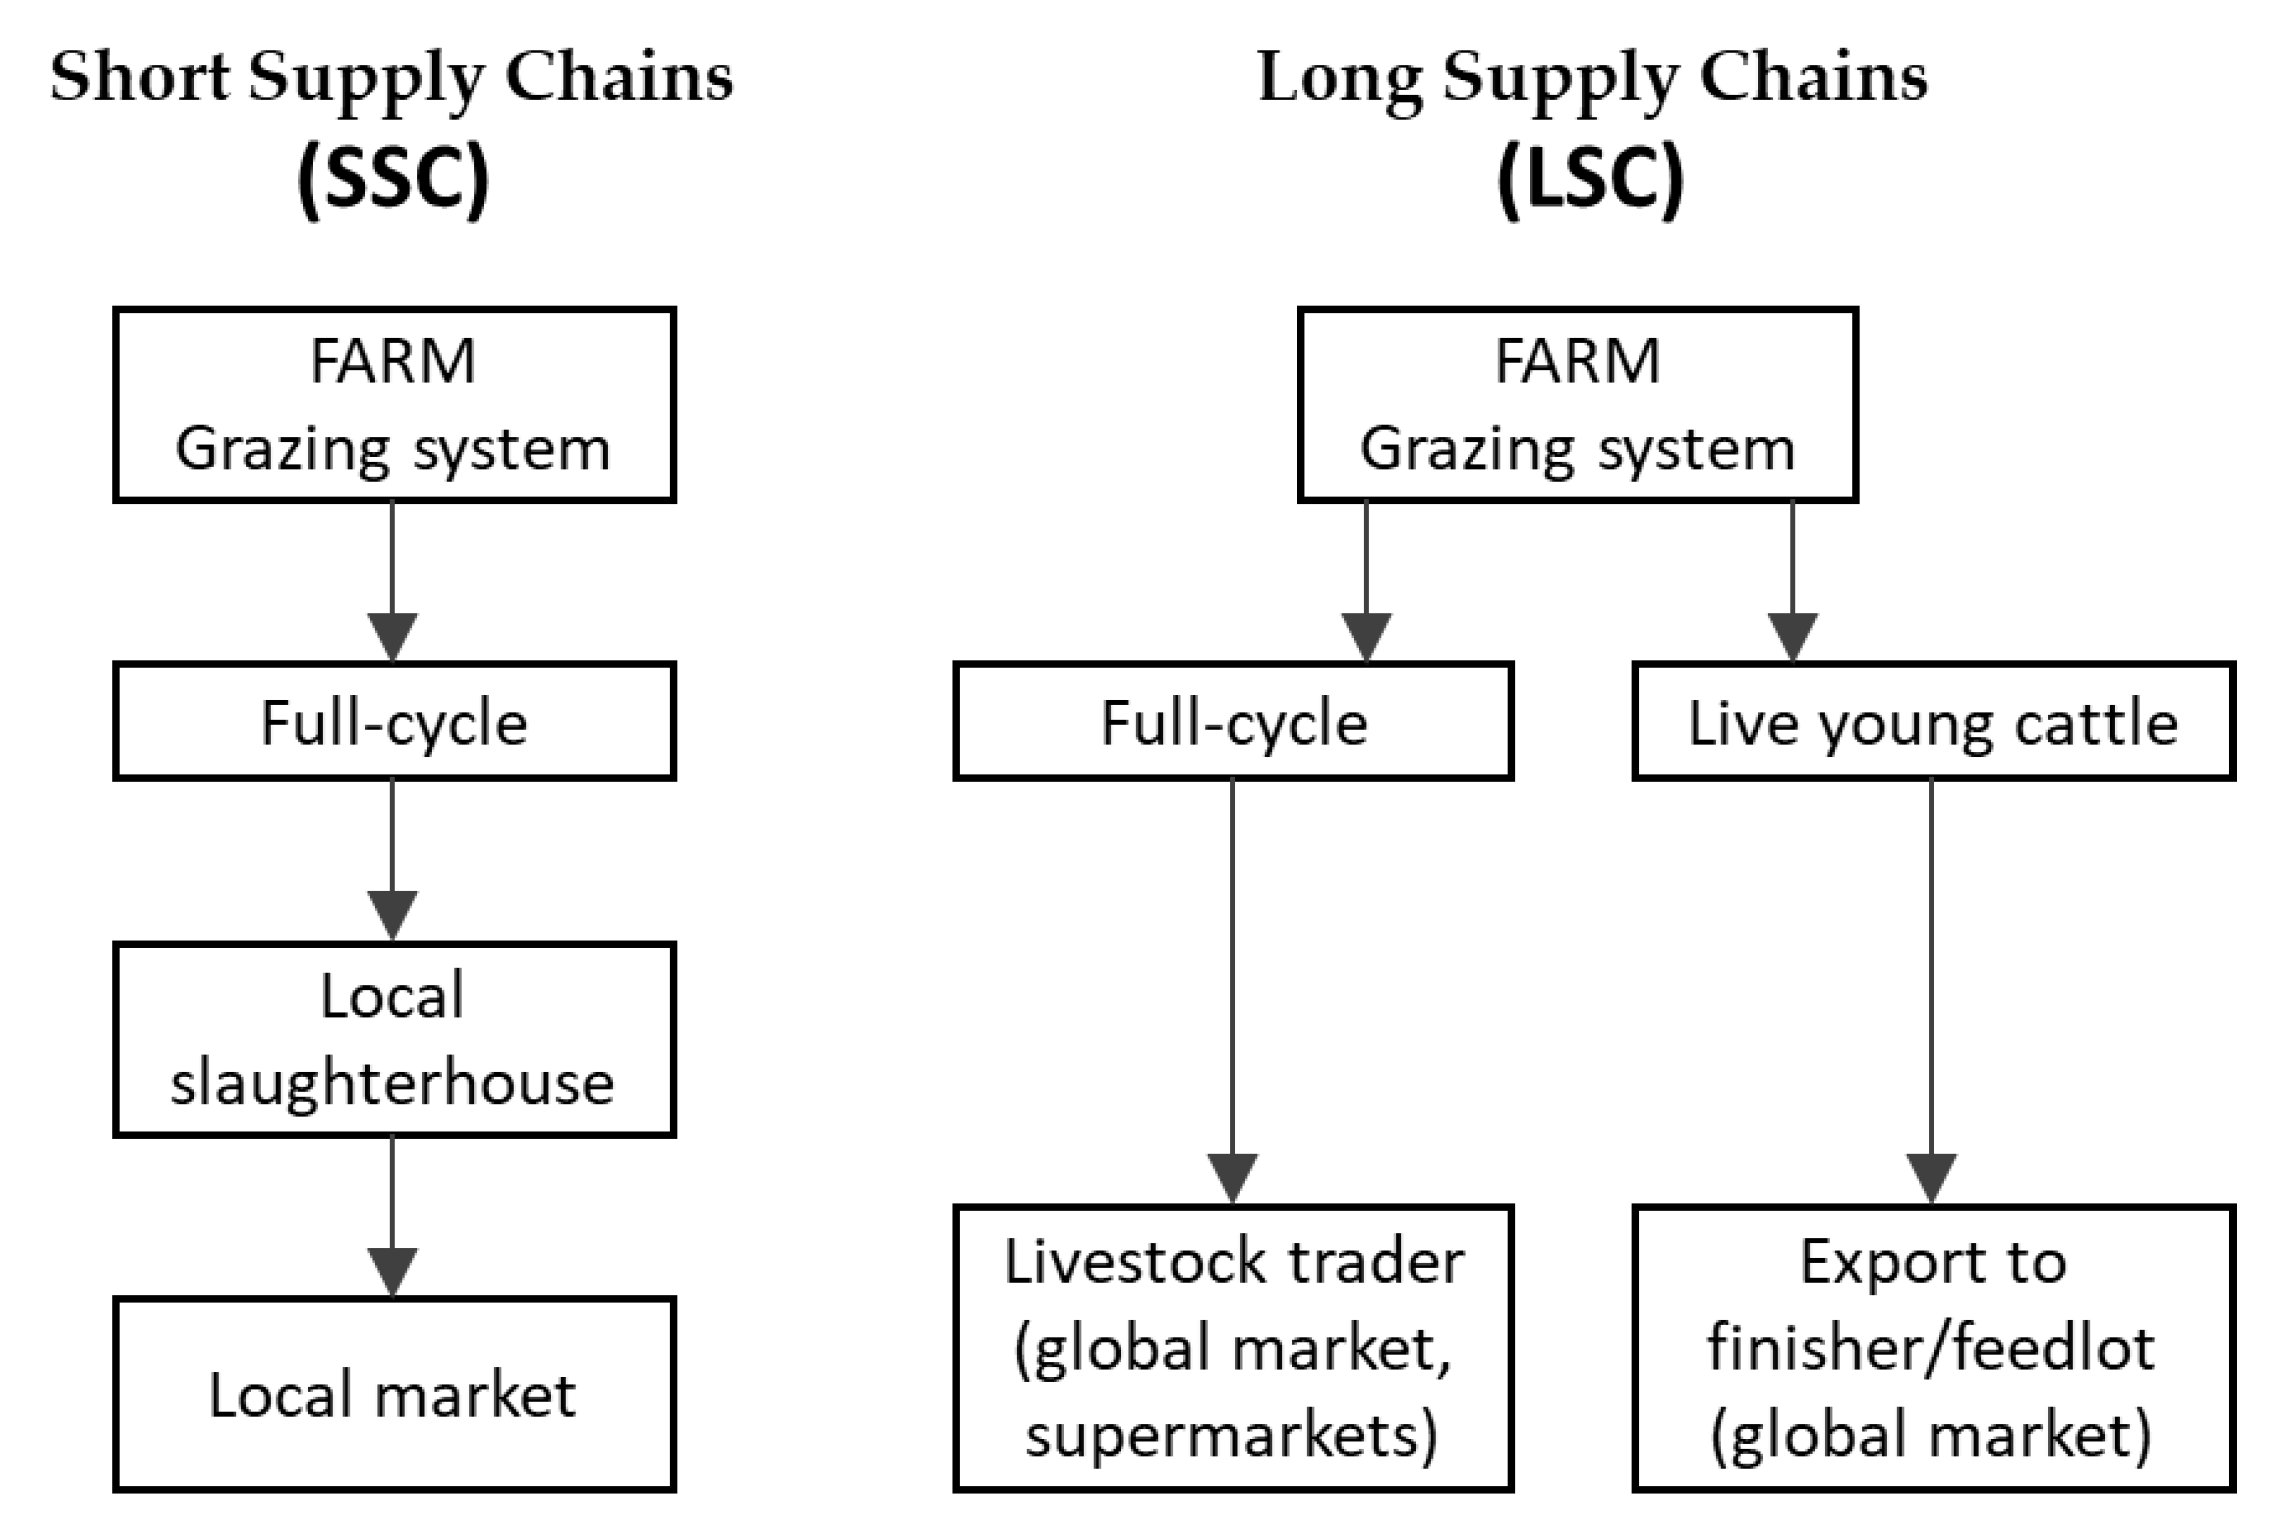
2.4. Method Used to Spatially Characterize Beef Feeding Patches in the Archipelago Oriented and Not Oriented toward Short Supply Chains

This section examines whether the spatial signature of areas oriented and not oriented toward short supply chains can be distinguished from each other according to spatial analysis indicators. The goal was to identify areas (patches) more likely to respond to institutional incentives to increase food security by enhancing/promoting short supply chains. We relied on simple tools used in spatial analysis to assess: (1) the effects of distance from nearest slaughterhouse; (2) rugosity, defined as the complexity of the contours of patches; (3) dominance, according to density, number of patches oriented toward short circuits, and total surface area; and (4) the effects of being situated within the perimeters of a regional or a national nature park. The methods used to analyze/assess/calculate the four indicators are described below.

2.4.1. Distance from Nearest Slaughterhouse

The slaughterhouses in the study area are geolocated by a yellow dot (Figure 3). A geographic information system was used to calculate the minimum distance from each centroid of the beef feeding areas (patches) to the nearest slaughterhouse, discriminating between areas oriented and not oriented toward short supply chains. The underlying hypothesis is that production areas used by farmers selling beef in short supply chains are closer to a slaughterhouse than those used by farmers not selling beef in short supply chains. In fact, local slaughterhouses are small-scale structures providing less than 2000 tons of meat per year by slaughtering on behalf of farmers who then sell their meat at markets, to artisan butchers, or in shops specializing in local and organic products. These farmers and butchers rely on short supply chains to reduce intermediaries and add value to their products [37].

2.4.2. Rugosity

The rugosity indicator is based on the complexity of the contours of the patches. This indicator was constructed on the basis of ecology research on the rugosity of coral reefs, showing that the greater the structural complexity of ecological habitats, the greater the diversity of species [38]. This concept of rugosity was taken up by [39] for the urban system, under the hypothesis that high complexity of the contours of the urban–agricultural fringe increases the functional connections between urban and agricultural land uses. It was concluded that increased rugosity is associated with large populations and significant historic peri-urban farm holdings involved in direct marketing. In this paper, we widen this hypothesis beyond direct marketing, seeking to determine whether the rugosity of the farming areas fosters the orientation of beef production toward short supply chains. In other words, whether former cattle production areas oriented toward long supply chains generate more homogeneous limits than newcomers in short supply chains that are more randomly located. Thus, we measured the rugosity of beef feeding areas (patches) both oriented and not oriented toward short supply chains. We used the Gravelius index (K), that is, the ratio of the perimeter of the patch to the circumference of a circle of the same area surrounding it [40]. We applied the formula: K = perimeter/2* √(π/area). The farther K is from 1, the more complex the contours are. The results are presented in Section 3.

2.4.3. Dominance

After applying the dilation/erosion method, we assessed dominance according to three indicators: (1) the density of the selected RPG categories of land use in the archipelago, discriminating between areas oriented and those not oriented toward short circuits; (2) the number of plots aggregated in the patch (as a proxy of productive crop–plot fragmentation) within the archipelago; and (3) the total area of patches discriminating between those oriented toward short or long supply chains. It was assumed that the larger the patches, the more likely they are to generate a foodshed capable of feeding the city compared to small, scattered pastoral plots. We defined density as the relationship between the surface areas registered in the RGA census (i.e., the selected RPG categories of land for beef feeding, see Table 1) and the surface areas of the patches they lie in, as determined by dilation/erosion, discriminating between those oriented and those not oriented toward short supply chains. The density indicators were calculated over a range of thresholds defined between 50 and 1000 hectares (total average of RPG areas related to the vectorized contours of the patches).

2.4.4. Location within the Perimeters of a Regional or a National Nature Park

The national parks were created in 1973 to ensure the protection of natural areas, both terrestrial and maritime. Pastoral practices are allowed on areas of great biological richness and landscape interest: high mountain pastures and estives (summer pastures), inter-seasonal rangelands, mown natural meadows, etc. In summer, the mountain pastures and estives also host numerous transhumant herds, sometimes coming from distant provinces of southern France (http://www.parcsnationaux.fr/fr/des-connaissances/agriculture-et-pastoralisme, accessed on 14 March 2022). The regional nature parks were created under French regional planning policy in 1967 as an original way of promoting sustainable development strategies based on regional agricultural and agri-food resources [41]. Their participatory approaches contribute to the economic, environmental, and social balance of the territories under a contractual charter signed by the stakeholders. Regional parks generally promote the quality of the landscape and protect small farms, who can add value to their food products through the regional nature park quality label. Therefore, the hypothesis underlying our study is that beef feeding areas located within the perimeters of a regional or a national nature park are more likely to be oriented toward short supply chains.

2.4.5. Beef Self-Sufficiency Ratio

We estimated the quantity of beef produced in the 100 km-radius foodshed. Extracting from RGA 2010 the number of beef per municipality, we multiplied this by an average load of one bovine livestock unit (LSU) per hectare. The LSU is a reference unit for aggregating livestock of different species and ages using specific coefficients initially established on the basis of the nutritional or feed requirements of each type of animal (source Eurostat). To calculate the kg carcass equivalent, we applied a yield of 0.74 tons per hectare [11]. The yearly consumption of bovine meat was estimated by multiplying the number of inhabitants (INSEE 2014) by the kg carcass equivalent of the 2018 bovine meat consumption per capita (http://www.fao.org/faostat/en/#data/FBS, accessed on 14 March 2022). The beef self-sufficiency ratio is therefore the ratio of estimated beef production to estimated consumption in the 100 km-radius foodshed, calculated by province (similar to NUTS-3 level), as follows:
Beef   self sufficiency   ratio = beef   feeding   area   xyield number   of   inhabitants × average   consumption   per   capita / year
with beef feeding area = number of bovine livestock × (1 hectare/livestock unit).

3. Results

3.1. Short Supply Chains’ Higher Contour Rugosity Than Long Supply Chains

We investigated whether the rugosity of the contours defined by the Gravelius indicator K is a consequential variable distinguishing between short and long supply chains. When this indicator was calculated in the 100 km-radius foodshed, the average K value of entities (isolated patches and archipelago) in short supply chains (SSC) was slightly higher than in long supply chains (LSC) (Table 2). We conclude that contour rugosity is informative on whether beef feeding areas are functionally connected to nearby beef consumption areas, thereby confirming the hypothesis defined in Section 2.4.2.

3.2. Short Supply Chains’ Stronger Dominance Compared to Long Supply Chains

Dominance assessment showed twice as many patches oriented toward short supply chains (10458 patches) relative to long supply chains (5296). Both kinds of entities have similar median surface areas devoted to beef feeding (4.85 ha for SSC vs. 4.58 ha for LSC). Average density of beef feeding areas was almost identical for SSC and LSC (Table 3). However, the patches in short supply chains had larger surface areas on average (36 ha for SSC and 28 ha for LSC), which may indicate strong connectivity between the beef feeding areas selling their production in SSC because they are located close to each other. This connectivity may be accentuated by a neighborhood effect, with breeders in short supply chains creating social links and exchanging best practices [30]. Nevertheless, these results should be considered as an overall trend and verified against expert opinion, given that the SSC variable in our study was estimated using census data at the municipal level due to the lack of available data at a finer scale.

3.3. Short Supply Chains’ Spatial Characteristics

The proportion of areas in SSC to those in LSC was greater within the perimeters of nature parks (regional and national) than in the whole of the study area (Table 4). Furthermore, beef feeding areas selling their production in short supply chains were closer to slaughterhouses than those selling in long supply chains. Pastoral areas operating in short supply chains were on average 24.888 km from the nearest slaughterhouse, whereas those operating in long supply chains were on average 27.294 km from the nearest slaughterhouse.

3.4. Beef Self-Sufficiency Ratio Estimates

Finally, we estimated the quantity of beef produced in the 100 km-radius foodshed (Table 5). In the municipalities located in a province with a strong beef production tradition (Drôme and Ardèche), production capacity largely exceeds local consumption, and therefore there is a very high ratio of beef self-sufficiency (1352% and 139%, respectively). Other provinces with less of a beef production tradition (e.g., Var) are dependent on external beef supply. It should be noted that these results confirm those of previous studies [11]. Table 6 summarizes the geographical factors that characterize the beef feeding areas oriented toward short supply chains.

4. Discussion

4.1. Determinants of the Spatial Signature of Beef Feeding Areas Oriented toward Short Supply Chains

Our results confirm the initial hypotheses that the rugosity of beef feeding areas is informative on the orientation of food production toward short supply chains [39,42]. On the other hand, there were more patches in short supply chains (SSC) than in long supply chains (LSC). One explanation may be increasing urban demand for food grown “close to home”, interacting with the processes of rural restructuring to foster small-scale farming and its direct food linkages to cities [43]. In addition, the surface areas of the patches in SSC were larger. This result could be an artifact caused by the dilation/erosion methodology used to aggregate the patches: those of the farms in SSC are close to each other and those in LSC are more isolated. It would be interesting in further work to use other spatial analysis methodologies such as Moran’s I or LISA [44] to compare the results obtained here.
In addition, another research avenue would be to analyze the neighborhood effects over small surface areas to better understand how landscape pattern, and in particular, fragmentation (in the sense of landscape ecology), impacts the functioning of the landscape (i.e., agricultural activities on farms). Small surfaces areas with high rugosity can be used for extensive feeding (mountain pastures), a good use for areas that are far from the farm or that are too fragmented [45]. Moreover, neighborhood effects should take into account social relations between producers and between producers and urban demand, since an important driver of the archipelago structure is the supply chain.
This work was limited by a lack of sources of statistics on short supply chains at a finer scale than the municipality. As a result, we may be overestimating the beef feeding areas in SSC. Indeed, we assigned to SSC all the cattle feeding areas of any municipality that had at least one beef livestock farmer who declared marketing via SSC (RGA 2010). Our research perspectives included working at a finer scale based on quantitative field surveys and expert opinion, coupled with data from the upcoming RGA 2020, which will be available in 2022. Analyzing this database would also enable us to identify the part of the land in the Bouches du Rhone that is used for raising bulls for bullfighting, currently included in the “cattle” section of the RGA in the same way as beef cows. In addition, a field survey would make it possible to specify the type of beef cattle breeding (Charolais, Limousine) and refine production estimates (e.g., yield/carcass).
Regarding the effect of public policies on the orientation of land use toward SSC, we analyzed the effect of being located within a regional or national nature park. Our results showed that there were 3.11 times more areas under SSC than under LSC inside parks (see Table 4). This may be due to both the parks’ actions in support of SSC (e.g., supplying public school canteens with local food products, promoting food quality labels, organizing farmers’ markets) and to the territorial dynamics of proximity that the parks promote [4,24].
Finally, distance from slaughterhouses seems to be a factor explaining orientation toward SSC. This should be further addressed by research examining the typology of slaughterhouses (small versus large) and the differences in slaughtering costs. In addition, the possible introduction of mobile slaughterhouses currently being discussed by stakeholders (chamber of agriculture, livestock associations) would likely impact orientation toward short supply chains, attracting small farms and isolated cattle farms in particular. An interesting future extension would therefore be to compare our approach with the stakeholders’ expertise by means of a participatory process. It should be noted that the effect of distance from consumption points was not analyzed here, since for beef and for the study area, the average distance in short supply chains is 200 km (expert opinion).

4.2. What Role and Leverage for Public Action?

Our findings revealed that the analysis of local food self-sufficiency must be shifted from foodshed size assessment to a commodity–group-specific spatial configuration of a complex of complementary components, the so-called foodshed archipelago (Figure 4). These results specifically question the theoretical agricultural land use model by von Thünen, where the type of agriculture is determined by the distance to the city center [46] (based on circumcentric rings). Biophysical features, for instance, soil fertility, are very often not distributed around the urban area in a gradient [7]. Furthermore, the spatial distribution of agricultural production also responds to socioeconomic features resulting from the particular history of each place in terms of its urbanization, development of the agricultural sector, organization of activities, and environmental protection, as we have shown in previous work [5,47]. Actually, the multilevel aspect of food systems remains a remarkable scientific challenge to integrate the stakeholders’ local vision and global statistical data and thus tailor regional food security-oriented policies [48]. One promising research avenue to help fill this gap is the partial least squares-path modeling methodological approach (PLS-PM), which makes it possible to analyze complex relationships between the socio-economic structure of farms, demography, landscape structure, and landscape management and function, in order to characterize the spatial signature of peri-urban agriculture [6]. Beyond the methodological contributions, the findings can be used to inform public decisions.
What leverage is there for public action to reconnect beef production areas to consumption areas (the city) through short supply chains? The obvious direction is using development initiatives to increase the connectivity of beef feeding areas (e.g., land acquisition to install new breeders) and rugosity (e.g., protection of small pastoral areas on the outskirts of the city). In addition, public action can play a decisive role in fostering short supply chains through nature parks, as we have seen above. Moreover, public procurement (e.g., local food public procurement for school canteens) can promote local food supply chains by encouraging producer groups, developing partnerships with intermediaries (e.g., butchers for custom cutting), and securing outlets under contract for part of the production [30,49].
Furthermore, from a regional food security perspective, even if all the arable land oriented toward the production of food sold in short supply chains (see Table 5) were used for beef production, none of the provinces in our study area, except for Lozère and Ardèche, would be self-sufficient. Would it be possible (and desirable) to encourage farmers to redirect certain pastoral areas (e.g., those used for leisure activities involving horses) to beef feeding, in order to produce beef to feed the city? In the end, our results show that the spatial arrangement of areas is also an important consideration, to be added to the biophysical and agro-climatic conditions such as altitude, hygrometry, and soil characteristics. It would be interesting to explore whether the foodshed approach—based on the concept of sustainable city-region food systems—could be integrated more intensively into food policies to sustainably increase food self-sufficiency at the regional level [50].

5. Conclusions

The paper attempts to delimit and characterize the foodshed using concepts from landscape ecology (rugosity, connectivity, patches, and the archipelago) as applied to beef supply chains. We discriminated between beef feeding areas oriented toward short supply chains (SSC) and those oriented toward long supply chains (LSC) using available statistical data to confirm or challenge our hypothesis of a particular spatial signature of agricultural areas oriented toward SSC. Our results show that the beef feeding areas in SSC have a particular spatial arrangement: they are small patches very closely situated (<20 m) and connected to each other, forming large areas with high-rugosity contours. This confirms the hypothesis of a spatial signature of areas in SSC. In other words, the functioning and management of the landscape are translated in space into particular spatial structures whose arrangement is identifiable, as our previous work has shown [4,5,6,18].
These areas composed of small, connected patches contribute more to city food supply than isolated patches due to their functional connection in short supply chains. These results, although they do not call into question the productive capacity of isolated farms, are relevant in terms of food security at a regional level from a food planning perspective. By revealing the positive impact of nature parks on the existence of short supply chains, we have shown the decisive role that public action can play.

Author Contributions

Conceptualization, M.M. and E.S.S.; Validation, M.M., E.S.S., C.N. and J.L.V.-V.; Formal analysis, D.J., J.L.V.-V., M.M. and E.S.S.; Resources, M.D.; Writing—original draft preparation, M.M, E.S.S. and L.M.; Writing—review and editing, M.M. and E.S.S.; Supervision, M.M., E.S.S., C.N. and D.J. All authors have read and agreed to the published version of the manuscript.

Funding

This work was carried out as part of the ongoing project FOODSHIFT2030, funded from the European Union’s Horizon 2020 Research and Innovation Program under grant agreement number 862716. The project (Grant Agreement 862716, H2020-SFS-2018-2020/H2020-SFS-2019-1) on transforming the European food system towards a low carbon circular future applies a string of mechanisms for maturing, combining, upscaling and multiplying sustainable food system innovations. The project has received EUR 7.5 million from the EU Horizon 2020 programme.

Institutional Review Board Statement

Not applicable.

Informed Consent Statement

Not applicable.

Acknowledgments

The authors wish to thank the anonymous reviewers for their diligent work and their helpful advice. Our thanks to Avignon University, UMR 7300, Laboratoire ESPACE for providing the resources of the ESPACE Laboratory and Avignon University as well as to Guillaume Ollivier (INRAE—UR Ecodéveloppement) for his remarks. We are grateful to the Urbansimul team for their contribution on dilation/erosion (computer code of the Urbansimul 2016 project), hal-01604422. We thank Catherine Brinkley (Department of human ecology, University of California, Davis), Jacques Lasseur (INRAE, UMR SELMET), Noé Guiraud, (Urban School of Lyon), Albert Alameldine, REGAL network project manager, and Hugues Fortuna, manager of the Avignon public schools central kitchen. We thank Marjorie Sweetko for the English language editing.

Conflicts of Interest

The authors declare no conflict of interest.

References

  1. IPES-Food. COVID-19 and the Crisis in Food Systems: Symptoms, Causes, and Potential Solutions; International Panel of Experts on Sustainable Food Systems: Brussels, Belgium, 2020; p. 11. [Google Scholar]
  2. United Nations Organisation (UNO). World Urbanization Prospects: The 2014 Revision; UNO. Department of Economic and Social Affairs, Population Division: New York, NY, USA, 2014; p. 517. [Google Scholar]
  3. Moragues-Faus, A. Distributive Food Systems to Build Just and Liveable Futures. Agric. Hum. Values 2020, 37, 583–584. [Google Scholar] [CrossRef] [PubMed]
  4. Sanz, E.S. Planification Urbaine et Agriculture. Méthodologie Systémique de Caractérisation de L’agriculture Périurbaine à Partir d’une Recherche Empirique En France et En Espagne. Thèse Pour L’obtention du Titre de Docteur en Géographie (UAM) et en Etudes Urbaines (EHESS); EHESS/UAM: Paris, France, 2016. [Google Scholar]
  5. Sanz, E.S.; Martinetti, D.; Napoléone, C. Operational Modelling of Peri-Urban Farmland for Public Action in Mediterranean Context. Land Use Policy 2018, 75, 757–771. [Google Scholar] [CrossRef]
  6. Boussougou, G.B.; Sanz, E.S.; Napoléone, C.; Martinetti, D. Identifying Agricultural Areas with Potential for City Connections: A Regional-Scale Methodology for Urban Planning. Land Use Policy 2021, 103, 105321. [Google Scholar] [CrossRef]
  7. Vicente-Vicente, J.L.; Sanz-Sanz, E.; Napoléone, C.; Moulery, M.; Piorr, A. Foodshed, Agricultural Diversification and Self-Sufficiency Assessment: Beyond the Isotropic Circle Foodshed—A Case Study from Avignon (France). Agriculture 2021, 11, 143. [Google Scholar] [CrossRef]
  8. Hedden, W.P. How Great Cities Are Fed; D. C. Heath & Cp.: Boston, MA, USA, 1929. [Google Scholar]
  9. Kloppenburg, J.; Hendrickson, J.; Stevenson, G.W. Coming in to the Foodshed. Agric. Hum. Values 1996, 13, 33–42. [Google Scholar] [CrossRef]
  10. Butler, M. Analyzing the Foodshed: Toward a More Comprehensive Foodshed Analysis; Portland State University: Portland, OR, USA, 2000. [Google Scholar]
  11. Feagan, R. The Place of Food: Mapping out the “local” in Local Food Systems. Prog. Hum. Geogr. 2007, 31, 23–42. [Google Scholar] [CrossRef] [Green Version]
  12. Peters, C.J.; Bills, N.L.; Wilkins, J.L.; Fick, G.W. Foodshed Analysis and Its Relevance to Sustainability. Renew. Agric. Food Syst. 2009, 24, 1–7. [Google Scholar] [CrossRef] [Green Version]
  13. Aubry, C.; Kebir, L. Shortening Food Supply Chains: A Means for Maintaining Agriculture Close to Urban Areas? The Case of the French Metropolitan Area of Paris. Food Policy 2013, 41, 85–93. [Google Scholar] [CrossRef]
  14. Griffin, T.; Conrad, Z.; Peters, C.; Ridberg, R.; Tyler, E.P. Regional Self-Reliance of the Northeast Food System. Renew. Agric. Food Syst. 2015, 30, 349–363. [Google Scholar] [CrossRef]
  15. Tichenor, N.E.; van Zanten, H.H.E.; de Boer, I.J.M.; Peters, C.J.; McCarthy, A.C.; Griffin, T.S. Land Use Efficiency of Beef Systems in the Northeastern USA from a Food Supply Perspective. Agric. Syst. 2017, 156, 34–42. [Google Scholar] [CrossRef]
  16. Li, K.; Jin, X.; Ma, D.; Jiang, P. Evaluation of Resource and Environmental Carrying Capacity of China’s Rapid-Urbanization Areas—A Case Study of Xinbei District, Changzhou. Land 2019, 8, 69. [Google Scholar] [CrossRef] [Green Version]
  17. Zasada, I.; Schmutz, U.; Wascher, D.; Kneafsey, M.; Corsi, S.; Mazzocchi, C.; Monaco, F.; Boyce, P.; Doernberg, A.; Sali, G.; et al. Food beyond the City—Analysing Foodsheds and Self-Sufficiency for Different Food System Scenarios in European Metropolitan Regions. City Cult. Soc. 2019, 16, 25–35. [Google Scholar] [CrossRef]
  18. Poggi, S.; Vinatier, F.; Hannachi, M.; Sanz Sanz, E.; Rudi, G.; Zamberletti, P.; Tixier, P.; Papaïx, J. How Can Models Foster the Transition towards Future Agricultural Landscapes? Adv. Ecol. Res. 2021, 64, 305–368. [Google Scholar] [CrossRef]
  19. Pulliam, H.R. Sources, Sinks, and Population Regulation. Am. Nat. 1988, 132, 652–661. [Google Scholar] [CrossRef]
  20. Décamps, H.; Décamps, O. Organisation de l’espace et processus écologiques. Economierurale 2007, 297, 41–54. [Google Scholar] [CrossRef] [Green Version]
  21. Taylor, P.D.; Fahrig, L.; Henein, K.; Merriam, G. Connectivity Is a Vital Element of Landscape Structure. Oikos 1993, 68, 571. [Google Scholar] [CrossRef] [Green Version]
  22. Taylor, P.D.; Fahrig, L.; With, K.A. Landscape connectivity: A return to the basics. In Connectivity Conservation; Crooks, K.R., Sanjayan, M., Eds.; Cambridge University Press: Cambridge, UK, 2006; pp. 29–43. ISBN 978-0-511-75482-1. [Google Scholar]
  23. Torre, A.; Wallet, F. Introduction: The role of proximity relations in regional and territorial development processes. In Regional Development and Proximity Relations; Edward Elgar Publishing: Cheltenham, UK, 2014; pp. 1–44. ISBN 978-1-78100-289-6. [Google Scholar]
  24. Angeon, V.; Bertrand, N. Les Dispositifs Français de Développement Rural: Quelles Proximités Mobilisées ? Géographie Économie Société 2009, 11, 93–114. [Google Scholar] [CrossRef]
  25. Hinrichs, C.C. Embeddedness and Local Food Systems: Notes on Two Types of Direct Agricultural Market. J. Rural Stud. 2000, 16, 295–303. [Google Scholar] [CrossRef]
  26. Brinkley, C. Visualizing the Social and Geographical Embeddedness of Local Food Systems. J. Rural Stud. 2017, 54, 314–325. [Google Scholar] [CrossRef] [Green Version]
  27. Chiffoleau, Y. From Politics to Co-Operation: The Dynamics of Embeddedness in Alternative Food Supply Chains. Sociol. Rural. 2009, 49, 218–235. [Google Scholar] [CrossRef]
  28. Guiraud, N.; Laperrière, V.; Rouchier, J. Une Géographie Des Circuits Courts En Région Provence-Alpes-Côte d’azur. L’Espace Géographique 2014, 4, 356–373. [Google Scholar] [CrossRef]
  29. Confédération paysanne Provence-Alpes-Côte-d’Azur. Confédération paysanne Provence-Alpes-Côte-d’Azur; Séminaire “L’abattage de Proximité”; Confédération paysanne Provence-Alpes-Côte-d’Azur: Buoux, France, 2019; p. 23. [Google Scholar]
  30. Agence Nationale de la Cohesion des Territoires, Massif des Alpes. Compte Rendu Du Séminaire “Valoriser Les Viades de Montagne Massif Des Alpes”; Chanmbre d’Argiruclure à Grenoble: Grenoble, France, 2020. [Google Scholar]
  31. Confédération paysanne Provence-Alpes-Côte-d’Azur. Région PACA en région Provence-Alpes-Côte-d’Azur Contexte de l’abattage En Région Provence-Alpes-Côte-d’Azur; Presented at the Séminaire “L’abattage de proximité”; Confédération paysanne Provence-Alpes-Côte-d’Azur: Buoux, France, 2019. [Google Scholar]
  32. Confédération paysanne Provence-Alpes-Côte-d’Azur. Région Auvergne Rhône-Alpes, Région SUD Présentation Du Projet “Enjeux de Structuration et de Développement Des Filières Viande Du Massif Alliant Valorisation Du Produit Pour l’éleveur et Apport d’un Produit Local de Qualité Au Consommateur”; Presented at the Séminaire “Valoriser les viandes de montagne”; Confédération paysanne Provence-Alpes-Côte-d’Azur: Grenoble, France, 2020. [Google Scholar]
  33. Girardet, X.; Foltête, J.-C.; Clauzel, C.; Vuidel, G. Restauration de la connectivité écologique: Proposition méthodologique pour une localisation optimisée des passages à faune. Vertigo 2016, 24, 17337. [Google Scholar] [CrossRef]
  34. Guérois, M. Les Formes Des Villes Européennes Vues Du Ciel. Une Contribution de l’image CORINE Land Cover à La Comparaison Morphologique Des Grandes Villes d’Europe Occidentale; Université Panthéon-Sorbonne-Paris I: Paris, France, 2003. [Google Scholar]
  35. Amsallem, J.; Deshayes, M.; Bonnevialle, M. Analyse comparative de méthodes d’élaboration de trames vertes et bleues nationales et régionales. Sci. Eaux Territ. 2010, 3, 40. [Google Scholar] [CrossRef]
  36. Geniaux, G.; Leroux, B.; Samaké, A.D.; Cezanne-Bert, P.; Moulery, M.; Code Informatique Du Projet Urbansimul 2016. 2016, hal-01604422. Available online: https://hal.archives-ouvertes.fr/hal-01604422 (accessed on 14 March 2022).
  37. Du Gerny, S.; Les Abattoirs de Proximité de plus En plus Sollicités Par Les Petits Producteurs. Les Echos 2015. Available online: https://www.lesechos.fr/2015/09/les-abattoirs-de-proximite-de-plus-en-plus-sollicites-par-les-petits-producteurs-253395 (accessed on 10 March 2022).
  38. Dustan, P.; Doherty, O.; Pardede, S. Digital Reef Rugosity Estimates Coral Reef Habitat Complexity. PLoS ONE 2013, 8, e57386. [Google Scholar] [CrossRef]
  39. Brinkley, C. High Rugosity Cities: The Geographic, Economic and Regulatory Pathology of America’s Most Non-Concentric Urban Areas. Land Use Policy 2018, 73, 215–224. [Google Scholar] [CrossRef]
  40. Barké, M.K.; Oussein, I.; Bielders, C.; Ambouta, K.J.M.; Tychon, B. Caractérisation morphologique des cuvettes oasiennes du Centre-Est du Niger. Physio-Geo 2017, 11, 255–276. [Google Scholar] [CrossRef]
  41. Angeon, V.; Boisvert, V.; Caron, A. La marque « Parc naturel régional »: Un outil au service d’un développement local durable et un modèle pour les pays du Sud ? Afr. Contemp. 2007, 222, 149. [Google Scholar] [CrossRef]
  42. Forman, R.T.T. Urban Regions: Ecology and Planning beyond the City; Harvard University: Cambridge, MA, USA, 2008; ISBN 10.1017/CBO9780511754982. [Google Scholar]
  43. Jarosz, L. The City in the Country: Growing Alternative Food Networks in Metropolitan Areas. J. Rural Stud. 2008, 24, 231–244. [Google Scholar] [CrossRef]
  44. Anselin, L. Local Indicators of Spatial Association—LISA. Geogr. Anal. 1995, 27, 93–115. [Google Scholar] [CrossRef]
  45. FiBL. Engraissement Au Pâturage; FiBL: Frick, Switzerland, 2001. [Google Scholar]
  46. Von Thünen, J.H. Von Thunen’s Isolated State; Pergarmon Press: Glasgow, UK, 1826. [Google Scholar]
  47. Sanz, E.S.; Napoléone, C.; Hubert, B. A Systemic Methodology to Characterize Peri-Urban Agriculture for a Better Integration of Agricultural Stakes in Urban Planning. L’espace Géographique 2017, 46, 174–190. [Google Scholar]
  48. Sanz, E.S.; Napoléone, C.; Mouléry, M. Agroecological Transitions and Local Food Self-Sufficiency Assessment. From the Isotropic Circle to the Archipelago Foodshed. Agroecol. Transform. Sustain. Food Syst. Insight Fr. CGIAR Res. 2021, 98, 23708. [Google Scholar]
  49. Sanz, E.S. Public procurement as a booster of midscale food supply chains. In Public Food Procurement for Sustainable Food Systems and Healthy Diets; Swenson, L., Hunter, D., Schneider, S., Eds.; FAO: Rome, Italy, 2022. [Google Scholar]
  50. Gugerell, C.; Sato, T.; Hvitsand, C.; Toriyama, D.; Suzuki, N.; Penker, M. Know the Farmer That Feeds You: A Cross-Country Analysis of Spatial-Relational Proximities and the Attractiveness of Community Supported Agriculture. Agriculture 2021, 11, 1006. [Google Scholar] [CrossRef]
Figure 1. Schema of the type of farms serving short supply chains and long supply chains in the study area around Avignon, France.
Agriculture 12 00419 g001
Figure 2. Map on left shows unconnected patches, while map on the right groups patches together using the dilation/erosion method.
Agriculture 12 00419 g002
Figure 3. Location of the beef feeding patches within a 100 km radius around the city of Avignon.
Agriculture 12 00419 g003
Figure 4. Three-step methodological approach used to shift the focus of a foodshed analysis from an assessment of its size (isotropic circle) to its assessment as a complex of complementary pieces (foodshed archipelago), Vicente et al. 2021 [7]; Boussougou et al. 2021 [6]; Poggi et al. [18].
Agriculture 12 00419 g004
Table 1. Selected RPG categories of land use for beef feeding.
CategoryDescriptionRPG Code
Mountain pastures, moorsWood-pastureBOP
Pastoral area—predominantly grass and fodder resources. Woody resources present SPH
Pastoral area—predominantly woody fodder resourcesSPL
Permanent grasslandPermanent grassland—predominantly grass (fodder resources; woody resources absent or little present)PPH
grassland in long rotation (6 years or more)PRL
Temporary grasslandOther temporary grassland 5 years old or lessPTR
Table 2. Average rugosity of entities constituting beef feeding areas.
Surface (ha)K (SSC)K (LSC)
<501.22 1.21
>502.192.10
>1002.452.32
>3003.022.82
>5003.363.01
>7003.593.29
>10003.363.01
SSC: short supply chains; LSC: long supply chains.
Table 3. Density of patches in SSC and LSC.
Area
(Hectares)
Density SSC
(Percentage)
Density LSC
(Percentage)
Area SSC
(Hectares)
Area LSC
(Hectares)
<5031.1531.043.333.26
>5068.7169.48246.25 174.43
>10073.3274.63410.33 278.06
>30077.9379.93975.01 602.63
>50078.8682.671389.48 801.39
>70077.8780.911791.04973.05
>100077.7182.672289.741208.73
Table 4. Proportion of beef feeding areas in SSC and LSC for areas located within a national or regional nature park of the study area.
SSC Beef Feeding Areas
(Hectares)
LSC Beef Feeding Areas (Hectares)Ratio SSC/LSC
Areas
Within a nature park in the study area 119,16038,2363.11
Total study area 264,953107,0582.5
Table 5. Estimation of beef self-sufficiency ratio.
Province Beef Area (Hectares)Estimated Beef Production (Tons) aEstimated Beef Consumption, by Year (Tons) aPopulationEstimated Beef Self- Sufficiency b
Alpes de Haute Provence 7145282286110,46623%
Hautes Alpes30622638118,43759%
Ardèche689251003674177,552139%
Bouche du Rhone12,161899940,7681,970,43622%
Drôme438532454343209,91175%
Gard4581339015,163732,86322%
Hérault64247513,085632,437444%
Lozère2733202215072311352%
Var00125860,7930%
Vaucluse28220911,470554,3932%
Total32,69624,19482,2554,474,519
a The production and consumption of beef was estimated in carcass weight. b The beef self-sufficiency ratio was the ratio of estimated beef production to estimated consumption in the 100 km-radius foodshed, calculated by province.
Table 6. Factors that characterize the beef feeding areas oriented toward short supply chains. The soundness of every factor is scored (“+++” high impact to “+” very low impact).
IMPACTFACTOR
++Rugosity
+++Dominance
++Location within Nature Park
+Distance from Slaughterhouse
Publisher’s Note: MDPI stays neutral with regard to jurisdictional claims in published maps and institutional affiliations.

