Article

Influence of Climate Variability and Soil Fertility on the Forage Quality and Productivity in Azorean Pastures

by
Catarina D. Melo
1,2,*,
Cristiana S. A. M. Maduro Dias
3,
Sophie Wallon
1,
Alfredo E. S. Borba
3,
João Madruga
3,
Paulo A. V. Borges
1,
Maria T. Ferreira
1,4 and
Rui B. Elias
1
1
cE3c—Centre for Ecology, Evolution and Environmental Changes, Azorean Biodiversity Group, Faculdade de Ciências Agrárias e do Ambiente, Universidade dos Açores, Rua Capitão João D’Ávila, São Pedro, PT-9700-042 Angra do Heroísmo, Portugal
2
CFE—Centre for Functional Ecology, Department of Life Sciences, University of Coimbra, PT-3001-401 Coimbra, Portugal
3
IITAA—Instituto de Investigação em Tecnologias Agrárias e do Ambiente, Faculdade de Ciências Agrárias e do Ambiente, Universidade dos Açores, Rua Capitão d’Ávila, São Pedro, PT-9700-042 Angra do Heroísmo, Portugal
4
SRAAC—Secretaria Regional do Ambiente e Alterações Climáticas-Edifício dos CTT Av. Antero de Quental, PT-9500-160 Ponta Delgada, Portugal
*
Author to whom correspondence should be addressed.
Agriculture 2022, 12(3), 358; https://doi.org/10.3390/agriculture12030358
Submission received: 31 December 2021 / Revised: 23 February 2022 / Accepted: 25 February 2022 / Published: 2 March 2022

Abstract

:
This work aimed to determine and compare the effect of elevation and season on the productivity and the nutritive value of pastures in the Azores (Terceira Island). Forage was collected and analysed for dry matter (DM), crude protein (CP), neutral detergent fibre (NDF), acid detergent fibre (ADF), acid detergent lignin (ADL), ether extract (EE), mineral ash (Ash), dry matter digestibility (DMD) and organic matter digestibility (OMD). The net productivity (NP) was higher in the low elevation pasture A (1.80 g m−2), lower in pasture B (0.98 g m−2) and peaked in the winter in both pastures A (3.57 g m−2) and B (2.33 g m−2) and during the summer in the high elevation pasture C (2.15 g m−2). The soil chemical proprieties varied significantly among the three pastures. The highest soil pH, available P, K, Ca and Mg were recorded in pasture A. Positive correlations were observed between all soil parameters analysed and NP, except for the OM content. The DM, PB and EE changed significantly with elevation, while all nutritive parameters (except CP, EE and Ash) increased significantly along the growth season. Environmental factors influenced the nutritive parameters and productivity, suggesting that climate change might have significant impacts on forage production and quality.

1. Introduction

Climate change reflects long-term regional, or even global, changes on average temperature, humidity and rainfall patterns over seasons, years, or decades [1]. Recently, several climate models have been proposed to better understand and plan in advance the future impacts of climate changes. These models suggest that the average precipitation will increase, although reductions are likely to happen in particular regions [2,3]. However, the magnitude of regional precipitation change varies considerably amongst models and, in many areas, is less than the standard deviations of model-estimated natural variability [4]. At the same time, other biodiversity erosion drivers, such as habitat fragmentation, habitat loss and invasive species, promote the loss of biodiversity.
These biodiversity erosion drivers particularly impact island ecosystems [5]. Adding pressures on ecosystem services are the major pressing global environmental challenges, while land cover and land-use change are leading contributors to habitat fragmentation, habitat loss and reduced biodiversity [6]. Forage pastures are the main source of nutrition for most ruminant livestock, contributing greatly to milk and meat production [7,8]. According to the Food and Agriculture Organization (FAO), it is estimated that forage pastures represent 26% of the land area and about 70% of the agricultural area [9]. However, while forage pastures are an economic source of nutrients for livestock production, they also contribute to conserving soil integrity, water supply and air quality [10].
The impacts of the increased climate variability and frequency of extreme weather events on livestock and pasture systems are unknown in most regions of the world, making the recommendation of viable, practical adaptation paths even harder. However, several works have indicated that climate change has the potential to impact the quantity and reliability of forage production [11,12], forage quality [13,14], thermal stress on livestock, water demands for both animal needs and growing forage [15] and large-scale plant community structure and composition [16,17]. Moreover, climate change also impacts livestock digestion by changing the physical and chemical characteristics of forages and affecting the digestive processes [4,18].
The Azorean livestock, particularly dairy, had a major expansion especially in the second half of the twentieth century, making it the dominant economic activity in this archipelago, comprising about 30% of the milk production in Portugal [19]. Over the centuries, the semi-natural pastures resulting from the conversion of the natural forest have been the basis for Azorean livestock [20]. In general, these pastures are in low/mid altitudes, which favours a main grass production period in spring with two clear periods of scarcity in both summer (particularly August and September) and winter (November through February) [21].
Lately, in answer to high stocking rates, intensively managed pastures, especially located at low altitudes, became dominant in Azores. Many species of grass are present in both types of pastures; however, the semi-natural pastures are comprised mainly by Yorkshire grass (Holcus lanatus L.), while intensively managed pastures are mainly covered by white clover (Trifolium repens L.), perennial ryegrass (Lolium perenne L.) and annual ryegrass (Lolium multiflorum Lam.) [20]. Most species used in the Azorean pastures are C3 plants, with the C4 maize used mainly for silage.
In a traditional grazing system in which milk production accompanies the grass production cycle, exploiting the seasonal growth patterns of different pasture species could make grazing systems more resilient to the impact of climate change, which could represent a gain for farm’s profitability [22]. The main obstacle of livestock farms in the Azores is a shortage of forage, especially in the lowlands during the dry season [23]. When there is not enough pasture for livestock feed, the nutritional requirements for animals are met by full hand-feedings, such as concentrates and other plants (Pittosporum undulatum Vent., Hedychium gardnerianum Sheppard ex Ker-Gawl., Morella faya Aiton and Ilex azorica Gand. (Holly) [23]. The low feeding value of these foods could affect the maintenance needs of ruminant livestock [21].
Concerning climatic changes, in addition to the consequences of increasing temperatures, changes in precipitation patterns may have significant impacts for the Azores due to possible changes in rain patterns that may result in drier summers and an increase in flooding events during the winter [24]. The expected increase in temperature for the Azores for the 2070–2099 period ranges between +1.5 and +1.7 °C (for the RCP 4.5 scenario) and between +2.5 and +2.8 °C (for the RCP 8.5 scenario) [25]. For Terceira, the predictions are of an annual increase in temperature between +1.7 and +2.8 °C, in the best- and worst-case scenarios, respectively, for the 2070–2099 period [25]. However, no studies are looking into climate change effects on grasslands on volcanic islands.
Due to their particular soil origin and composition, the effects of climate change on nutrient availability and grassland production may be different from what has been observed elsewhere. The nutritional status of a forage crop depends upon the concentration (and ratios) of carbohydrates, proteins and lipids. The composition of these organic nutrients determines the digestibility of each crop, partitioning of metabolised products in the digestive tract and forage intake; it thus strongly affects animal performance [4,17].
There are several agronomic nutritive parameters (dry matter—DM, crude protein—CP, neutral detergent fibre—NDF, acid detergent lignin—ADL, acid detergent fibre—ADF, ether extract—EE, mineral ash—Ash and digestibility of dry and organic matter—DMD and OMD, respectively) likely to be affected by climate change [17,26]. Increased temperature was shown to increase the NDF, ADF and ADL contents [4] and to decrease the CP and digestibility contents [27]. However, there is currently not enough information about the seasonal availability and nutritional value of pastures that support dairy and beef cattle.
As a result, farmers cannot accurately determine the extent to which pastures are able to meet the nutritional needs of livestock using supplementary concentrate feeds. Therefore, a multiparameter analysis is needed to estimate the value of forage plants to livestock and to develop more efficient and effective systems of pasture management, which is prerequisite to predict nutrient intake more accurately from pastures by the grazing animal [17,28].
The main objective of this study is therefore to quantitatively determine and compare the productivity and the nutritive value of three pastures located at three altitudinal levels and the extent to which these differences also vary between seasons.

2. Material and Methods

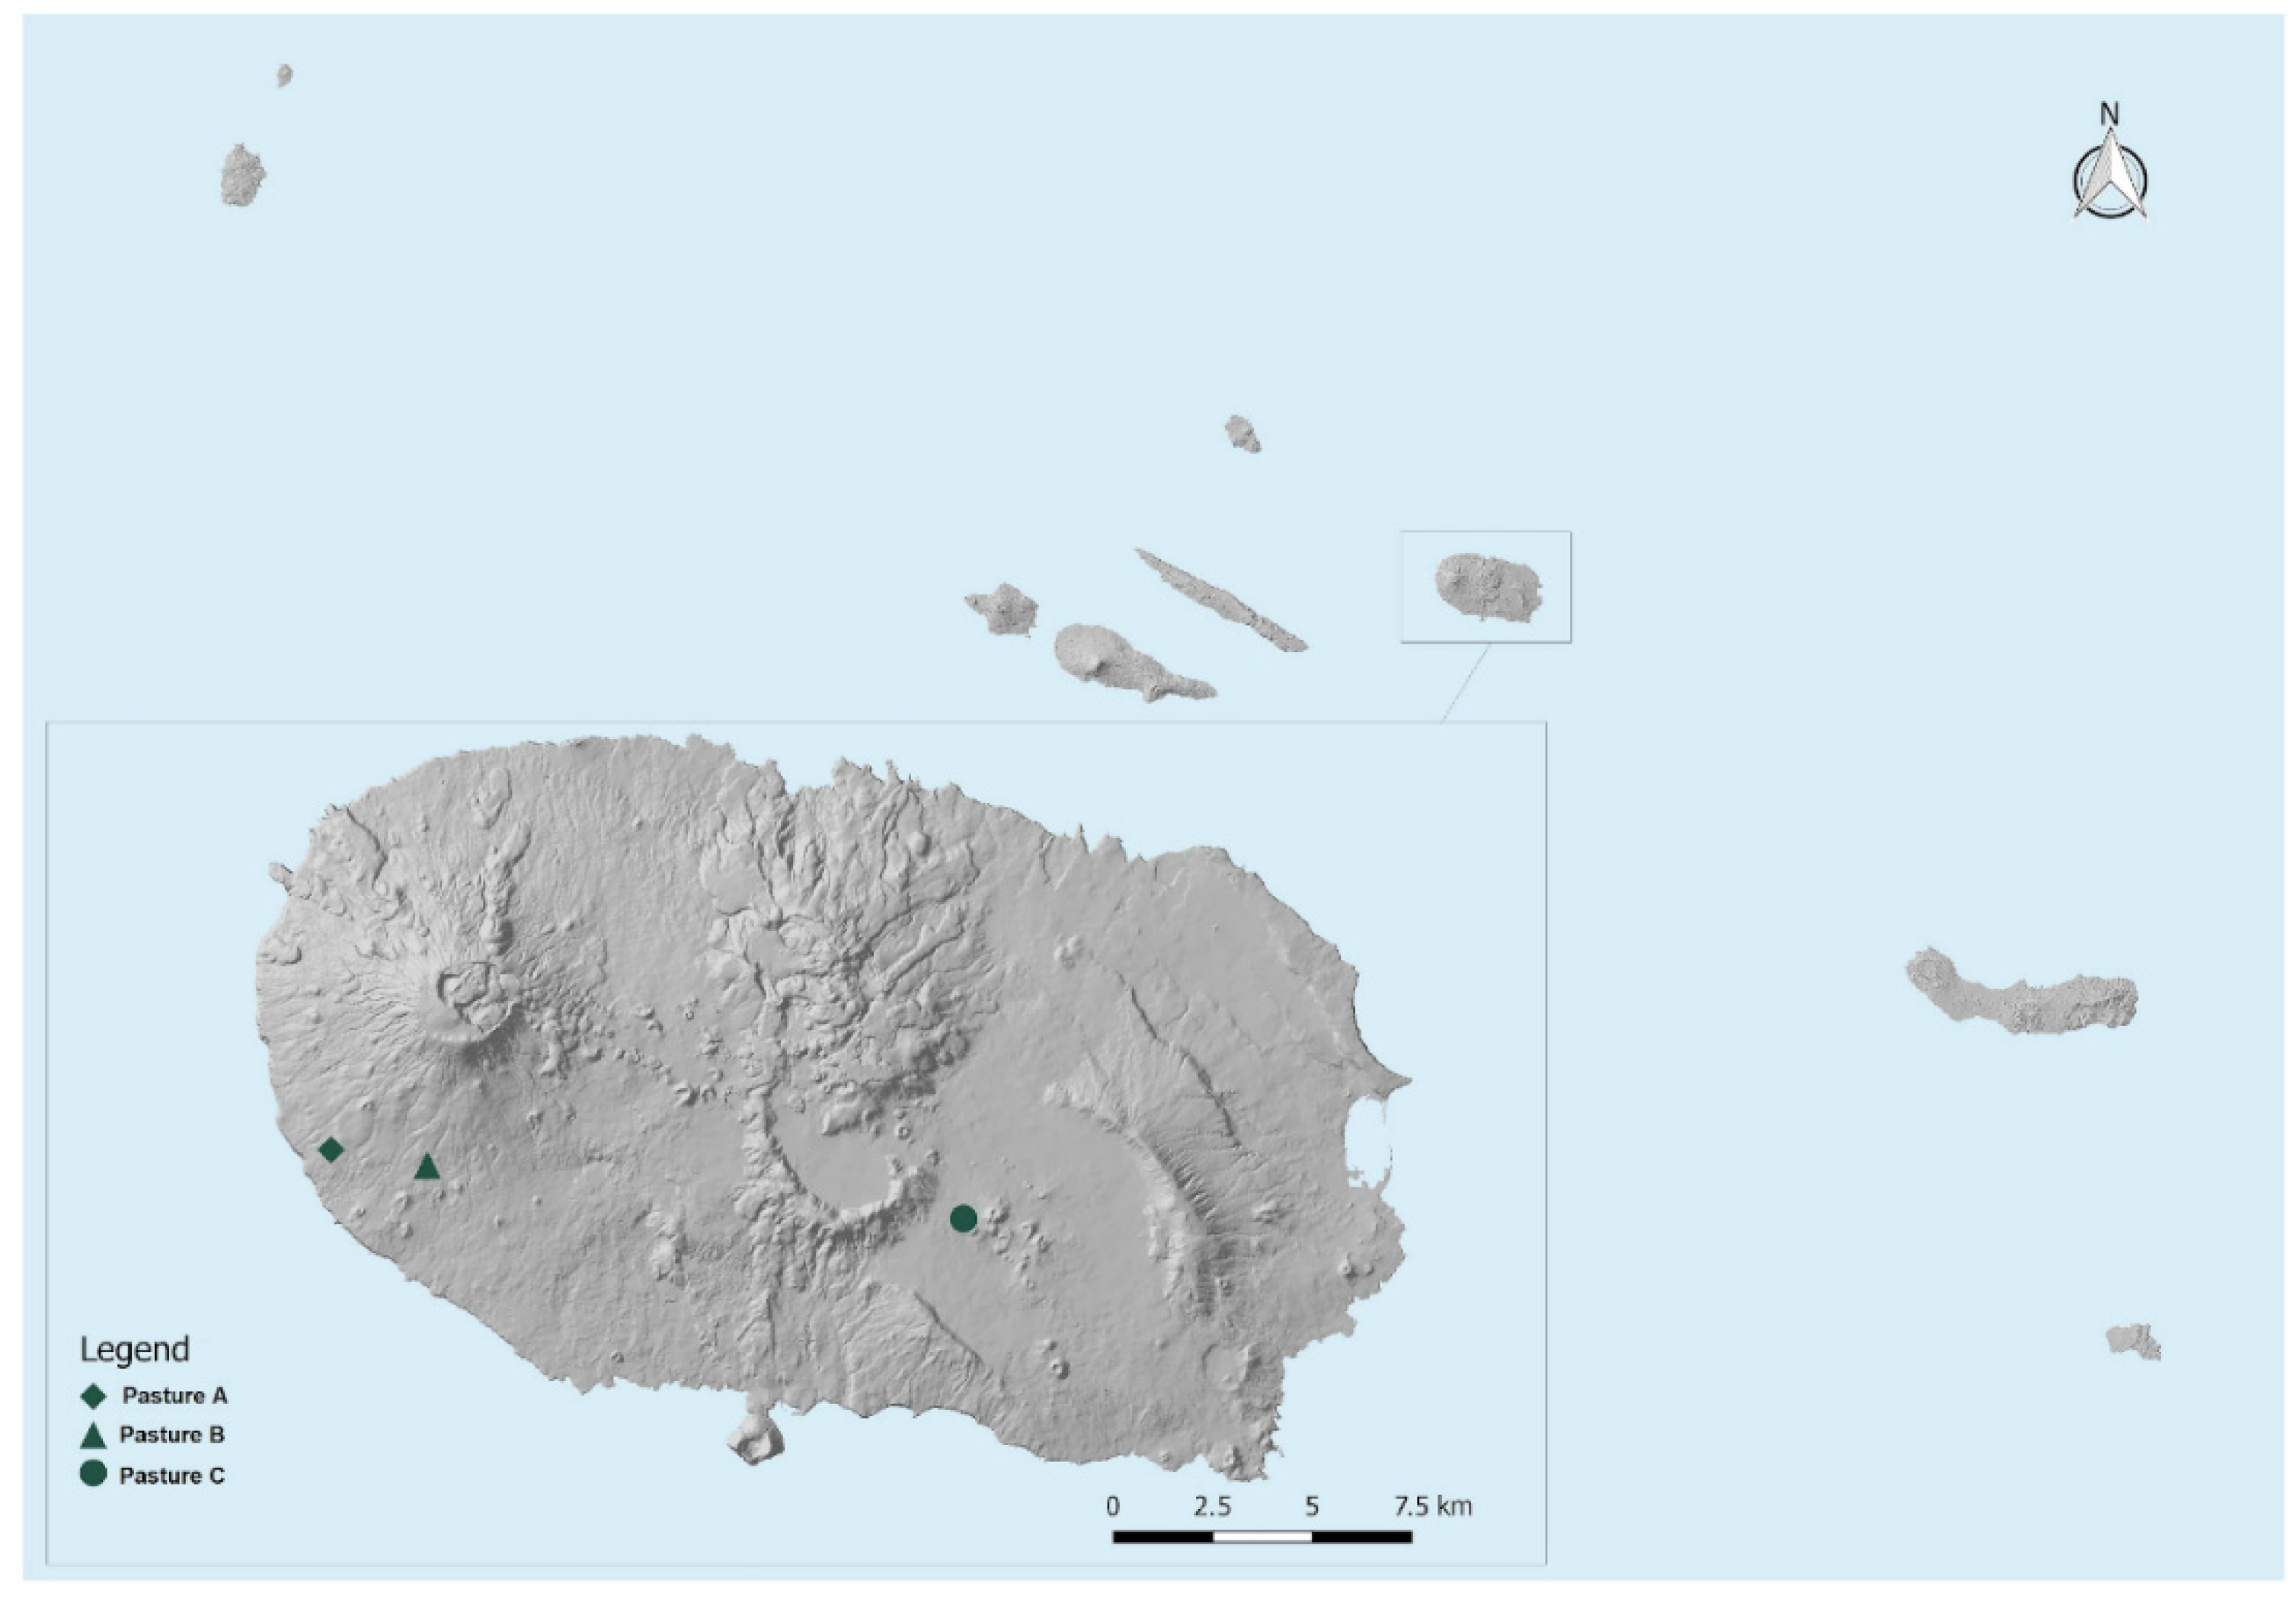
2.1. Experimental Design

Despite ranging from temperate with dry summers (in a few coastal areas) to tundra (high in Pico Mountain), the dominant climate in the Azores is temperate with no dry season (Cfb, according to the Köppen Climate Classification) [29]. This study took place in the third largest island of the archipelago-Terceira Island (400 Km2). As in other islands, the dominant land use of Terceira has changed drastically since the beginning of Portuguese settlement (more than 500 years ago) from native forests to pastures [30,31].
The sampling areas were set on three intensively managed pastures located at three different altitudes (Figure 1). Pasture A is located at 186 m (latitude: 38.703596° N; longitude: −27.353805° W), pasture B at 301 m (latitude: 38.701639° N; longitude: −27.325783° W) and pasture C at 386 m (latitude: 38.697770° N; longitude: −27.170075° W). Pastures A and B are dominated by Lolium multiflorum and Holcus lanatus dominates in pasture C. For the analyses of the nutritive parameters, we only used L. multiflorum (pastures A and B) and H. lanatus (pasture C), excluding all other species. At each altitudinal level, 10 plots were set up each one with an area of 1 × 1 m, i.e., a total of 30 plots among the three pastures.

2.2. Forage Collection and Preparation

Plant samples (including whole plant-leaves and pseudo stems) were manually harvested (about 15 cm above the soil). Harvesting of all plots in the three fields, in each sampling period, took place within a two week period: in February 2020 (winter), March 2020 (early spring), June 2020 (late spring) and August 2020 (summer). Summer sampling at pasture A was not possible because the grasses dried up.
The normal management in low altitude pastures implies reseeding every year after the summer, when the weather is drier and grasses die. This is also the case of pasture B; however, because the altitude is higher, grasses dry up later in the summer. As grasses were reseeded in September, sampling in the autumn in fields A and B were not possible. The herbage was ground in a laboratory-type mill to a length of 2 to 3 cm. Lab work was conducted in the Animal Nutrition Lab, Department of Agricultural Sciences, University of the Azores, located in Angra do Heroísmo, Terceira, Azores, Portugal.

2.3. Soil Analysis

Soil samples were collected from each soil plot during the late spring/2020 sampling, and the analysis of the different soil chemical parameters was performed at the University of Azores Soil Laboratory (CITA-A). Potassium (K), calcium (Ca) and magnesium (Mg) were extracted with sodium acetate (1/5) at pH 7 and determined using a Varian ICP atomic emission spectrophotometer. Soil pH was determined from a soil and water paste (1:2.5 v/v) and available phosphorus (P) [32] by atomic absorption spectrometry after extraction with a 0.5 M NaHCO3 solution at pH 8.5. Organic matter (OM) was also measured by dry-ashing.

2.4. Nutritive Parameters

The parameters analysed in this study were the dry matter (DM), crude protein (CP), neutral detergent fibre (NDF), acid detergent lignin (ADL), acid detergent fibre (ADF), ether extract (EE), mineral ash (Ash) and digestibility of dry and organic matter (DMD and OMD, respectively).

2.5. Chemical Analysis

For chemical characterisation of the forage, the DM contents of the herbage were determined by the Weende system (DM, method 930.15), CP (CP, method 954.01), EE (EE, method 920.39) and total Ash (method 942.05) following the methods of AOAC [33]. The DM content of forage was determined by drying the samples at 68 °C until a steady weight and placing them in a forced air oven at 105 °C for 24 h. The total Ash was evaluated by igniting samples in a muffle furnace at 500 °C for 12 h. CP was measured by the Kjeldahl method and EE was determined by refluxing forage samples with petroleum ether in a Soxhlet system. The NDF, ADF and ADL were determined according to Goering and Van Soest [34]. Both NDF and ADF were expressed without residual Ash. The in vitro DMD and OMD were measured according to the method of Tilley and Terry [35], modified by Alexander and McGowan [36].

2.6. Data Analysis

The soil parameters and net productivity were tested by one-way analysis of variance, followed by Tukey honestly significant difference test at p < 0.05, to evaluate the differences among pastures. Since only complete soil parameters were available for the late spring/2020 sampling, all analyses, including soil parameters, were performed only for this sampling date. Pearson correlations coefficients were calculated between soil parameters and the net productivity of each pasture.
Linear regression analyses were used to correlate DM, CP, NDF, ADF, ADL, EE and Ash (explanatory variables) with DMD and OMD (response variables). Variation among sampling dates within each pasture was evaluated using ANOVA followed by Tukey tests. Normality tests were performed, and data of the percentage of different nutritive parameters were arcsine-transformed to fulfil the ANOVA purposes.
Variation among the three pastures for each nutritive metric was not normally distributed, and the data transformation did not allow parametric analysis. Therefore, the Kruskal–Wallis one-way analysis of variance by ranks test was used to compare the data. The multiple comparisons between the samples also were analysed with the non-parametric method of Kruskal–Wallis. All analyses were computed using SPSS Version 27 [37].
To explore the impacts of environmental factors on the values of the different nutritive parameters distribution, redundancy analysis (RDA) was executed and drawn in Canoco 5.0 [38]. Climate data based on the mean values of temperature, relative humidity and rainfall for each sampling date (winter 2020, early spring 2020, late spring and summer 2020) were estimated by the CIELO model [39], which was calibrated and validated for the Terceira Island. The climatic environmental variables of the CIELO model are related to the site characteristics and apply to regional scales and, therefore, were applied for all plots within each pasture.

3. Results

3.1. Climatic and Soil Analysis

As expected, the annual rainfall and relative air humidity increased with altitude (Table 1). In field A, it rained less ca. 800 mm than field C, and the rainfall in the driest month was only 35 mm. On the contrary, average annual temperature was 1.6 °C higher in field A relative to field C.
The soil from the three pastures varied significantly in all the measured chemical properties (Table 1). Soil pH varied significantly among the three pastures (One-way ANOVA: F2,29 = 59.10, p < 0.001). Pasture A showed the highest soil pH and pasture C the lowest. The OM content (One-way ANOVA: F2,29 = 36.04, p < 0.001) also changed significantly among sites (Table 1). The highest values of OM were observed in pasture C followed pasture B and the lowest in pasture A. The soil available P (One-way ANOVA: F2,29 = 41.04, p < 0.001) and K (One-way ANOVA: F2,29 = 3.87, p < 0.05), varied significantly among sites (Table 1).
Concerning these two soil parameters, the highest values were observed in pasture A except for the available K, which was similar in both lowland pastures and the lowest in pasture C for both parameters. Significant differences were also found in the available Ca (One-way ANOVA: F2,29 = 123.38, p < 0.001) and Mg (One-way ANOVA: F2,29 = 41.53, p < 0.001) among the three pastures (Table 1). For pasture C, Ca and Mg values were significantly lower than for pastures A and B, although no significant difference was found in Mg content between pastures C and B.

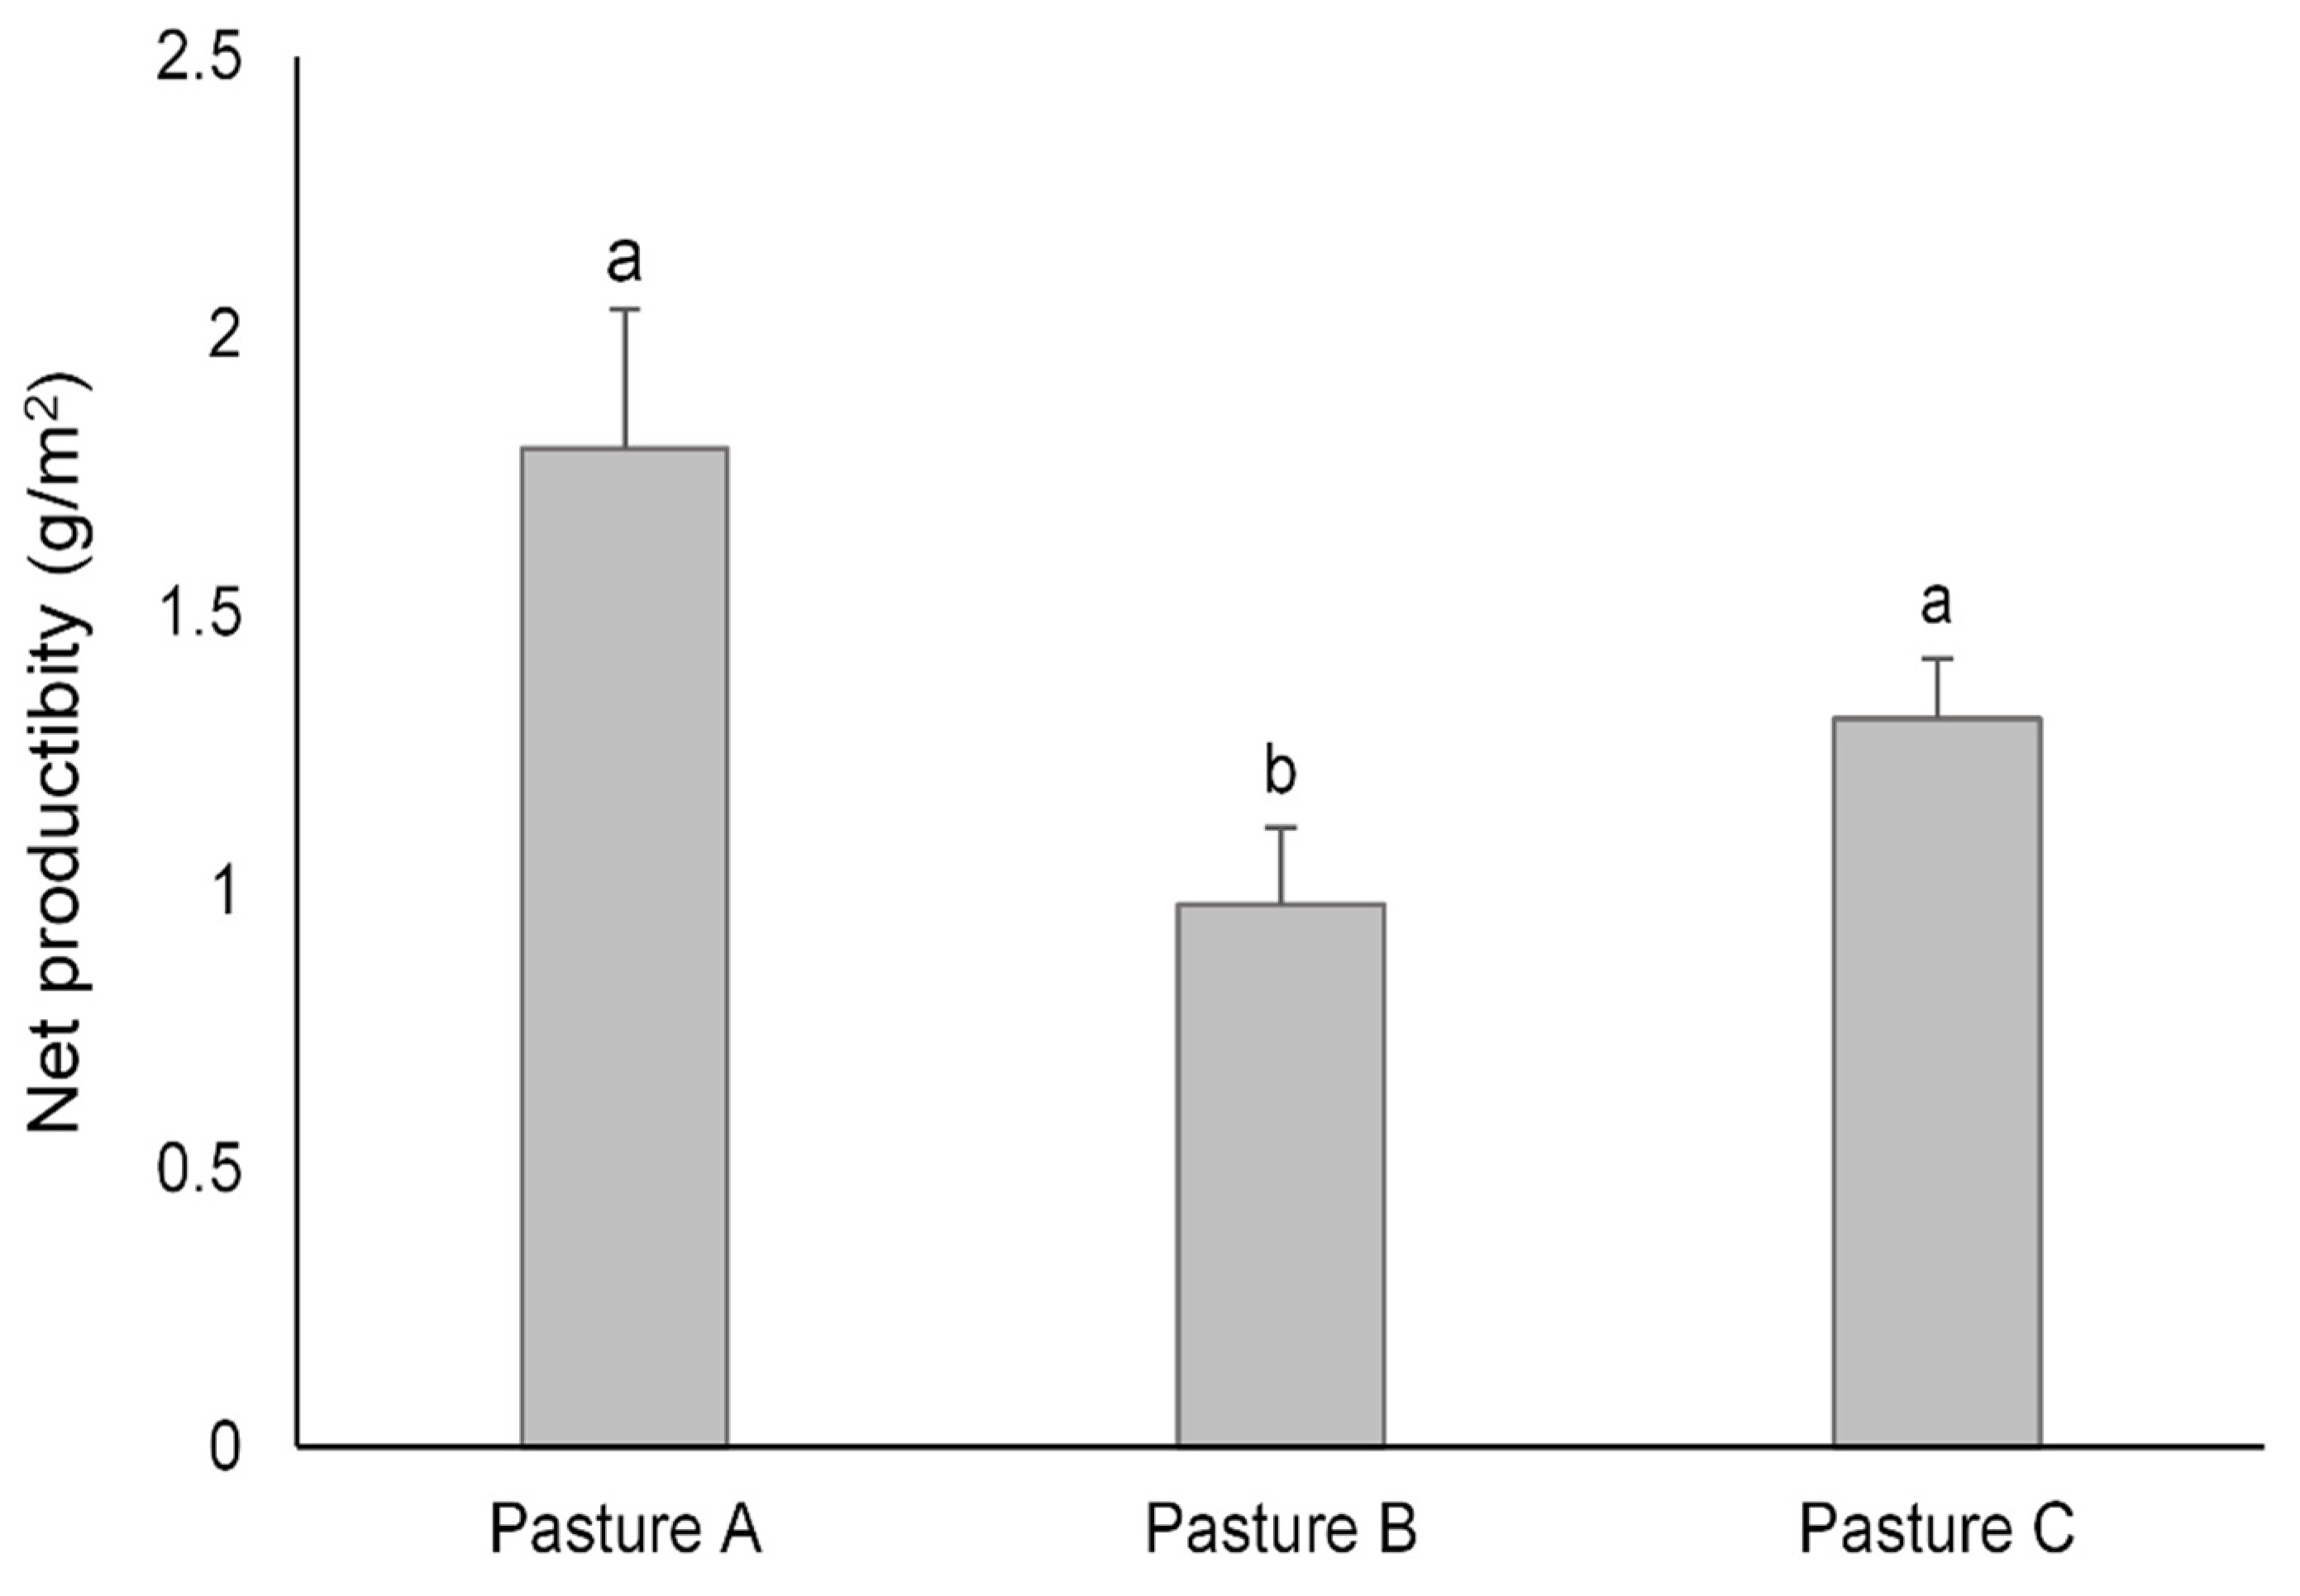
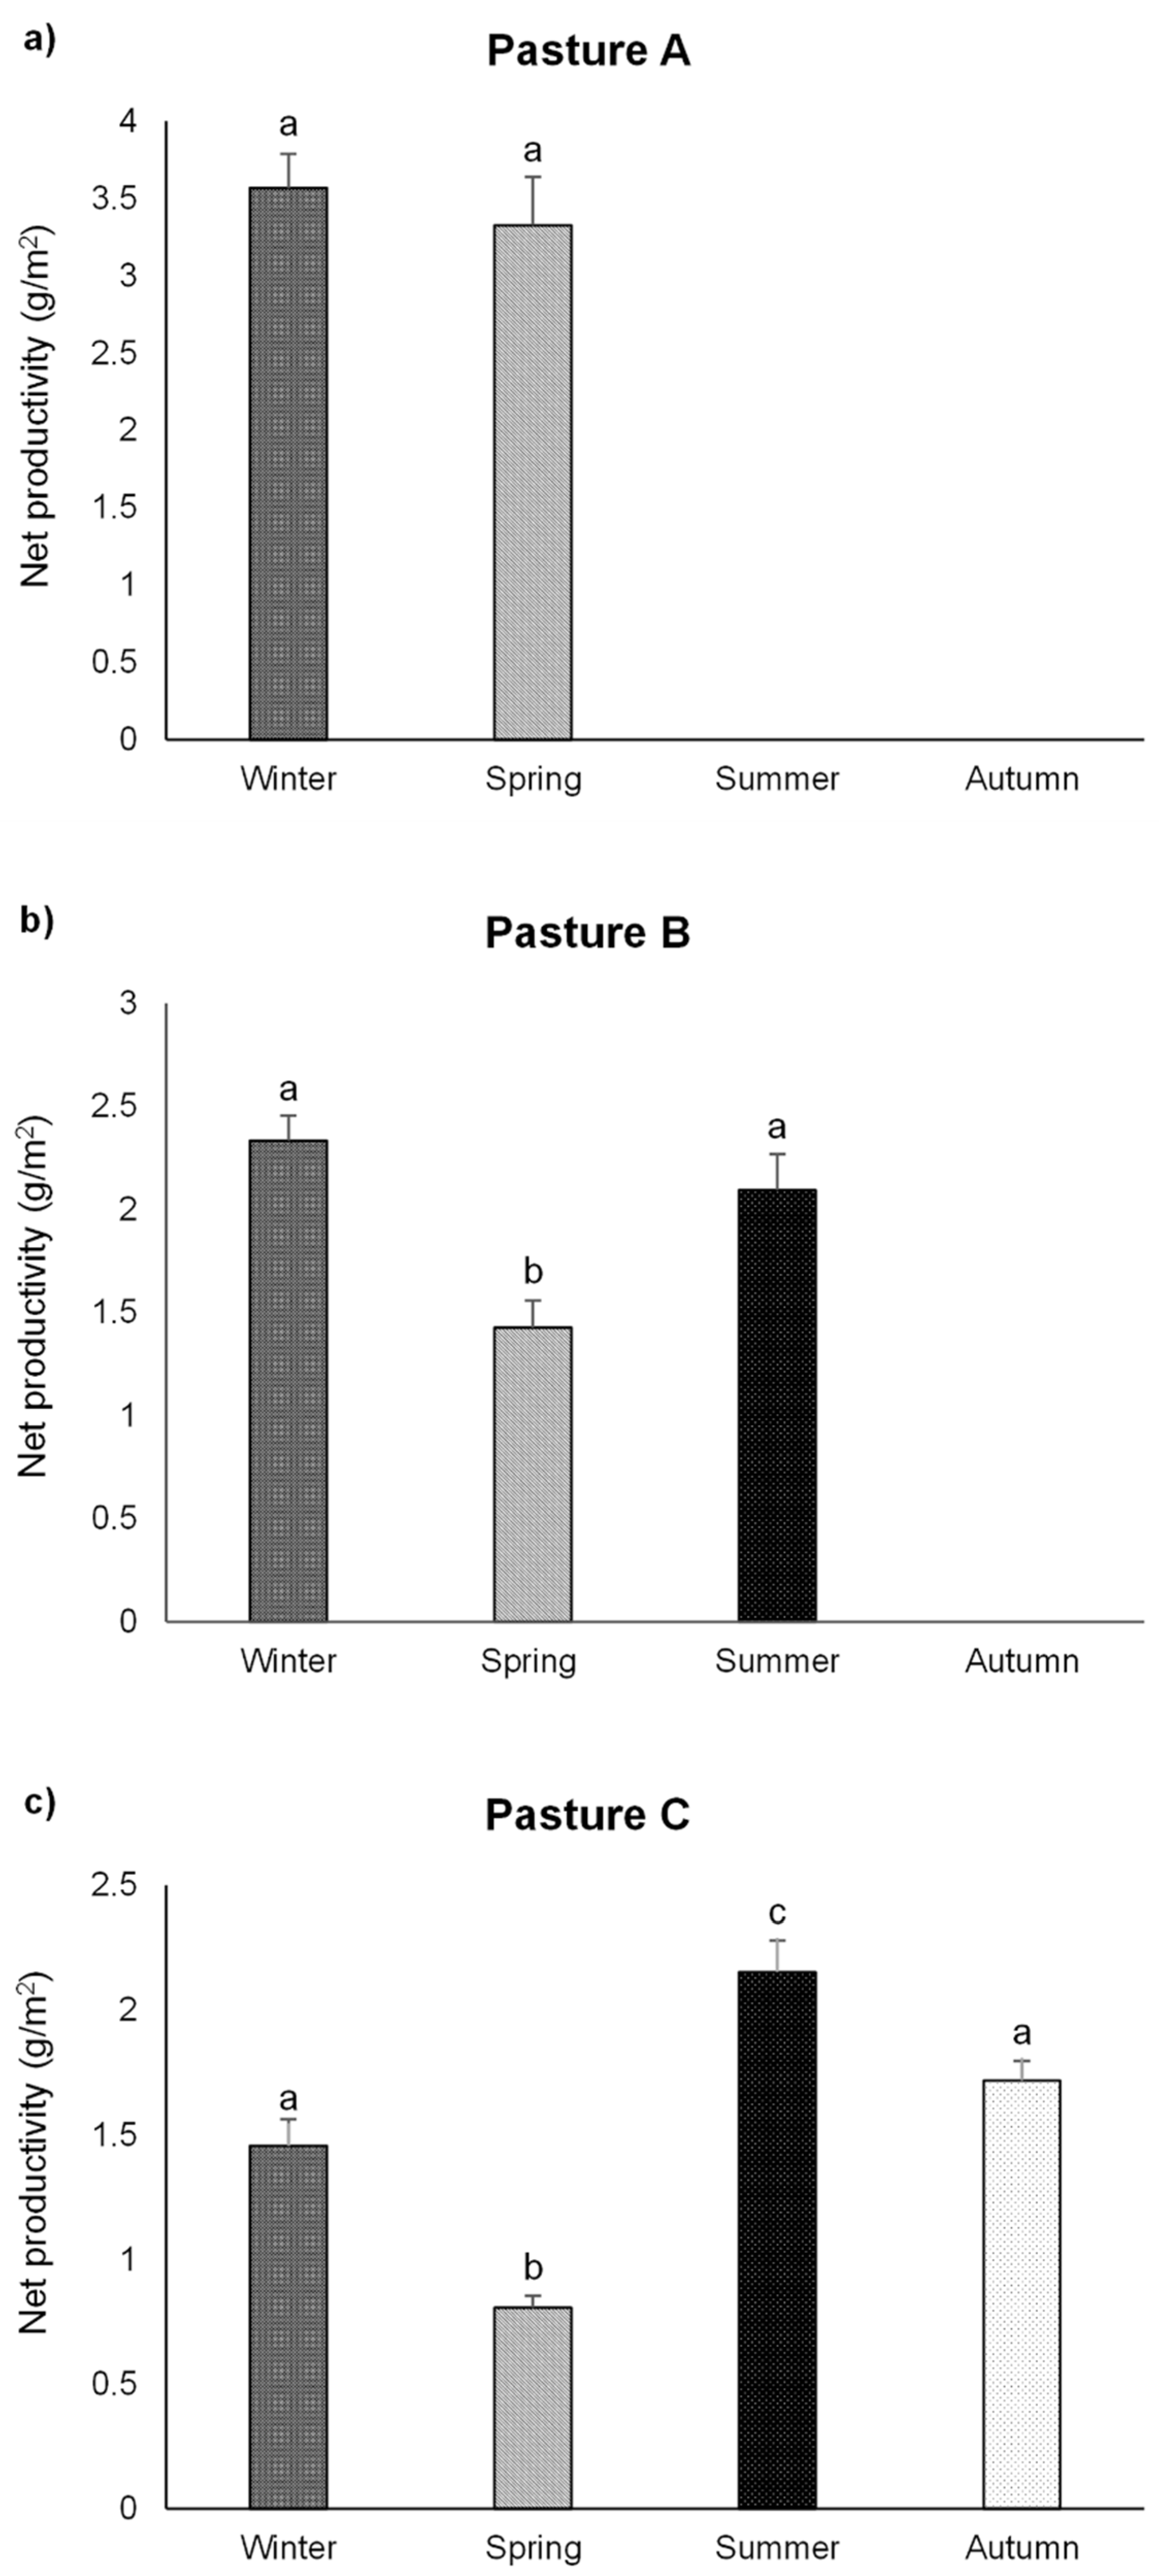
3.2. Forage Production

The forage net productivity (NP) varied significantly between the three pastures (one-way ANOVA: F2,119 = 5.47, p < 0.01). Pasture A showed the highest NP (1.80 g m−2) and pasture B the lowest one (0.98 g m−2) (Figure 2). However, no significant difference was observed between pastures A and C (Figure 2).
The forage net productivity also changed significantly along the growth season in all pastures. In pasture A (one-way ANOVA: F3,39 = 108.11, p < 0.001), the NP was similar in the winter and spring, and no production was recorded during the following seasons (summer and autumn). (Figure 3a). Pasture B (one-way ANOVA: F2,39 = 69.92, p < 0.001) showed two peaks of productivity—in the winter and summer (Figure 3b); however, the lowest productivity was recorded during the spring, and no production was observed in the autumn (Figure 3a). Pasture C showed a marked seasonality in the forage NP (one-way ANOVA: F3,39 = 35.53, p < 0.001). The highest productivity was recorded in the summer and the lowest in the spring (Figure 3c). However, no difference was observed in the productivity during the coolest seasons (autumn and winter) (Figure 3c).
Pearson correlation coefficients revealed clear relationships between the NP and soil parameters. The net productivity was positively correlated with Mg (Pearson’s r = 0.78), Ca (Pearson’s r = 0.73), pH (Pearson’s r = 0.73), P (Pearson’s r = 0.64) at p < 0.001 and with K (Pearson’s r = 0.38) at p < 0.05. A negative correlation was observed between the net productivity and OM content (r = −0.62, p < 0.001).

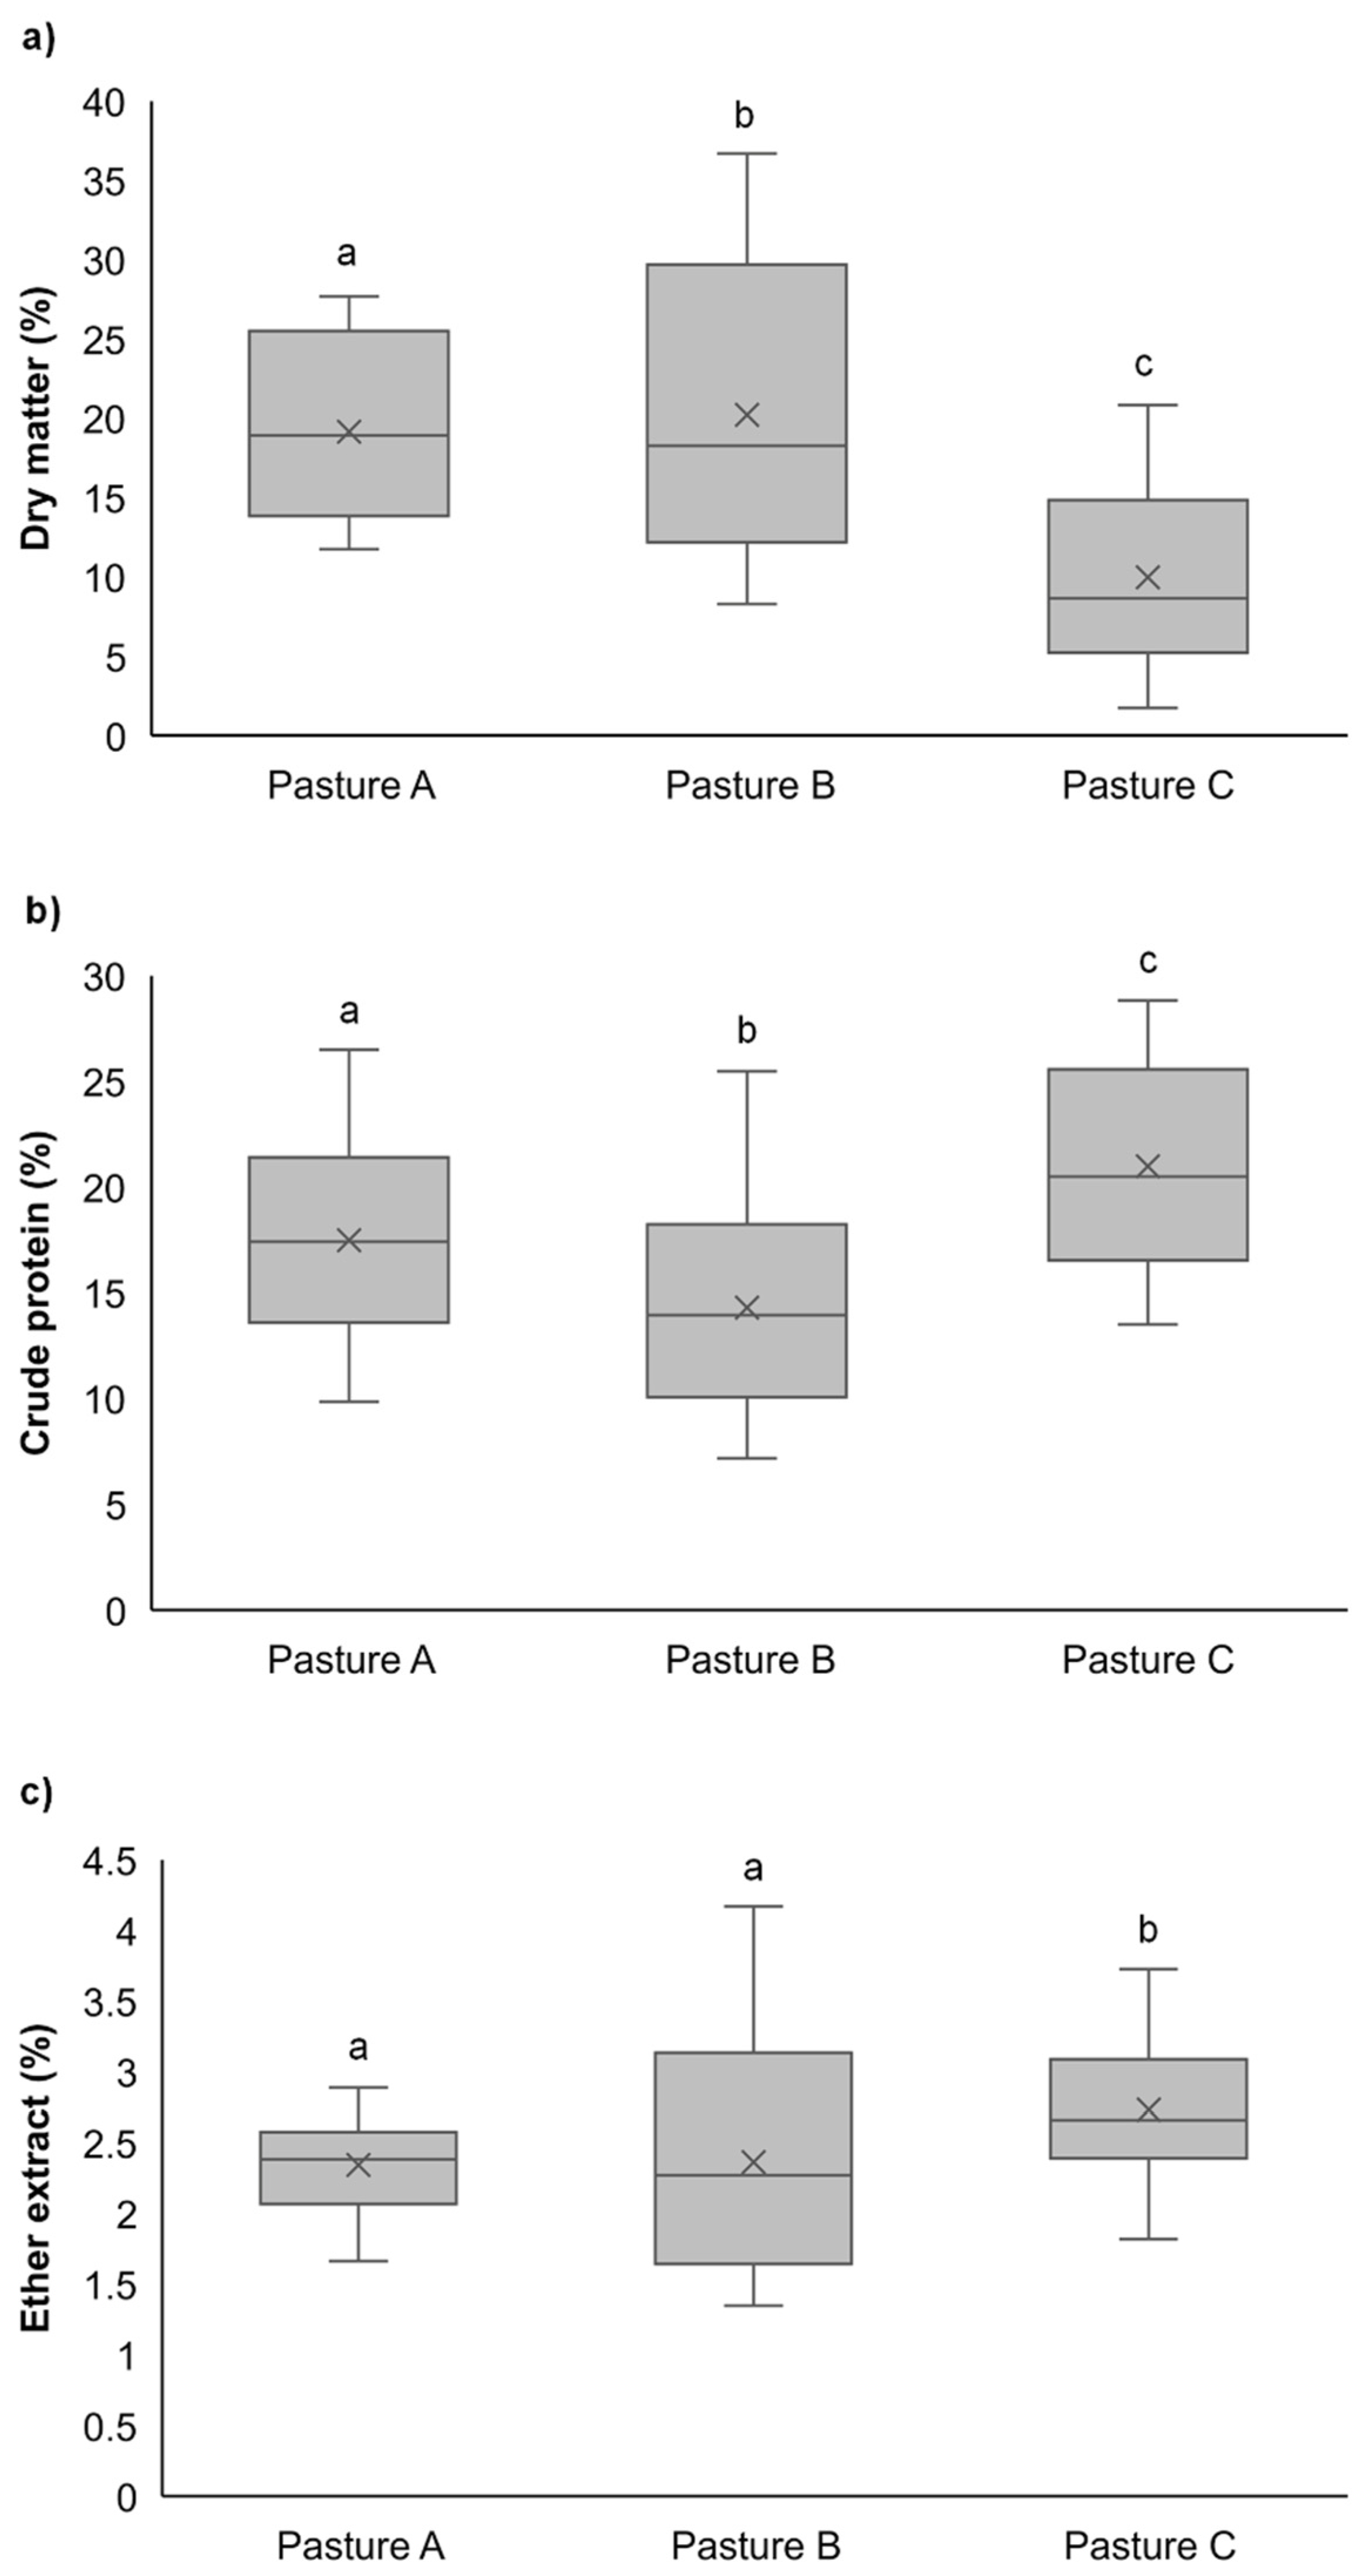
3.3. Comparison of Nutritive Parameters

During the four sampling dates, the mean DM among the three pastures was 16.15%. The mean values for ADF and NDF were 30.98% and 64.65%, respectively. The mean CP was 17.60%, mean Ash 11.01% and mean ADL 3.23%. Digestibility of dry matter and organic matter were 57.15% and 52.05%, respectively. The range of values for both digestibilities was identical, with DMD ranging from 40.56% to 76.87% and from 37.21% to 75.88% for DMO. In terms of the other nutritive parameters, NDF had the largest range of values, ranging from 15.11 to 86.89%, followed by DM at 1.67–36.69%, CP at 7.17–28.81%, ADF at 21.11–39.46% Ash at 6.86–15.61%, ADL at 1.50–10.67% and EE at 1.35–4.17%. Several correlations of the nutritive parameters with DMD and OMD were found (Table 2).
ADF and NDF were negatively correlated with both DMD and OMD (Table 2) (Figure 4a–c); however, the degree of fit was much lower for NDF than for ADF (Figure 4c,d). ADL and DM were also negatively correlated with DMD. CP, Ash and EE were the only parameters positively correlated with both digestibilities (Table 2); however, the variation explained by the CP regression line was stronger than the other nutritive parameters (Figure 4e,f).

3.4. Altitudinal Variation of Nutritive Parameters

Among the different nutritive parameters analysed, only DM (Kruskal–Wallis test; DM: H = 37.03, p < 0.001), CP (Kruskal–Wallis test; CP: H = 29.26, p < 0.001) and EE (Kruskal–Wallis test; EE: H = 11.91, p < 0.01) varied significantly among the three pastures. DM was higher in pasture A and lower in pasture C, although no significant difference occurred between pastures A and B (Figure 5a). The opposite was observed regarding the CP, i.e., this was higher in pasture C and lower in pasture A (Figure 5b). EE was higher in pasture C and lower in pasture B, although no significant difference was observed between pastures A and B (Figure 5c).
In terms of the digestibility, only OMD changed significantly among the three pastures (Kruskal–Wallis test; DM: H = 5.82, p < 0.01), being higher in pasture A and lower in pasture B. However, no change was observed between pasture A and B for OMD.

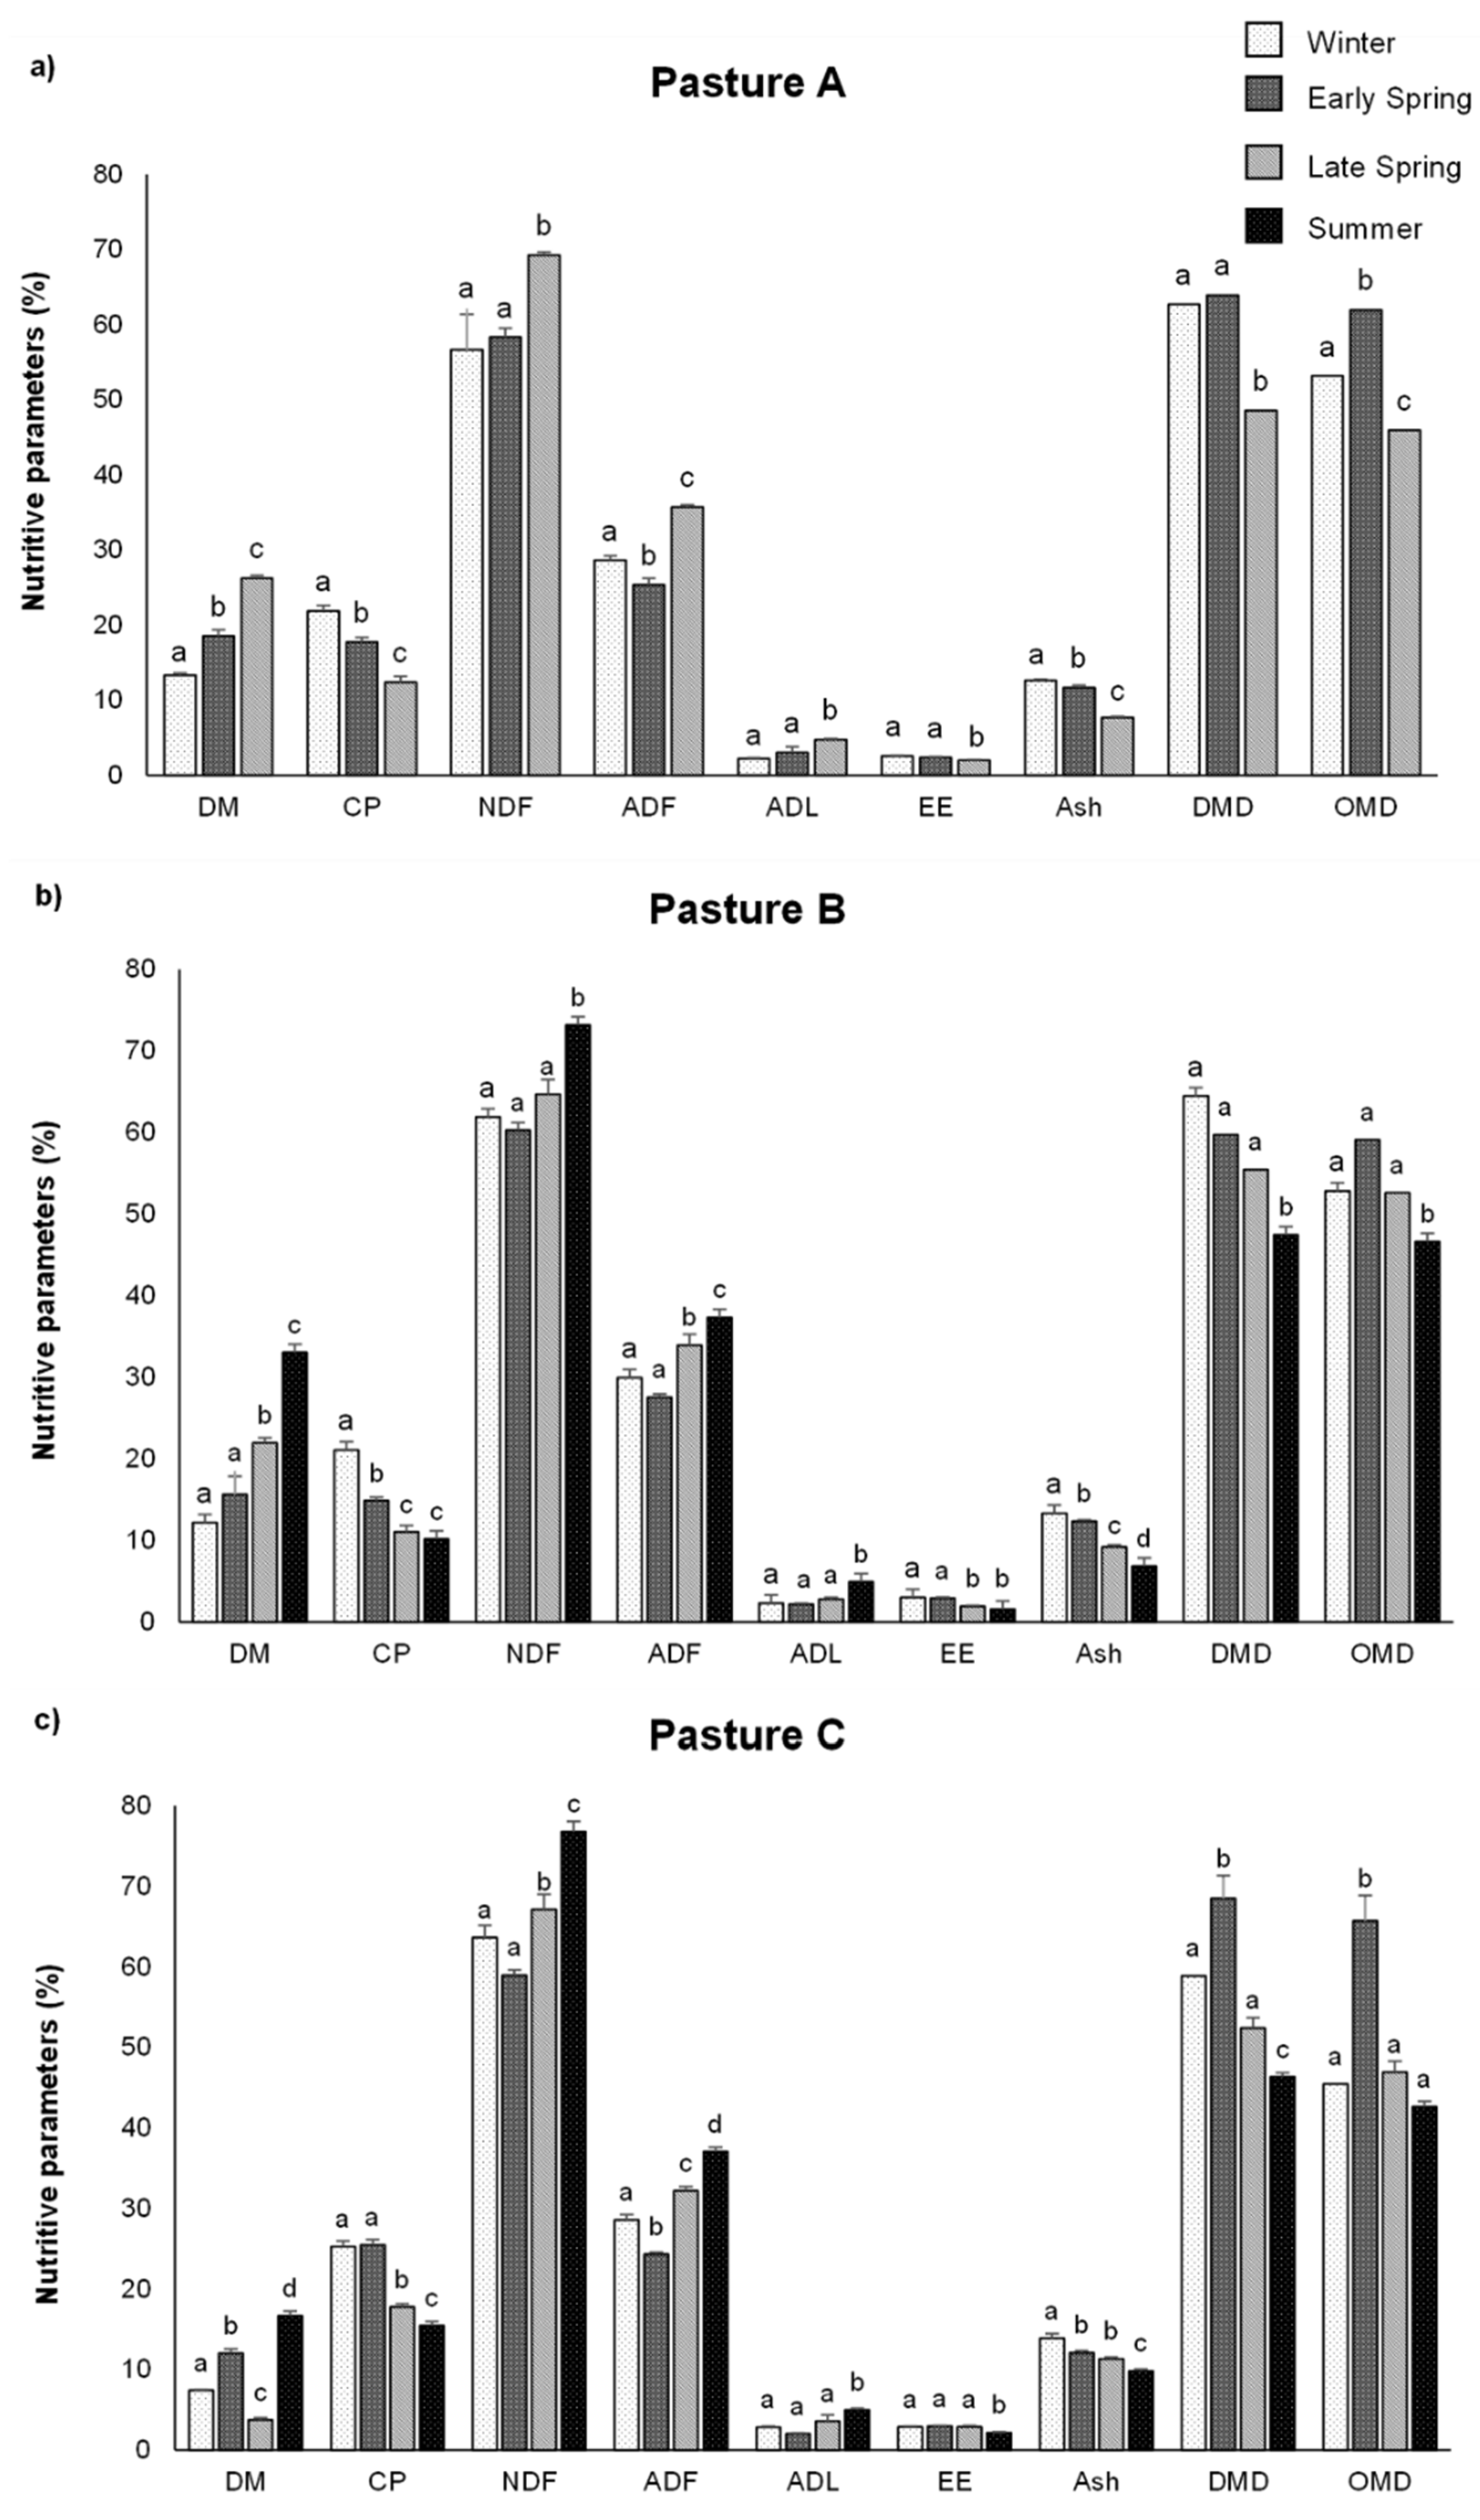
3.5. Seasonal Influence on Nutritive Parameters

All nutritive parameters analysed showed a marked temporal pattern among sampling dates in the three pastures (Table 3), particularly between the winter and the summer with an increase along the growth season for almost all nutritive parameters, except for the CP, EE and Ash (Figure 6).
The DM values varied significantly among sampling dates in all pastures (Table 3). The lowest values of DM were recorded during the winter in pastures A (13.34%, Figure 6a) and B (12.20%; Figure 6b) and in the late spring in pasture C (3.76%, Figure 6c). The DM values peaked at the late spring in pasture A (26.25%, Figure 6a) and in the summer in both pastures B (33.07%, Figure 6b) and C (16.66%, Figure 6c). Nevertheless, no significant differences were observed in the DM values between the winter and the early spring in pasture B (Figure 6b).
The CP values also changed significantly among sampling dates (Table 3) but showed an opposite pattern i.e., decreased along the growth season (Figure 6). The CP values were higher in the winter in both lowland pastures (21.86% and 21.10%, Figure 6a,b, respectively) and in the early spring in pasture C (25.47%, Figure 6c). The lowest CP values were observed during the late spring at pasture A (12.38%, Figure 6a) and in the summer at both pastures B (10.18%, Figure 6b) and C (15.49%, Figure 6c). However, no significant differences were found in the CP values between late spring and summer in pasture B (Figure 6b) either in pasture C between winter or early spring (Figure 6c).
There was great variation of fibre values (NDF and ADF) among sampling dates (Table 3). The NDF values peaked in the late spring in pasture A (69.24%, Figure 6a) and in the summer in both pasture B and C (73.19% and 76.76%, respectively, Figure 6b,c), but decreased in the winter in pasture A (56.68%, Figure 6a) and in the early spring in pastures B and C (60.31% and 58.97%, respectively, Figure 6b,c).
However, no significant differences were observed in the NDF values between winter and early spring in lowlands pastures (Figure 6a,b) and even among the first three sampling dates in pasture C (Figure 6c). In relation to ADF values, the general trend was a decrease in the early spring in the three pastures (Figure 6) and an increase in the summer (Figure 6), except for pasture A, which showed the highest value in the late spring (35.74%, Figure 6a). Nevertheless, in pasture B, the ADF values did not change significantly between the winter and the early spring (Figure 6b).
Regarding the ADL values, these also varied significantly among sampling dates (Table 3) and were lower in the early spring and peaked at summer in both pastures B (2.17% and 4.94%, respectively, Figure 6b) and C (2.02% and 5.0%, respectively, Figure 6b). However, no significant differences were found among the three first sampling dates in both pastures (Figure 6b,c). In pasture A, the ADL values were higher in the late spring (4.78%, Figure 6a) and lower in the winter (2.23%, Figure 6a); however, no significant differences were observed between this season and the following (Figure 6a).
The opposite was found in relation to EE, i.e., peaked in the winter in pastures A (2.58%, Figure 6a) and B (3.02%, Figure 6b) but decreased during the late spring in pasture A (2.02%, Figure 6a) and in summer in pastures B (1.58%, Figure 6b). Despite the differences in EE values between the cold and warm seasons in the lowland pastures, no significant differences were observed between the winter and the early spring in both pastures and even between the late spring and the summer in pasture B (Figure 6a,b). In pasture C, although the lowest value of EE was recorded also during the summer (2.19%, Figure 6c), the highest value was observed in the early spring (2.98%, Figure 6c). However, no significant differences were found in the EE values among the first three sampling dates in pasture C.
The Ash values had the same pattern of results in both lowland pastures. The higher Ash values were recorded at the winter in pastures A (12.60%, Figure 6a) and B (13.32%, Figure 6b), while the lower values were observed during the late spring in pasture A (7.68%, Figure 6a) and in the summer in pasture B (6.85%, Figure 6b). In pasture C, the Ash values peaked in the winter (13.87%, Figure 6c) and decreased during the summer (9.81%, Figure 6c). However, in pasture C, no significant differences were observed in the Ash values between the two sampling dates of spring (Figure 6c).
In terms of digestibility, both the DMD and OMD values varied significantly among sampling dates (Table 3). The higher DMD values were recorded during the early spring in both pastures A (63.94%, Figure 6a) and C (68.51%, Figure 6c) and in the winter in pasture B (64.50%, Figure 6b). The lower DMD values were observed during the late spring in pasture A (48.56%, Figure 6a) but, in pastures B and C, were achieved in the summer (47.46% and 46.33%, respectively, Figure 6b,c). However, in pastures A and B, the DMD values did not change significantly between the winter and the early spring, as well as between the latter and the late spring in pasture B (Figure 6a,b). On the other hand, no significant differences were found in the DMD values between winter and late spring in pasture C (Figure 6c).
Concerning the OMD, the trend was an increase during the early spring in pastures A (61.96%, Figure 6a), B (59.09%, Figure 6b) and C (65.72%, Figure 6c) and a decrease in the summer for both pastures B and C (46.63% and 42.63%, respectively; Figure 6b,c), while, in pasture B, the lowest OMD value was recorded in the late spring (45.98%, Figure 6b). Nevertheless, in pasture B, the OMD values did not change significantly among the winter and the spring sampling (Figure 6b), while, in pasture C, no significant differences were observed in the OMD values among the winter, late spring and summer (Figure 6c).

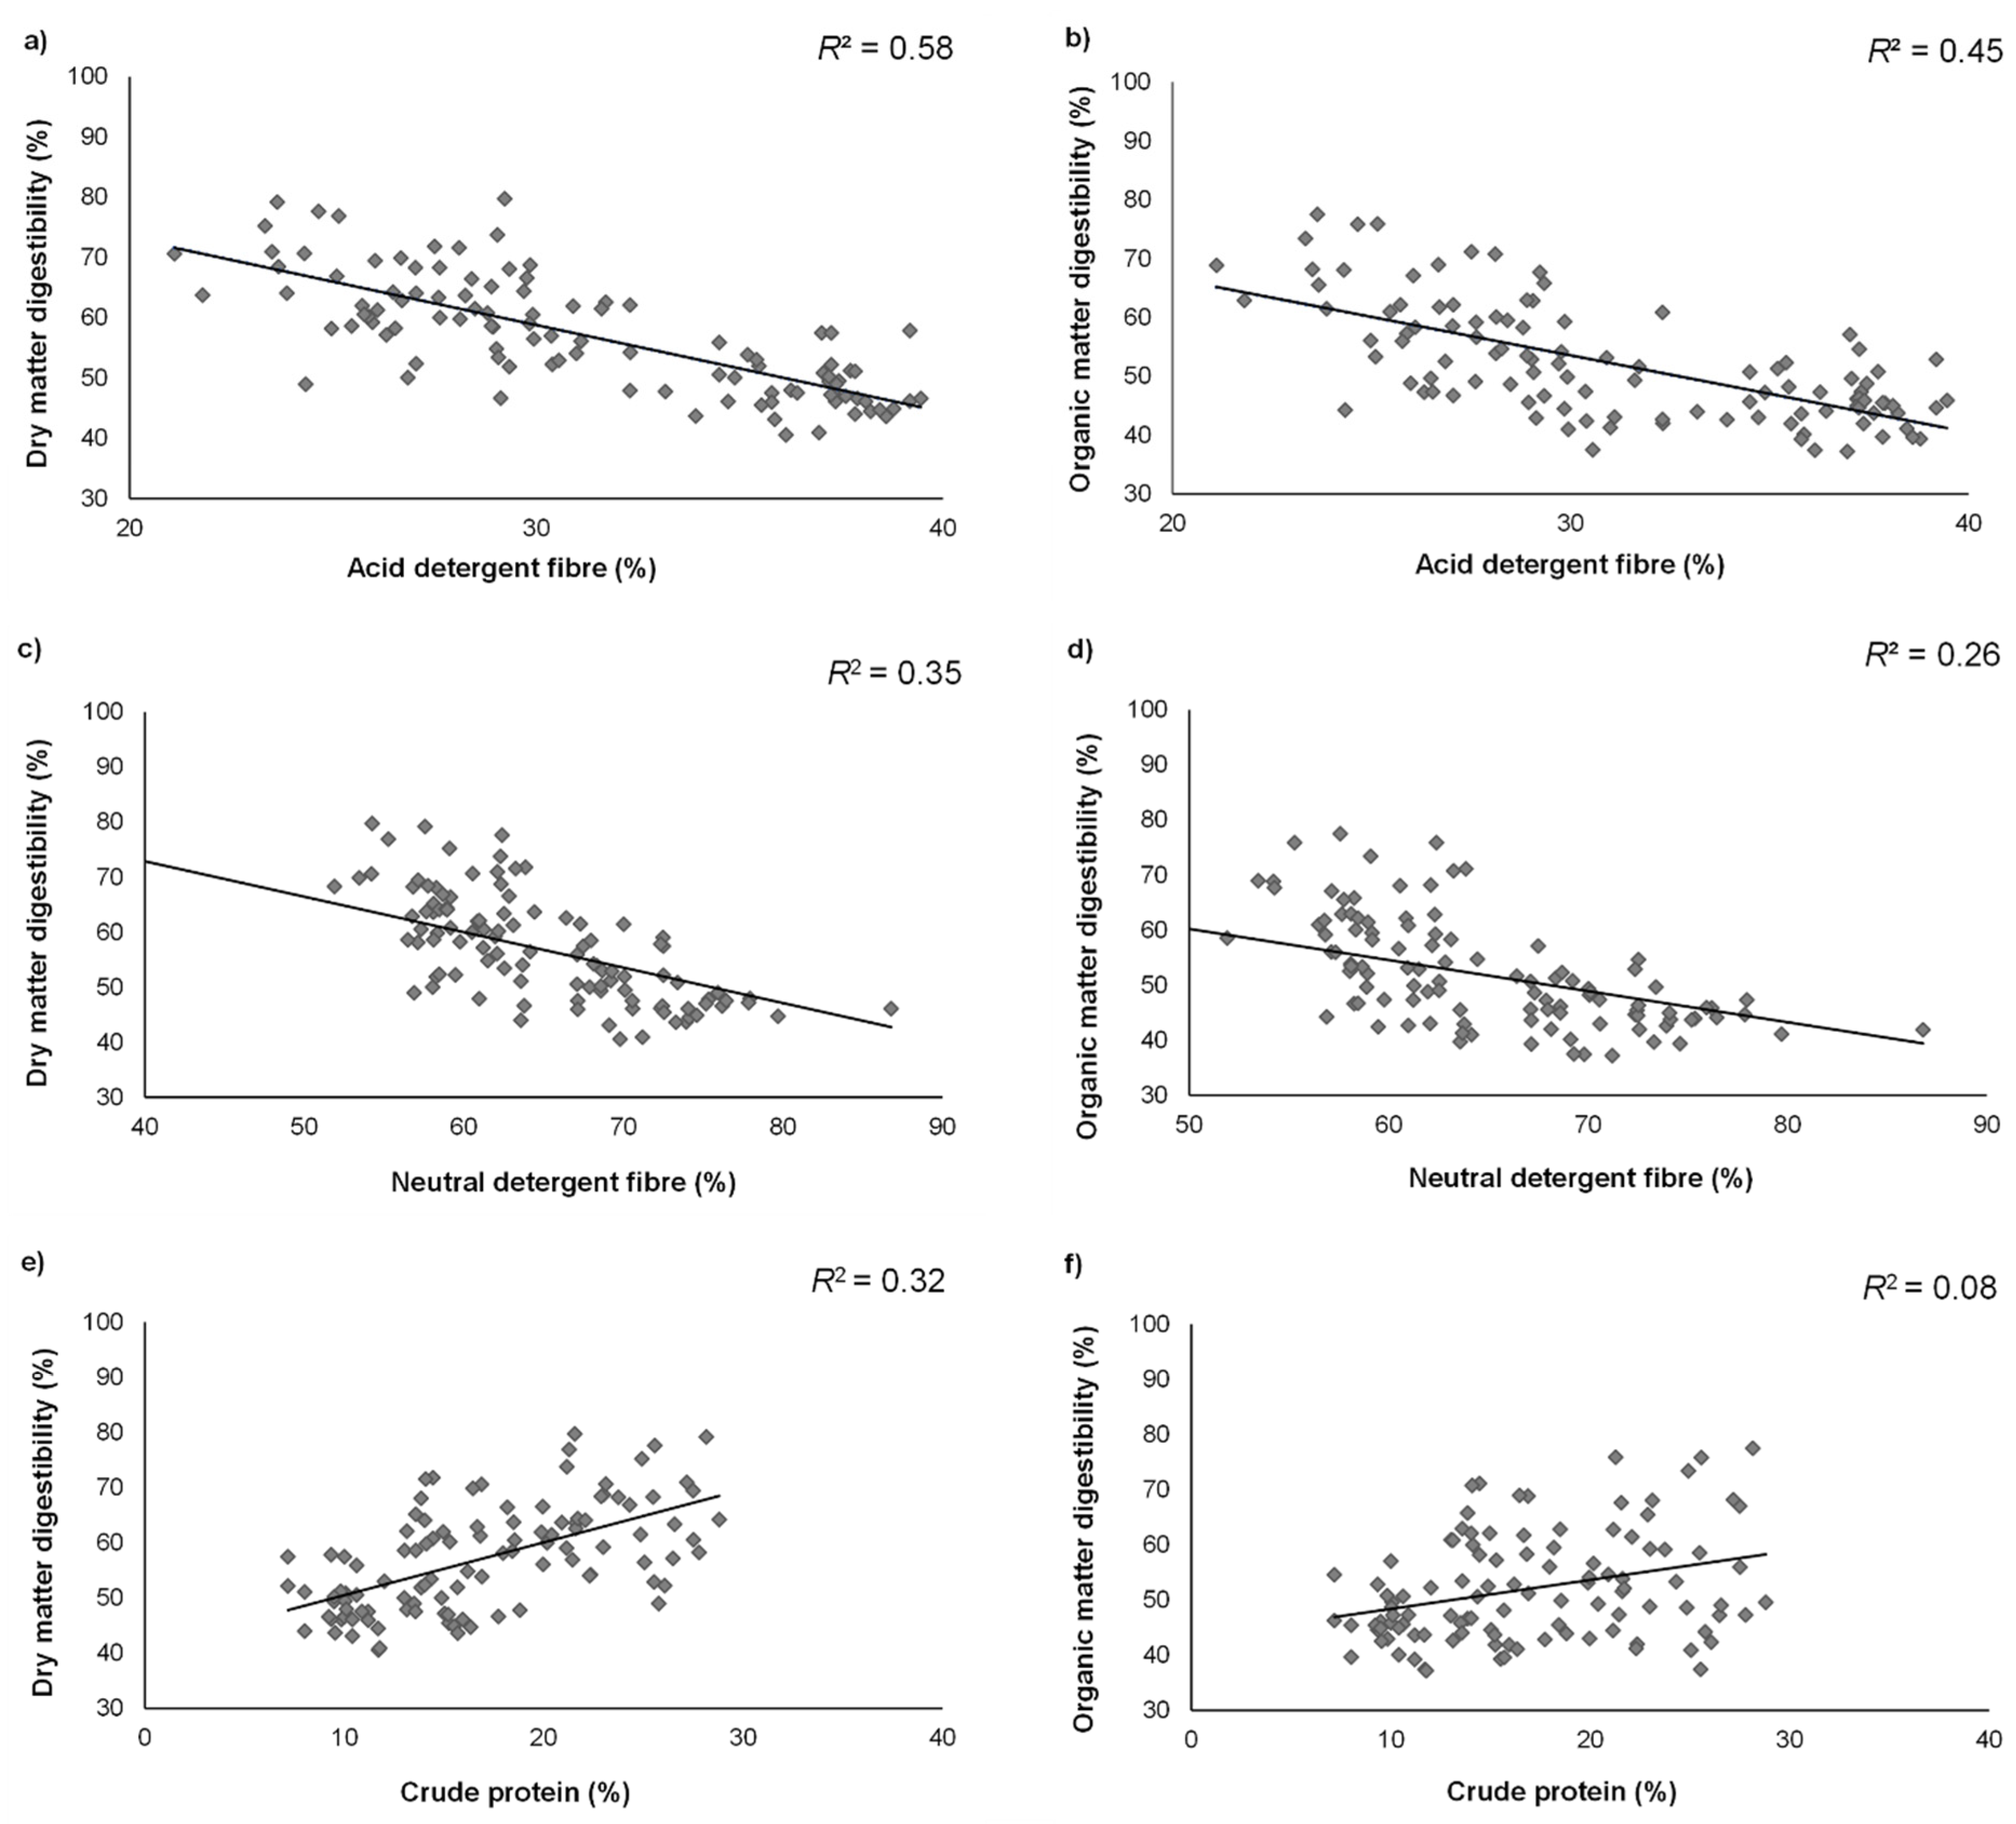
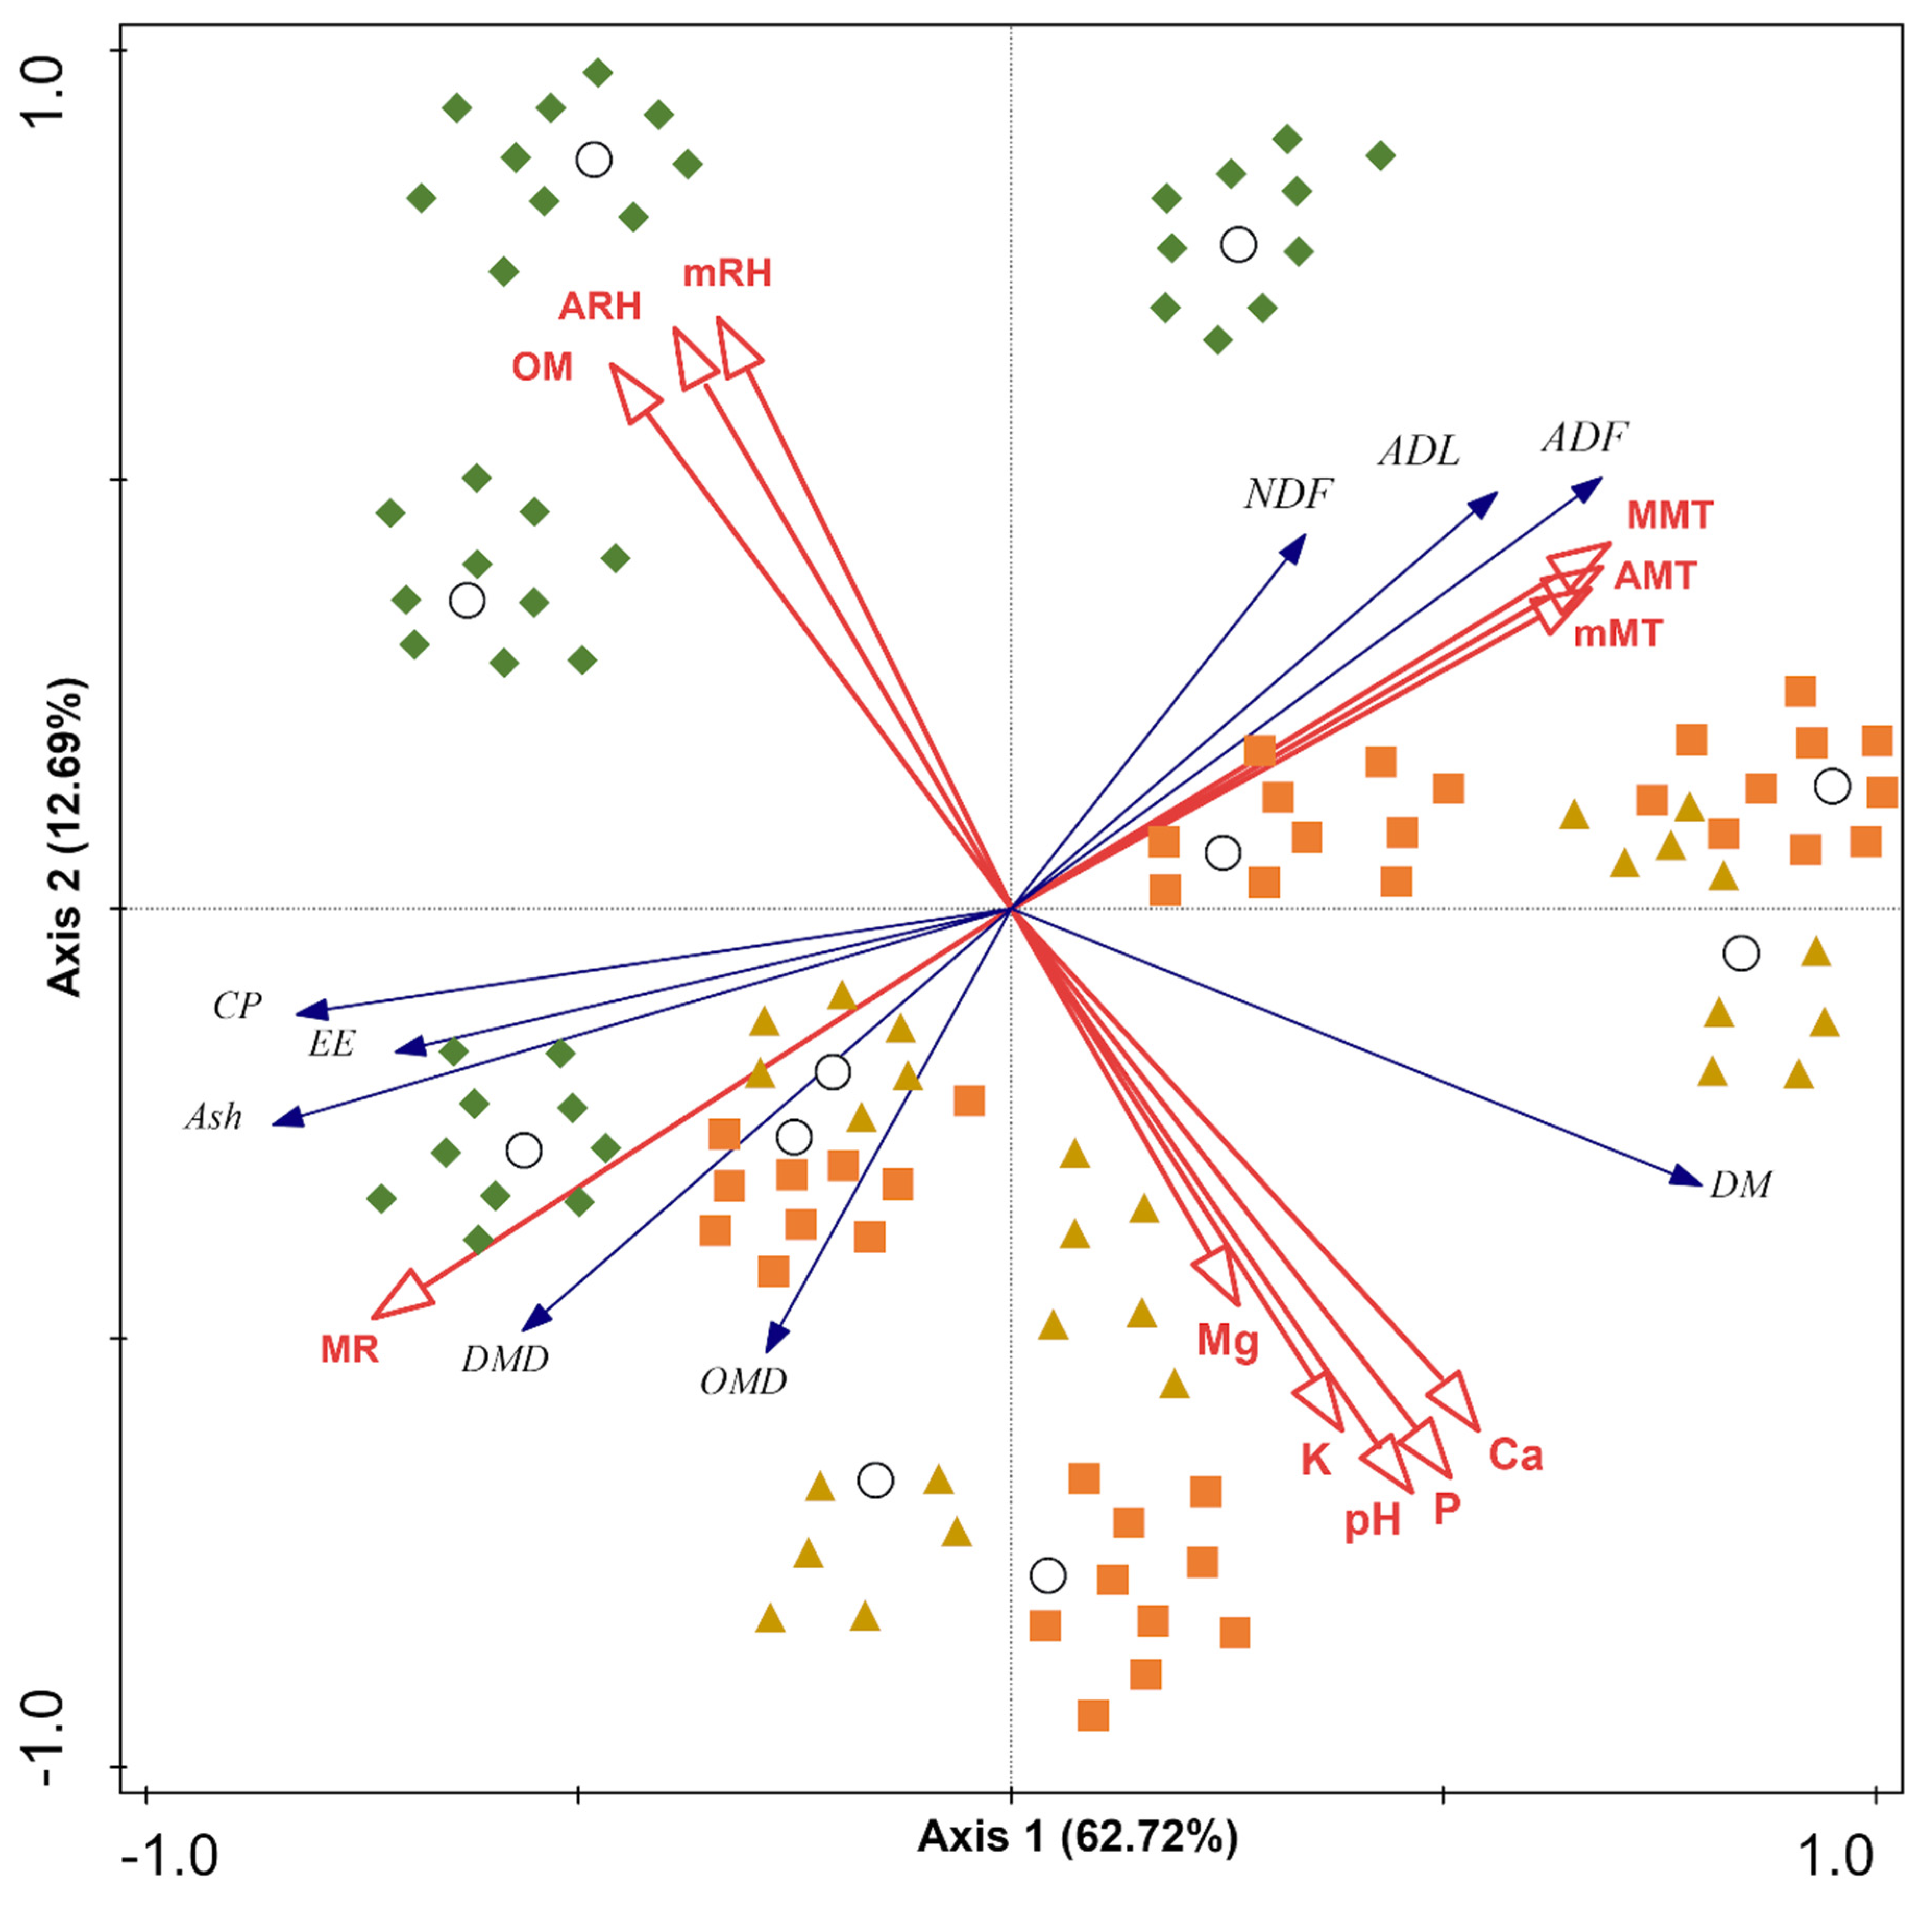
3.6. Effect of Environmental Variables on Nutritive Parameters

To investigate the effect of environmental factors on the nutritive parameters, redundancy analysis between elemental concentrations and environmental variables was conducted using Canoco 5.0. Figure 7 presents the triplot for the first and second RDA axes, which together explained 75.41% of the total variance indicating that environmental factors had significant effects on the nutritive parameters values. The fibre contents of forage (ADF, NDF and ADL) had significant positive correlations with temperature and retained large positive eigenvalues in the first axis (Figure 7).
Monthly rain played significant positive roles on the concentrations of five nutritive parameters—namely, CP, Ash, DMD, OMD and EE. On the other hand, only DM exhibited a positive correlation with the soil parameters (pH, P, K Ca and Mg) and a negative correlation with the relative air humidity and OM content. This nutritive metric was only represented by samples from pastures A and B where all soil parameters except the OM content were significantly higher than in pasture C.

4. Discussion

Pastures are multifunctional areas as they provide goods and ecosystem services, such as the maintenance of biodiversity, feed and shelter to animals [6]. However, several factors contribute towards the quality, quantity and reliability of pasture production, and these include species [40], plant part, stage of maturity [41], soil type [42], altitude [43] and climatic variables [44]. The soil nutrient availability affects the forage production [42]. For example, the soil pH is widely known to influence the forage quality and plant growth, as the nutrient availability and exposure to toxic elements in the soil is controlled by the soil pH values [45,46,47].
The highest annual net productivity was found in pasture A, which could be explained by specific soil parameters, such as the higher soil pH and soil available P and K that characterise this site and the higher average annual temperatures. In spite the fact that the forage dries during the summer, when the rainfall is sufficient, the productivity is high. In fact, the winter productivity in pasture A was the highest recorded. Variance analyses revealed that the soil parameters from pasture C were the most dissimilar from the others, whereas pastures A and B were more similar to each other.
Previous studies have shown that the soil pH affects the forage quality and plant growth by controlling the phyto-availability of soil nutrients and the interactions of plants with beneficial microorganisms in the rhizosphere [45,46,47]. Schjoerring et al. [42] showed that crop production on acid soils is commonly limited by excessive Al3+ and Mn2+ concentrations and low phyto-availability of K, P, Mg, Ca or Mo, while in alkaline and limestone soils, it is mainly limited by the low phyto-availability of the micronutrients Fe, Zn, Mn and Cu.
The wide variation in the chemical composition of forage between altitudinal levels as well as between sampling dates was as expected. Dry matter was constantly the lowest in upland (pasture C) and highest during the dry season (summer) in all pastures. This result is according to Hughes et al. [27] who found that DM decreased from the dry to the wet season on dairy and beef pastures in Jamaica.
During the summer, the water availability is limited due to low levels of rainfall, especially in the lowland pastures. Consequently, the moisture content of pastures is low compared to the spring and the winter where rainfall is higher. RDA analysis showed that the highest DM values recorded in the lowland pastures were negatively related with the relative air humidity, which clustered almost all samples from upland where this climatic variable was highest.
However, the opposite was observed in relation to the CP content i.e., this was the highest during the wet seasons (winter and spring), especially in pasture C, and decreased with the progress of the growing season. This could be attributed to the increased proportions of structural carbohydrates vs. cell contents and the accumulation of nutrients to flowers and seeds [43]. Moreover, reduction in the CP content has been also attributed to changes in the stem/leaf ratio as stems contain less crude protein than leaves [27,43].
The low CP content of forage during the dry season is consistent with other studies [27,48]. According to Guenni et al. [49], grass requires solar radiation in full for growth and development, which is the case in lowlands. However, grass in the uplands showed an increase in crude protein with the decrease in sunlight intensity. Koidou et al. [43] suggested that plants growing in uplands improve their resistance to harsh environments by increasing their content of substances, such as CP, fat, starch and sugars. Mishra et al. [50] also showed that the quality of field grass improved at the lower light intensity as indicated by a higher accumulation of protein in leaves and stems at the lower light intensity.
The highest contents of the different fibre fractions (NDF, ADF and ADL) were recorded in the summer, especially in lowland pastures, due to higher temperature and lower air humidity during this season as demonstrated by RDA analysis. This observation was confirmed in earlier reports [51,52,53] and could be explained by a more rapid maturation of plants, which increases the stem-to-leaf ratio and cell wall content, including lignin, caused by the higher temperatures during this period [4,43]. Such high fibre content may impair digestibility and voluntary intake by ruminants [27,48]. In this study, negative correlations between the fibre content and forage digestibility (DMS and OMD) were revealed by regression and RDA analyses. The highest digestibility value was reached when the fibre contents were the lowest (at the beginning of the growing season).
In fact, the highest digestibilities values (DMD and OMD) at the beginning of the growing season were associated with the higher CP, Ash and EE values and lower NDF, ADF and ADL values observed during this period. These results are consistent with those of Mountousis et al. [54], who indicated that monthly variations in dry matter digestibility are mainly related to those of crude protein and fibre contents. Additionally, according to Moreira et al. [55], an increased leaf ratio in forage results in an increase in CP content and a reduction in the cell wall content, which increases the digestibility of the forage.
Determining the production and nutritional value of pastures is important to reach an ideal of productivity of grazing cattle and their well-being. However, forage productivity and quality are affected by biotic [42] and abiotic environmental factors [44], which often lead to nutritional inadequacy. Thus, this study highlighted that shifting temperature and precipitation patterns must be considered together to understand the potential impacts of climate change on forage production as well as to develop and implement adaptation strategies for dairy and beef farms [2,12].

5. Conclusions

Azorean pastures generally supply livestock with high food quality during spring; however, the forage quality declines rapidly with the maturation progress of the forage. Pastures at the lower elevation were most productive at the beginning of the growing season, while those in the middle and upper elevations were most productive during the summer.
The evaluation of forage quality is important for the prediction of animal performance and to implement appropriate management strategies for its exploitation [54]. All nutritive parameters showed a marked seasonality. The general trend was an increase along the growing season, except for CP, EE and Ash. The crude protein content was sufficient to cover only the nutritional requirements of ruminants at the beginning of the growing season and then decreased. In contrast, the fibre content (NDF, ADF and ADL) increased continuously as the growing season proceeded, negatively affecting the forage digestibility. The Ash content was quite variable among seasons in all pastures, while the EE content only changed between the coolest and warmest seasons.
In this study, we found significant relationships between nutritive parameters and environmental factors, such as the relative air humidity, temperature, soil pH, OM content and the soil available P, K and Ca, thus, reinforcing the need to pursue adaptation strategies in response to environmental changes to maintain productive pasture ecosystems.

Author Contributions

Conceptualisation, C.D.M. and R.B.E.; investigation, C.D.M., C.S.A.M.M.D., S.W. and R.B.E.; formal analysis, C.D.M.; writing—original draft preparation, C.D.M.; writing—review and editing, C.D.M. and R.B.E., C.S.A.M.M.D., S.W., A.E.S.B., J.M., P.A.V.B., M.T.F. and R.B.E.; funding acquisition, M.T.F., R.B.E.; methodology, M.T.F., R.B.E., C.D.M., S.W., A.E.S.B. and J.M.; Resources, R.B.E., A.E.S.B. and J.M.; and project administration and supervision R.B.E. All authors interpreted the results and contributed to the final manuscript and C.D.M. lead the writing of the manuscript. All authors have read and agreed to the published version of the manuscript.

Funding

This research was funded by the project PASTURCLIM (ACORES-01-0145-FEDER-000082) financed by FEDER in 85% and by Azorean Public funds by 15% through Operational Programme Azores 2020.

Institutional Review Board Statement

Not applicable.

Informed Consent Statement

Not applicable.

Data Availability Statement

The data that support the findings of this study are available from the corresponding author upon reasonable request.

Acknowledgments

We gratefully acknowledge Virginia Pires for giving permission to use pastures A and B. We thank Francisco Reis of the AEAI/CLIMAAT_Azores project for providing climate data and also Enésima Pereira of Azorean Biodiversity Group for providing the imaging software.

Conflicts of Interest

The authors declare no conflict of interest.

References

  1. Howden, S.M.; Crimp, S.J.; Stokes, C.J. Climate change and Australian livestock systems: Impacts, research and policy issues. Aust. J. Exp. Agr. 2008, 48, 780–788. [Google Scholar] [CrossRef]
  2. Cullen, B.R.; Johnson, I.R.; Eckard, R.J.; Lodge, G.M.; Walker, R.G.; Rawnsley, R.P.; McCaskill, M.R. Climate change effects on pasture systems in south-eastern Australia. Crop Pasture Sci. 2009, 60, 933–942. [Google Scholar] [CrossRef]
  3. Chaplin-Kramer, R.; George, M.R. Effects of Climate Change on Range Forage Production in the San Francisco Bay Area. PLoS ONE 2013, 8, e57723. [Google Scholar] [CrossRef] [PubMed]
  4. Dumont, B.; Andueza, D.; Niderkorn, V.; Lüscher, A.; Porqueddu, C.; Picon-Cochard, C. A meta-analysis of climate change effects on forage quality in grasslands: Specificities of mountain and Mediterranean areas. Grass Forage Sci. 2015, 70, 239–254. [Google Scholar] [CrossRef]
  5. Borges, P.A.V.; Gabriel, R.; Fattorini, S. Biodiversity Erosion: Causes and Consequences. In Life on Land; Leal Filho, W., Azul, A.M., Brandli, L., Özuyar, P.G., Wall, T., Eds.; Springer International Publishing: Cham, Switzerland, 2019; pp. 1–10. [Google Scholar] [CrossRef]
  6. Delaby, L.; Finn, J.A.; Grange, G.; Horan, B. Pasture-Based Dairy Systems in Temperate Lowlands: Challenges and Opportunities for the Future. Front. Sustain. Food Syst. 2020, 4, 543587. [Google Scholar] [CrossRef]
  7. Capstaff, N.M.; Miller, A.J. Improving the Yield and Nutritional Quality of Forage Crops. Front. Plant Sci. 2018, 9, 535. [Google Scholar] [CrossRef] [Green Version]
  8. Fuglie, K.; Peters, M.; Burkart, S. The Extent and Economic Significance of Cultivated Forage Crops in Developing Countries. Front. Sustain. Food Syst. 2021, 5, 712136. [Google Scholar] [CrossRef]
  9. Food and Agriculture Organization of the United Nations (FAO). Challenges and Opportunities for Carbon Sequestration in Grassland Systems: A Technical Report on Grassland Management and Climate Mitigation; FAO: Rome, Italy, 2010. [Google Scholar]
  10. Chaudhry, A.S. Forage based animal production systems and sustainability, an invited keynote. Rev. Bras. Zootecn. 2008, 37, 78–84. [Google Scholar] [CrossRef] [Green Version]
  11. Lüscher, A.; Markus, D.; Blum, H.; Hartwig, U.A.; Nösberger, J. Fertile temperate grassland under elevated atmospheric CO2—role of feed-back mechanisms and availability of growth resources. Eur. J. Agron. 2004, 21, 379–398. [Google Scholar] [CrossRef]
  12. Perring, M.P.; Cullen, B.R.; Johnson, I.R.; Hovenden, M.J. Modelled effects of rising CO2 concentration and climate change on native perennial grass and sown grass-legume pastures. Clim. Res. 2010, 42, 65–78. [Google Scholar] [CrossRef] [Green Version]
  13. Myers, S.S.; Zanobetti, A.; Kloog, I.; Huybers, P.; Leakey, A.D.; Bloom, A.J.; Carlisle, E.; Dietterich, L.H.; Fitzgerald, G.; Hasegawa, T.; et al. Increasing CO2 threatens human nutrition. Nature 2014, 510, 139–142. [Google Scholar] [CrossRef] [PubMed]
  14. Thivierge, M.N.; Jégo, G.; Bélanger, G.; Bertrand, A.; Tremblay, G.F.; Rotz, C.A.; Qian, B. Predicted yield and nutritive value of an alfalfa–timothy mixture under climate change and elevated atmospheric carbon dioxide. Agron. J. 2016, 108, 585–603. [Google Scholar] [CrossRef] [Green Version]
  15. Lacetera, N. Impact of climate change on animal health and welfare. Anim. Front. 2019, 9, 26–31. [Google Scholar] [CrossRef] [PubMed] [Green Version]
  16. Yang, H.; Wu, M.; Liu, W.; Zhang, Z.; Zhang, N.; Wan, S. Community structure and composition in response to climate change in a temperate steppe. Glob. Chang. Biol. 2017, 17, 452–465. [Google Scholar] [CrossRef]
  17. Lee, M.A. A global comparison of the nutritive values of forage plants grown in contrasting environments. J. Plant Res. 2018, 131, 641–654. [Google Scholar] [CrossRef]
  18. Barbehenn, R.V.; Chen, Z.; Karowe, D.N.; Spickard, A. C3 grasses have higher nutritional quality than C4 grasses under ambient and elevated atmospheric CO2. Glob. Change Biol. Bioenergy 2004, 10, 1565–1575. [Google Scholar] [CrossRef] [Green Version]
  19. INE—Instituto Nacional de Estatística. Estatísticas da Produção e Consumo de Leite; INE: Lisboa, Portugal, 2015; 76p. [Google Scholar]
  20. Melo, C.D.; Walker, C.; Rodríguez-Echeverría, S.; Borges, P.A.V.; Freitas, H. Species composition of arbuscular mycorrhizal fungi differ in semi-natural and intensively managed pastures in an isolated oceanic island (Terceira, Azores). Symbiosis 2014, 64, 73–85. [Google Scholar] [CrossRef]
  21. Borba, J.P.R.; Maduro Dias, C.S.A.M.; Rosa, H.J.D.; Vouzela, C.F.M.; Rego, O.A.; Borba, A.E.S. Nutritional valorization of ginger lily forage (Hedychium gardnerianum, Sheppard ex Ker-Gawl) for animal feeding: Treatment with urea. Afr. J. Agric. Res. 2015, 10, 4606–4615. [Google Scholar] [CrossRef] [Green Version]
  22. Bell, M.J.; Eckard, R.J.; Harrison, M.T.; Neal, J.S.; Cullen, B.R. Effect of warming on the productivity of perennial ryegrass and kikuyu pastures in south-eastern Australia. F Pasture Sci. 2013, 64, 61–70. [Google Scholar] [CrossRef]
  23. Borba, A.E.S. Produção Animal Tradicional da Ilha de S. Jorge. Agroforum 2007, 19, 29–34. [Google Scholar]
  24. Santos, F.D.; Valente, M.A.; Miranda, P.M.A.; Aguiar, A.; Azevedo, E.B.; Tomé, A.R.; Coelho, F. Climate change scenarios in the Azores and Madeira Islands. World Resour. Rev. 2004, 16, 473–491. [Google Scholar]
  25. PRAC—Programa Regional Para as Alterações Climáticas dos Açores; Cavalheiro, G. (Ed.) Caos: Queluz, Portugal, 2017; 181p. [Google Scholar]
  26. Lee, J.M.; Clark, A.J.; Roche, J.R. Climate-change effects and adaptation options pasture-based dairy farming systems: A review. Grass Forage Sci. 2013, 68, 485–503. [Google Scholar] [CrossRef]
  27. Hughes, M.P.; Jennings, P.G.A.; Mlambo, V.; Lallo, C.H.O. Exploring seasonal variations in sward characteristics and nutritive value of tropical pastures grazed by beef and dairy cattle on commercial farms in Jamaica. J. Anim. Sci. 2011, 1, 47–60. [Google Scholar]
  28. Hughes, M.P.; Jennings, P.G.A.; Mlambo, V.; Lallo, C.H.O. Effect of season and harvesting method on chemical composition, predicted metabolizable energy and in vitro organic matter digestibility of rotationally grazed tropical pastures. Online J. Anim. Feed Res. 2011, 2, 405–417. [Google Scholar]
  29. García Couto, M.A. Climate Atlas of the Archipelagos of the Canary Islands, Madeira and the Azores; Agencia Estatal de Meteorología de España, Madrid and Instituto de Meteorologia de Portugal: Lisboa, Portugal, 2012; pp. 15–62. [Google Scholar]
  30. Monteiro, R.; Furtado, S.; Rocha, M.; Freitas, M.; Medeiros, R.; Cruz, J.V. O Ordenamento do Território nos Açores: Política e Instrumentos; Secretaria Regional do Ambiente e do Mar, Direção Regional do Ordenamento do Território e dos Recursos Hídricos: Ponta Delgada, Portugal, 2008; 159p. [Google Scholar]
  31. Elias, R.B.; Gil, A.; Silva, L.; Fernández-Palacios, J.M.; Azevedo, E.B.; Reis, F. Natural zonal vegetation of the Azores Islands: Characterization and potential distribution. Phytocoenologia 2016, 46, 107–123. [Google Scholar] [CrossRef]
  32. Olsen, S.R.; Sommers, L.E. Phosphorus. In Methods of Soil Analysis; Page, A.L., Miller, R.H., Keeney, D.R., Eds.; American Society of Agronomy: Madison, WI, USA, 1982; pp. 403–427. [Google Scholar]
  33. AOAC—Association of Official Analytical Chemists. Official Methods of Analysis, 16th ed.; Association of Official Analytical Chemists: Virginia, VA, USA, 1995. [Google Scholar]
  34. Goering, H.K.; Van Soest, P.J. Forage Fiber Analyses. Agricultural Handbook n° 379; Agricultural Research Service United States Department of Agriculture: Washington, DC, USA, 1970; pp. 1–19. [Google Scholar]
  35. Tilley, J.M.A.; Terry, R.A. A two-stage technique for the in vitro digestion of forage crops. Grass Forage Sci. 1963, 18, 104–111. [Google Scholar] [CrossRef]
  36. Alexander, R.H.; McGowan, M. The routine determination of in vitro digestibility of organic matter in forages: An investigation of the problems associated with continuous large-scale operation. Grass Forage Sci. 1966, 21, 140–147. [Google Scholar] [CrossRef]
  37. IBM Corporation. Released. IBM SPSS Statistics for Windows, Version 27.0; IBM Corp.: Armonk, NY, USA, 2020. [Google Scholar]
  38. ter Braak, C.J.F.; Smilauer, P. CANOCO Reference Manual and User’s Guide: Software for Ordination, Version 5.0; Microcomputer Power: Ithaca, NY, USA, 2012. [Google Scholar]
  39. Azevedo, E.B. Modelação do clima insular à escala local. Modelo CIELO aplicado à ilha Terceira. Ph.D. Thesis, University of the Azores, Angra do Heroísmo, Portugal, 1996. [Google Scholar]
  40. Chapman, D.F.; Lee, J.M.; Waghorn, G.C. Interaction between plant physiology and pasture feeding value: A review. Crop Pasture Sci. 2014, 65, 721–734. [Google Scholar] [CrossRef]
  41. Hakl, J.; Fuksa, P.; Konečná, J.; Šantrůček, J. Differences in the crude protein fractions of lucerne leaves and stems under different stand structures. Grass Forage Sci. 2016, 71, 413–423. [Google Scholar] [CrossRef]
  42. Schjoerring, J.K.; Cakmak, I.; White, P.J. Plant nutrition and soil fertility: Synergies for acquiring global green growth and sustainable development. Plant Soil 2019, 434, 1–6. [Google Scholar] [CrossRef] [Green Version]
  43. Koidou, M.; Mountousis, I.; Dotas, V.; Zagorakis, K.; Yiakoulaki, M. Temporal variations of herbage production and nutritive value of three grasslands at different elevation zones regarding grazing needs and welfare of ruminants. Arch. Anim. Breed. 2019, 62, 215–226. [Google Scholar] [CrossRef] [Green Version]
  44. Ghahramani, A.; Howden, S.M.; del Prado, A.; Thomas, D.T.; Moore, A.D.; Ji, B.; Ates, S. Climate change impact, adaptation, and mitigation in temperate grazing systems: A review. Sustainability 2019, 11, 7224. [Google Scholar] [CrossRef] [Green Version]
  45. Mueller, N.D.; Gerber, J.S.; Johnston, M.; Ray, D.K.; Ramankutty, N.; Foley, J.A. Closing yield gaps through nutrient and water management. Nature 2012, 490, 254–257. [Google Scholar] [CrossRef] [PubMed]
  46. White, P.J.; George, T.S.; Dupuy, L.X.; Karley, A.J.; Valentine, T.A.; Wiesel, L.; Wishart, J. Root traits for infertile soils. Front. Plant Sci. 2013, 4, 193. [Google Scholar] [CrossRef] [Green Version]
  47. Rengel, Z. Availability of Mn, Zn and Fe in the rhizosphere. J. Soil Sci. Plant Nutr. 2015, 15, 397–409. [Google Scholar] [CrossRef] [Green Version]
  48. Abebe, A.; Tolerabc, A.; Holanda, Ø.; Ådnøya, T.; Eikad, L.O. Seasonal variation in nutritive value of some browse and grass species in Borana Rangeland, Southern Ethiopia. Trop. Subtrop. Agroecosystems 2012, 15, 261–271. [Google Scholar]
  49. Guenni, O.; Seiter, S.; Figueroa, R. Growth response of three Brachiaria species to light intensity and nitrogen supply. Trop. Grassl. 2008, 42, 75–87. [Google Scholar]
  50. Mishra, A.K.; Tiwari, H.S.; Bhatt, R.K. Growth, biomass production and photosynthesis of Cenchrus ciliaris L. Under Acacia tortilis (Forssk.) Hayne based silvopastoral systems in semi arid tropics. J. Environ. Biol. 2010, 31, 987–993. [Google Scholar] [PubMed]
  51. Mtui, D.J.; Lekule, F.P.; Shem, M.N.; Ichinohe, T.; Fujihara, T. Comparative potential nutritive value of grasses, creeping legumes and multipurpose trees commonly in sub humid region in the eastern parts of Tanzania. Livest. Res. Rural Dev. 2009, 21, 158. Available online: https://www.lrrd.org/lrrd21/10/mtui21158.htm (accessed on 30 December 2021).
  52. Lopez-Gonzalez, F.; Estrada-Flores, J.G.; Aviles-Nova, F.; Yong-Angel, G.; Hernandez-Morales, P.; Martinez-Loperena, R.; Castelon-Ortega, A.O. Agronomic evaluation and chemical composition of African Star grass in the Southern region of the state of Mexico. Trop. Subtrop. Agroecosystems 2010, 12, 1–9. [Google Scholar]
  53. Roukos, C.; Papanikolaou, K.; Karalazos, A.; Chatzipanagiotou, A.; Mountousis, I.; Mygdalia, A. Changes in nutritional quality of herbage botanical components on a mountain side grassland in North-West Greece. Anim. Feed Sci. Technol. 2011, 169, 24–34. [Google Scholar] [CrossRef]
  54. Mountousis, I.; Papanikolaou, K.; Stanogias, G.; Chatzitheodoridis, F.; Roukos, C. Seasonal variation of chemical composition and dry matter digestibility of rangelands in NW Greece. J. Cent. Eur. Agric. 2008, 9, 547–556. [Google Scholar]
  55. Moreira, F.B.; Prado, I.N.; Cecato, U.; Wada, F.Y.; Mizubuti, I.Y. Forage evaluation, chemical composition, and in vitro digestibility of continuously grazed star grass. Anim. Feed Sci. Technol. 2004, 113, 239–249. [Google Scholar] [CrossRef]
Figure 1. The island of Terceira in the Azores archipelago with the location of pastures A, B and C marked with three different symbols.
Agriculture 12 00358 g001
Figure 2. Variation of the net productivity of forage plants among the three pastures (A, B and C). Different letters above each bar indicate significant differences in net productivity among pastures (Tukey test, p < 0.05).
Agriculture 12 00358 g002
Figure 3. Variation of forage net productivity plants among the four sampling dates (winter, spring, summer and autumn) in: (a) pasture A, (b) pasture B and (c) pasture C. Different letters above each bar indicate significant differences in net productivity among sampling dates (Tukey test, p < 0.05).
Agriculture 12 00358 g003
Figure 4. Regression analysis of the dry matter digestibility and (a) acid detergent fibre, (c) neutral detergent fibre and (e) crude protein and plots of organic matter digestibility and (b) acid detergent fibre, (d) neutral detergent fibre and (f) crude protein. Values of r2 values are also presented.
Agriculture 12 00358 g004
Figure 5. Boxplots representing the variation of the nutritive values of forage plants among the three pastures located at different altitudinal levels. Parameters are (a) dry matter; (b) crude protein and (c) ether extract. Bold line represents the median, x signals the mean, and the bottom and top of the box represent the lower and upper quartiles. Different letters above each box indicate significant differences in nutritive values between pastures (Kruskal–Wallis test, p < 0.05).
Agriculture 12 00358 g005
Figure 6. Variation of the nutritive parameters of forage plants among the four sampling dates: winter, early spring, late spring and summer in: (a) pasture A, (b) pasture B and (c) pasture C. Different letters above each bar indicate significant differences in the nutritive parameters among sampling dates (Tukey test, p < 0.05).
Agriculture 12 00358 g006
Figure 7. Redundancy analysis (RDA) of the relationships between environmental variables (red lines) and nutritive parameters (blue lines) from pastures A (yellow triangle) B (orange square) and C (green diamond) using Canoco 5.0 DM—dry matter, CP—crude protein, NDF—neutral detergent fibre, ADF—acid detergent fibre, ADL—acid detergent lignin, EE—ether extract, Ash—mineral ash, DMD—dry matter digestibility, OMD—organic matter digestibility, MR—monthly rain, AMT—average monthly temperature, MMT—maximum monthly temperature, mMT—minimum monthly temperature, ARH—average monthly relative humidity and mRH—minimum monthly relative humidity.
Agriculture 12 00358 g007
Table 1. Climatic and soil parameters in the sampling pastures A, B and C.
Parameters aPasture APasture BPasture C
Altitude (m)186301386
Annual rainfall (mm)136620362162
Average monthly rainfall (mm)113.83 ± 15.42169.67 ± 25.22180.17 ± 24.37
Average monthly temperature (°C)15.96 ± 0.8315.31 ± 0.8214.32 ± 0.88
Average monthly minimum temperature (°C) 13.29 ± 0.7712.61 ± 0.7611.64 ± 0.81
Average monthly maximum temperature (°C) 18.58 ± 0.9017.96 ± 0.8816.98 ± 0.95
Average relative air humidity (%)92.00 ± 0.4192.67 ± 0.5196.83 ± 0.11
pH6.74 ± 0.09 a6.33 ± 0.07 b5.87 ± 0.06 c
P (mg kg−1)105.50 ± 5.25 a87.80 ± 8.67 b27.20 ± 4.53 c
K (mg kg−1)311.20 ± 46.49 a164.90 ± 17.26 a66.30 ± 15.62 b
Ca (mg kg−1)1661.10 ± 67.58 a1307.20 ± 57.08 b406.40 ± 48.48 c
Mg (mg kg−1)333.40 ± 25.82 a150.00 ± 12.10 b113.50 ± 32 ± 13.78 b
OM (%)6.07 ± 0.32 a8.08 ± 0.45 b11.01 ± 0.45 c
a For soil parameters, values are mean values of 10 samples ± SE. The means with different letters are significantly different (Tukey test, p < 0.05).
Table 2. Regression analysis between dry matter digestibility (DMD) or organic matter digestibility (OMD) and dry matter (DM), crude protein (CP), neutral detergent fibre (NDF), acid detergent fibre (ADF), acid detergent lignin (ADL), ether extract (EE) and mineral ash (Ash). n.s. = not significant; * p < 0.05; ** p < 0.01; *** p < 0.001.
ParametersEquationTDFpr2
DMDMD = 0.69 − 0.44x−3.37106**0.10
CPDMD = 0.40 + 1.20x7.02106***0.32
NDFDMD = 1.07 − 0.65x−7.50106***0.35
ADFDMD = 1.07 − 0.65x−12.08106***0.58
ADLDMD = 1.18 − 1.80x−6.96106***0.31
EEDMD = 0.43 + 0.40x4.18106***0.14
AshDMD = 0.33 + 2.59x6.22106***0.28
DMOMD = 0.57 − 0.08x−0.06106n.s.0.003
CPOMD = 0.45 + 0.59x2.98106**0.08
NDFOMD = 0.94 − 0.56x−6.06106***0.26
ADFOMD = 1.05 − 1.58x−9.37106***0.45
ADLOMD = 0.66 − 3.31x−4.97106***0.19
EEOMD = 0.46 + 3.72x2.00106*0.04
AshOMD = 0.43 + 1.13x2.34106*0.04
Table 3. F and p values from one-way ANOVA of dependent variables (dry matter—DM, crude protein—CP, neutral detergent fibre—NDF, acid detergent fibre—ADF, acid detergent lignin—ADL, ether extract—EE, mineral Ash—ash, dry matter digestibility—DMD and organic matter digestibility—OMD) to significance between sampling dates (winter, early spring, late spring and summer) within each pasture. * p < 0.05; ** p < 0.01; *** p < 0.001.
Pasture APasture BPasture C
SourceFpFpFp
DM156.80***55.83***175.76***
CP40.10***79.80***73.77***
NDF6.49**17.10***29.01***
ADF74.50***30.37***111.34***
ADL8.62**34.08***9.02***
EE10.79***21.44***10.91***
Ash122.86***147.14***21.16***
DMD17.86***9.14***27.49***
DMO12.98***4.23*29.75***
Publisher’s Note: MDPI stays neutral with regard to jurisdictional claims in published maps and institutional affiliations.

