Article

Effects of Shallow Groundwater Depth and Nitrogen Application Level on Soil Water and Nitrate Content, Growth and Yield of Winter Wheat

1
Farmland Irrigation Research Institute, Chinese Academy of Agricultural Sciences, Xinxiang 453002, China
2
Graduate School of Chinese Academy of Agricultural Sciences, Beijing 100081, China
3
Water Environment Factor Risk Assessment Laboratory of Agricultural Products Quality and Safety, Ministry of Agriculture and Rural Affairs, Xinxiang 453002, China
4
School of Environment and Civil Engineering, Dongguan University of Technology, Dongguan 523015, China
5
MOE Laboratory for Earth Surface Processes, College of Urban and Environmental Sciences, Peking University, Beijing 100871, China
*
Author to whom correspondence should be addressed.
Agriculture 2022, 12(2), 311; https://doi.org/10.3390/agriculture12020311
Submission received: 17 January 2022 / Revised: 12 February 2022 / Accepted: 14 February 2022 / Published: 21 February 2022

Abstract

:
The large amount of nitrogen application on the North China Plain has caused a serious negative impact on the sustainable development of regional agriculture and ecological environmental protection. Our aim was to explore the effects of nitrogen fertilization rate and groundwater depth on growth attributes, soil-water and soil-fertilizer contents, and the winter wheat yield. Experiments were carried out in micro-lysimeters at groundwater depths of 60, 90, 120, and 150 cm on the basis of 0, 150, 240, and 300 kg/ha nitrogen fertilization rates in the growth season for winter wheat. Results showed that plant height, leaf area index, soil plant analysis development, and yield without nitrogen application increased significantly with increases in groundwater depth. The optimal groundwater depths for growth attributes and yield were 60–120 cm and tended to be shallower with added nitrogen application. Soil moisture was lowered significantly with groundwater depth, adding a nitrogen application reduced soil moisture, and excessive nitrogen input intensified soil drought. Nitrate-N accumulation at the 120–150 cm depths was significantly higher than that at the 60–90 cm depths, and a 300 kg/ha (traditional nitrogen application rate) treatment was 6.7 times greater than that of 150 kg/ha treatment and increased by 74% more than that of the 240 kg/ha treatment at 60–150 cm depth. Compared with the yield of the 300 kg/ha rate, the yield of the 240 kg/ha rate had no significant difference, but the yield increased by 3.90% and 11.09% at the 120 cm and 150 cm depths. The growth attributes and yield of winter wheat were better, and the soil nitrate-N content was lower, when the nitrogen application rate was 240 kg/ha. Therefore, it can be concluded that nitrogen application can be reduced by 20% on the North China Plain.

1. Introduction

Wheat is the main food crop and plays an important role in feeding the world [1]. In China, wheat production accounts for about 20% of the total grain output, of which more than 60% of the national wheat crop was produced on the North China Plain (NCP) [2]. The application of nitrogen (N) fertilizer has substantially increased wheat yield in China [3,4]. However, excessive input of N fertilizer reduces nitrogen-use efficiency [5], causes a large nitrogen surplus in farmland, and a series of environmental problems, such as intensive greenhouse-gas emission, soil acidification, and groundwater-nitrogen pollution [6,7,8]. In addition, water is another important factor limiting crop growth and yield. Particularly, shallow groundwater significantly affects crop growth, morphological and physiological properties, and yield [9]. Therefore, appropriate N application rate and groundwater depth play vital roles in crop growth and environmental protection.
Moderate N application is helpful for coordinating the Carbon/Nitrogen (C/N) ratio in soil: improving soil organic carbon and nitrogen composition and other physicochemical properties; facilitating the growth of microorganisms which could secrete more soil enzymes for ameliorating the soil fertility; and boosting crop yields [10,11,12]. But superfluous N application would be adverse to coordinating the composition and quantity of soil organic C/N [13,14], causing soil hardening, acidification, and lower soil permeability [15], reducing the soil microbial population, community structure, and enzyme activity [13,16], and thus reducing the growth and reproduction of microorganisms [17], and ultimately limiting crop growth and yield [18]. Many researchers have made in-depth investigations into nitrogen reduction and control for sustainable agriculture. Li et al. [19] found non-significant differences in the yields of maize under certain water stresses between traditional and reduced N applications. It might be because excess conventional N application cannot necessarily fortify the grain-filling parameters. In the field experiment, Zhou et al. [20] reported that the wheat dry biomass and yield with 240 kg/ha N fertilizer were higher than that with 300 kg/ha traditional N fertilizer under border irrigation; similarly, under drip irrigation, Si et al. [21] indicated that more than 240 kg/ha N application was harmful to winter wheat growth or crop water utilization; Ji et al. [22] reported that the high-efficiency management mode of water and fertilizer with 210~270 kg/ha N fertilizer application and 140~215 mm irrigation amount could significantly boost the yield compared with others. From previous findings, it has become clear that the combination of water and nitrogen would be a practical fertilization mode for cultivating a high yield. Additionally, N fertilizer application can be reduced under the suitable planting density because nitrogen and dense plant interaction could improve the canopy structure of wheat and remarkably affect the photosynthetic characteristics of the canopy [23]. Although these research studies have been carried out on N reduction application, there are few studies on how to control and decrease the N fertilizer application in conditions of shallow groundwater depth. In particular, the NCP is an important grain production base, and its sustainable and efficient agricultural production and environmental protection are of great significance. Therefore, in order to achieve sustainable agricultural development and resource-utilization on the NCP, more research is needed to explore yield formation, crop growth, and soil-water and soil-nitrogen content under shallow groundwater conditions with N fertilization.
Groundwater replenishes soil moisture in the form of subsurface evaporation and constitutes an integrated soil—water continuous system with soil, plant, and atmospheric water in the field. As reported in previous studies, shallower (0.5–2.5 m) groundwater depth was beneficial in shortening the maize growth process and boosting the leaf area index (LAI) [24,25], improving above-ground crop biomass in the growth stages [26], increasing the amount of groundwater consumption and crop evapotranspiration (ET), and reducing amounts of surface irrigation [27]. However, if groundwater depth was too deep (>3.5 m), the groundwater could not rise through the soil capillary gap and the roots’ effects to supply crops, which was not beneficial to the normal growth of crops and would increase irrigation amounts to maintain yields [28,29]. Groundwater that was too shallow or too deep affected crop plant height, leaf area, dry matter, water-use efficiency, and yield [30]. Furthermore, N fertilizer application and the groundwater table affect the distribution and translocation of water and nitrogen in the soil [31,32]. After N application, the upper soil layer has a large water potential gradient and high nitrogen concentration due to the effects of crop growth, irrigation, and soil water transport. The infiltration of nitrogen and water leads to nitrogen leaching and the decrease of the absorption and utilization of water and nitrogen by crops [33,34]. Groundwater replenishes to the water through capillarity, which reduces soil aeration and influences soil enzyme activity [35]. Compared with the upper soil, the water potential gradient at the critical point of the groundwater table is smaller. Nitrogen in groundwater and subsoil is transported upward with water by the root system and transpiration of crops [32,36,37], which would increase the nitrogen flux of the soil root layer and decrease crop production.
Many studies focus on the soil’s water and nitrogen distribution through N fertilizer or groundwater as a single variable. However, few researches combine these two factors on the effect of groundwater and N application, and the relevant mechanism is still unclear. Particularly in regions with shallower groundwater, it is not clear if different N application rates affect soil N accumulation, crop growth attributes, and yield. Therefore, the objectives of this study were: (1) to explore the effects of groundwater depth with N application on winter wheat plant height, leaf area, ear length, grain number per ear, number of spikes per spike, number of infertile spikes per spike, stem diameter, 1000-grain weight, spikes per area and yield; (2) to analyze the change of soil water and nitrate-N accumulation under different groundwater depths with N application; (3) to obtain the optimal N fertilization and groundwater depth and reveal the feasibility of N fertilizer reduction on the NCP.

2. Materials and Methods

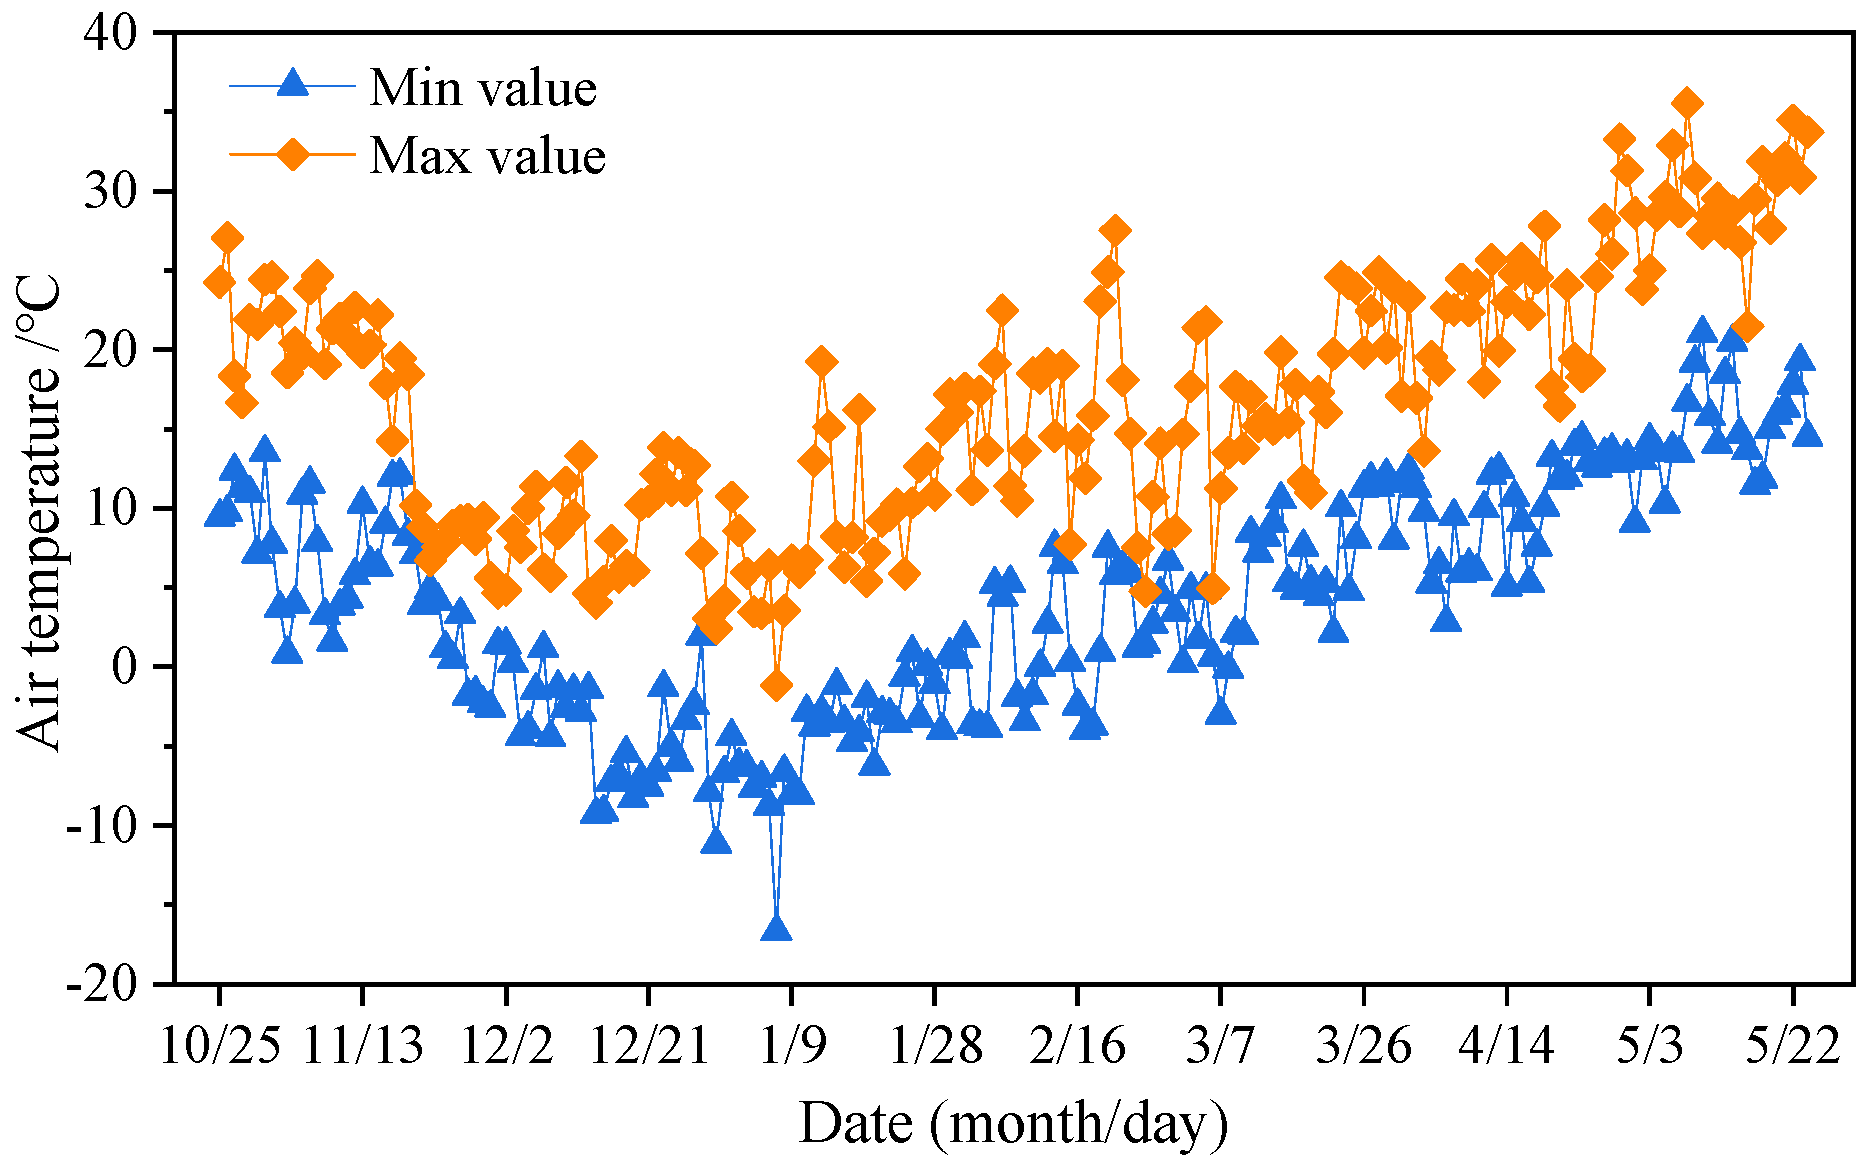
2.1. Experimental Site

The experimental site is located at the Agricultural Water and Soil Environment Field Scientific Observation and Experiment Station (latitude 35°27′ N, longitude 113°53′ E, elevation 73.2 m above sea level) of the Chinese Academy of Agricultural Sciences in Xinxiang, Henan Province. The local climate is continental and monsoonal, with an average rainfall of 588.8 mm (with about 72% occurring from June to September). The mean annual temperature and evaporation were reported as 14.1 °C and 2000 mm, respectively. Meteorological data was obtained from a standard automatic weather station located in the experimental station. Weather data during the experimental season is presented in Figure 1.

2.2. Experimental Design

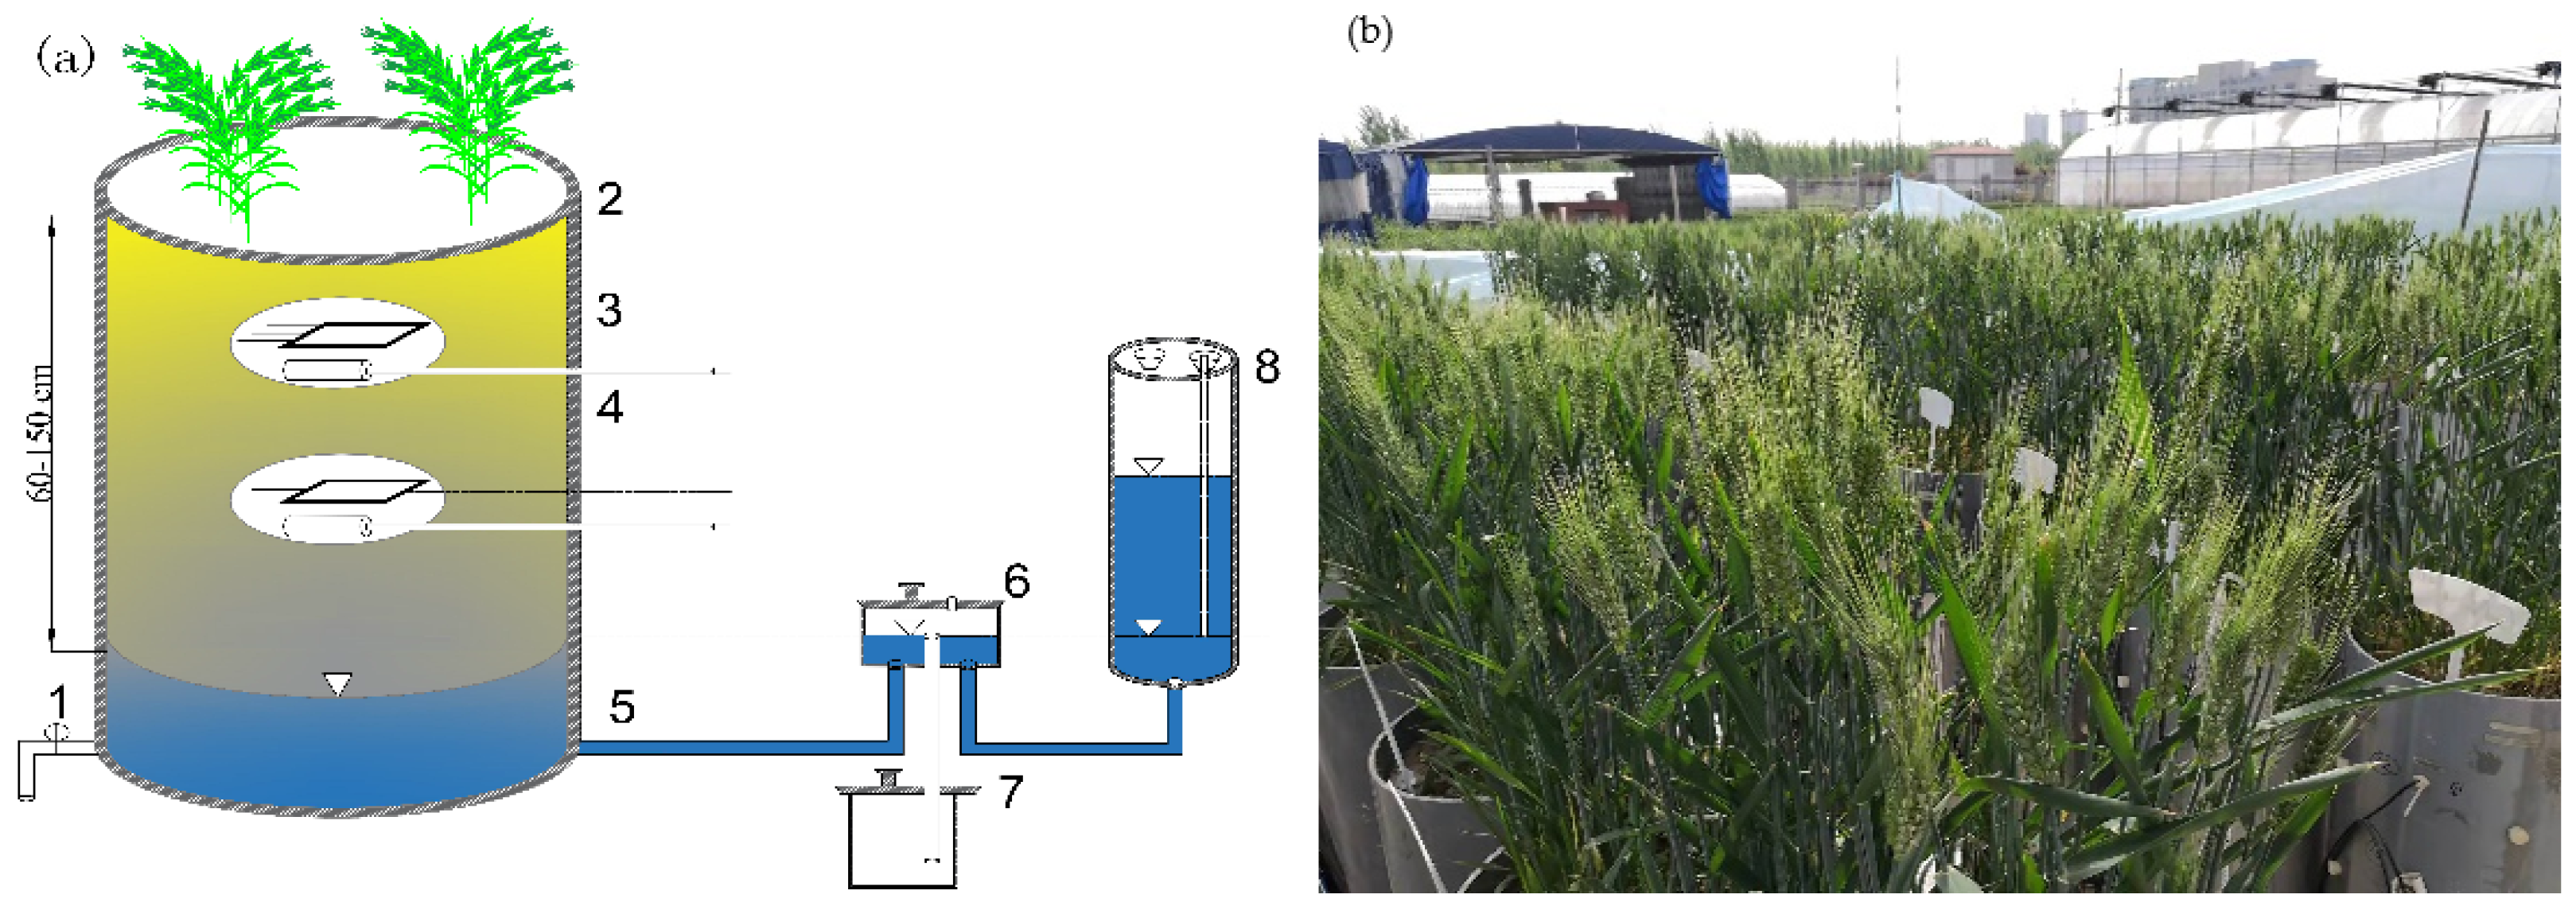
2.2.1. Testing Apparatus

The experiment adopted a lysimeter device for planting winter wheat, which was composed of three parts: the lysimeter, a groundwater-level control system and a soil-solution extraction system (Figure 2). The lysimeters were cylindrical with an outer diameter 40 cm and a wall thickness of 0.5 cm and made of PVC (polyvinyl chloride). The heights of the lysimeters were determined according to the actual depth of the groundwater control (a total of 48 lysimeters of 100, 130, 160, and 190 cm in height, with 12 lysimeters for each height.). The sidewall of the lysimeter was 5–10 cm higher than the soil surface. A Mariotte bottle was used in the groundwater supply system to provide a water source and maintain a constant water level, and the bottom of each lysimeter was equipped with a back seepage filter layer to prevent blockage. A TDR (Time Domain Reflectometry) probe (Shandong Renke Measurement and Control Technology Co., LTD., RS-WS-I20-TR, Jinan, China) and soil-solution extractor were buried in the interior of the lysimeter at every 20 cm layer; the first was 10 cm away from the soil surface, and the last was close to the water table. The TDR probe (probe length 70 mm, width 45 mm, thickness 14 mm) automatically collected and stored data once per hour. The soil-solution extraction system was mainly composed of soil-solution extractors, a vacuum pump, and a series of connected gracile tubes. The soil-solution extraction equipment was made of ceramic, sampling head (2.8 cm long, outer diameter 7.5 mm), gracile extension tube (40 cm), and vacuum pump (Hangzhou Pengbo Bearing Co., LTD, FY-1C-N, Hangzhou, China) which provided negative pressure to extract soil solutions. The soil-solution extractor and TDR probe were placed in the same soil layer in the shape of “Y” so as to not affect each other. The extension cord of the TDR probe and the extension tube of the soil solution-extractor were connected with the 2# rubber plug from the side hole of the lysimeter with a diameter of 1.0 cm, and then the plug was tightened to prevent leakage. Several holes (diameter of 2.0 cm) were left on the sidewall of the lysimeter from the soil surface to the bottom every 20 cm; the first was 15 cm away from the soil surface. Two holes were reserved in the same horizontal plane. The connection between the center of two holes on both sides and the horizontal center of the lysimeter was a 90° angle. During the test, these side holes were strictly sealed with a 3# rubber plug and opened only when soil or water was sampled. Before using, soil-solution extractors were soaked in water for two hours to discharge the air in the gap of the clay head. The air outlet direction of the clay head was inclined upward or horizontal when placing it. This step can ensure that the clay pipe head and the gas in the pipe are discharged smoothly during the sampling. After the soil solution extractor and TDR probe were assembled, each connection was firmly connected and sealed with waterproof glue to avoid air and water leakage. At the bottom of the lysimeter, a drainage pipe was set to remove excess water from the lysimeter, and an inlet pipe was connected to a Mariotte bottle to supply water to the lysimeter. The Mariotte bottle (height 60 cm, outside diameter 11cm) was made of transparent plexiglass, and a scale bar (length 60 cm and 1.0 mm precision) was pasted vertically to record groundwater consumption (Figure 2).

2.2.2. Pre-Treatment of Experimental Soil

The experimental soil was taken from local farmland, and the soil depth was divided into four depths: 0–20 cm, 20–40 cm, 40–60 cm, and below 60 cm. The soil at the same depth was mixed and spread evenly on a plastic sheet to be air-dried, then crushed, and screened (5 mm). After the filter material filled the bottom of the lysimeter, the air-dried soil was backfilled into the lysimeter in four parts according to the original soil layer (below 60 cm, 40–60 cm, 20–40 cm, and 0–20 cm). The TDR probe and soil-solution extractors were buried in the backfilling process. The soil was silty-sandy loam (Table 1), its backfilling bulk density was 1.40 g/cm3 and was compacted and filled in layers every 2 cm. Interlayer coarsening made the upper and lower soil close contact and avoided obvious stratification. When the height of the soil reached the requirements, water would be filled from the top to form a complete soil structure. Sowing and fertilizing was started on 25 October 2020 when the soil moisture was suitable.

2.2.3. Description of Experiment

Groundwater depth and nitrogen fertilization application were two factors in the experiment, the thickness of the vadose zone referred to the actual local groundwater level and simulated the surface, subsurface, and deeper subsurface soils [38]. The depth of the shallow groundwater table depth (WTD) was set at four levels: 60 cm (G1), 90 cm (G2), 120 cm (G3), and 150 cm (G4). Based on the conventional N application rate of 300 kg/ha (3.77 g/lysimeter) (convert into purification) [8,21,39] on the North China Plain as a reference, the N fertilization application (NF) was set as 0 kg/ha (0 g/lysimeter) (NF 0), 150 kg/ha (1.88 g/lysimeter) (NF150), 240 kg/ha (3.01 g/lysimeter) (NF240), 300 kg/ha (3.77 g/lysimeter) (NF300). The experiment adopted a completely random block design with 16 treatments, and each treatment included 3 replications and 48 lysimeters in total.
Winter wheat (Triticum aestivum L.) was seeded on 25 October 2020, with the cultivar “Bainong-4199”, and the seeding amount was in reference to the local planting habit of 225 kg/ha (60 seeds/plot). Three listed and designated plants were randomly selected from each lysimeter and labeled after the emergence of the seedlings and harvested on 22 May 2021, with a total growth period of 209 days. In the experiment, common urea (available nitrogen content 46%), calcium magnesium phosphate (P2O5 content 12%), and potassium sulfate (K2O content 50%) were used as N, P, K fertilizer, and 150 kg/ha (1.88 g/lysimeter) P fertilizer (convert into purification) and 120 kg/ha (1.51 g/lysimeter) K fertilizer (convert into purification) were respectively applied according to the actual application amount in a local field. A topdressing of N fertilizer was applied at the jointing stage of the winter wheat in accordance with local fertilization habits; the fertilizer was evenly spread on the soil surface, followed by irrigating. During the whole experiment, a rain shelter was used to avoid precipitation interference. Irrigation was carried out according to 0–40 cm water content. The date and irrigation amounts are shown in Table 2.

2.2.4. Monitoring Items and Analytical Methods

Plant Height and Green Leaf Area

Three representative winter wheat plants were randomly selected in each lysimeter to measure plant height and leaf area (n = 3).
(1)
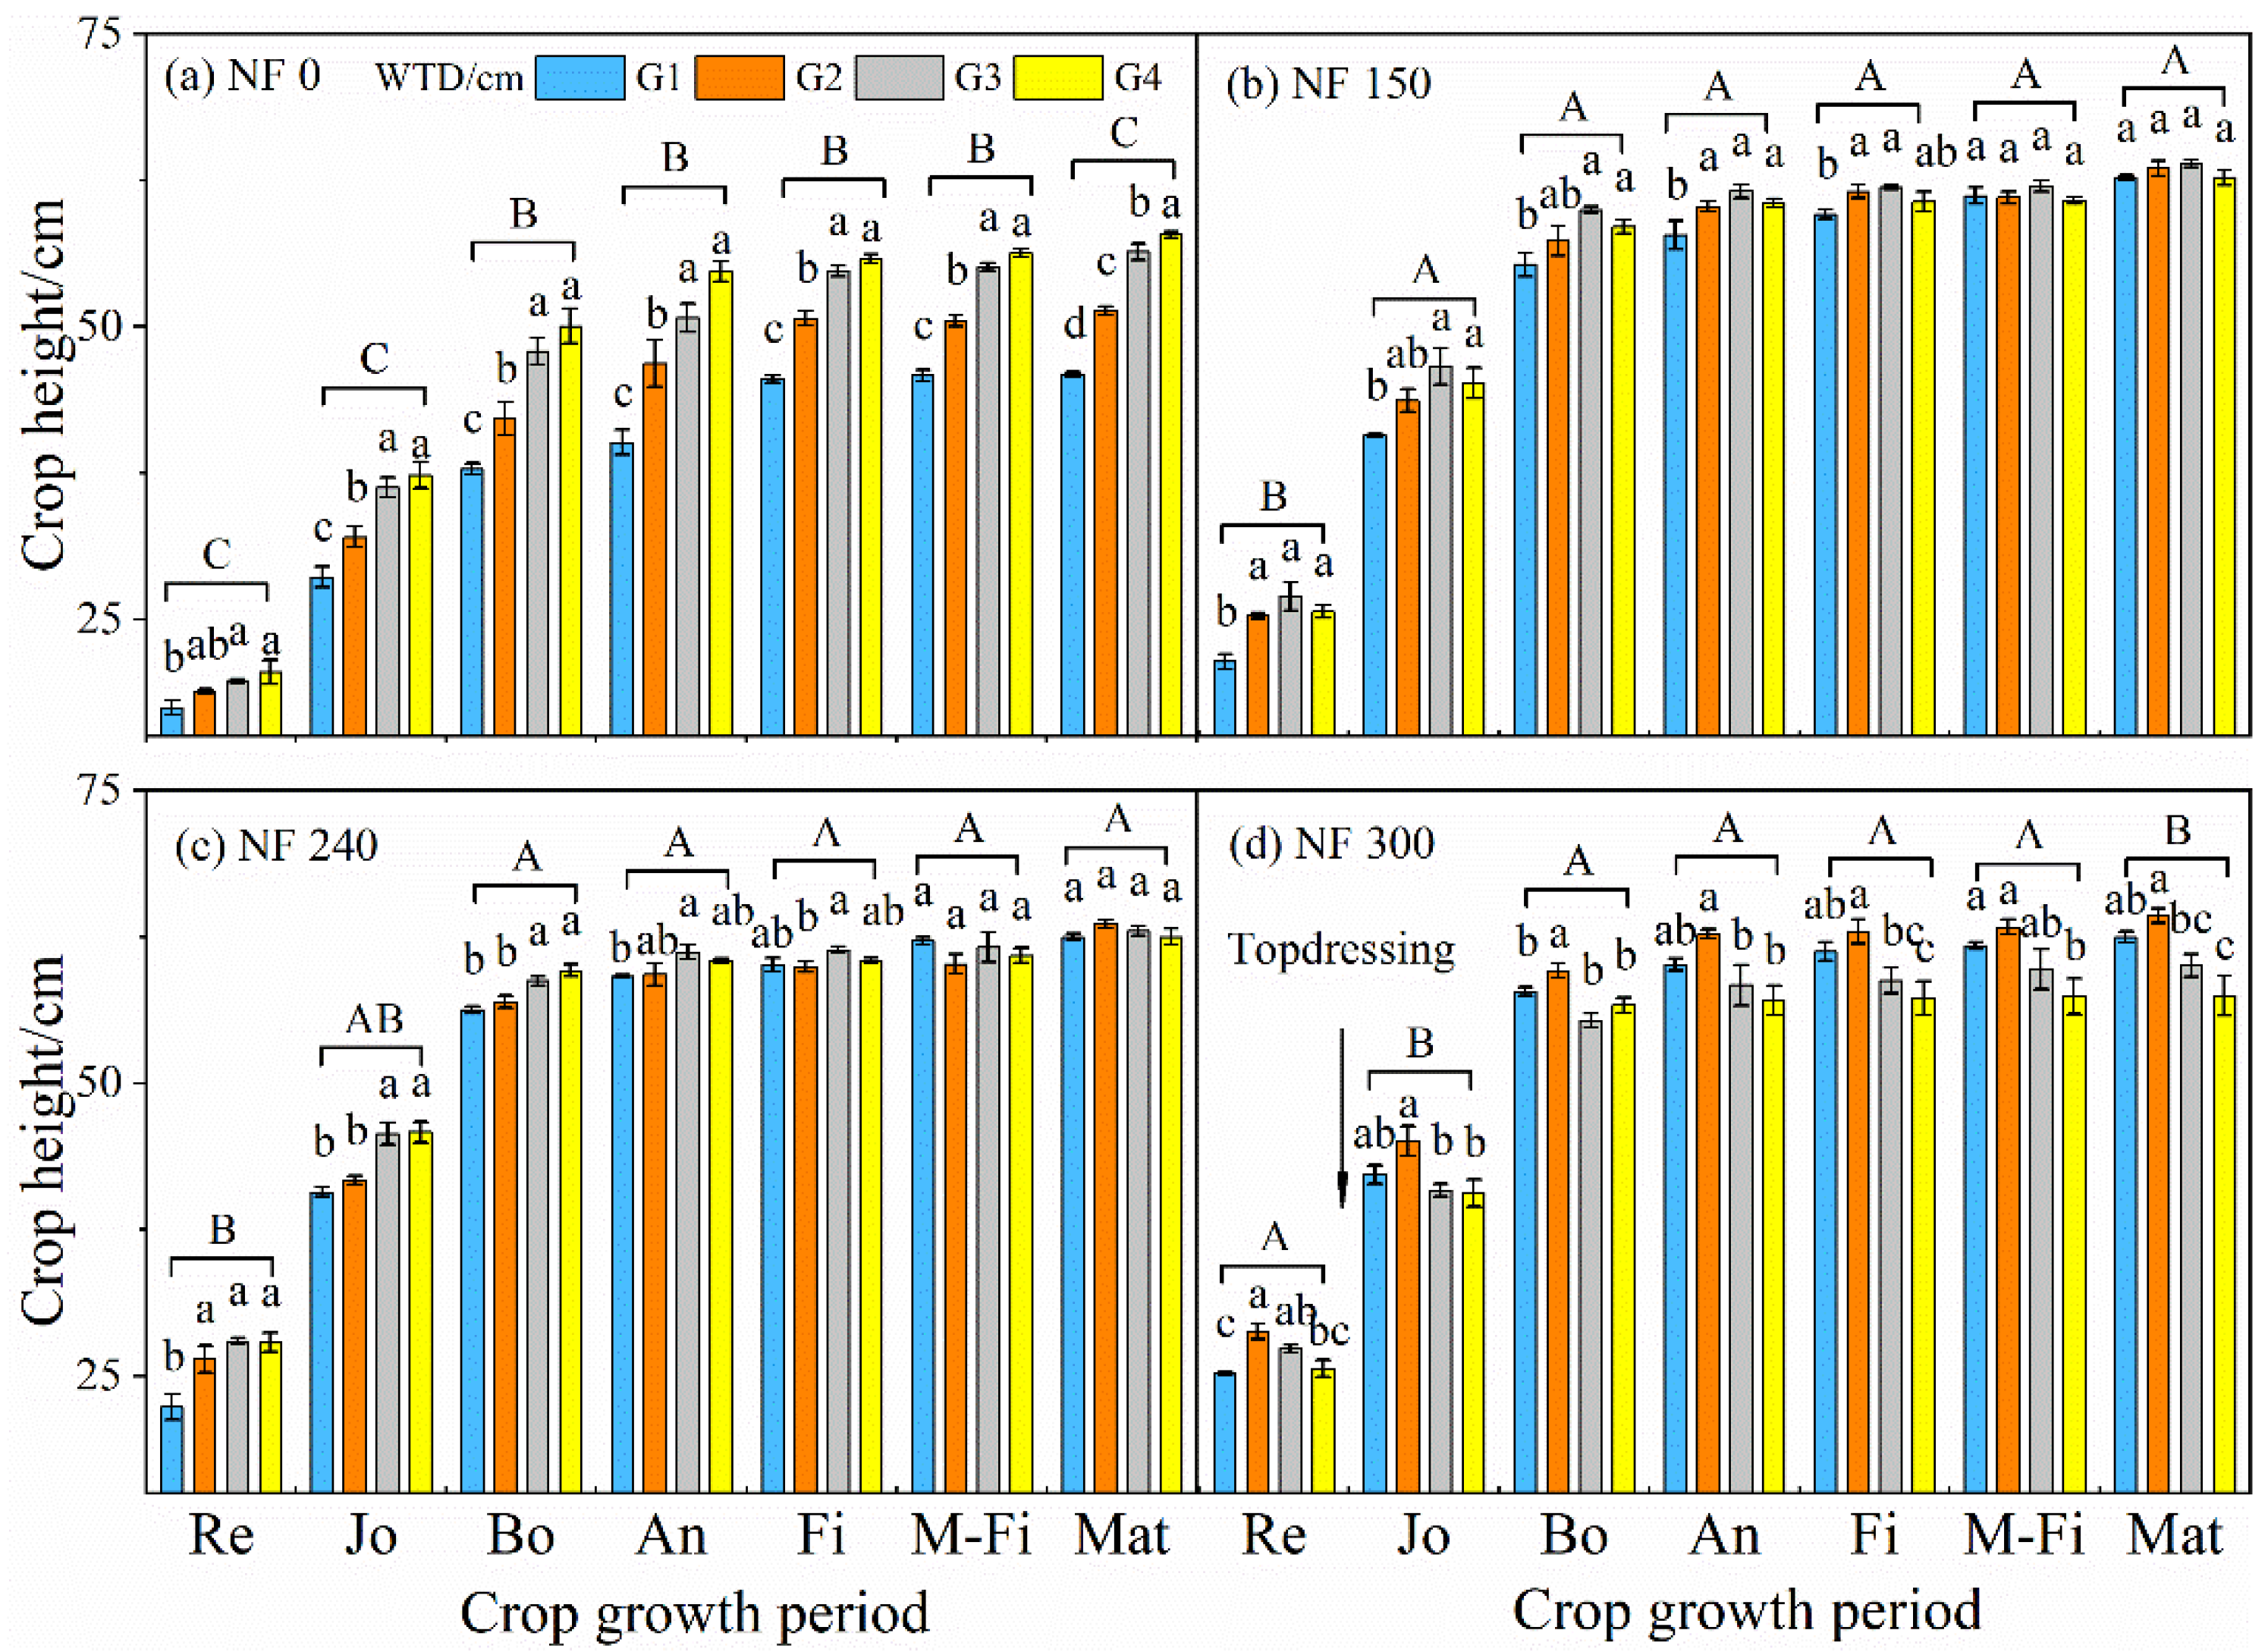
Plant height: Before the booting stage, a ruler was used to measure the distance between the base of the wheat and the highest point of leaf growth as the plant height, and the distance between the base of winter wheat and the top of the spike (excluding awn length) was used as plant height in the booting stage and later. The measured growth stages were the re-greening, jointing, booting, anthesis, filling, mid-filling, and maturity stages.
(2)
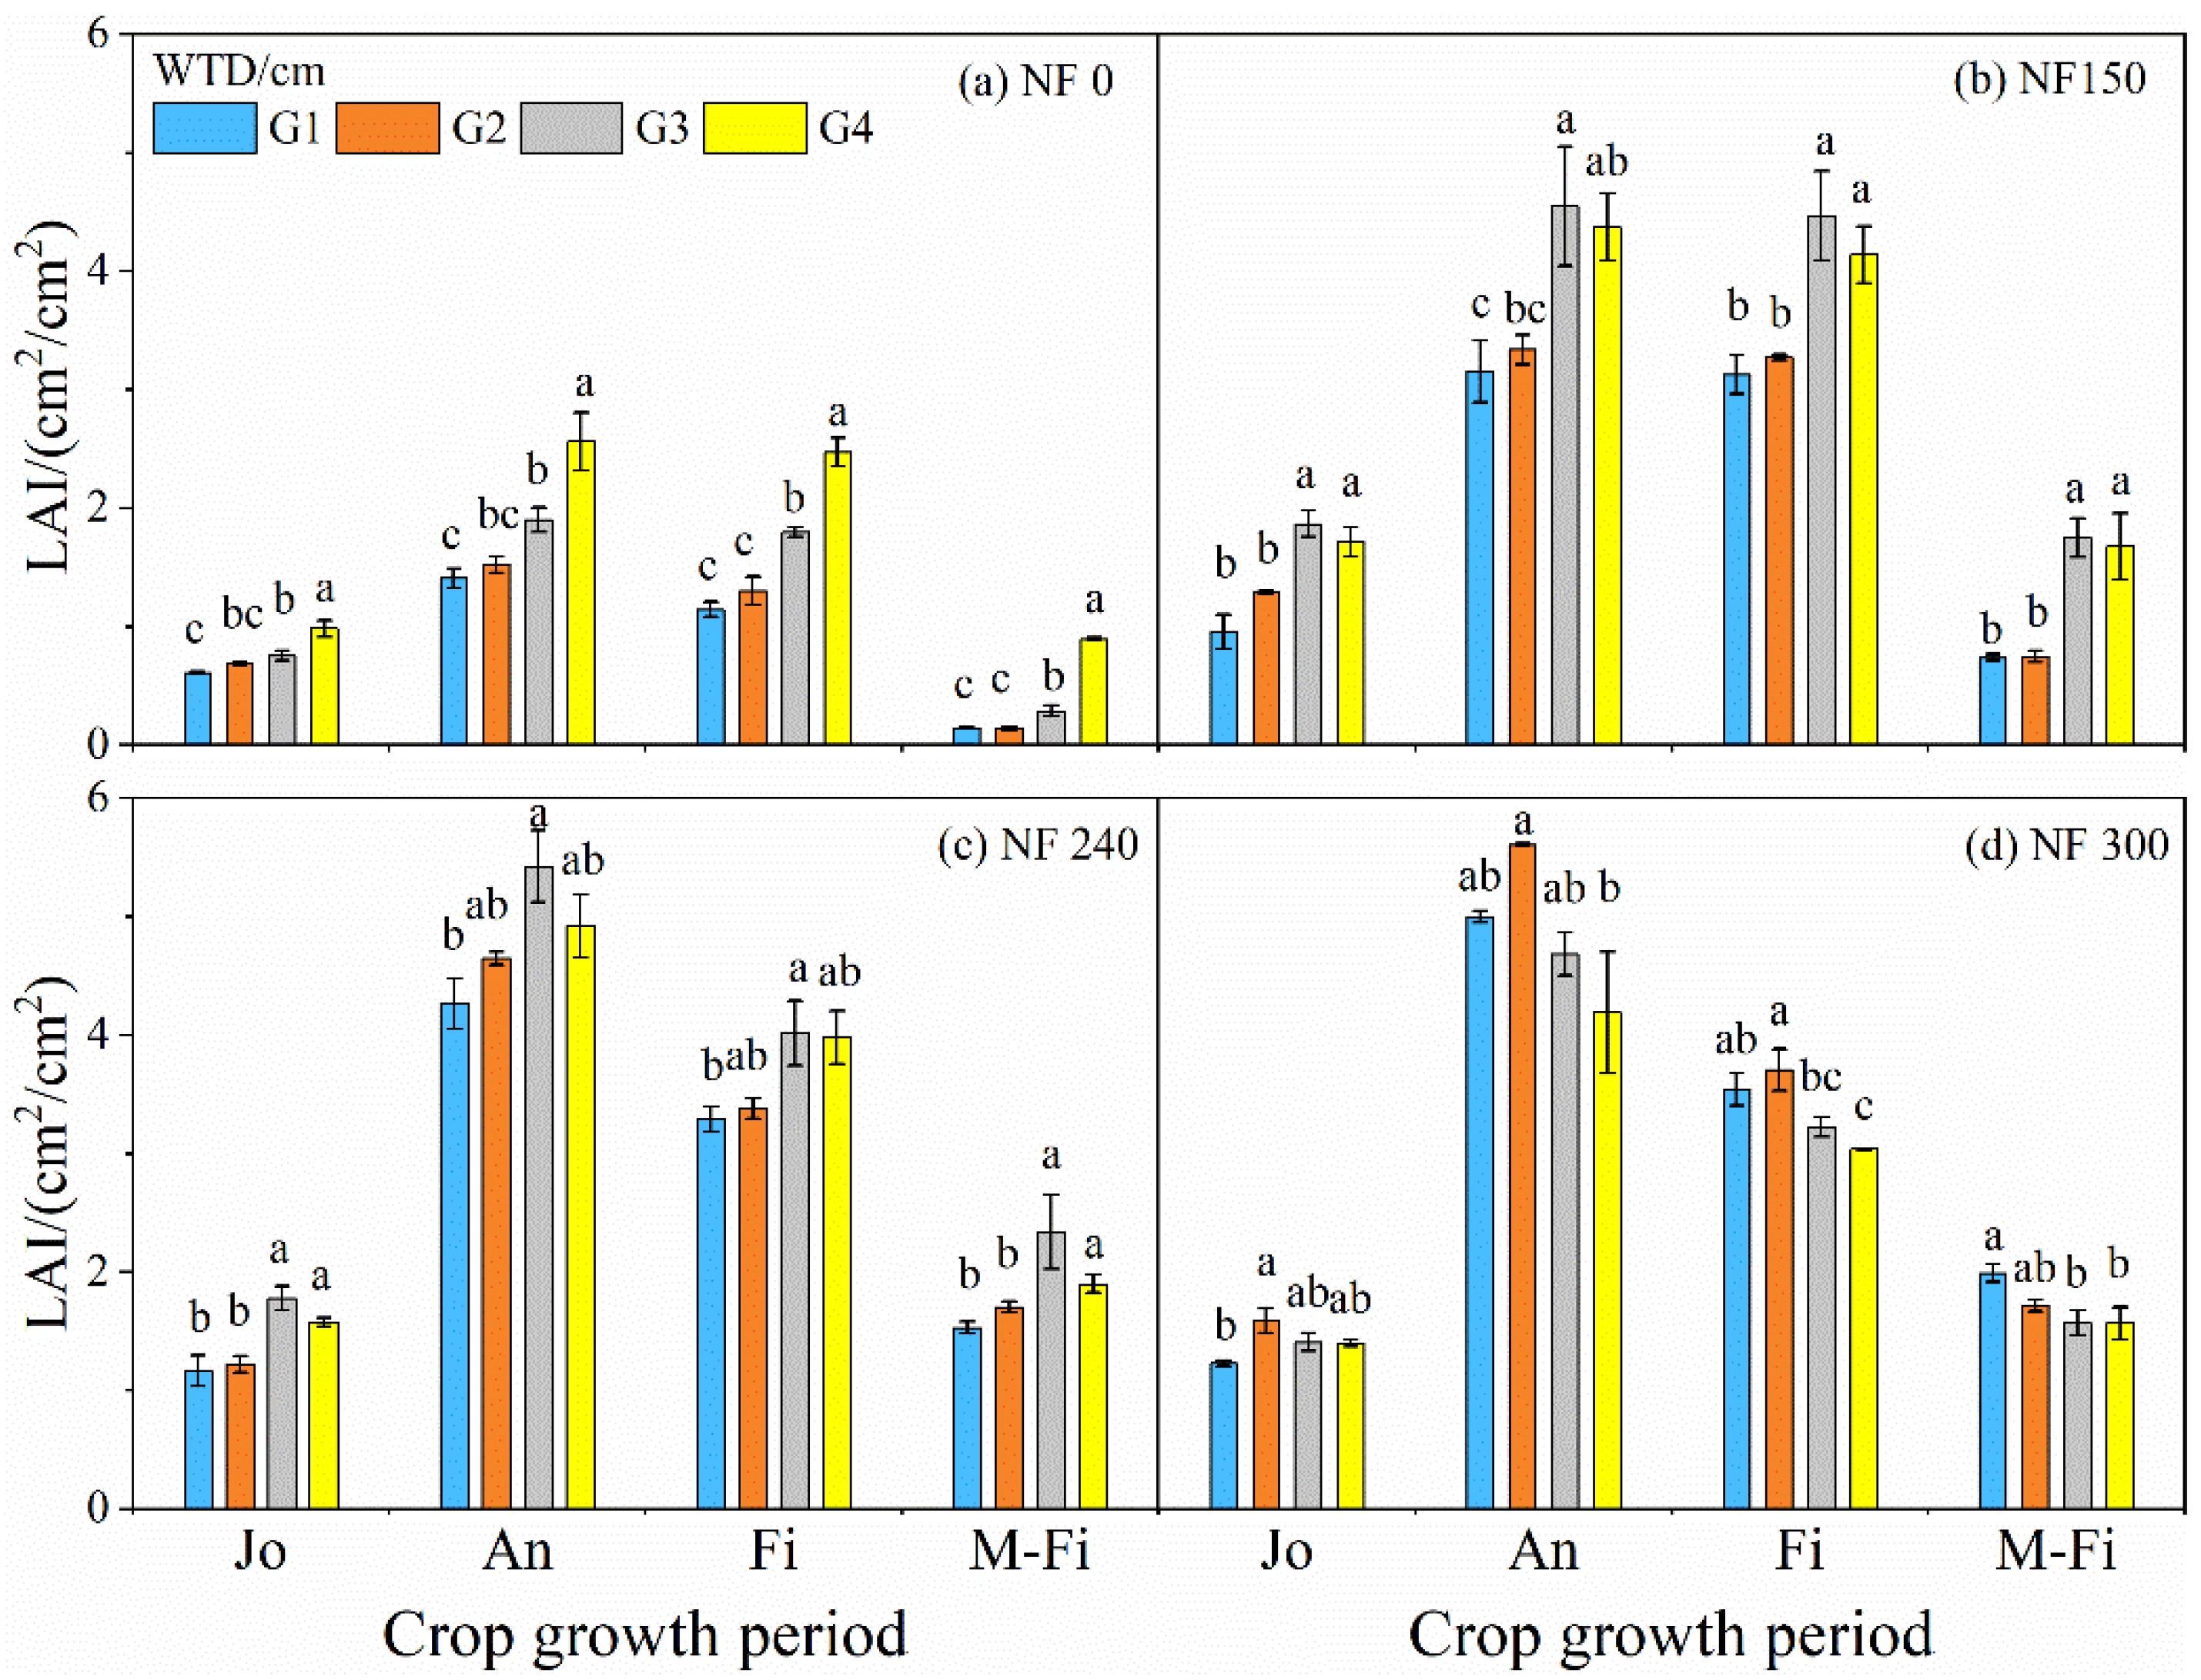
The leaf area index: The maximum leaf-length and maximum leaf-width of the winter wheat were measured with a ruler. The leaf area index (LAI) was calculated by using the ruler method and the length-width coefficient method, and the conversion coefficient was 0.8. The measured growth stages were the jointing, anthesis, filling, and middle of filling stages.

Soil Plant Analysis Development (SPAD)

Three representative plants were randomly selected from each lysimeter (n = 3) before (four days prior to the date of topdressing) and after (eight days after the date of topdressing) topdressing; SPAD measurements were taken at the midpoint of the uppermost fully developed leaf by chlorophyll meter (Zhejiang Top Cloud-agri Technology Co., LTD, TYS-B, Zhejiang, China) and the veins of the leaves were avoided during measurement.

Yield and Its Components

At the maturity stage, marginal effect plants were excluded from being chosen, and 10 single stems (n = 10) with consistent growth were randomly selected to record ear length, grain number per ear, number of spikes per spike, number of infertile spikes per spike, stem diameter, and spikes per area of the winter wheat. The rest of the winter wheat in each lysimeter was weighed after threshing to calculate the yield, and we recorded the 1000-grain weight (n = 5). Vernier calipers measured stem diameter at the middle of the penultimate stem node. The following formula was adopted for the rate of growth of yield under the same groundwater depth:
Rate of growth (%) = (yield of N application–yield without N application)/(yield without N application) × 100%

Soil Moisture of 0–60 cm Soil Layer

Soil moisture was obtained from two sources: (1) The soil moisture of different soil layers in the lysimeter was derived from Shandong Renke Environmental monitoring platform V3.5.0 (Shandong Renke Measurement and Control Technology Co., LTD. Shandong, China); (2) The soil was collected at the maturity stage of the winter wheat and placed in an oven at 105 °C to be dried until the constant weight and the soil mass moisture were calculated. The soil moisture came from (2) in this article.
Soil water storage (mm) = soil mass water content (%) × soil bulk density (g/cm3) × soil layer height (cm) × 10

Nitrate-N Content of 0–60 cm Soil Layer

Ten g fresh soil samples were extracted with 0.01 mol/L CaCl2 after harvest and analyzed for Nitrate-N content using AA3 flow analyzer (Bran Luebbe Gmbh, Hamburg, Germany) in the laboratory.
Nitrate-N accumulation (kg/ha) = nitrate-N content (mg/kg) × soil mass water content (%) × soil bulk density (g/cm3) × soil layer height (cm)/10

2.3. Statistical Analysis

The differences among treatment means were tested by analysis of variance (ANOVA), using SPSS 23.0 (SPSS Inc., Chicago, IL, USA). When the F value in the ANOVA was statistically significant, Duncan at the level of 0.05 significance was used to separate the means. Person’s correlation coefficients were used to analyze the relationships among physiological traits, water–nitrogen accumulation, and grain yield.

3. Results

3.1. Winter Wheat Plant Height

The Plant height of the wheat under N application was significantly higher than that without N application, but there was no significant difference among N application treatments generally (Figure 3). In NF 0 treatment, plant height at each growth stage was significantly boosted with the increase of groundwater depth; G3 and G4 treatment was significantly higher than that of G1 and G2 treatment (Figure 3a). In NF150-NF240, plant height initially increased and then decreased with the increase of groundwater depth from regreening to the flowering stage, and plant height was greater in G3 and G4 than in G1 and G2 significantly; this law was more obvious under NF150 treatment. From filling to the maturity stage, plant height was not significantly different under all groundwater depths (Figure 3b,c). During the whole growth period, the plant height of NF300 treatment increased first and then decreased with groundwater depth, and the maximum value appeared at G2 depth, which was significantly higher than others (Figure 3d). Noticeably, the growth rate of winter wheat in the G1–G2 treatment was faster after topdressing and was significantly higher than that in the G3 and G4 treatment in the later growth stage (Figure 3d).

3.2. Winter Wheat Leaf Area Index

The leaf area index (LAI) of the winter wheat was the maximum at the flowering stage under all N application and groundwater depths (Figure 4a–d). LAI increased with the increase of groundwater depth without N application, and there were significant differences at groundwater table G1 and G2, G3 and G4 depths (Figure 4a). LAI in each N application group increased first and then decreased with the increase of groundwater depth, it attained the maximum in G3 treatment under NF150-NF240, and the depth of range G3–G4 treatment was significantly higher than that of range G1–G2 treatment (Figure 4b,c). In NF300 treatment, the LAI of G1 and G2 depths was significantly higher than that of G3 and G4 depths, and the maximum LAI was at G2 depth, while G2 treatment had a decreasing trend in the middle of grain-filling (Figure 4d). LAI of NF240–NF300 treatment was significantly higher than that of NF0–NF150 treatment from anthesis to mid-filling stage, indicating that N application could promote the growth of winter wheat leaves and affect the growth process (Figure 4b,c). Therefore, the law could be found that at N application with the rate of NF0–NF240, LAI of G3 and G4 treatment was higher than that of G1 and G2, while at higher N application rate (NF300), LAI maximum showed an obvious reducing trend corresponding to groundwater depth with increasing N amount (Figure 4d).

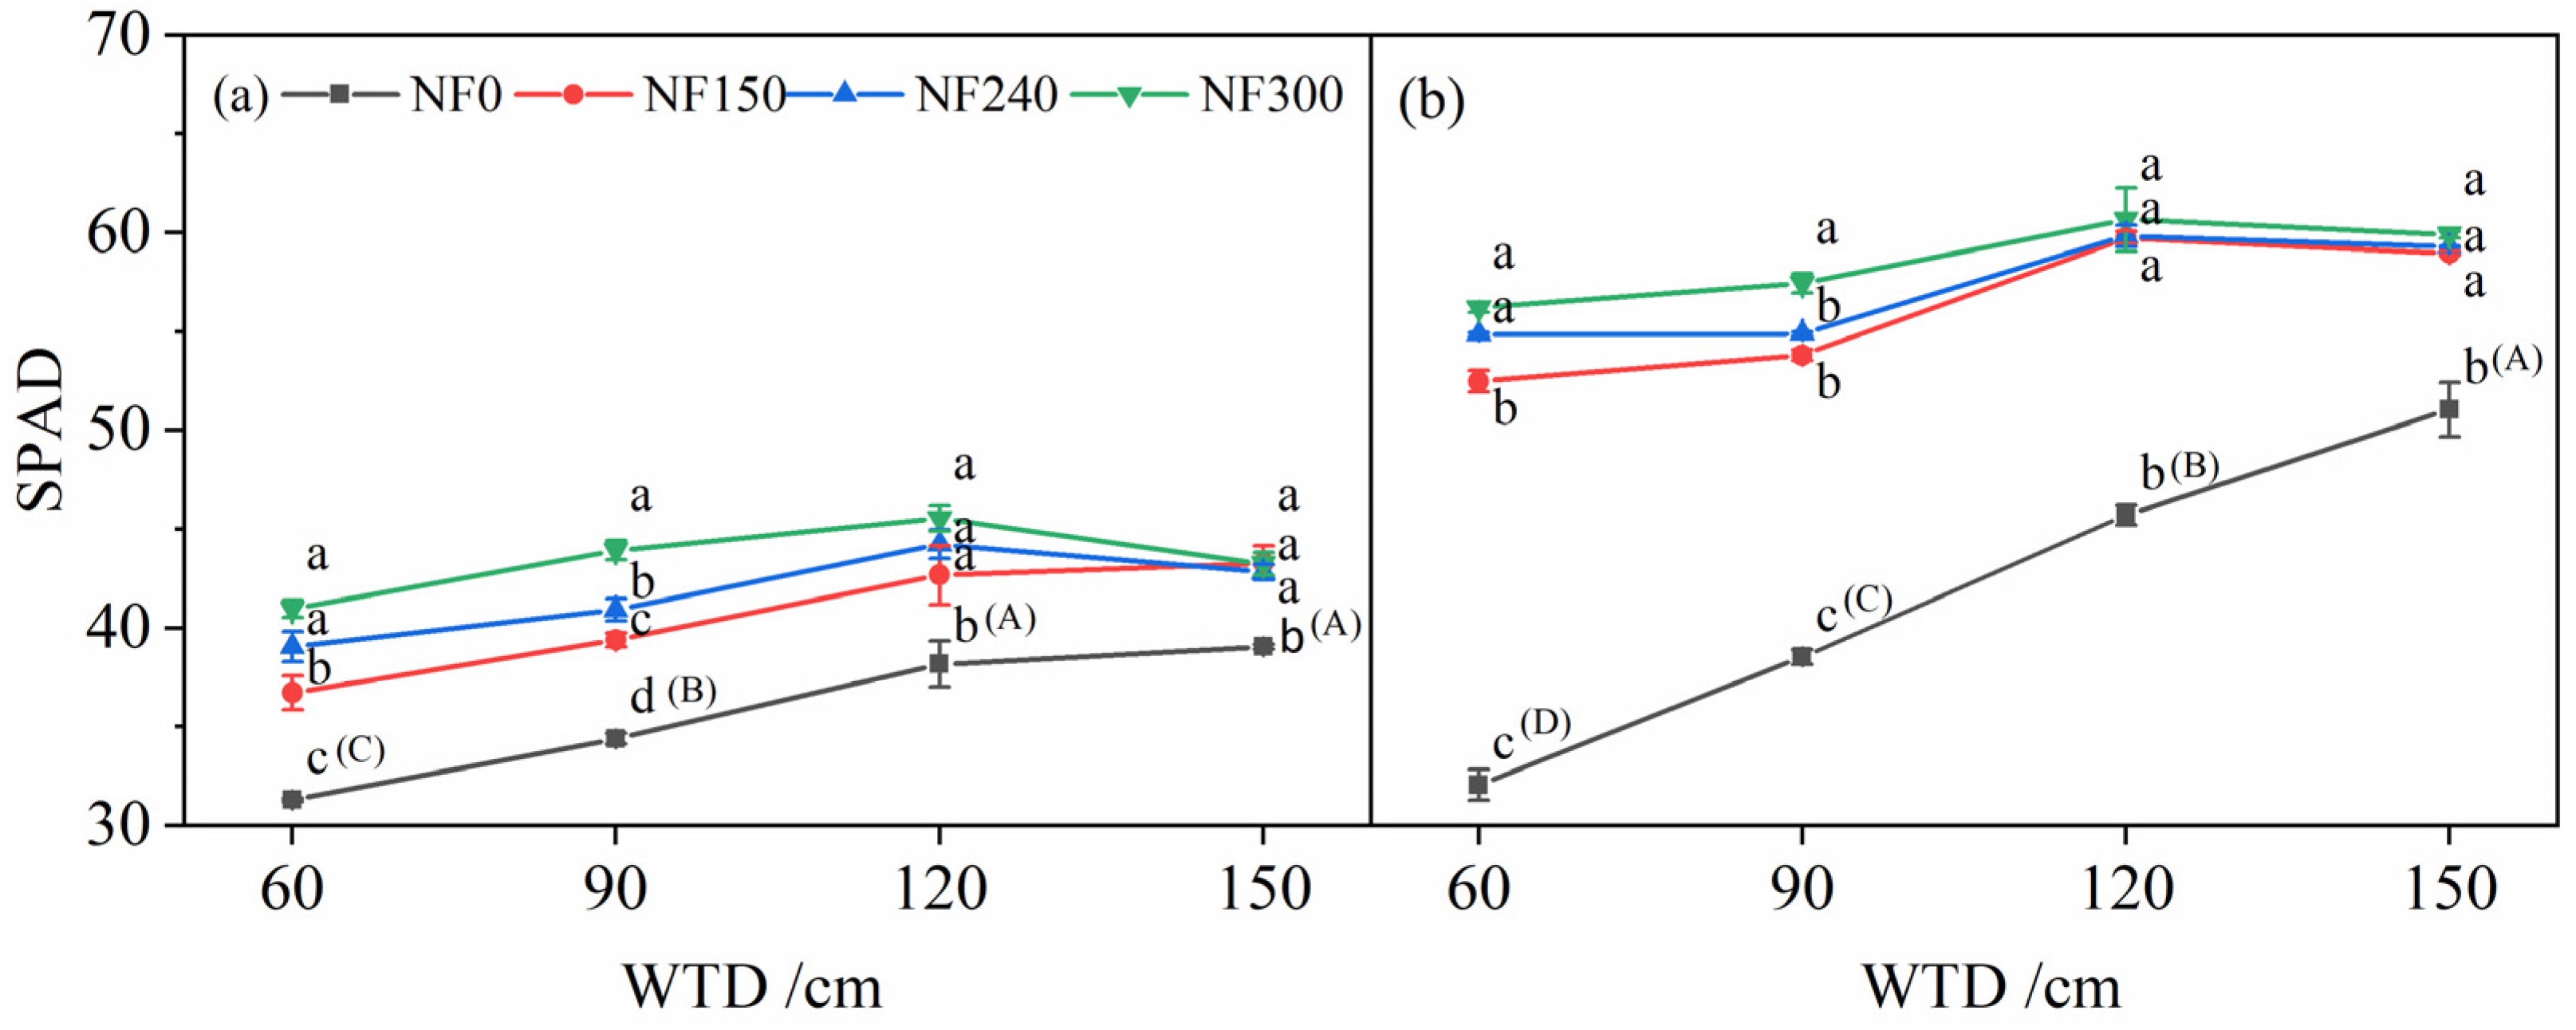
3.3. Winter Wheat Soil Plant Analysis Development before and after Topdressing

The soil plant analysis development (SPAD) of the winter wheat under NF0 treatment increased significantly with the increase of groundwater depth before and after topdressing, with the order G4 > G3 > G2 > G1, but significantly lower than that under N application (Figure 5a,b). The results demonstrated that SPAD increased first and then decreased with the groundwater depth before the topdressing stage of winter wheat, while the SPAD was maximum at G3 treatment. At the G1 and G2 depths, the SPAD was significantly higher in the NF300 treatment than the NF150–NF240 treatment; the lowest SPAD was noticed at the combination of NF150G1 (36.73) treatment. The variation of wheat SPAD with N application and groundwater depth after topdressing was similar to pre-topdressing but significantly higher than pre-topdressing. The differences between treatments became smaller compared with the pre-topdressing (Figure 5b).

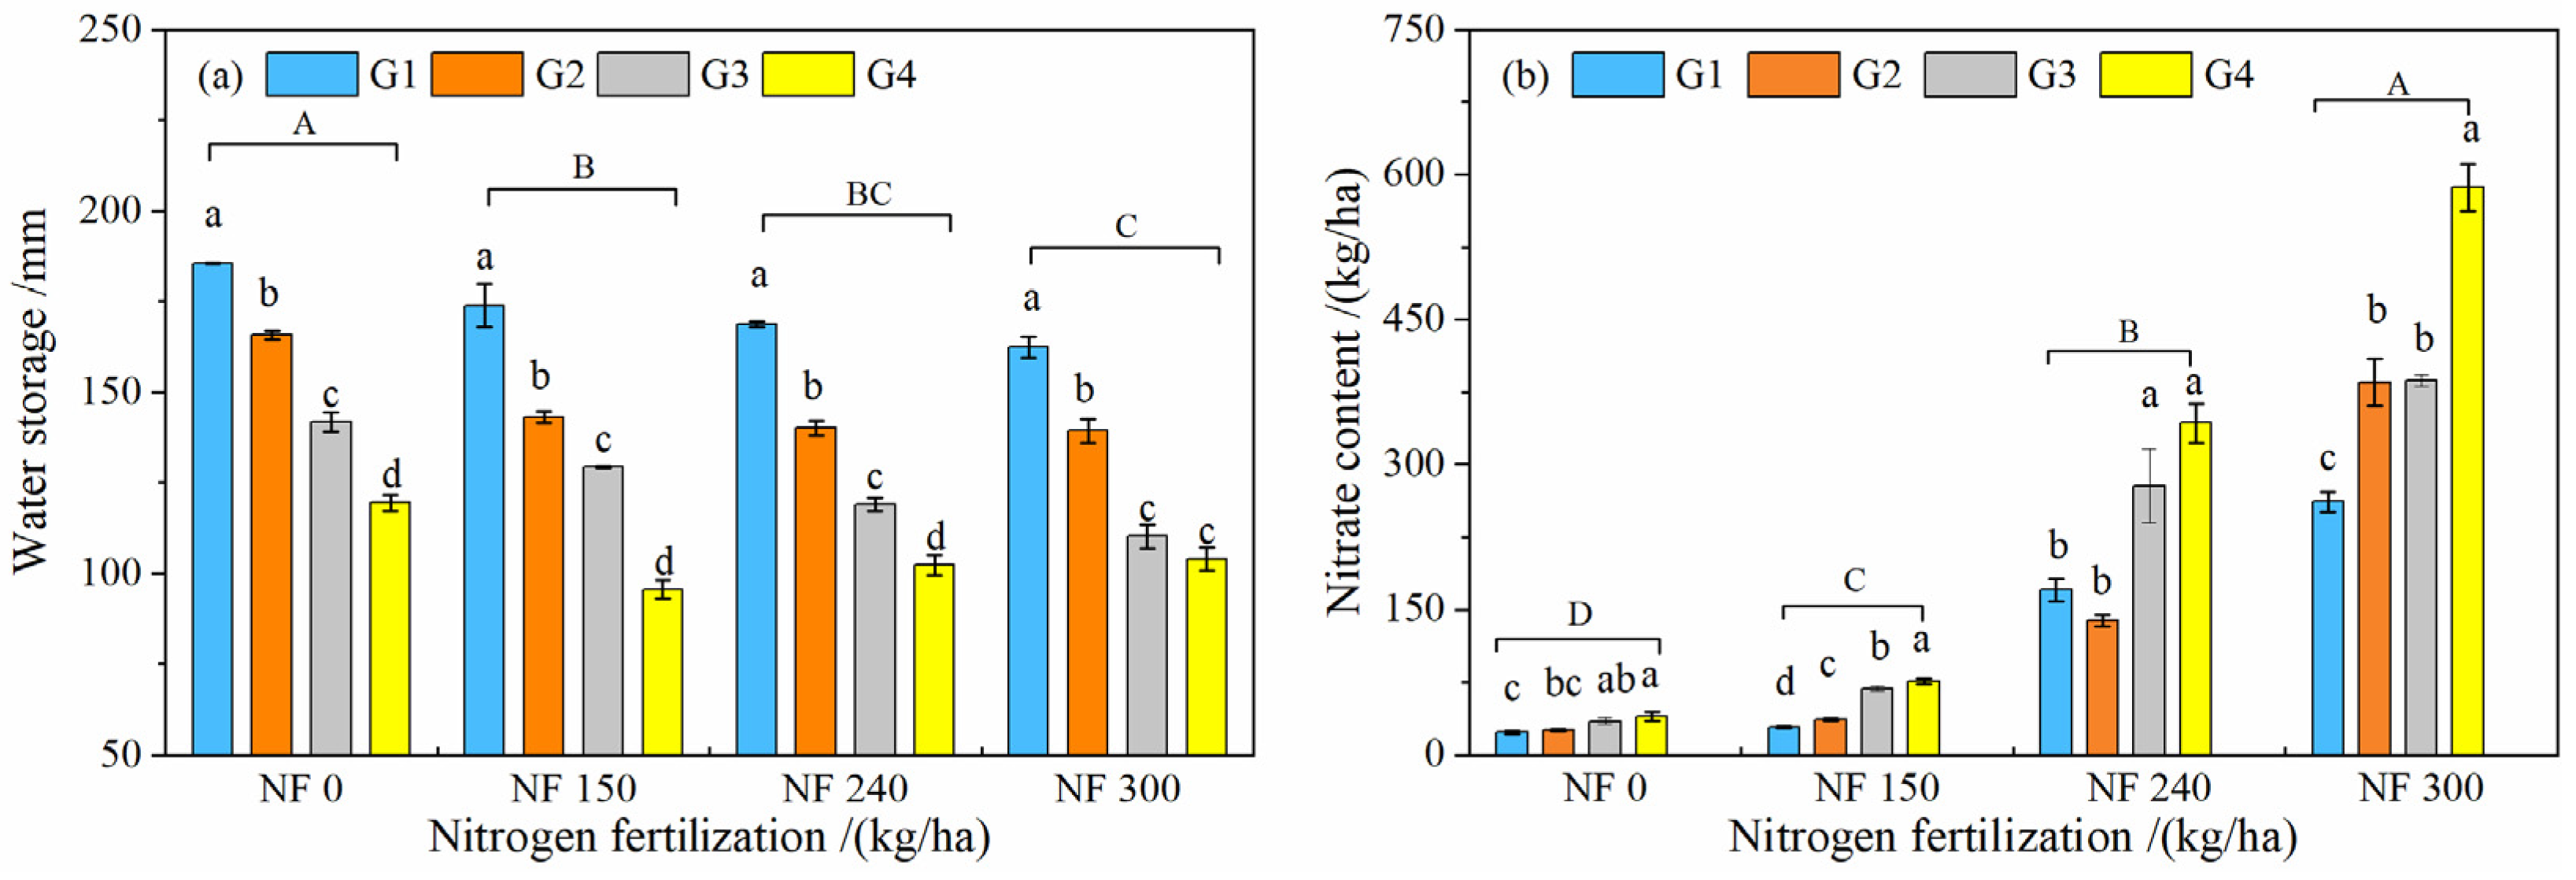
3.4. Water and Nitrate-N Storage in 0–60 cm Soil at Maturity

Groundwater supply to crops and atmospheric water-loss through soil capillary gap and crop roots due to crop–soil–atmosphere influencing, and groundwater depth greatly affects soil moisture. Similarly, water storage in 0–60 cm soil layer decreased significantly with the increase of groundwater depth and N application rate with the order: G1 > G2 > G3 > G4 and NF0 > NF150 > NF240 > NF300 (Figure 6a), respectively.
N application affects crop growth and significantly changes the content of inorganic nitrogen in the vadose zone. The content of nitrate-N in 0–60 cm (main root layer of crops) soil layer at G3 and G4 depth was significantly higher than that at theG1 and G2 depths (Figure 6b). N application increased soil nitrate-N residual amount, the higher the application amount and the larger the residual amount of main root layer of crops; NF0–NF300 treatment nitrate-N residual amount increased significantly with the increase of N application amount. Compared with NF150–NF240, NF300 treatment was 6.7 times than NF150 treatment and increased by 74% than NF240 treatment.

3.5. Winter Wheat Yield and Its Components

The ear length, grain number per ear, the number of spikes per spike, stem diameter, 1000-grain weight and yield of NF0 treatment increased significantly with the increase of groundwater depth, while the number of infertile spikes per spike varied on the contrary (Table 3). Ear length, 1000-grain weight, and spikes per area were significantly higher at G3 and G4 than at G1 and G2 in NF150–NF240 treatment, grain number per ear was opposite, and the yield of the G3 depth was the highest. Grain number per ear and number of spikes per spike of NF300 treatment increased with the increase of groundwater depth, G3 and G4 depth was significantly lower than G1 and G2 depth, and the yield was the highest at the G1 and G2 depths, but the yield at the G4 depth was significantly lower than other treatments (Table 3). The groundwater level corresponding to the maximum yield increased with the increase of N application. Winter wheat yield and its components of NF150–NF300 treatment were significantly better than those of NF0 treatment, but yield components of NF300 treatment were lower than those of NF150–NF240 treatment, and the yield had no significant difference compared with NF240 (Table 3). With the increase of groundwater depth and N application rate, compared with the traditional N application (NF300), the yield of NF150–NF240 increased by 1.76%–3.90% at G3 depth and 11.09%−11.44% at G4 depth respectively. The rate of growth declined with the increase of groundwater depth and N application (Table 3).
In order to study the effects of groundwater depth, N application rate, crop growth attributes (plant height, LAI, and SPAD) on winter wheat yield and soil nitrate-N accumulation to the environment, correlation analysis and curve fitting were conducted (Figure 7). Under no N application treatment (NF0), there was a significant linear relationship between the yield and groundwater depth (R2 = 0.95 **) and no inflection point tentatively; under N application treatment, there was a quadratic relationship between yield and groundwater depth (R2 = 0.50 *−0.82 **), and groundwater table level at the highest yield was 71.19–123.77 cm, which was generally called the optimal groundwater level generally (OP-T) (Figure 7a).
Crop growth was mainly affected by background nitrogen values with NF0 treatment, and the yield of G4 was the highest. It was assumed that the OP-T was 150 cm under this condition. The relationship between the OP-T obtained by each N application group and the N application amount was established (Figure 7a), and it was found that the OP-T decreased with N application rate increase. There was a significant quadratic function relationship among N application rate, growth attributes, and yield of winter wheat (R2 = 0.76 ** = 0.94 **) (Figure 7b–e). The fitting curve showed that N application rate was 245.65 kg/ha, and the yield was the maximum of 8928.72 kg/ha. Under the condition of shallow groundwater depth, the residual nitrate-N in the 0–60 cm soil layer presented a significant quadratic function relationship with the N application rate (Figure 7f) (R2 = 0.79 **). The nitrate-N accumulation in the vadose zone increased slowly at first with the increase of the N application rate, and then it increased sharply when the N application rate exceeded a certain value (Figure 7f).

4. Discussion

4.1. Growth Attributes of Winter Wheat

The effect of groundwater on winter wheat occurs mainly through the upward water supply of soil capillary void and the growth environment of winter wheat [35,40,41]. Previous studies have shown that the growth attributes of the crop increased with the increase of groundwater depth or first increased and then decreased at the range of groundwater depth was 0.2–1.5 m, and there was little difference in plant height after the crop entered the reproductive stage [26,35,42]; and they decreased with the increase of groundwater depth when groundwater table was deeper (>2 m) [25,43]. In our study, the evolution of crop growth attributes along with groundwater depth was affected by N application rate (Figure 3, Figure 4 and Figure 5). Without N application, growth attributes increased significantly with the increase of groundwater depth (0.6–1.5 m) (Figure 3a, Figure 4a and Figure 5), consistent with previous studies [35,42]. On the one hand, a crop–soil system may lack an exogenous nitrogen supply without N application and nitrogen source mainly affected by the thickness of the vadose zone; the thicker vadose zone can not only carry more nitrogen itself, but the existing oxidation environment can be unbeneficial to a denitrification reaction [44], and crop growth can obtain a more adequate nitrogen source (Figure 6b). On the other hand, the thin vadose zone had higher soil water moisture and poor soil aeration. The reductive environment formed would induce denitrification reaction [44], leading to nitrogen loss and crop nitrogen deficiency. Meanwhile, the root activity of crops is also limited with the high groundwater table, which would make them vulnerable to waterlogging and affect crop growth ultimately [45,46].
Under the condition of N application, crop growth attributes increased first and then decreased with the increase in groundwater depth, and there existed an optimal groundwater table (OP-T) corresponding to the better crop growth attributes, which was similar to previous studies [26,47], but OP-T was obviously affected by the N application rate and tended to increase with the rise of N application rate (Figure 3b–d, Figure 4b–d and Figure 5). The groundwater table level in our experiment was above the critical groundwater table, and the water consumption of soil–crop system was mainly from groundwater, which was reported in previous findings [29]. The vertical water moisture of the vadose zone at the low groundwater table (150 cm) varied greatly, water exchange in the upper and lower vadose zones was difficult [48]. Water and nitrogen translocation in the upper vadose zone by groundwater formed a top supporting effect. High N application rate (300 kg/ha) further increased soil nitrogen residue (Figure 6b), which was not beneficial to crop growth (Table 3). Water exchanges between groundwater and atmospheric system were active at higher groundwater tables (60–90 cm), and soil moisture was high (Figure 6a), which was similar to the conclusion of previous findings [43,48]. Crops were easily subject to waterlogging stress, resulting in the dwarfism of plants, yellowing of leaves, and premature senescence (Figure 3, Figure 4 and Figure 5a), particularly when N application was insufficient (Figure 3a,b), which supported the previous findings [45,49,50], But adding N application in our findings, herein, could increase plant height, stem rough chlorophyll content and other physiological growth indexes to a certain extent under these high groundwater table (60–90 cm) (Figure 3, Figure 4 and Figure 5), and alleviate waterlogging stress as depicted in previous results [51,52]. Therefore, the OP-T tended to increase with N application increase as demonstrated in Figure 3, Figure 4 and Figure 5. In addition, it can be discovered from the variation of plant height, leaf area, and chlorophyll content with the growth process of winter wheat (Figure 3, Figure 4 and Figure 5) that the combined treatment of groundwater depth and N application may change crop’s growth process, but further research is needed.

4.2. Winter Wheat Yield and Its Components

The ANOVA test results showed that N application and groundwater depth significantly affected winter wheat yield and its components (Table 3). Without N application, wheat yield and its components (except number of infertility spikes per spike) both increased with the increase of groundwater depth (Table 3), indicating that, in the absence of an exogenous N supply, the groundwater’s supply of crop nutrients mainly depended on the amount of nitrogen carried by the vadose zone itself. The groundwater depth was deeper, the vadose zone was thicker, and it carried more nutrients (Figure 6b). Grain number per ear, number of spikes per spike, and spikes per area increased first and then decreased with the increase of groundwater depth under N application, and the maximum value appeared at 90–120 cm, which was similar to previous studies [35]. Zhang et al. [35] found that increasing fertilizer application contributed to increasing spikes per area, 1000-grain weight, and grain number per ear, which was similar to our findings (Table 3).
Studies have shown that the OP-T corresponding to yield was significantly restricted by external conditions [53], and the OP-T of wheat was 0.5–1.5 m [27,35,54,55]. In this study, it was found that the OP-T of winter wheat was 0.6–1.2 m (Table 3, Figure 7a), which tended to increase with the increase of N application (Figure 7a, Table 3), possibly due to the increased N application, which was helpful to improve the anti-waterlogging stress ability of crops under high groundwater table and supplement nitrogen loss caused by denitrification. N application can promote crop yield, but excessive N application would result in “diminishing returns” and increasing nitrate-N residues in the vadose zone [21,39], which supported our study, especially under the treatment of 120–150 cm depth (Table 3, Figure 7b). The fitting curve of grain yield and N application rate of winter wheat showed that the highest yield was achieved with an N application rate of 245.65 kg/ha (Figure 7b), which was similar to the results of previous studies [21]. In addition, from the perspective of actual production, our study showed that, with the increase in groundwater depth, both yield and its growths decreased from no significant difference under low to middle N application (150–240 kg/ha) to significantly decreased under high N application (300 kg/ha), indicating that the deeper groundwater depth would obtain the great potential of reduction N application. Particularly in recent years, a large amount of fertilizer has been applied, and groundwater was overexploited on the NCP to get high yields, which have resulted in a much lower groundwater table (>1.5 m) [39,56], and a thicker vadose zone year by year, leading to a large amount of seasonal nitrogen residue in the soil and the next crop is planted with high background nitrogen content [39,57,58,59]. Therefore, it is feasible to reduce the N application by 20% on the NCP, based on our study, without the influence of crops yield.

4.3. Soil Water and Nitrogen Storage

Shallow groundwater is one of the important water sources for crops [60], which not only meets crop water requirements but also affects the crop growth environment and induces soil-nitrogen-related reactions [39,61,62], resulting in soil nutrient loss [44]. In this study, it was found that soil moisture decreased significantly with the increase of groundwater depth (Figure 6a), while soil nitrate-N accumulation changed on the contrary (Figure 6b). The buried depth of the groundwater table was the main limiting factor on soil moisture [26,43]. The conversion of groundwater and soil water was more active, and the soil moisture was higher when the groundwater table was shallower (Figure 6a), which was also in line with previous findings [63], but this will reduce the soil oxygen content in the root layer, and the soil denitrification intensity may be strengthened [64]. Compared with higher groundwater table, water supply at low groundwater table was weak, and soil moisture decreased significantly (Figure 6a). Migration and transformation of nitrogen in the vertical profile was affected by soil moisture evaporation and crop absorption, and nitrogen may be enriched in the root layer (0–60 cm) (Figure 6b), as depicted previously [43]. Meanwhile, a high groundwater table would also increase the nitrate-N utilization of crops [43], soil residual nitrate-N may be further reduced, thus nitrate-N tended to be enriched in thicker vadose zones [65]. Ruiz et al. [66] found that in depths of 0–60 cm without N application, nitrate-N accumulation of the soil layer in winter wheat–soybean and soybean planting areas after harvest was 50–74 kg/ha when the groundwater depth was 0.7–2.0 m; this value was higher than ours, which may be due to the depth of the groundwater in our experiment being shallower; that would lead to more nitrogen loss, and soybeans can retain more nitrogen by nitrogen fixing. N application promotes crop growth and is a major agricultural measure to achieve stable and high crop yields [67], but N application increased soil nitrate-N content (Figure 6b), leading to soil drought [68], and nitrate-N residue may accumulate with the progress of crop growth [66], especially excessive N application was applied. In our study, it was found that nitrate-N accumulation increased significantly with the rise of N application rate (Figure 6b), while soil moisture showed a contrary tendency (Figure 6a), which was similar to Zhang et al. [69]. This may lead to poor crop growth with low groundwater tables (Figure 3 and Figure 4) and reduce yields (Table 3).
There was an obvious coupling mechanism between N application and groundwater depth on nutrient occurrence and environment in the soil vadose zone. Application of 0–150 kg/ha N at the 60–90 cm depth may be insufficient, which was manifested as nutrient deficiency (Figure 5), as similar to previous conclusion [52]. In our results, 240–300 kg/ha N application can effectively replenish the soil vadose zone system, making up for nitrogen loss, such as high-intensity denitrification, leaching and dissolving under high groundwater table, as depicted previously [44,64,70], which may promote crop growth. Additionally, 150–240 kg/ha N application was moderate and could promote crop yields at a depth of 90–150 cm (Table 3). However, the vadose zone was thick, and the N application rate was high as N rate of 300 kg/ha. Soil nitrate-N accumulation was large (Figure 6b), which was not conducive to crop growth and yield formation (Table 3). Similar results were demonstrated by previous researchers [21,38,65]. The results indicated that increasing N application could relieve crops’ resistance to the high groundwater table and supplement nitrogen, but the low groundwater table might increase nitrate-N accumulation and adversely affect crop growth (Figure 6b). Therefore, the effect of groundwater depth on crop growth and yield may be the interaction between soil nutrients and the environment, which may be an important reason why different studies have different or no optimal groundwater table.

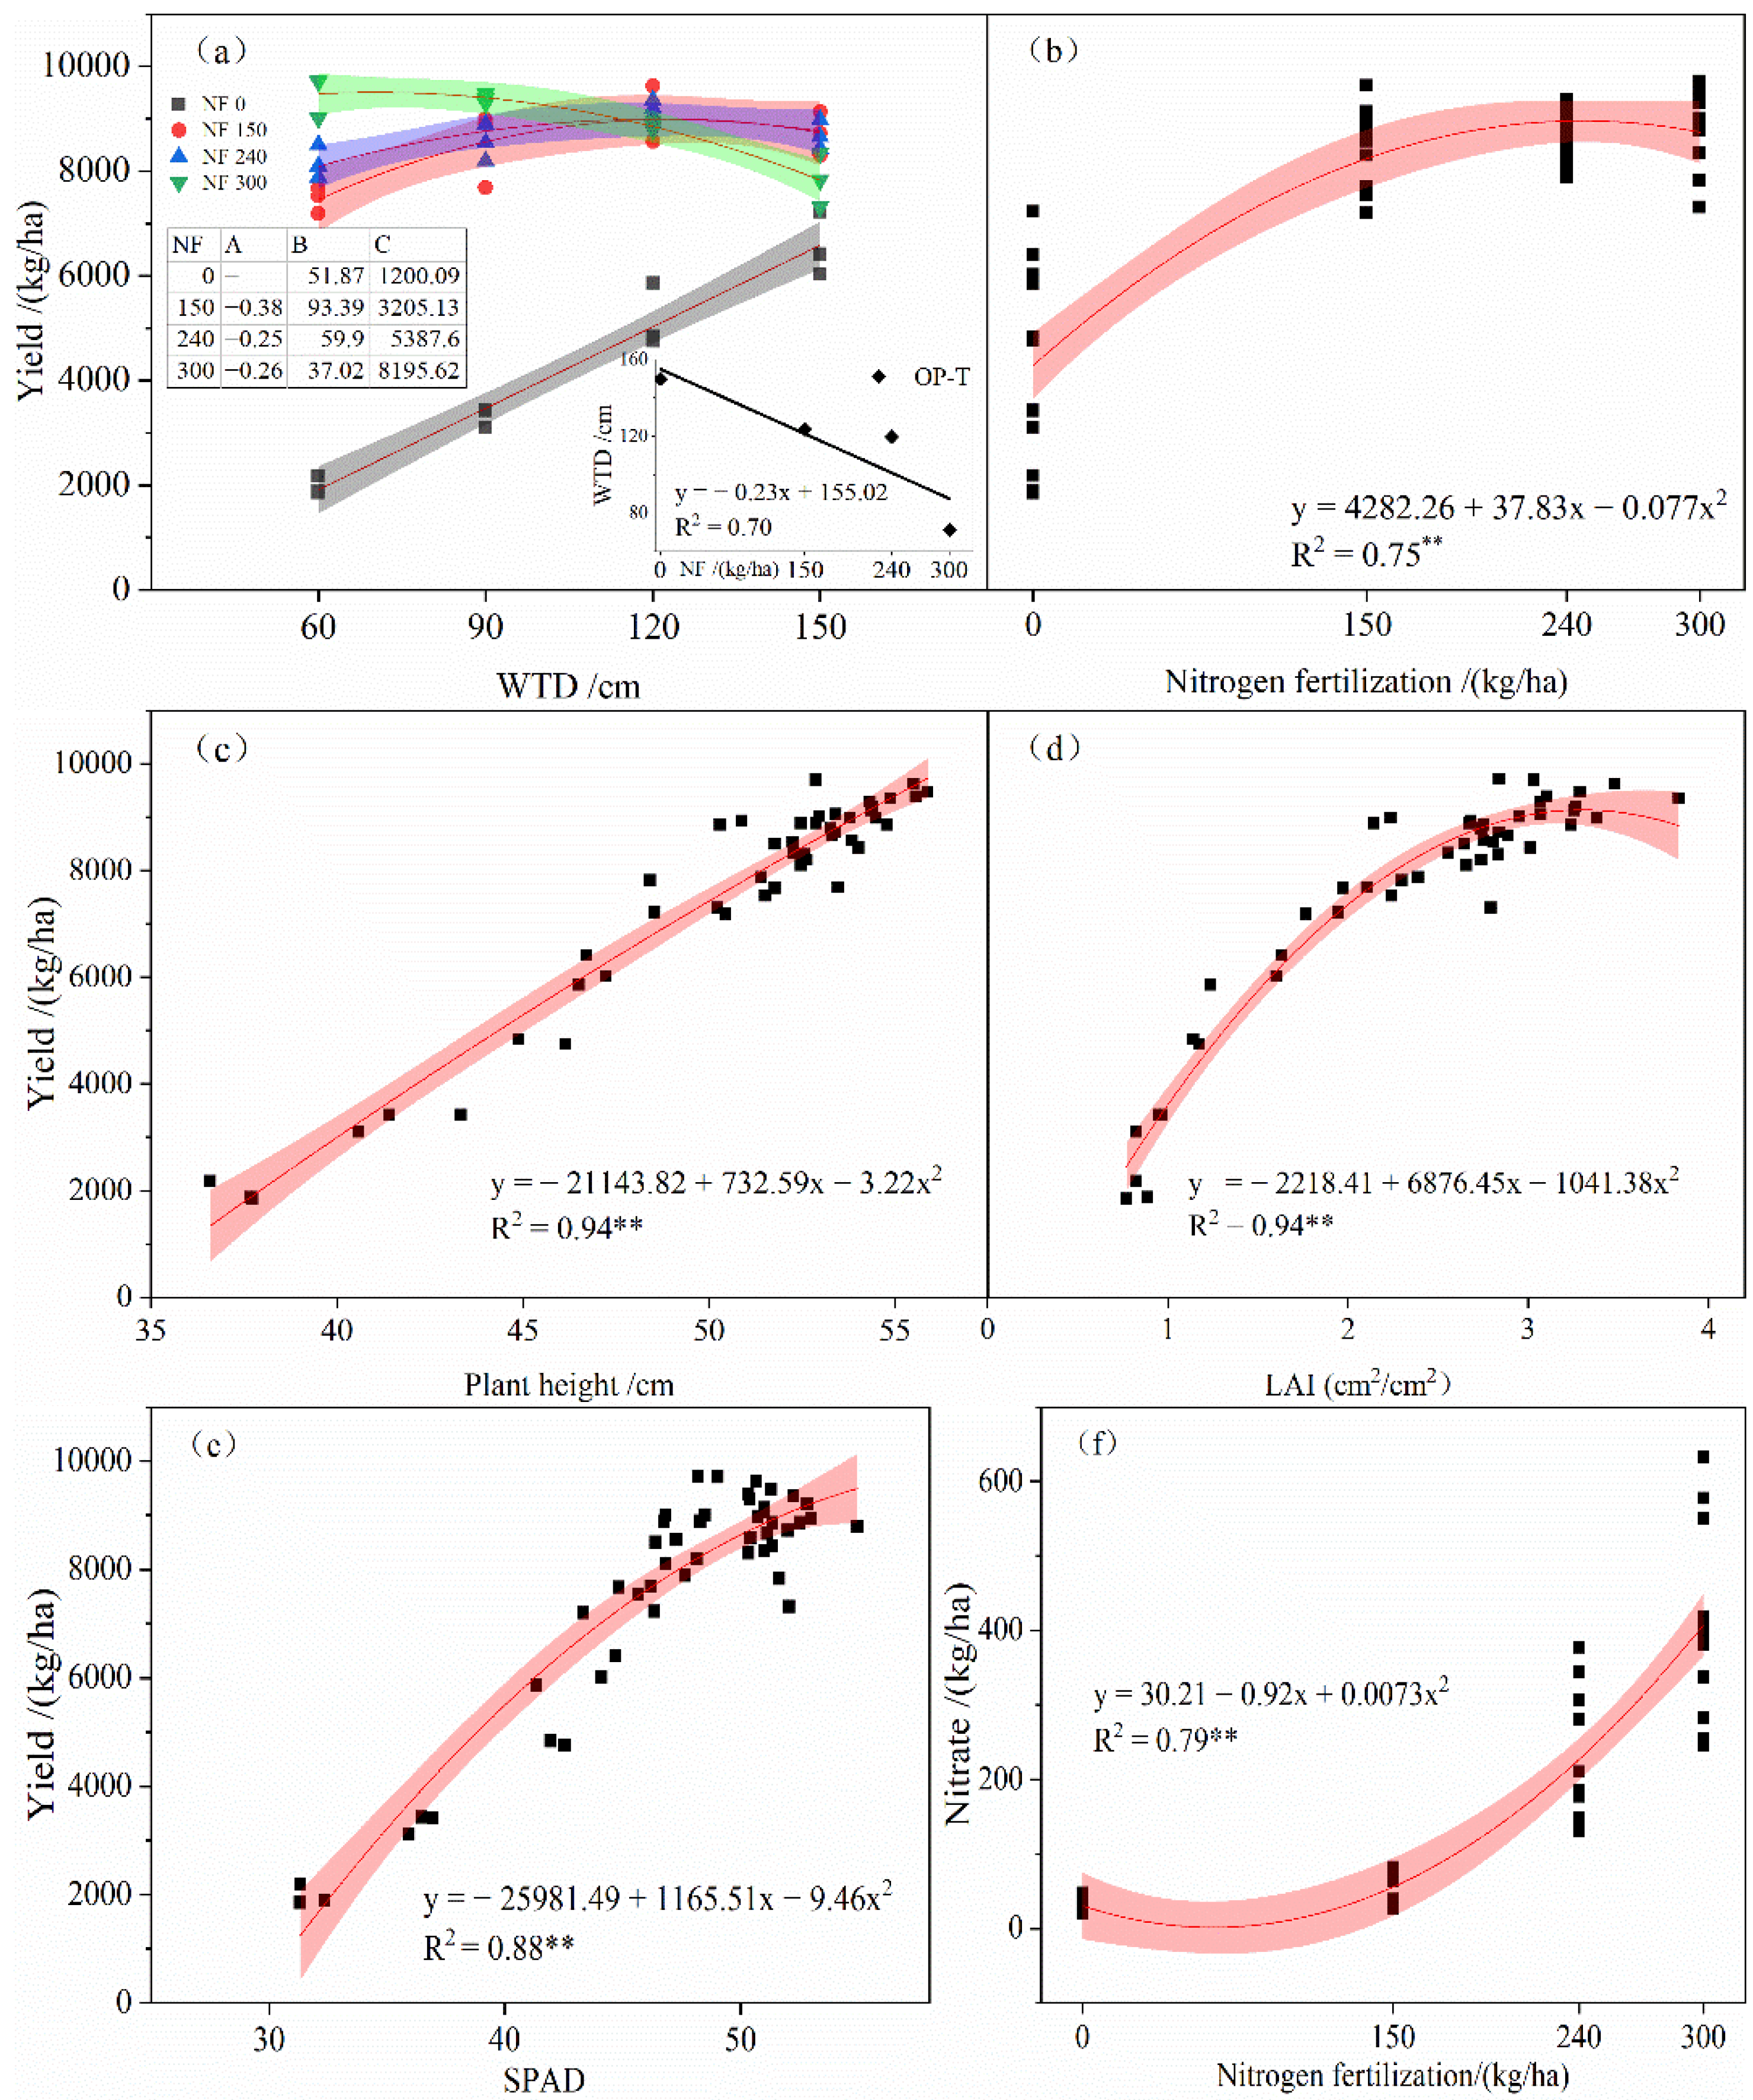
4.4. Response of Yield to Growth Attributes and Nitrate-N to N Application Rate

Plant height and LAI are important indicators to reflect crop growth and yield formation, while water and nitrogen content in soil profile are important environmental factors to reflect crop normal growth [59,71]. Previous studies have shown that crop yield was significantly correlated with plant height and LAI [72]. A greater biomass can be generated with a higher LAI [71]. Our study found that high N application rate and groundwater table treatment produce higher LAI and yield (Figure 4, Table 3). Correlation analysis also showed that yield was closely correlated with LAI, plant height, and SPAD (Figure 7c–e), indicating that appropriate N application rate and groundwater table increased yield mainly through creating better growth indexes, which is similar to that found by previous studies [21].
Ammonium nitrogen can be rapidly transformed into nitrate-N through organic nitrogen mineralization in dryland farmland, which is difficult to reflect the level of soil nitrogen supply, so nitrate-N can be used as the index of soil nitrogen supply in dryland farmland [73,74]. In our study, at zero N supply, nitrate-N content and yield in 0–60 cm at maturity increased significantly with the increase of groundwater depth (Figure 6b, Table 3), they had the significant similar change rules, indicate that higher nitrate-N at low water level (120–150 cm) would reduce the response of yield to N application, it can also be discovered from the yield increase rate in Table 3, and the same results were reported by Ruiz et al. [66]. We also found that there was no linear relationship between residual nitrate-N and N application rate at the condition of shallow groundwater depth, and the nitrate-N accumulation in soil at 60 cm changed little with the N application rate at 0–150 kg/ha, the same tendencies were reported in previous studies [75]. However, the N application rate exceeded 150 kg/ha and the nitrate-N accumulation increased sharply (Figure 7f), which indicated that N application rate could exceed a certain amount and would then cause a rapid increase in nitrate-N accumulation, similar to that seen in previous studies [39]. In conclusion, groundwater depth mainly changes the thickness of the vadose zone by changing the distribution, supply, and storage of water and environmental conditions. The amount of N application directly or indirectly affects the substrate concentration of nitrogen-related reactions under the influence of groundwater. The coupling of the two phases affects the growth and yield composition of crops, but the coupling relationship is susceptible to the external environment and agricultural measures. The mechanism and environmental trigger conditions to the coupling relationship still need to be further studied.

5. Conclusions

The growth attributes of plant height, leaf area index (LAI), soil plant analysis development (SPAD), and yield without N application increased significantly with the increase of groundwater depth. For optimal yield, the growth attribute of winter wheat was 0.6–1.2 m and had a trend of decreasing with increased N application.
Soil moisture decreased significantly with the increase of groundwater depth and N application. Adding N application rate lowered the soil moisture, and excessive N application aggravated soil drought. The nitrate-N accumulation in the crop’s main root layer in the groundwater depths of 120 and 150 cm was significantly higher than that at 60 and 90 cm; and it increased with the increase of the N application rate significantly, in which 300 kg/ha treatment (conventional N application rate) was 6.7 times that of 150 kg/ha treatment and increased by 74% more than that of the 240 kg/ha treatment at a range of 60–150 cm depths.
Winter wheat yield and its components of 150–300 kg/ha treatment were significantly better than those of 0 kg/ha treatment, but yield components of 300 kg/ha treatment were lower than those of 150–240 kg/ha treatment and the yield had no significant difference compared with 240 kg/ha. With the increase of groundwater depth and N application rate, compared with conventional N application rate, the yield of NF150–NF240 increased by 1.76–3.90% at 120 cm and 11.09–11.44% at 150 cm depth, respectively. Therefore, combining with the variation rules of optimal groundwater depth with the N application rate increase and the actual agricultural situation in NCP, 240 kg/ha N application rate increased the yield compared with the traditional N application rate, while the nitrate-N content in the main soil-root layer was relatively low. It can be concluded that a reduction of 20% N application rate on the NCP is feasible.
Based on the effects of groundwater depth and N application on crop yield and soil water and soil nitrate-N content, it was obvious that a significant coupling relationship between groundwater depth and N application rate existed. In the case of these two-phase interactions, a connection could exist between agricultural production and ecological environment protection, e.g., under the condition of shallower groundwater depth (<90 cm), increasing N application may contribute to yield increase; but it also increases the accumulation of nitrate-N in the soil of the vadose zone, and excessive nitrate-N residue was likely to leach deeply with heavy rainfall and unreasonable irrigation, which may cause pollution of the groundwater. It showed that there may exist a balance between agricultural production and ecological environmental protection, which needs to be further studied. Meanwhile, whether a different groundwater table and N application rate will affect water and N transport, soil nutrient balance, soil biochemical character, and other related mechanisms need to be further studied.

Author Contributions

Conceptualization, Y.S. and X.Q.; methodology, Y.S. and Z.D.; software, Y.S. and P.L.; validation, W.G. and H.L.; investigation, Y.S., C.M. and J.C.; resources, X.Q.; data curation, Y.S.; writing—original draft preparation, Y.S. and S.U.R.; writing—review and editing, X.Q. and Z.D.; visualization, Y.S. and Z.L.; supervision, X.Q. and Z.D.; project administration, X.Q., P.L. and W.G.; funding acquisition, X.Q. and Z.D. All authors have read and agreed to the published version of the manuscript.

Funding

We are grateful for the National Natural Science Foundation of China (No. 51679241, 51709265) and the Agricultural Science and Technology Innovation Program of the Chinese Academy of Agricultural Sciences (No. CAAS-ASTIP).

Institutional Review Board Statement

Not applicable.

Informed Consent Statement

Not applicable.

Data Availability Statement

The data presented in this study are available within the article.

Acknowledgments

We would like to thank Xinxiang Muye District Xianyure Agriculture, Forestry and Water Science and Technology Service Center and Shandong Renke Measurement and Control Technology Co., LTD for their support of our experiment.

Conflicts of Interest

The company had no role in the design of the study, in the collection, analyses, or interpretation of data, in the writing of the manuscript, or in the decision to publish the results. The authors declare no conflict of interest.

References

  1. Liu, H.; Wang, Z.; Yu, R.; Li, F.; Li, K.; Cao, H.; Yang, N.; Li, M.; Dai, J.; Zan, Y.; et al. Optimal nitrogen input for higher efficiency and lower environmental impacts of winter wheat production in China. Agric. Ecosyst. Environ. 2016, 224, 1–11. [Google Scholar] [CrossRef]
  2. Zhang, L.; Zhang, W.; Cui, Z.; Hu, Y.; Schmidhalter, U.; Chen, X. Environmental, human health, and ecosystem economic performance of long-term optimizing nitrogen management for wheat production. J. Clean. Prod. 2021, 311, 127620. [Google Scholar] [CrossRef]
  3. Zhang, F.; Cui, Z.; Fan, M.; Zhang, W.; Chen, X.; Jiang, R. Integrated Soil-Crop System Management: Reducing Environmental Risk while Increasing Crop Productivity and Improving Nutrient Use Efficiency in China. J. Environ. Qual. 2011, 40, 1051–1057. [Google Scholar] [CrossRef] [PubMed]
  4. Chen, X.; Cui, Z.; Fan, M.; Vitousek, P.; Zhao, M.; Ma, W.; Wang, Z.; Zhang, W.; Yan, X.; Yang, J.; et al. Producing more grain with lower environmental costs. Nature 2014, 514, 486–489. [Google Scholar] [CrossRef]
  5. Zhang, Y.; Wang, H.; Lei, Q.; Zhang, J.; Zhai, L.; Ren, T.; Liu, H. Recommended methods for optimal nitrogen application rate. Sci. Agric. Sin. 2018, 51, 2937–2947, (In Chinese with English abstract). [Google Scholar] [CrossRef]
  6. Guo, J.H.; Liu, X.J.; Zhang, Y.; Shen, J.L.; Han, W.X.; Zhang, W.F.; Christie, P.; Goulding, K.W.T.; Vitousek, P.M.; Zhang, F.S. Significant Acidification in Major Chinese Croplands. Science 2010, 327, 1008–1010. [Google Scholar] [CrossRef] [Green Version]
  7. Yu, C.; Huang, X.; Chen, H.; Godfray, H.C.J.; Wright, J.S.; Hall, J.W.; Gong, P.; Ni, S.; Qiao, S.; Huang, G.; et al. Managing nitrogen to restore water quality in China. Nature 2019, 567, 516–520. [Google Scholar] [CrossRef]
  8. Cui, Z.; Zhang, H.; Chen, X.; Zhang, C.; Ma, W.; Huang, C.; Zhang, W.; Mi, G.; Miao, Y.; Li, X.; et al. Pursuing sustainable productivity with millions of smallholder farmers. Nature 2018, 555, 363–366. [Google Scholar] [CrossRef]
  9. Ghobadi, M.E.; Ghobadi, M.; Zebarjadi, A. Effect of waterlogging at different growth stages on some morphological traits of wheat varieties. Int. J. Biometeorol. 2017, 61, 635–645. [Google Scholar] [CrossRef]
  10. Deng, X.; Ma, W.; Ren, Z.; Zhang, M.; Grieneisen, M.L.; Chen, X.; Fei, X.; Qin, F.; Zhan, Y.; Lv, X. Spatial and temporal trends of soil total nitrogen and C/N ratio for croplands of East China. Geoderma 2020, 361, 114035. [Google Scholar] [CrossRef]
  11. Zhang, M.; Zhou, S.; Yang, X.; Zhou, Y.; Yang, R.; Zhang, K.; He, D.; Yin, J. Effects of Nitrogen-Reducing and Suitable Soil Moisture on Nitrate Nitrogen Distribution in Soil, Nitrogen Absorption and Utilization of Winter Wheat. Sci. Agric. Sin. 2017, 50, 3885–3897, (In Chinese with English abstract). [Google Scholar] [CrossRef]
  12. Wang, Y.; Yu, Y.; Li, S.; Yu, S. Effects of soil fertility and nitrogen application rate on nitrogen absorption and translocation, grain yield, and grain protein content of wheat. Chin. J. Appl. Ecol. 2003, 14, 1868–1872, (In Chinese with English abstract). [Google Scholar] [CrossRef]
  13. Ren, F.; Sun, N.; Xu, M.; Zhang, X.; Wu, L.; Xu, M. Changes in soil microbial biomass with manure application in cropping systems: A meta-analysis. Soil Tillage Res. 2019, 194, 104291. [Google Scholar] [CrossRef] [Green Version]
  14. Qiu, S.; Gao, H.; Zhu, P.; Hou, Y.; Zhao, S.; Rong, X.; Zhang, Y.; He, P.; Christie, P.; Zhou, W. Changes in soil carbon and nitrogen pools in a Mollisol after long-term fallow or application of chemical fertilizers, straw or manures. Soil Tillage Res. 2016, 163, 255–265. [Google Scholar] [CrossRef]
  15. Wu, X.; Cai, X.; Li, Q.; Ren, B.; Bi, Y.; Zhang, J.; Wang, D. Effects of nitrogen application rate on summer maize (Zea mays L.) yield and water–nitrogen use efficiency under micro–sprinkling irrigation in the Huang–Huai–Hai Plain of China. Arch. Agron. Soil Sci. 2021, 1–15. [Google Scholar] [CrossRef]
  16. Treseder, K.K. Nitrogen additions and microbial biomass: A meta-analysis of ecosystem studies. Ecol. Lett. 2008, 11, 1111–1120. [Google Scholar] [CrossRef] [Green Version]
  17. Yang, X.; Lu, Y.; Ding, Y.; Yin, X.; Raza, S.; Tong, Y.A. Optimising nitrogen fertilisation: A key to improving nitrogen-use efficiency and minimising nitrate leaching losses in an intensive wheat/maize rotation (2008–2014). Field Crop. Res. 2017, 206, 1–10. [Google Scholar] [CrossRef]
  18. Yan, M.; Luo, T.; Bian, R.; Cheng, K.; Pan, G.; Rees, R. A comparative study on carbon footprint of rice production between household and aggregated farms from Jiangxi, China. Environ. Monit. Assess. 2015, 187, 332. [Google Scholar] [CrossRef]
  19. Li, G.; Zhao, B.; Dong, S.; Zhang, J.; Liu, P.; Lu, W. Controlled-release urea combining with optimal irrigation improved grain yield, nitrogen uptake, and growth of maize. Agric. Water Manag. 2020, 227, 105834. [Google Scholar] [CrossRef]
  20. Zhou, J.; Ma, Y.; Wu, M.; Peng, Z.; Wang, Y.; Li, H.; Wang, Y.; Sheng, L. Water and Nitrogen Utilization and Biological Effects of Winter Wheat under Different Water and Fertilizer Measures. J. Irrig. Drain. 2019, 38, 36–41, (In Chinese with English abstract). [Google Scholar] [CrossRef]
  21. Si, Z.; Zain, M.; Mehmood, F.; Wang, G.; Gao, Y.; Duan, A. Effects of nitrogen application rate and irrigation regime on growth, yield, and water-nitrogen use efficiency of drip-irrigated winter wheat in the North China Plain. Agric. Water Manag. 2020, 231, 106002. [Google Scholar] [CrossRef]
  22. Ji, Y.; Feng, W.; Hao, X.; Peng, Y.; Han, P.; Ma, Z.; Zhang, L. Effects of Different Fertilization Pattern on the Yield of the Rotation System of Wheat and Maize and Soil Nitrate Accumulation in North China Plain. Ecol. Environ. Sci. 2014, 11, 1725–1731, (In Chinese with English abstract). [Google Scholar] [CrossRef]
  23. Huang, B.; Zhang, Y.; Sun, J.; Chen, X.; Zhang, L.; Zhu, Y.; Liu, H.; Wei, F.; Song, Y.; Li, J. Effect of Nitrogen and Density Interaction on Canopy Photosynthetic Characteristics and Yield of Winter Wheat in Huaibei Lime Concretion Black Soil Region. J. Triticeae Crop. 2019, 39, 994–1002, (In Chinese with English abstract). [Google Scholar] [CrossRef]
  24. Sun, S.; Zhang, Q.; Chen, W.; Sui, W.; Jiang, X.; Meng, W. Effects of groundwater depth on growth and yield of maize under mulched drip irrigation in the middle area of Liaoning Province. J. Soil Water Conserve 2018, 32, 170–175 + 182, (In Chinese with English abstract). [Google Scholar] [CrossRef]
  25. Kang, L.; Qi, X.; Ma, Y.; Qiao, D.; Li, P.; Huang, Z.; Fan, X. Effects of reclaimed water irrigation on winter wheat growth under different groundwater tables. Trans. Chin. Soc. Agric. 2007, 23, 95–100, (In Chinese with English abstract). [Google Scholar]
  26. Zhang, H.; Li, Y.; Meng, Y.; Cao, N.; Li, D.; Zhou, Z.; Chen, B.; Dou, F. The effects of soil moisture and salinity as functions of groundwater depth on wheat growth and yield in coastal saline soils. J. Integr. Agric. 2019, 18, 2472–2482. [Google Scholar] [CrossRef]
  27. Kahlown, M.A.; Ashraf, M.; Ziaul, H. Effect of shallow groundwater table on crop water requirements and crop yields. Agric. Water Manag. 2005, 76, 24–35. [Google Scholar] [CrossRef]
  28. Liu, T.; Liu, L.; Luo, Y.; Lai, J. Simulation of groundwater evaporation and groundwater depth using SWAT in the irrigation district with shallow water table. Environ. Earth Sci. 2015, 74, 315–324. [Google Scholar] [CrossRef] [Green Version]
  29. Huo, Z.; Feng, S.; Huang, G.; Zheng, Y.; Wang, Y.; Guo, P. Effect of Groundwater Level Depth and Irrigation Amount on Water Fluxes at the Groundwater Table and Water Use of Wheat. Irrig. Drain. 2012, 61, 348–356. [Google Scholar] [CrossRef]
  30. Liu, Z.; Liu, Z.; Yu, J.; Nan, J.; Qin, A.; Xiao, J. Effects of groundwater depth on maize growth and water use efficiency. J. Drain. Irrig. Mach. Eng. 2014, 32, 617–624. [Google Scholar] [CrossRef]
  31. Cui, Z.-L.; Chen, X.-P.; Li, J.-L.; Xu, J.-F.; Shi, L.-W.; Zhang, F.-S. Effect of N fertilization on grain yield of winter wheat and apparent N losses. Pedosphere 2006, 16, 806–812. [Google Scholar] [CrossRef]
  32. Morari, F.; Lugato, E.; Polese, R.; Berti, A.; Giardini, L. Nitrate concentrations in groundwater under contrasting agricultural management practices in the low plains of Italy. Agric. Ecosyst. Environ. 2012, 147, 47–56. [Google Scholar] [CrossRef]
  33. Wang, D.; Zheng, L.; Gu, S.; Shi, Y.; Liang, L.; Meng, F.; Guo, Y.; Ju, X.; Wu, W. Soil nitrate accumulation and leaching in conventional, optimized and organic cropping systems. Plant Soil Environ. 2018, 64, 156–163. [Google Scholar] [CrossRef]
  34. Lyu, X.; Wang, T.; Song, X.; Zhao, C.; Rees, R.M.; Liu, Z.; Xiaotang, J.; Siddique, K.H.M. Reducing N2O emissions with enhanced efficiency nitrogen fertilizers (EENFs) in a high-yielding spring maize system. Environ. Pollut. 2021, 273, 116422. [Google Scholar] [CrossRef]
  35. Zhang, W.; Zhu, J.; Zhou, X.; Li, F. Effects of shallow groundwater table and fertilization level on soil physico-chemical properties, enzyme activities, and winter wheat yield. Agric. Water Manag. 2018, 208, 307–317. [Google Scholar] [CrossRef]
  36. Wang, A.; Gallardo, M.; Zhao, W.; Zhang, Z.; Miao, M. Yield, nitrogen uptake and nitrogen leaching of tunnel greenhouse grown cucumber in a shallow groundwater region. Agric. Water Manag. 2019, 217, 73–80. [Google Scholar] [CrossRef]
  37. Shen, W.; Lin, X.; Shi, W.; Min, J.; Gao, N.; Zhang, H.; Yin, R.; He, X. Higher rates of nitrogen fertilization decrease soil enzyme activities, microbial functional diversity and nitrification capacity in a Chinese polytunnel greenhouse vegetable land. Plant Soil 2010, 337, 137–150. [Google Scholar] [CrossRef]
  38. Xin, J.; Liu, Y.; Chen, F.; Duan, Y.; Wei, G.; Zheng, X.; Li, M. The missing nitrogen pieces: A critical review on the distribution, transformation, and budget of nitrogen in the vadose zone-groundwater system. Water Res. 2019, 165, 114977. [Google Scholar] [CrossRef]
  39. Zhou, J.; Gu, B.; Schlesinger, W.H.; Ju, X. Significant accumulation of nitrate in Chinese semi-humid croplands. Sci. Rep. 2016, 6, 25088. [Google Scholar] [CrossRef] [PubMed] [Green Version]
  40. Barbeta, A.; Penuelas, J. Relative contribution of groundwater to plant transpiration estimated with stable isotopes. Sci. Rep. 2017, 7, 10580. [Google Scholar] [CrossRef] [Green Version]
  41. Dadgar, M.A.; Nakhaei, M.; Porhemmat, J.; Eliasi, B.; Biswas, A. Potential groundwater recharge from deep drainage of irrigation water. Sci. Total Environ. 2020, 716, 137105. [Google Scholar] [CrossRef] [PubMed]
  42. Kadioglu, H.; Hatterman-Valenti, H.; Jia, X.; Chu, X.; Aslan, H.; Simsek, H. Groundwater Table Effects on the Yield, Growth, and Water Use of Canola (Brassica napus L.) Plant. Water 2019, 11, 1730. [Google Scholar] [CrossRef] [Green Version]
  43. Kong, F.; Qu, Z.; Liu, Y.; Ma, Y. Experimental Research on the Effect of Different Kinds of Groundwater Buried Depth on Soil Water, Salinity and Crop Growth. China Rural Water Hydropower 2009, 5, 44–48, (In Chinese with English abstract). [Google Scholar]
  44. Li, Z.; Zhang, Q.; Qiao, Y.; Leng, P.; Zhang, Q.; Du, K.; Tian, C.; Li, X.; Chen, G.; Li, F. Influence of the shallow groundwater table on the groundwater N2O and direct N2O emissions in summer maize field in the North China Plain. Sci. Total Environ. 2021, 799, 149495. [Google Scholar] [CrossRef]
  45. Ma, S.; Wang, Y.; Huang, Z.; Han, X.; Zhang, W.; Fan, Y.; Ma, Y. Research Progress of Effects of Waterlogging on Wheat Growth and Cultivation Technique for Waterlogging Resistance. J. Triticeae Crop. 2019, 39, 835–843, (In Chinese with English abstract). [Google Scholar] [CrossRef]
  46. Marti, J.; Savin, R.; Slafer, G.A. Wheat Yield as Affected by Length of Exposure to Waterlogging During Stem Elongation. J. Agron. Crop Sci. 2015, 201, 473–486. [Google Scholar] [CrossRef]
  47. Liu, Z.; Xiao, J.; Yu, J.; Nan, J.; Liu, Z. Effects of Different Groundwater Depths on Root and Shoot growth and Water Consumption of Summer Maize. J. Irrig. Drain. 2011, 30, 44–47, (In Chinese with English abstract). [Google Scholar] [CrossRef]
  48. Xia, J.; Zhang, S.; Zhao, X.; Liu, J.; Chen, Y. Effects of different groundwater depths on the distribution characteristics of soil-Tamarix water contents and salinity under saline mineralization conditions. Catena 2016, 142, 166–176. [Google Scholar] [CrossRef]
  49. Herzog, M.; Striker, G.G.; Colmer, T.D.; Pedersen, O. Mechanisms of waterlogging tolerance in wheat—A review of root and shoot physiology. Plant Cell Environ. 2016, 39, 1068–1086. [Google Scholar] [CrossRef]
  50. Tiryakioğlu, M.; Karanlik, S.; Arslan, M. Response of bread-wheat seedlings to waterlogging stress. Turk. J. Agric. For. 2015, 39, 807–816. [Google Scholar] [CrossRef]
  51. Wu, J.-D.; Li, J.-C.; Wei, F.-Z.; Wang, C.-Y.; Zhang, Y.; Sun, G. Effects of nitrogen spraying on the post-anthesis stage of winter wheat under waterlogging stress. Acta Physiol. Plant. 2013, 36, 207–216. [Google Scholar] [CrossRef]
  52. Yue, X.; Hu, Y.; Zhang, H.; Schmidhalter, U. Optimizing the Nitrogen Management Strategy for Winter Wheat in the North China Plain Using Rapid Soil and Plant Nitrogen Measurements. Commun. Soil Sci. Plant Anal. 2019, 50, 1310–1320. [Google Scholar] [CrossRef]
  53. Gao, X.; Huo, Z.; Qu, Z.; Xu, X.; Huang, G.; Steenhuis, T.S. Modeling contribution of shallow groundwater to evapotranspiration and yield of maize in an arid area. Sci. Rep. 2017, 7, 43122. [Google Scholar] [CrossRef] [Green Version]
  54. Mueller, L.; Behrendt, A.; Schalitz, G.; Schindler, U. Above ground biomass and water use efficiency of crops at shallow water tables in a temperate climate. Agric. Water Manag. 2005, 75, 117–136. [Google Scholar] [CrossRef]
  55. Ba, B.; Zheng, D.; Jia, Y.; Wu, C.; Ren, G. Influence of Water Table on the Soil Water Variation and Crop Yield of WinterWheat Field. Water Sav. Irrig. 2004, 5, 5–9, (In Chinese with English abstract). [Google Scholar]
  56. Yang, H.; Cao, W.; Zhi, C.; Li, Z.; Bao, X.; Ren, Y.; Liu, F.; Fan, C.; Wang, S.; Yabin, W. Evolution of groundwater level in the North China Plain in the past 40 years and suggestions on its overexploitation treatment. Geol. China 2021, 48, 1142–1155, (In Chinese with English abstract). [Google Scholar] [CrossRef]
  57. Liang, H.; Shen, P.; Kong, X.; Liao, Y.; Liu, Y.; Wen, X. Optimal Nitrogen Practice in Winter Wheat-Summer Maize Rotation Affecting the Fates of 15N-Labeled Fertilizer. Agronomy 2020, 10, 521. [Google Scholar] [CrossRef] [Green Version]
  58. Meng, Q.; Yue, S.; Hou, P.; Cui, Z.; Chen, X. Improving Yield and Nitrogen Use Efficiency Simultaneously for Maize and Wheat in China: A Review. Pedosphere 2016, 26, 137–147. [Google Scholar] [CrossRef]
  59. Cui, Z.; Chen, X.; Zhang, F. Development of Regional Nitrogen Rate Guidelines for Intensive Cropping Systems in China. Agron. J. 2013, 105, 1411–1416. [Google Scholar] [CrossRef]
  60. Kroes, J.; Supit, I.; van Dam, J.; van Walsum, P.; Mulder, M. Impact of capillary rise and recirculation on simulated crop yields. Hydrol. Earth Syst. Sci. 2018, 22, 2937–2952. [Google Scholar] [CrossRef] [Green Version]
  61. Moitzi, G.; Neugschwandtner, R.W.; Kaul, H.-P.; Wagentristl, H. Efficiency of Mineral Nitrogen Fertilization in Winter Wheat under Pannonian Climate Conditions. Agriculture 2020, 10, 541. [Google Scholar] [CrossRef]
  62. Chen, C.; Xu, Z.; Hughes, J. Effects of nitrogen fertilization on soil nitrogen pools and microbial properties in a hoop pine (Araucaria cunninghamii) plantation in southeast Queensland, Australia. Biol. Fertil. Soils 2002, 36, 276–283. [Google Scholar] [CrossRef]
  63. Xiao, J.; Nan, J.; Liu, Z.; Yu, J. Study on yield and yield components of summer maize under different groundwater levels. Agric. Res. Arid. Areas 2010, 28, 36–39, (In Chinese with English abstract). [Google Scholar]
  64. Liu, X.; Zuo, R.; Meng, L.; Li, P.; Li, Z.; He, Z.; Li, J.; Wang, J. Study on the variation of nitrate pollution during the rise of groundwater level. China Environ. Sci. 2021, 41, 232–238, (In Chinese with English abstract). [Google Scholar] [CrossRef]
  65. Ascott, M.J.; Gooddy, D.C.; Wang, L.; Stuart, M.E.; Lewis, M.A.; Ward, R.S.; Binley, A.M. Global patterns of nitrate storage in the vadose zone. Nat. Commun. 2017, 8, 1416. [Google Scholar] [CrossRef]
  66. Ruiz, A.; Salvagiotti, F.; Gambin, B.L.; Borrás, L. Maize nitrogen management in soils with influencing water tables within optimum depth. Crop Sci. 2021, 61, 1386–1399. [Google Scholar] [CrossRef]
  67. Robertson, G.P.; Vitousek, P.M. Nitrogen in Agriculture: Balancing the Cost of an Essential Resource. Annu. Rev. Environ. Resour. 2009, 34, 97–125. [Google Scholar] [CrossRef] [Green Version]
  68. Wang, X.; Wang, Z.; Li, H.; Wang, R.; Tan, J.; Li, S. Dynamics and Availability to Crops of Residual Fertilizer Nitrogen in Upland Soil. Acta Pedol. Sin. 2016, 53, 1202–1212, (In Chinese with English abstract). [Google Scholar] [CrossRef]
  69. Zhang, L.; He, X.; Liang, Z.; Zhang, W.; Zou, C.; Chen, X. Tiller development affected by nitrogen fertilization in a high-yielding wheat production system. Crop Sci. 2020, 60, 1034–1047. [Google Scholar] [CrossRef]
  70. Zhou, W.; Ma, Y.; Well, R.; Wang, H.; Yan, X. Denitrification in Shallow Groundwater Below Different Arable Land Systems in a High Nitrogen-Loading Region. J. Geophys. Res. Biogeosci. 2018, 123, 991–1004. [Google Scholar] [CrossRef]
  71. Man, J.; Yu, Z.; Shi, Y. Radiation Interception, Chlorophyll Fluorescence and Senescence of Flag leaves in Winter Wheat under Supplemental Irrigation. Sci. Rep. 2017, 7, 7767. [Google Scholar] [CrossRef] [PubMed] [Green Version]
  72. Xu, X.; Zhang, M.; Li, J.; Liu, Z.; Zhao, Z.; Zhang, Y.; Zhou, S.; Wang, Z. Improving water use efficiency and grain yield of winter wheat by optimizing irrigations in the North China Plain. Field Crop. Res. 2018, 221, 219–227. [Google Scholar] [CrossRef]
  73. Chen, X.; Zhang, F.; Römheld, V.; Horlacher, D.; Schulz, R.; Böning-Zilkens, M.; Wang, P.; Claupein, W. Synchronizing N Supply from Soil and Fertilizer and N Demand of Winter Wheat by an Improved Nmin Method. Nutr. Cycl. Agroecosyst. 2006, 74, 91–98. [Google Scholar] [CrossRef]
  74. Mengel, K.; Hütsch, B.; Kane, Y. Nitrogen fertilizer application rates on cereal crops according to available mineral and organic soil nitrogen. Eur. J. Agron. 2006, 24, 343–348. [Google Scholar] [CrossRef]
  75. Chaney, K. Effect of nitrogen fertilizer rate on soil nitrate nitrogen content after harvesting winter wheat. J. Agric. Sci. 1990, 114, 171–176. [Google Scholar] [CrossRef]
Figure 1. Maximum and minimum air temperatures during the test.
Agriculture 12 00311 g001
Figure 2. (a) It is a schematic diagram of an experimental set-up, wherein: 1. Outfall; 2. Lysimeter; 3. TDR (Time Domain Reflectometry) probe; 4. Soil-solution extractor; 5. Inlet water pipe; 6. Water-table position and balancer; 7. Percolation bucket; and 8. Mariotte bottle. (b) It shows the experimental winter wheat, which was in the anthesis stage.
Agriculture 12 00311 g002
Figure 3. Winter wheat plant height under different groundwater depths for four fertilization levels at different growth stages; Re: the crop growth period of Regreening; Jo: the crop growth period of Jointing; Bo: the crop growth period of Booting; An: the crop growth period of Anthesis; Fi: the crop growth period of Filling; M-Fi: the crop growth period of Filling; Mat: the crop growth period of maturity; (a) NF0: nitrogen fertilization rate of 0 kg/ha; WTD: Groundwater Table Depth; (b) NF150: nitrogen fertilization rate of 150 kg/ha; (c) NF240: nitrogen fertilization rate of 240 kg/ha; (d) NF300: nitrogen fertilization rate of 300 kg/ha; G1: groundwater table of 60 cm; G2: groundwater table of 90 cm; G3: groundwater table of 120 cm; G4: groundwater table of 150 cm; Error bar: mean value ± SE. Different letters denote significant differences (p < 0.05) between treatments by Duncan.
Agriculture 12 00311 g003
Figure 4. Leaf area index (LAI) under different groundwater depth for four fertilization levels at different growth stages; WTD: Groundwater Table Depth; Jo: the crop growth period of Jointing; An: the crop growth period of Anthesis; Fi: the crop growth period of Filling; M-Fi: the crop growth period of Filling; (a) NF0: nitrogen fertilization rate of 0 kg/ha; (b) NF150: nitrogen fertilization rate of 150 kg/ha; (c) NF240: nitrogen fertilization rate of 240 kg/ha; (d) NF300: nitrogen fertilization rate of 300 kg/ha; G1: groundwater table of 60 cm; G2: groundwater table of 90 cm; G3: groundwater table of 120 cm; G4: groundwater table of 150 cm; Error bar: mean value ± SE. Different letters denote significant differences (p < 0.05) between treatments by Duncan.
Agriculture 12 00311 g004
Figure 5. Winter wheat Soil Plant Analysis Development (SPAD) before and after topdressing under N application rate and groundwater depth; WTD: Groundwater Table Depth; (a) represents the SPAD value of pre-topdressing, which means four days prior to the date of topdressing; (A)–(C) represents the difference of winter wheat SPAD between different groundwater table depths under no N application. (b) represents the SPAD value of post-topdressing, meaning eight days after the date of topdressing; (A)–(D) represents the difference of winter wheat SPAD between different groundwater table depths under no N application. NF0: nitrogen fertilization rate of 0 kg/ha; NF150: nitrogen fertilization rate of 150 kg/ha; NF240: nitrogen fertilization rate of 240 kg/ha; NF300: nitrogen fertilization rate of 300 kg/ha; Error bar: mean value ± SE. Different lowercase letters denote significant differences (p < 0.05) between different nitrogen application rates by Duncan.
Agriculture 12 00311 g005
Figure 6. (a) Water and (b) nitrate-N storage in 0–60 cm soil layer of winter wheat maturity under different groundwater depths with N application rate; NF0: nitrogen fertilization rate of 0 kg/ha; NF150: nitrogen fertilization rate of 150 kg/ha; NF240: nitrogen fertilization rate of 240 kg/ha; NF300: nitrogen fertilization rate of 300 kg/ha; G1: groundwater table of 60 cm; G2: groundwater table of 90 cm; G3: groundwater table of 120 cm; G4: groundwater table of 150 cm; Error bar: mean value ± SE. Different letters denote significant differences (p < 0.05) between treatments by Duncan.
Agriculture 12 00311 g006
Figure 7. Response of winter wheat yield to N application rate, growth attributes, and the relationship of nitrate-N and N application rate; WTD: groundwater table depth; OP-T: Optimal Groundwater Level generally; SPAD: Soil Pl ant Analysis Development; LAI: leaf area index; (a): the relationship between yield and WTD, A, B, and C represent the quadratic term, the coefficient, and intercept of the fitting equation, respectively. WTD and OP-T mean groundwater table depth and optimal groundwater table depth, respectively. NF 0: R2 = 0.95 **; NF 150: R2 = 0.58 **; NF 240: R2 = 0.50 *; NF 300: R2 = 0.82 **. p < 0.01 (**); (b): the relationship between yield and NF, NF: nitrogen fertilization rate; (c): the relationship between yield and plant height; (d): the relationship between yield and LAI; (e): the relationship between yield and SPAD; (f): the relationship between nitrate-N and N application rate.
Agriculture 12 00311 g007
Table 1. Physical properties of the experimental soil.
Soil Layer
(cm)
pHEC
(μs/cm)
OM
(g·kg−1)
AN
(mg·kg−1)
AK
(mg·kg−1)
TN
(g·kg−1)
TP
(g·kg–1)
Mechanical
Composition
Clay (%)Silt (%)Sand (%)
0–209.34270.0012.2917.27128.330.850.6318.2647.4334.31
20–409.62313.339.8713.3081.331.250.5918.0945.9335.97
40–609.58364.008.787.9381.671.520.5317.8444.0438.78
>609.39421.678.776.1876.331.470.4815.8843.8740.00
Note: pH: pH of soil; EC: electrical conductivity of soil; OM: organic matter of soil; AN: alkaline nitrogen of soil; AK: available potassium; TN: total nitrogen of soil; TP: total phosphorus of soil.
Table 2. Winter wheat irrigation amounts and date.
Irrigating Date
(yy/mm/dd)
Irrigating Amount
(m3/ha)
Irrigating Date
(yy/mm/dd)
Irrigating Amount
(m3/ha)
2021/1/13176.442021/4/21176.44
2021/3/17308.772021/5/288.22
2021/3/31176.442021/5/8176.44
2021/4/11176.44
Table 3. Winter wheat yield and its components (Mean ± SE, n = 3).
NF-LWTD
(cm)
Ear Length
(cm)
GN per Ear
(No ear−1)
NS per Spi
(No spike−1)
NIS per Spi
(No spike−1)
SD
(cm)
1000-Grain Weight (g)Spi per Area
(No m−2)
Grain Yield)
(kg·ha−1)
Ra of G (%)
NF 0G15.50 ± 0.03 d14.77 ± 0.78 d11.33 ± 0.71 c8.43 ± 0.15 a3.16 ± 0.04 c39.98 ± 0.89 b382.28 ± 48.59 a1971.41 ± 106.82 d-
G26.07 ± 0.15 c23.00 ± 0.95 c14.60 ± 0.17 b5.93 ± 0.41 b3.73 ± 0.10 b40.44 ± 0.20 b379.34 ± 26.47 a3316.00 ± 105.22 c-
G36.71 ± 0.17 b32.57 ± 0.87 b17.63 ± 0.22 a3.40 ± 0.06 c3.94 ± 0.08 ab43.42 ± 0.21 a344.05 ± 8.83 a5149.04 ± 353.99 b-
G47.16 ± 0.10 a37.60 ± 1.89 a18.17 ± 0.44 a3.30 ± 0.29 c4.10 ± 0.09 a43.84 ± 0.24 a420.51 ± 22.20 a6547.04 ± 352.21 a-
Ave.6.36 C26.98 C15.43 C5.27 A3.73 C41.92 B381.55 B4245.87 C-
NF150G17.33 ± 0.13 b43.28 ± 0.81 ab19.63 ± 0.45 a2.47 ± 0.29 a4.32 ± 0.14 a39.70 ± 0.58 c438.16 ± 12.82 c7461.66 ± 142.67 b278.49
G27.60 ± 0.10 b46.31 ± 0.56 a20.40 ± 0.12 a2.17 ± 0.22 a4.42 ± 0.03 a40.99 ± 0.21 c467.56 ± 5.09 b8519.82 ± 420.44 a156.93
G37.59 ± 0.07 b39.43 ± 1.91 c18.78 ± 0.39 a3.33 ± 0.44 a4.21 ± 0.07 a43.41 ± 0.69 b541.08 ± 18.36 a9013.39 ± 315.94 a75.05
G48.01 ± 0.13 a40.73 ± 0.32 bc19.23 ± 0.35 a3.37 ± 0.33 a4.32 ± 0.03 a45.98 ± 0.21 a526.37 ± 7.78 a8713.42 ± 239.35 a30.09
Ave.7.63 A42.44 A19.51 A2.83 BC4.32 A42.52 AB493.29 A8400.44 B135.60
NF240G17.45 ± 0.12 a45.77 ± 2.09 a19.73 ± 0.15 a2.00 ± 0.12 b4.40 ± 0.13 a39.38 ± 0.63 b479.32 ± 7.78 b8156.61 ± 182.47 b314.07
G27.43 ± 0.29 a45.35 ± 0.61 a19.85 ± 0.66 a1.90 ± 0.17 b4.22 ± 0.19 a39.69 ± 0.57 b476.38 ± 5.09 b8538.36 ± 199.17 b154.89
G37.63 ± 0.07 a39.47 ± 0.82 b18.63 ± 0.26 a3.43 ± 0.44 a4.18 ± 0.03 a43.77 ± 1.64 a544.02 ± 24.07 a9202.64 ± 84.83 a78.73
G47.63 ± 0.12 a38.97 ± 2.41 b18.73 ± 0.62 a3.27 ± 0.42 a4.22 ± 0.05 a43.70 ± 0.43 a505.79 ± 11.76 ab8686.33 ± 158.46 ab32.68
Ave.7.54 AB42.39 A19.24 AB2.65 C4.25 AB41.63 B501.38 A8645.98 AB145.10
NF300G17.47 ± 0.13 a45.37 ± 1.85 a20.03 ± 0.20 a2.10 ± 0.10 b4.25 ± 0.11 a39.48 ± 0.27 c499.91 ± 5.88 a9472.77 ± 233.39 a380.46
G27.62 ± 0.07 a44.33 ± 2.07 a19.77 ± 0.48 a2.53 ± 0.48 b4.30 ± 0.06 a39.54 ± 1.12 c526.37 ± 20.58 a9382.65 ± 52.21 a182.95
G37.30 ± 0.15 a34.83 ± 1.67 b17.60 ± 0.21 b4.13 ± 0.43 a3.99 ± 0.10 a48.20 ± 0.60 a505.79 ± 19.28 a8857.31 ± 42.90 a72.03
G47.12 ± 0.09 a34.48 ± 1.54 b17.40 ± 0.45 b4.31 ± 0.21 a3.95 ± 0.10 a45.05 ± 0.76 b488.15 ± 26.14 a7818.95 ± 296.87 b19.43
Ave.7.38 B39.75 B18.7 B3.27 B4.12 B43.07 A505.05 A8882.92 A163.72
NF-L: nitrogen fertilization level; GN per ear: grain number per ear; NS per Spi: number of spikes per spike; NIS per Spi: number of infertile spikes per spike; SD: stem diameter; Spi per area: spikes per area; Ra of G: rate of growth. NF0: nitrogen fertilization rate of 0 kg/ha; NF150: nitrogen fertilization rate of 150 kg/ha; NF240: nitrogen fertilization rate of 240 kg/ha; NF300: nitrogen fertilization rate of 300 kg/ha; G1: groundwater table of 60 cm; G2: groundwater table of 90 cm; G3: groundwater table of 120 cm; G4: groundwater table of 150 cm. Different lowercase letters denote significant differences (p < 0.05) between different groundwater table depths by Duncan. Different uppercase letters denote significant differences (p < 0.05) between different nitrogen application rates by Duncan. 3.6. Relationship between yield and growth attributes and it between nitrate-N and N application rate.
Publisher’s Note: MDPI stays neutral with regard to jurisdictional claims in published maps and institutional affiliations.

