Article

Barriers to the Development of Agricultural Mechanization in the North and Northeast China Plains: A Farmer Survey

National Academy of Agriculture Green Development, College of Resources and Environmental Sciences, China Agricultural University (CAU), Beijing 100193, China
*
Author to whom correspondence should be addressed.
Agriculture 2022, 12(2), 287; https://doi.org/10.3390/agriculture12020287
Submission received: 5 January 2022 / Revised: 12 February 2022 / Accepted: 14 February 2022 / Published: 17 February 2022

Abstract

:
Agricultural mechanization is essential to increase farmers’ income in modern agriculture. However, the use of machinery for crop production in China is quite inefficient. To understand the obstacles limiting farmers’ use of machinery, we conducted face-to-face interview surveys with 1023 farmers (including cooperative directors, machine operators, and farmers without machines) in two major cereal-producing regions with large differences in farming scale: the North China Plain (2.7 ha per capita) and the Northeast China Plain (12.8 ha per capita). The results revealed that farmers in both regions had strong will to use machines. The obstacle preventing farmers from buying machines was the lack of machinery training in the Northeast China Plain and land fragmentation in the North China Plain. Among different farmer groups, land fragmentation was the main barrier for cooperative directors. Farmers without machines thought that there was lack of machinery training and that the cost of machinery purchase was high. Machine operators believed that machine maintenance was too expensive. The income and age also had an effect on the different groups of farmer. It is concluded that, to improve mechanization efficiency and stimulate farmers’ intention to use machinery, the government should make policies to encourage the merge of fragmented farmlands, provide targeted subsidies for agricultural machinery, and organize machinery training in an efficient way.

Graphical Abstract

1. Introduction

Of the 570 million farms worldwide, most are small scale (less than 2 ha), with family farms accounting for approximately 75% of global agricultural land management [1]. Agricultural machinery plays an important role in small-scale agriculture [2]. In China, substantial progress has been made in agricultural mechanization. In 2020, the national crop planting and harvesting mechanization rate reached 71%. The comprehensive mechanization rate of planting and harvesting exceeds 95%, 85%, and 90% for wheat, rice, and maize, respectively [3]. To accelerate agricultural mechanization, the Chinese government issued a series of policies to encourage farmers to use machinery, including financial subsidies for machine purchases, subsidies for machine operations, and support for cooperatives to provide machinery for individual farmers [4]. However, agricultural labor productivity in China (the ratio of agricultural output value to the agricultural employment labor force in a year) remains low, being only 4.1% of that in the United States (in 2018 constant dollars) [5]. Machinery utilization in China is reported to be inefficient and unproductive for agricultural production, which accounted for 22.4% of employment and only 7.2% of output in the primary sector in 2018 [6]. The low efficiency of mechanized production hinders farmers’ intention to purchase new machines and renew old equipment [7]. To improve mechanization efficiency and stimulate farmers’ intention to use machinery, it is essential to understand the obstacles limiting farmers’ use of machinery and recommend corresponding policies for the government.
The efficiency of agricultural mechanization can be limited by various aspects. In China, agricultural machinery usually has high prices, and good brands are less subsidized, which is economically unrealistic for small-scale farmers [8]. Wang et al. reported that machinery cost increased as the number of fields of a farmer increased [9]. The fragmentation of fields substantially reduces the efficiency of irrigation [10,11]. Agricultural technology training can also be a limiting factor [12]. The mean logarithm of the average income of households participating in agricultural technology training was only 0.151 times higher than that of untrained households. Farmers’ access to training can be limited by their personal attributes, such as education level, age, and income level, as well as external factors, such as training methods, content, methodology, and teachers [13]. Internationally, larger sized family farms (among farms below 20 ha) have been reported to be related to stronger economic sustainability [14]. Fleisher argued that merging four field plots into one plot can increase labor productivity by 8% [15]. In Japan, the efficiency and profitability of mechanized agricultural production has been effectively improved by expanding the scale of agriculture [16]. In addition, the Japanese government has provided farmers with effective training in the use of agricultural machinery, and unit production costs in Japanese rice fields at the 150-hectare scale were reported to be reduced to 88% of the costs at the 50-hectare scale [17]. In the case of Vietnam, millions of families own small plots of land averaging 1 ha that are divided into incontiguous parcels [18]. Nguyen and Warr [19] found that reduction of land fragmentation through land consolidation (exchanging ownership of spatially dispersed farm plots to establish new land with fewer plots) promoted mechanization of crop sowing, harvesting, etc. and increased agricultural productivity. The age and education of farmers also play an important role in the development of agricultural mechanization. Tamirat et al. [20] and Novelli [21] reported that older farm managers were less knowledgeable about modern production methods and technologies. As the scale of operations increases and large, convenient, and efficient machinery becomes more popular, older farmers should carefully consider their options when purchasing expensive machinery [22].
Smallholder farmers with less risk-taking capacity are more susceptible to social, economic, and cultural influences in using machinery. Therefore, the support from government is important. In European countries and USA, to encourage farmers to use machinery, government agencies (public sector), agricultural machinery manufacturers (private sector), and farmer organizations (third sector) work together to improve coordination of smallholders [23]. In China, the government has carried out many farm machinery technical demonstrations. Farmers have taken advantage of the demonstration areas to learn more about machinery, but the impact is often singular and short-lived and are lacking in long-term guidance and systematic training [24].
Overall, farmers’ use of machines faces barriers from social, economic, and cultural sources, but these barriers have not been well quantified in China. In the current study, we selected two typical cereal production regions of China, namely the North China Plain (NCP) and the Northeast China Plain (NEP), to explore the barriers limiting farmers’ use of agricultural machinery by interviewing 1023 farmers, which we divided into three types: cooperative directors, machine operators, and farmers without machines. The findings suggest the need for policy approaches to remove barriers and speed up agricultural mechanization in China.

2. Materials and Methods

2.1. Regions and Farmers

The surveys were conducted in October–November 2019 and August–September 2020 in NCP (Hebei, Shandong and Henan Provinces) and NEP (Heilongjiang, Jilin and Liaoning Provinces). These regions are major cereal producing areas in China, with urbanization rates ranging from 53% to 68%. These regions account for 31% of the national total gross agricultural product (GAP) and 40% of the total agricultural machinery power [6]. We divided farmers into three types: cooperative directors who own machines, machine operators who receive salaries for operating the machines for cooperatives, and farmers without machines who purchase machine services from cooperatives.
We conducted discussions with local university faculty staff and government officials to select a total of 18 counties that were representative of the local food crop production. A total of 5–6 villages were randomly selected in each county, each with 1–3 cooperatives and 5–10 farmers. These cooperatives and farmers are mostly traditional or medium-sized and represent the majority of cooperatives and farmers nationwide in terms of planting management. A total of 1060 farmers were interviewed. However, 15 farmers did not complete the questionnaire in its entirety, 10 farmers did not provide personal characteristics, and 12 farmers consistently selected a score of 3 (neutral) in response to all questions. These questionnaires were excluded. Ultimately, a total of 1023 questionnaires were collected and analyzed, consisting of 308 cooperative directors, 577 farmers without machines, and 138 machine operators. Table 1 provides basic information about the surveyed farmers. A total of 569 farmers were interviewed in NCP, consisting of 157 cooperative directors, 378 farmers without machines, and 34 machine operators. A total of 454 farmers were interviewed in NEP, consisting of 151 cooperative directors, 199 farmers without machines, and 104 machine operators. As can be seen in Table 1, the average planting area of surveyed farmers in NEP was much higher than in NCP. Specifically, the average planting area of NEP farmers without machines was 7.7 times higher than that of NCP farmers. The differences in other characteristics were not significant.

2.2. Questionnaire Design and Statistical Analysis

The questionnaire for the farmer survey was designed on the basis of the theory of planned behavior (TPB). According to the TPB, the behavior of individuals is generally determined by (1) their attitudes toward the desired outcome, (2) their perceived subjective norms from social referents, and (3) their perception of ease or difficulty influenced by controlling factors (behavioral control) [25,26,27].
The questionnaire consists of five main sections:
  • Farm structure and farmer characteristics.
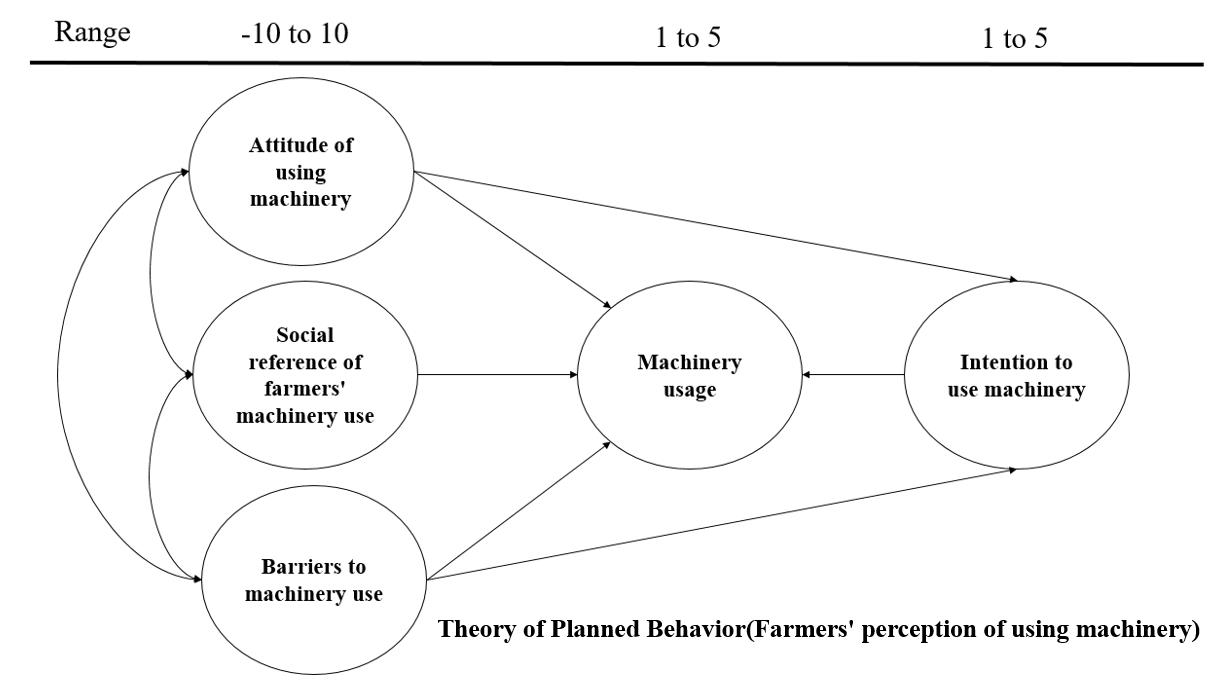
  • Farmers’ intention to use machinery in the next 3 years.
  • Farmers’ perceptions of the outcomes of using agricultural machinery, namely (i) how likely the outcome is (defined as strength of belief) and (ii) what is the extent of the negative or positive outcome to the farmer (defined as outcome evaluation).
  • Farmers’ perceptions of social referents, namely (i) supporting or hindering application of the machine (defined as normative beliefs) and (ii) the extent to which farmers are willing to comply with social referents’ views (motivation to comply).
  • Farmers’ perceptions of controlling factors, namely (i) the extent to which the factors hinder the use of agricultural machinery (defined as control power) and (ii) the extent to which these factors are effective for the farmer (defined as control strength).
Farmers’ attitudes and the strength of their beliefs regarding outcomes, their perceptions of referents and motivation to comply, and their perceptions of control factors and strength of control were rated on a Likert scale of 1–5, with 1 = not likely or very bad and 5 = very likely or very good. For example, one possible outcome of using machinery is higher income. In the survey, we first asked farmers about the extent to which they thought the use of machinery would increase their income (1 = very unlikely, 2 = unlikely, 3 = neutral, 4 = likely, and 5 = very likely) and then asked how they rated the effectiveness of machinery in increasing their income (1 = very bad, 2 = bad, 3 = neutral, 4 = good, and 5 = very good). In addition, we scored farmers’ intention to use machinery on a Likert scale of 1–5.
Questions related to farmers’ intention were defined differently for cooperative directors, farmers without machines, and machine operators. For cooperative directors and machine operators, the questions concerned whether they “will continue to use the machines in the next 3 years” and “will reduce or increase the number of machines”. For farmers without machines, the questions concerned whether they would use (purchase) machinery within the next 3 years. In the last section, farmer characteristics (e.g., education level, size of farming, and income) were included. Before starting the survey, the questionnaire was tested to verify that all questions were interpreted correctly. The combined values of attitudes, subjective norms, and perceived behavioral control were calculated using the following equations [28]:
Attitude = belief strength × (outcome valuation − 3)
Subjective norm = motivation to comply × (normative belief − 3)
Behavior control = control power × (control strength − 3)
Scores for outcome, subjective norm, and behavioral control were reduced by three points to obtain a negative to positive balance ratio (−2 to 2). Thus, the values ranged between −10 and 10 for each farmer. Values <0 were regarded as barrier, and values >0 were regarded as driving factors [28]. A mean (strength, motivation, and power) <3 was defined as a potential barrier or driver.
The significance of differences in outcomes, social referents, control factors, and farmers’ intentions among different cooperative directors as well between farmers without machines and machine operators was analyzed using one-way ANOVA with Tukey’s test. Spearman’s rank correlation test was conducted using SPSS 25.0 to investigate correlations between farmers’ intentions and characteristics.

3. Results

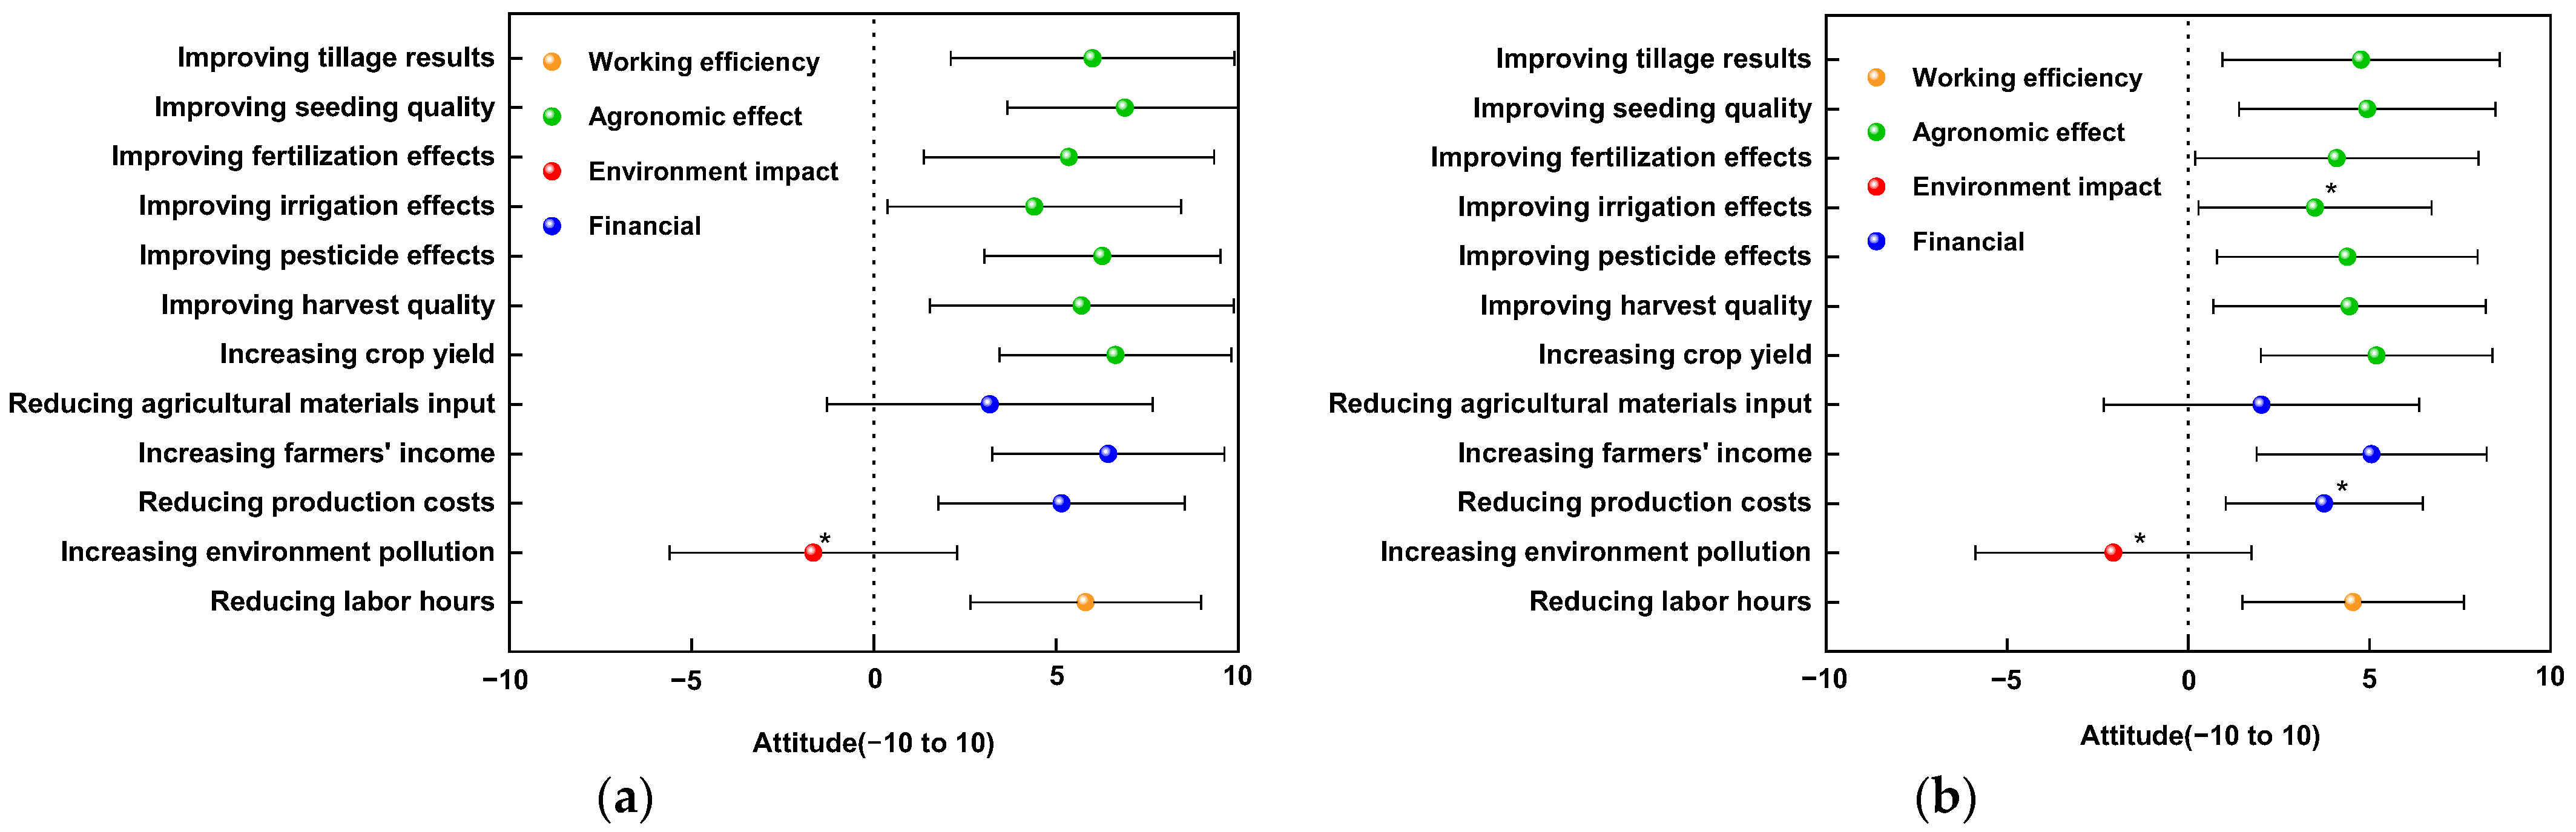
3.1. Farmers’ Attitudes toward Using Machinery

The 12 attitudinal factors toward using machinery were divided into four categories: working efficiency, agronomic effectiveness, environmental impact, and economy (Figure 1). Attitude values >0 indicate that farmers have positive attitudes, while attitude values <0 indicate negative attitudes. For most farmers, positive attitudes stemmed from the fact that machinery could increase yields and improve the quality of agronomic management (e.g., tillage, seeding, fertilizer application, irrigation, and harvesting) as well as improve economic efficiency (e.g., increasing farmer income and reducing expenses) and save working time. Attitudes of NCP and NEP farmers differed regarding the agronomic effectiveness and economic impact of using machinery. Although NCP farmers expected the use of machinery to improve irrigation effectiveness and reduce production costs, the majority of farmers did not think the current irrigation technique was inefficient (belief intensity <3). Surprisingly, there were no significant differences between cooperative directors, farmers without machines, and machine operators.
Farmers perceived increased environmental pollution as a negative consequence of machinery use (Figure 1). However, many farmers thought that the risk of environmental pollution from the use of machinery was low (i.e., belief intensity <3).

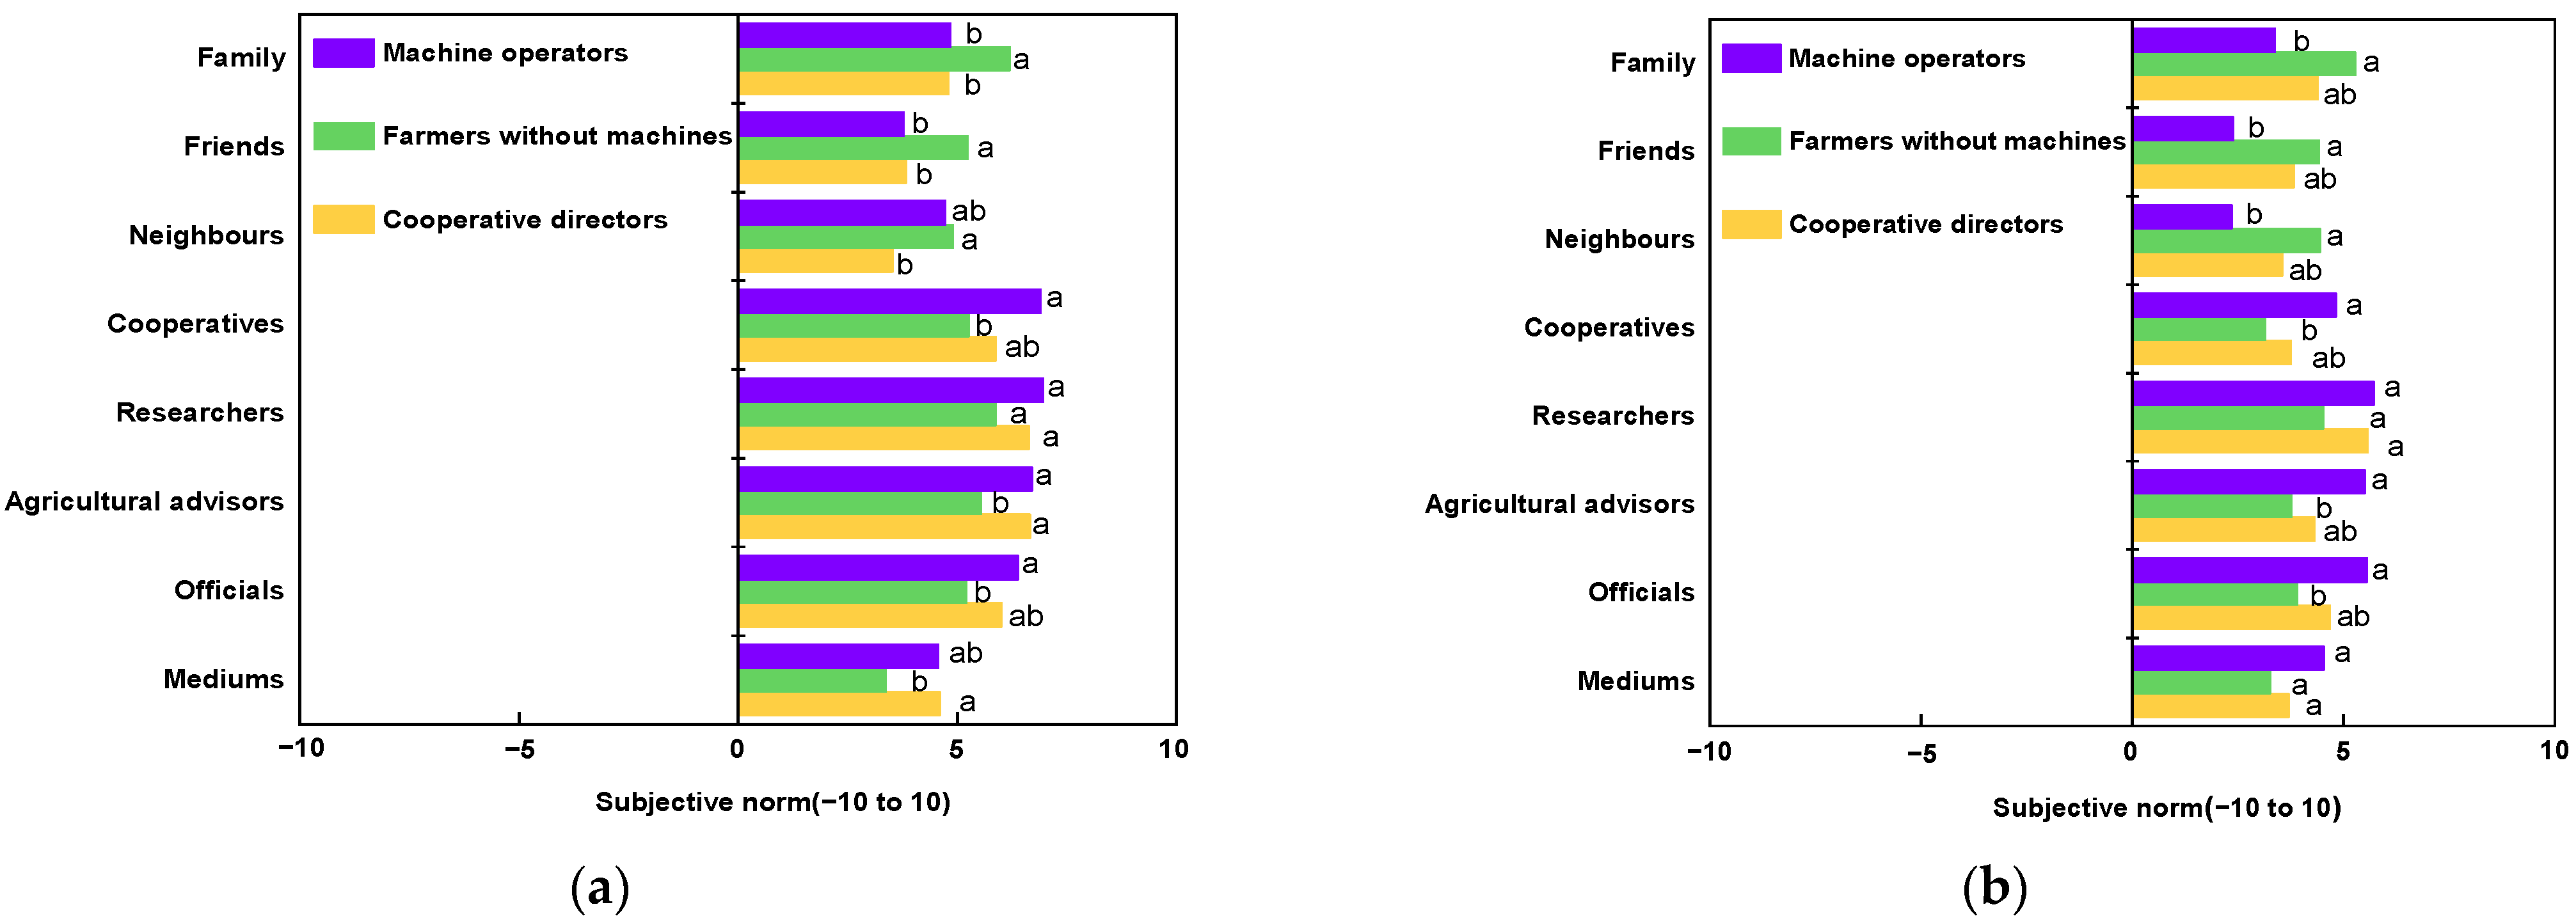
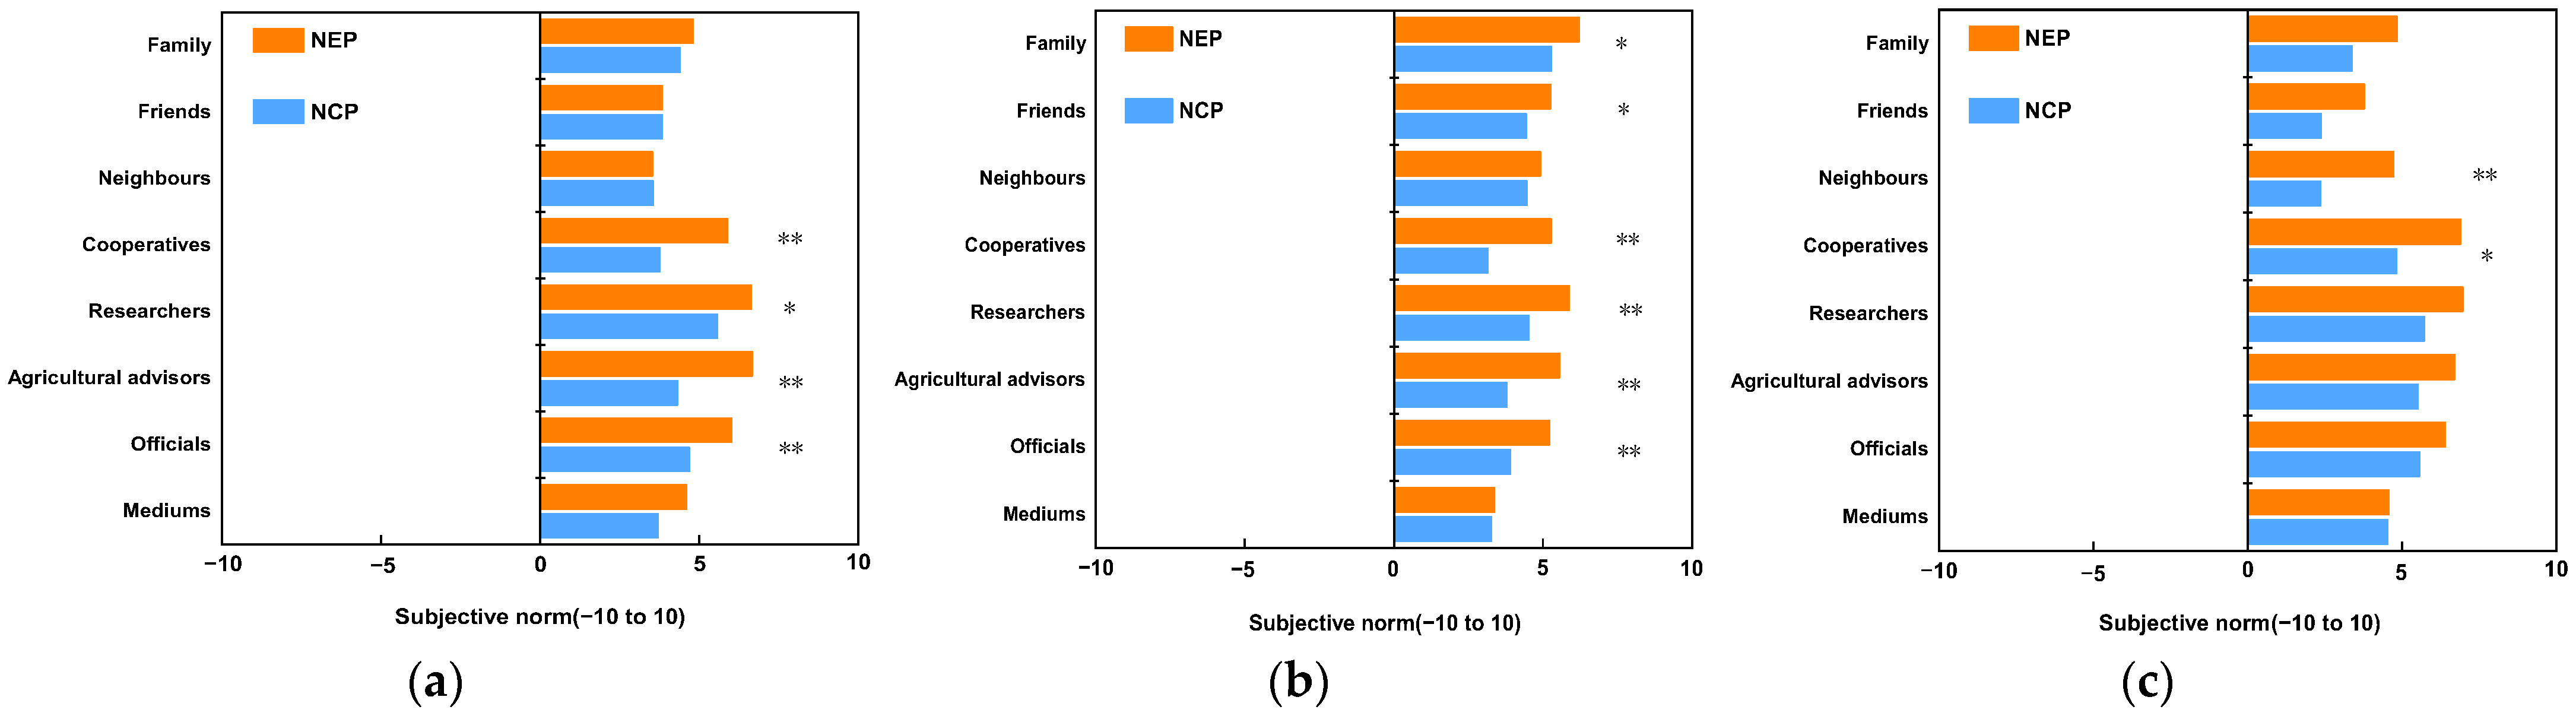
3.2. Influence of Reference Factors on Farmers’ Decision to Use Machinery

On average, all eight reference factors were considered to be drivers of farmers’ use of machinery (Figure 2). However, different types of farmers were strongly influenced by subjective norms. Farmers without machines (particularly those in NEP) were more strongly influenced by the reference factors of family, friends, and neighbors compared to cooperative directors or machine operators (Figure 2a). In contrast, cooperative directors and machine operators were more positively influenced by social reference factors, such as cooperatives, agricultural advisors, and officials.
Overall, compared to NCP farmers, the use of machinery by NEP farmers was more strongly influenced by subjective norms, particularly among those without machines (Figure 3b). Cooperative directors in NEP were more influenced by cooperatives, researchers, agricultural advisors, and officials compared to NCP directors (Figure 3a). Machine operators in NEP were significantly more influenced by neighbors and cooperatives compared to those in NCP (Figure 3c). Interestingly, both NCP and NEP farmers were influenced by researchers (Figure 2 and Figure 3).

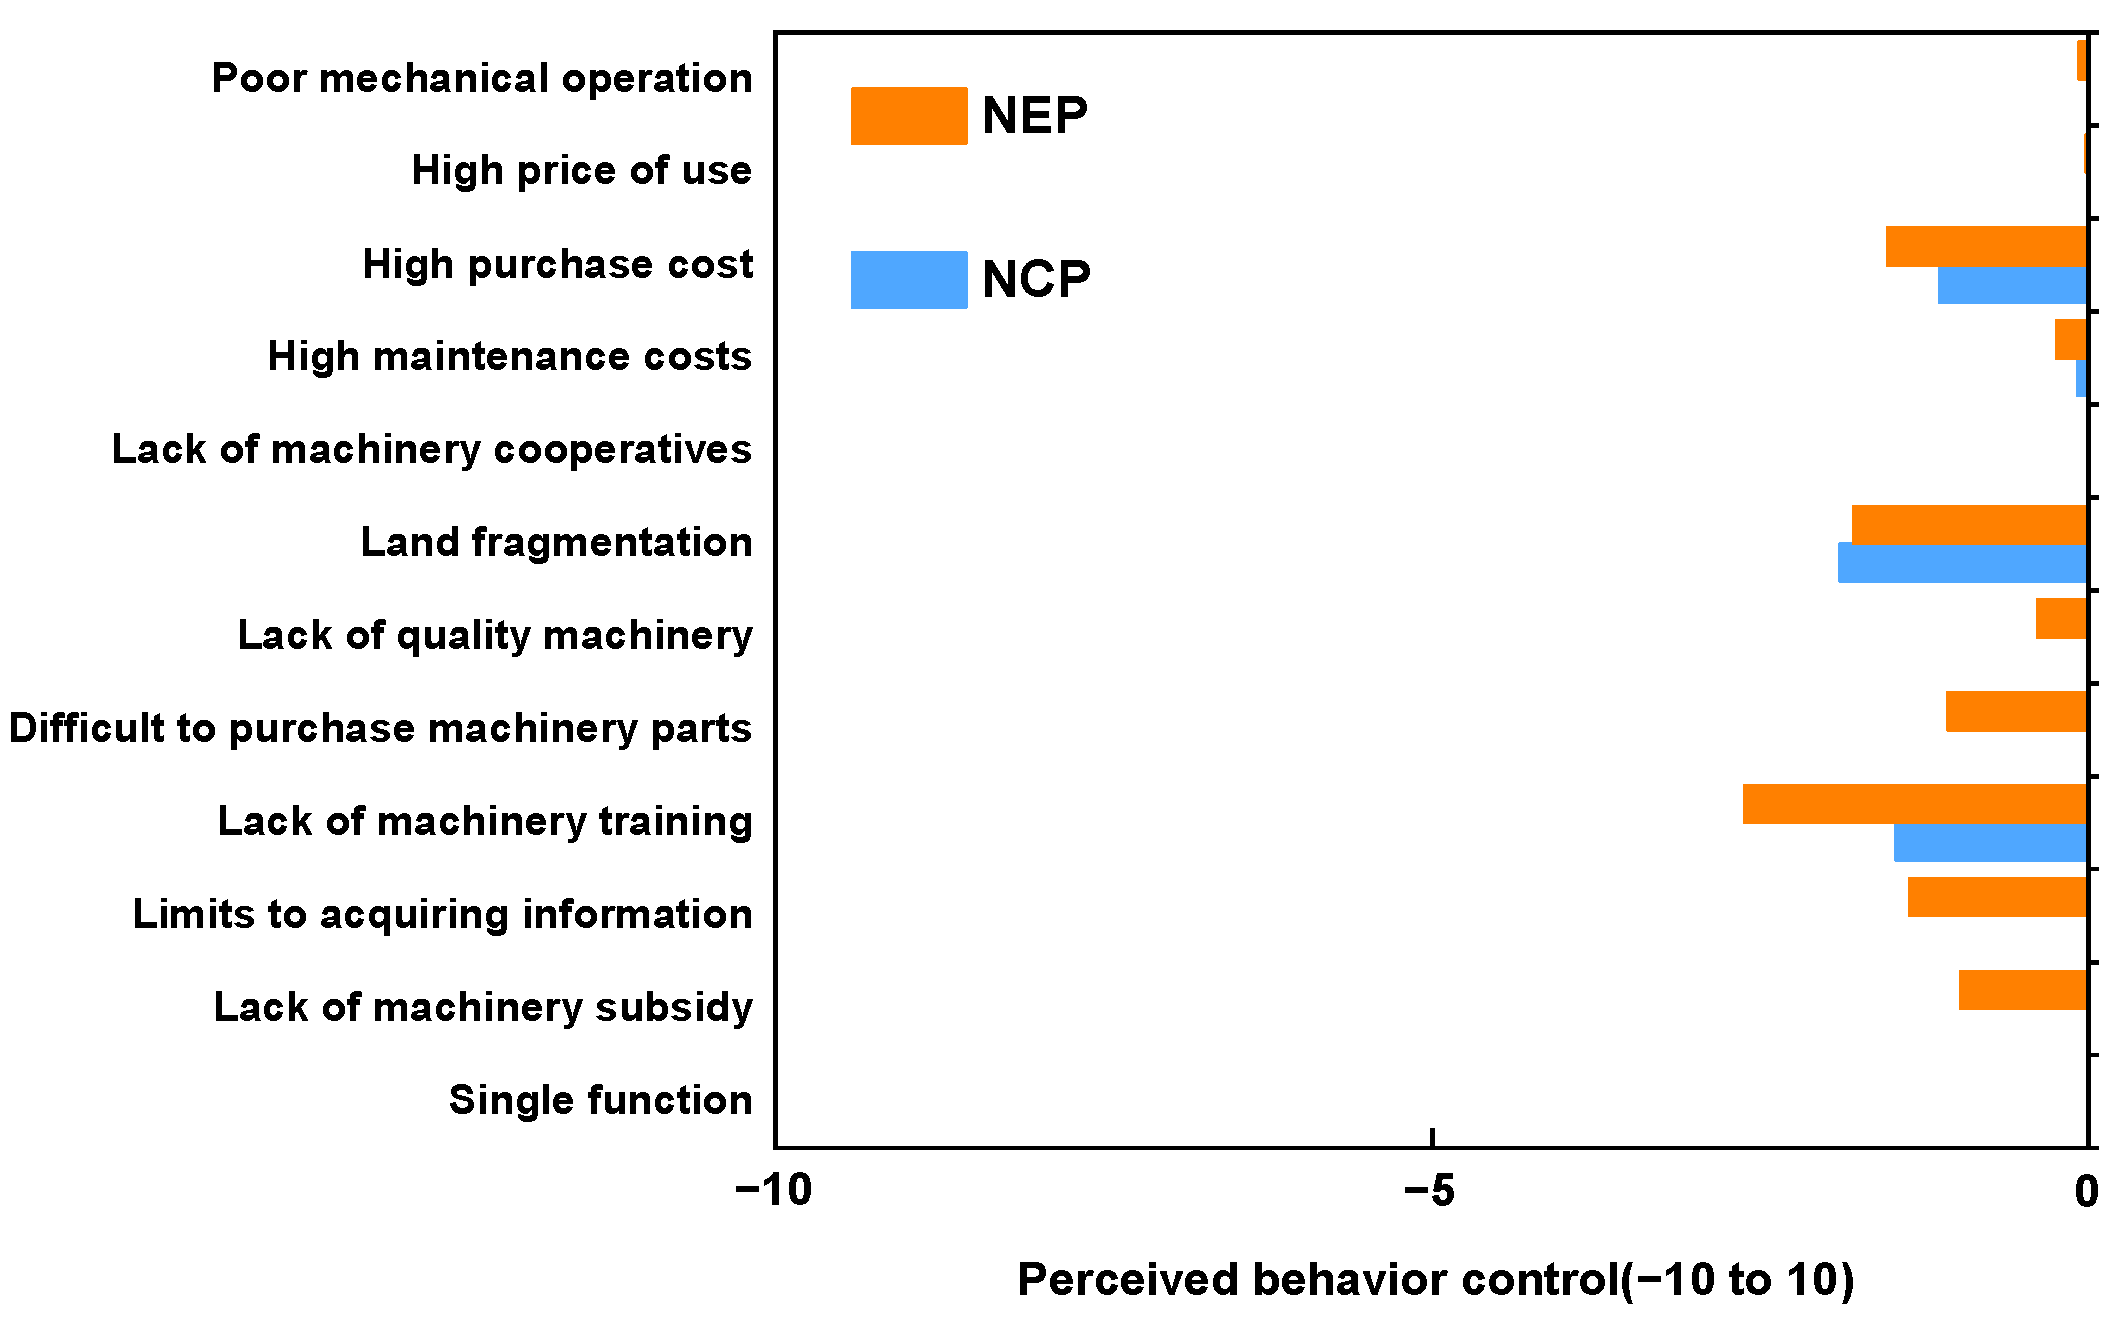
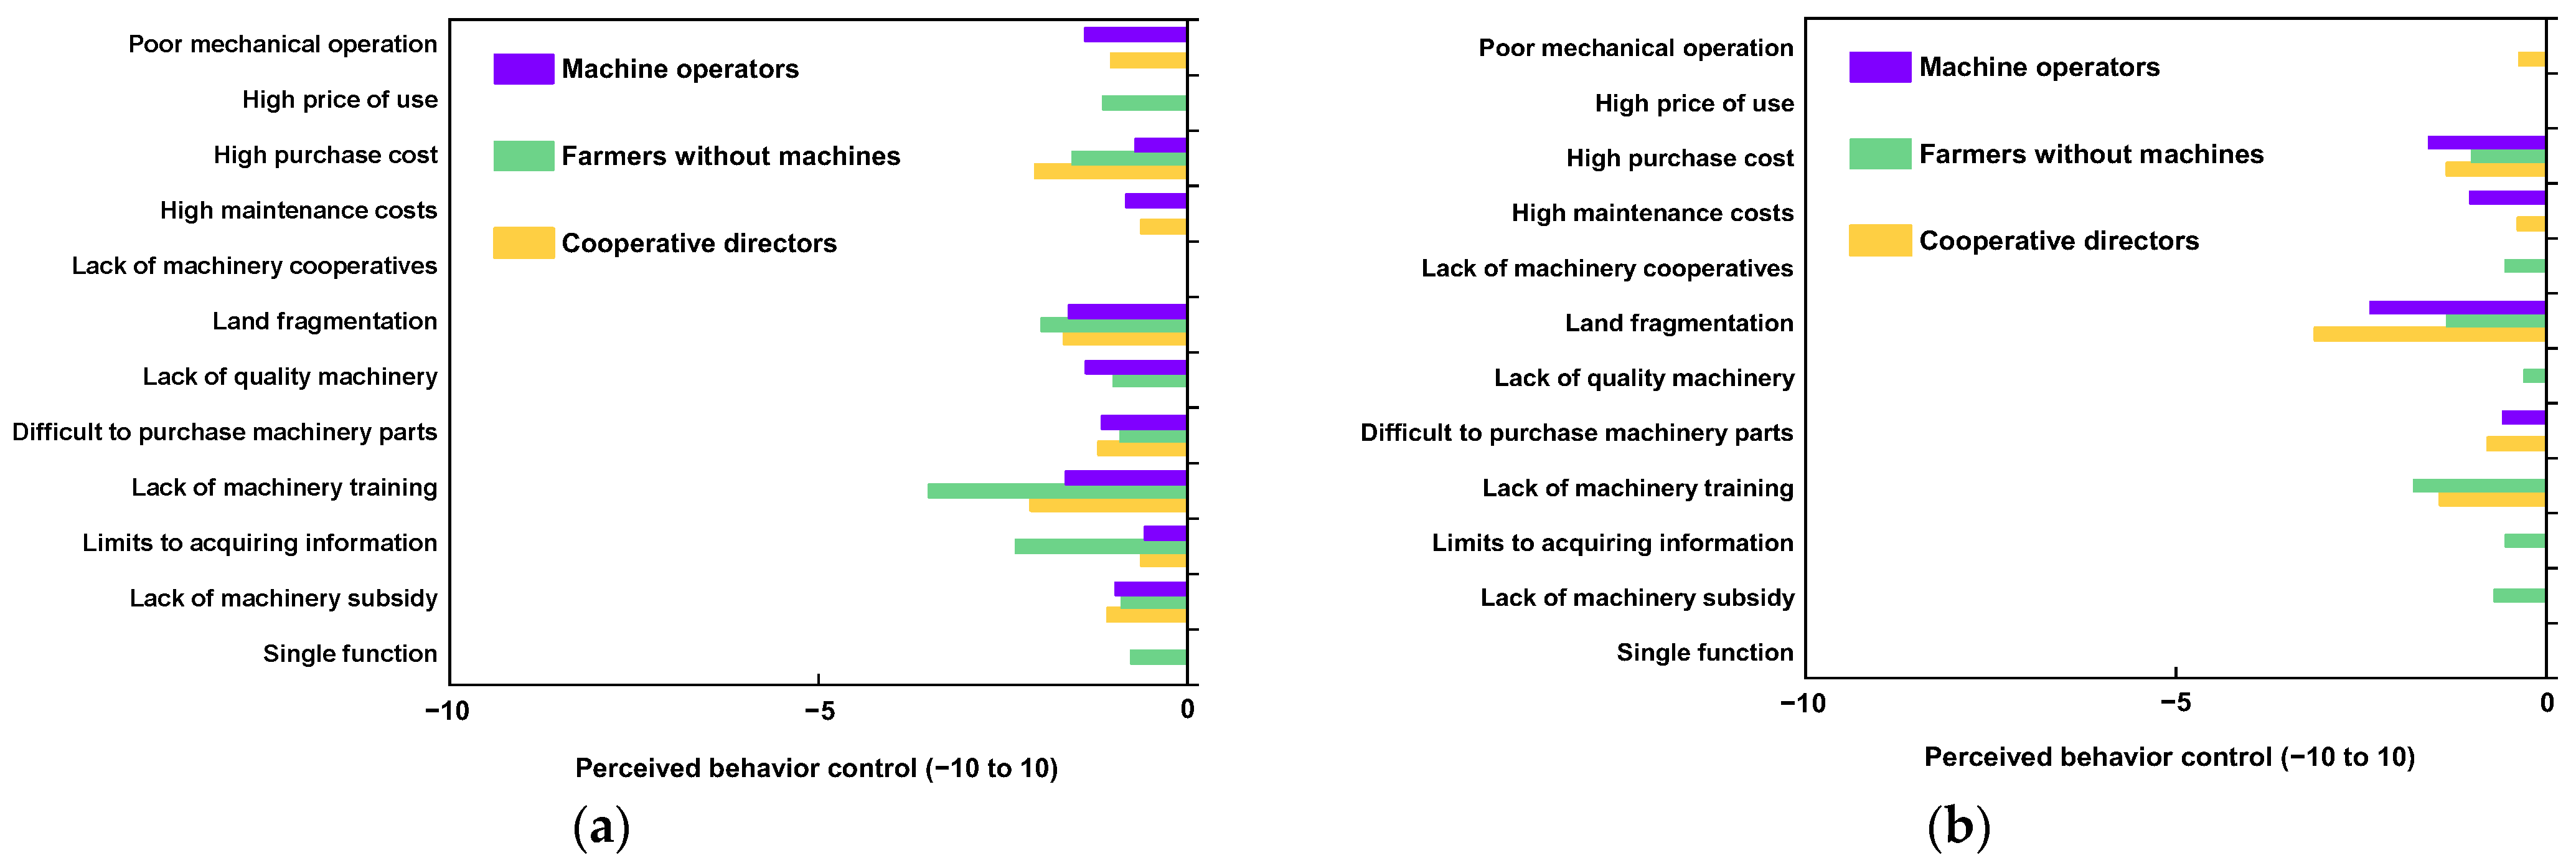
3.3. Barriers Affecting Farmers’ Decision to Use Machinery

Land fragmentation and lack of machinery training were cited by most farmers in both regions as an important barrier to using machinery (Figure 4). However, NEP farmers perceived 8–9 of the 12 possible control factors as barriers and ranked lack of machinery training as the greatest barrier. Meanwhile, high purchase prices, difficulties of purchasing machinery parts, limited access to product information, and lack of machinery subsidies were also seen as obstacles. For NCP farmers, barriers were more focused on (i) land fragmentation, (ii) lack of machinery training, and (iii) high cost of purchasing machines.
In addition, there were specific barriers for the same types of farmers in different regions (Figure 5). In NEP, farmers without machines cited the single function of machinery and high price of use as the barriers, while famers without machines in NCP cited lack of machinery cooperatives as the main barrier. The greatest barriers for cooperative directors in NEP were the lack of machine training, high purchase cost, and land fragmentation, whereas cooperative directors in NCP reported that land fragmentation was the greatest barrier. Regarding machine operators, those in NEP cited poor quality of machine operations, lack of high-performance machinery, lack of machinery training, difficulty in accessing product information, and lack of machinery subsidies as barriers, whereas those in NCP cited high purchase and maintenance costs, land fragmentation, and difficulty in purchasing machinery parts as barriers.

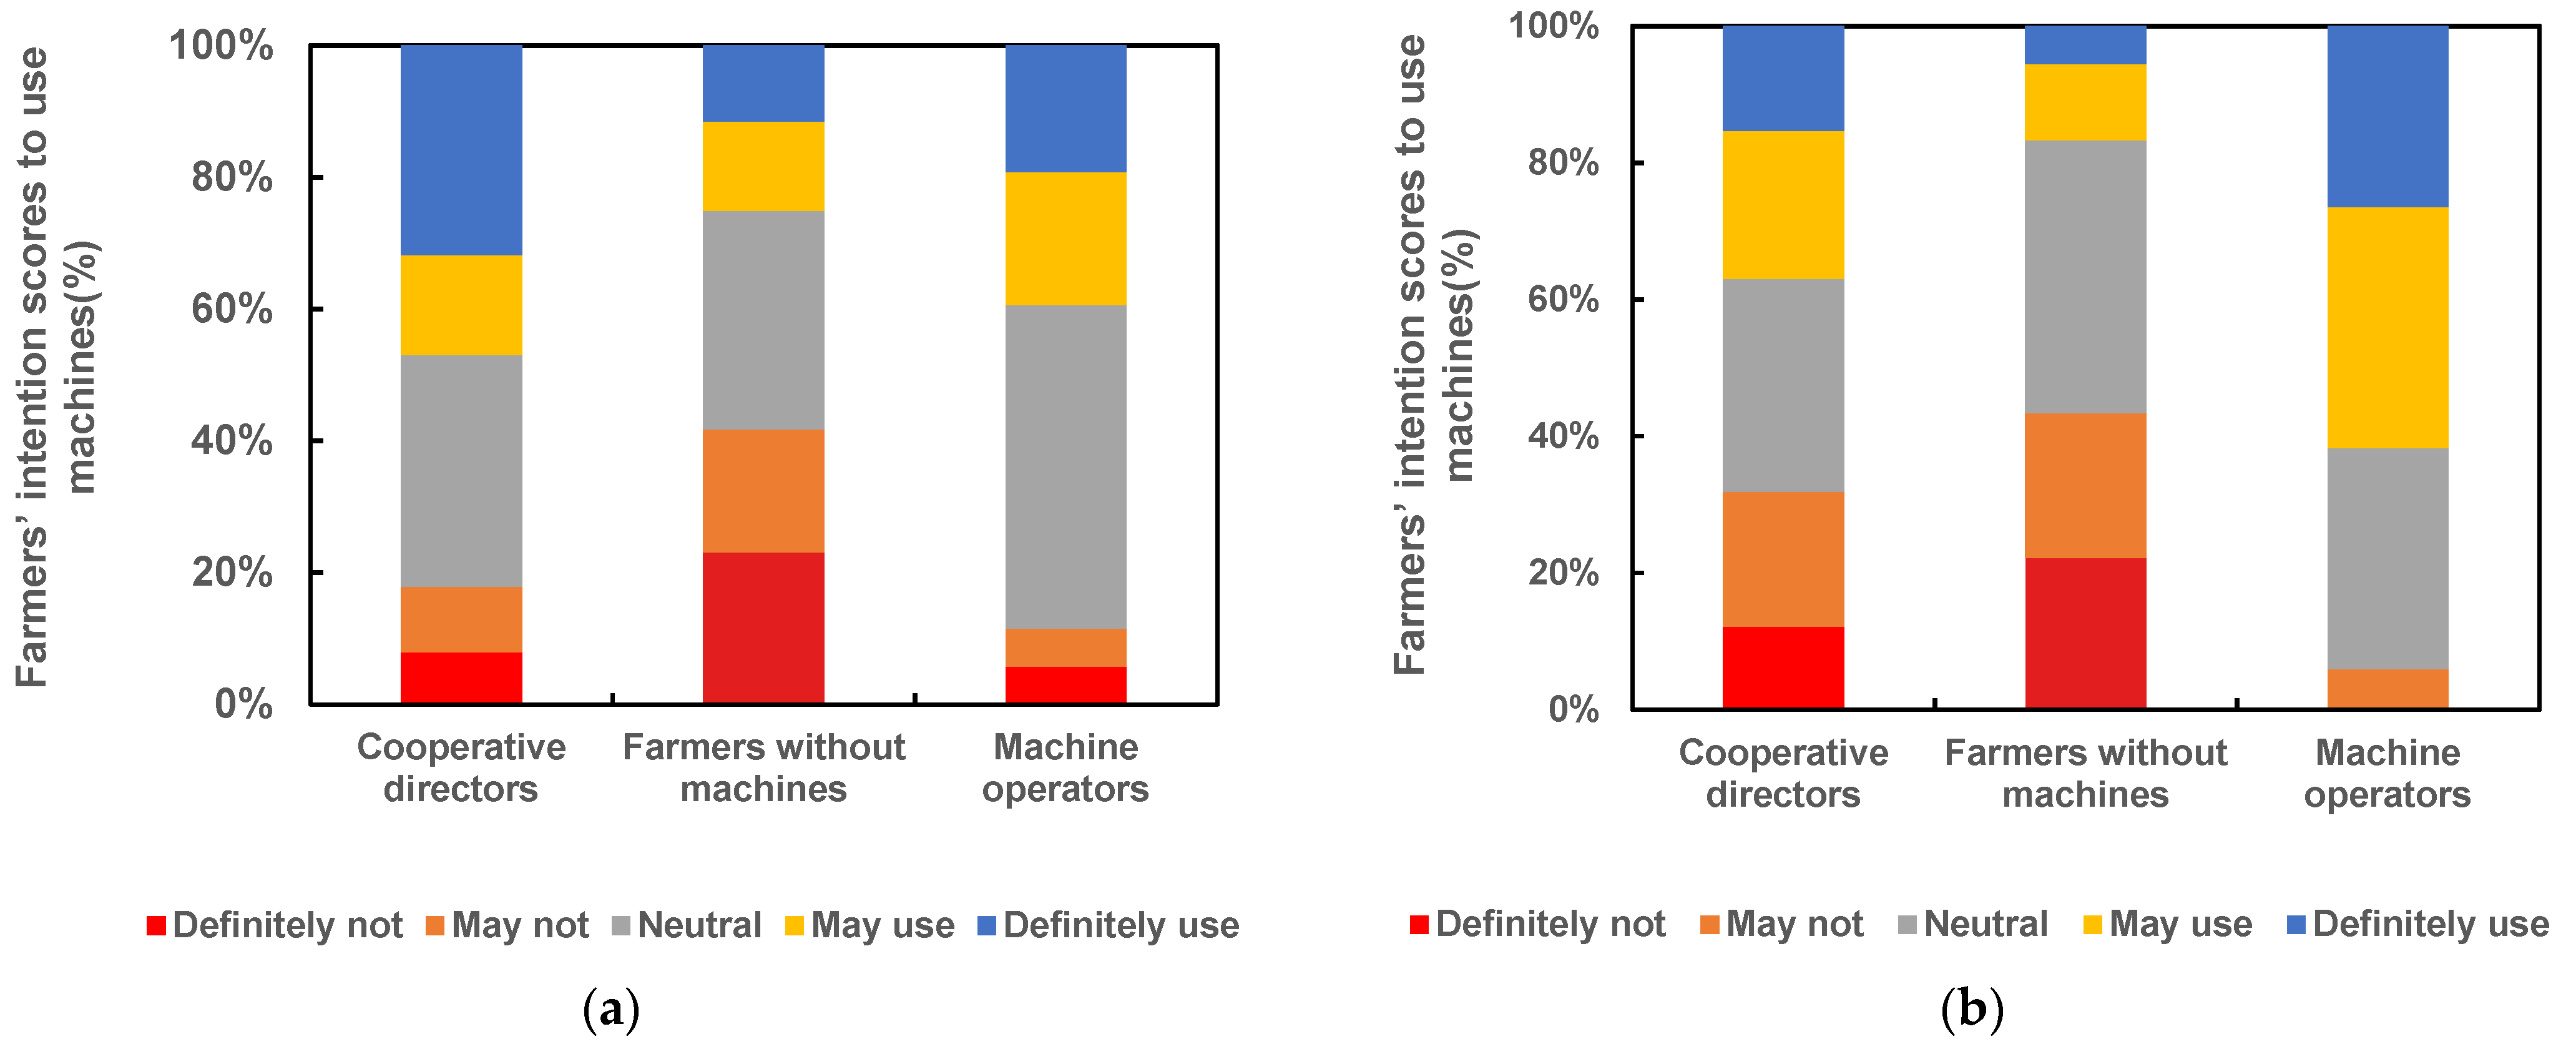
3.4. Farmers’ Future Intention to Using Machinery

In NEP, 47% of directors and 39% of operators intended to use machinery in the next three years compared to 25% of farmers without machines intending to use it in the future (Figure 6). In NCP, 37%, 62%, and 17% of directors, machine operators, and farmers without machines intended to use machines, respectively. Surprisingly, 31%–49% of the farmers investigated expressed neutral attitudes.

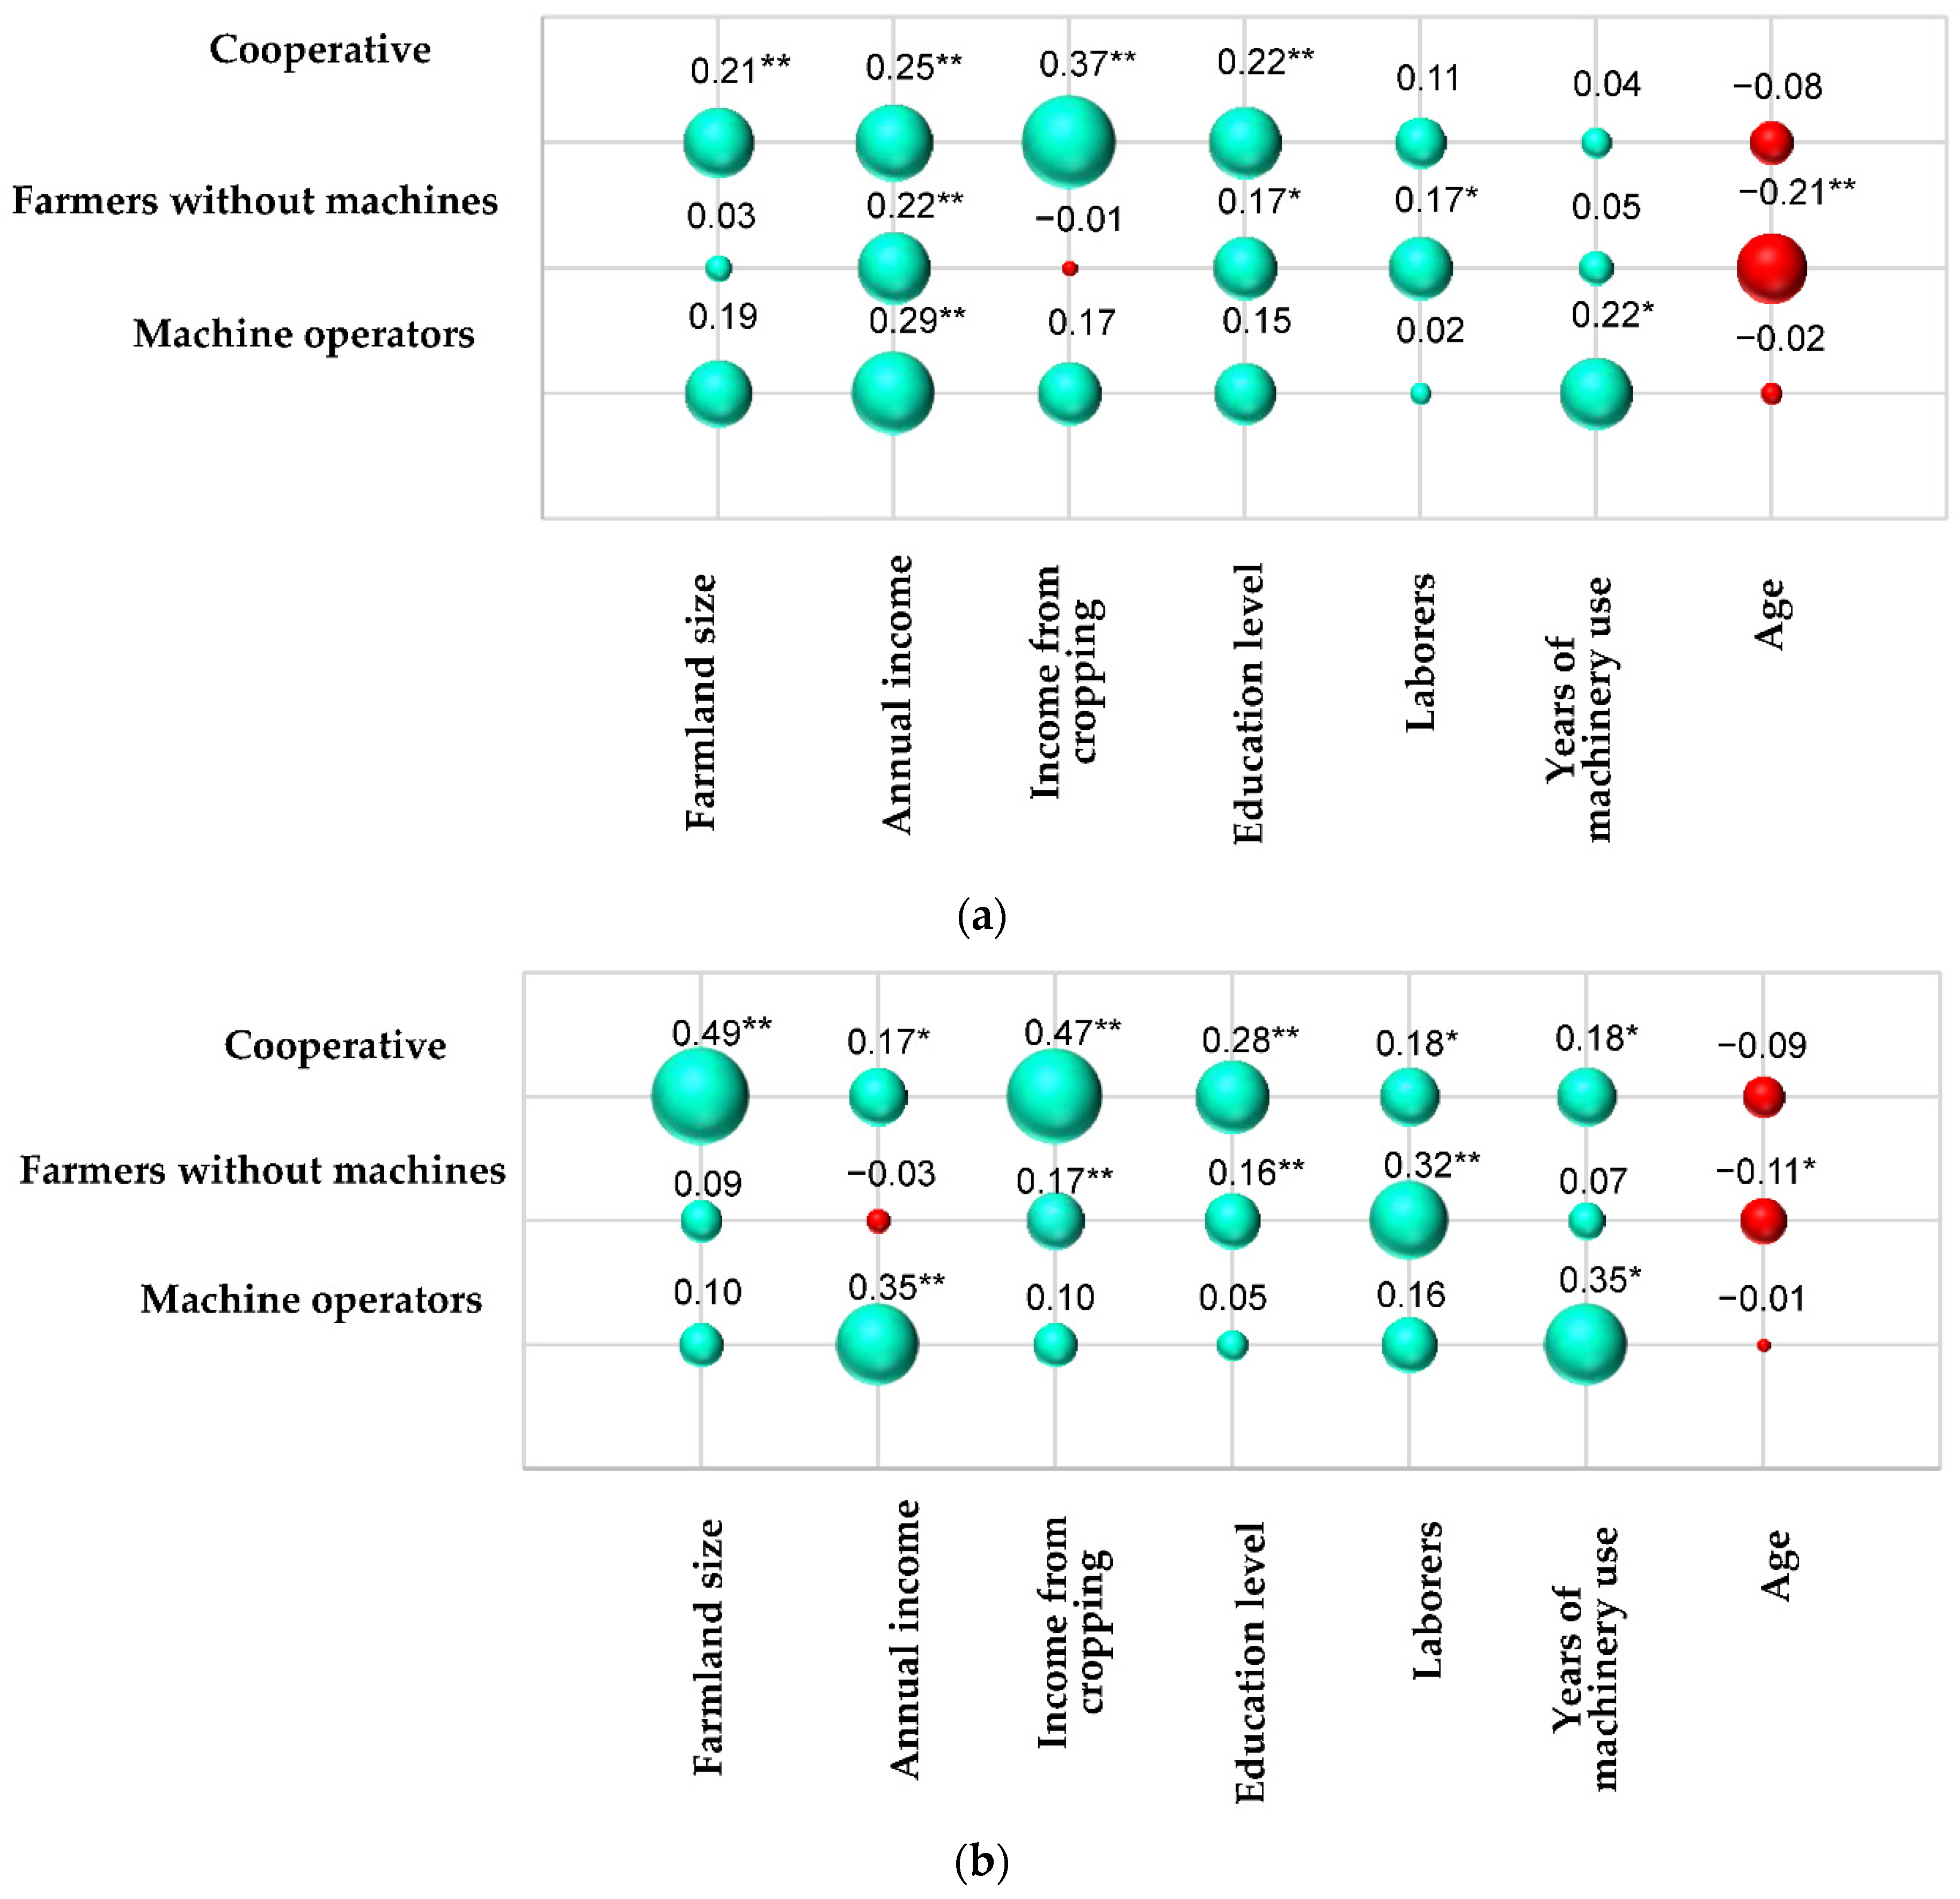
3.5. Correlation between Farmers’ Intention to Use Machinery and Farmers’ Characteristics

Farmers’ intention to use machinery was correlated with their characteristics (Figure 7). Specific types of farmers showed the same correlations in both regions. For farmers without machines, the intention to use machines was positively correlated with the level of education and the number of household laborers and negatively correlated with farmer age. For cooperative directors, the intention to use machines was positively correlated with farm size, income, and level of education. For machine operators, the intention to use machines was positively correlated with annual income and years of machinery use.
Farmers’ intention to use machines differed between NCP and NEP. The intention among NEP farmers was strongly positively correlated with annual income. Among NCP farmers, the intention was positively correlated with annual income in machine operators, whereas it was positively correlated with planting income in farmers without machines. The intentions of NCP directors were positively correlated with all given survey options, except for age.
Farming income was an important component of household income in our sample. Cooperative directors mostly depended on farming income, whereas machine operators were the least dependent. In the absence of machinery, farmers’ intention was strongly and positively related to the number of household laborers and negatively related to age. The operators’ intention to use machines was positively correlated with the number of years of machinery use.

4. Discussion

4.1. Opportunities and Challenges to Using Machinery among Farmers

In recent years, a large number of young rural laborers have migrated to cities, resulting in a shortage of young laborers in rural areas in China [29]. In our survey, in NEP, 40.3% of the farmers were over 54 years old and 10.6% were under 35 years old. In NCP, 55.5% and 3.5% of the sample were older and younger farmers, respectively. For farmers without machines, age was negatively correlated with the intention to use machines. Moreover, the average number of household laborers was 1.8–2.0 in NEP and 1.7–1.8 in NCP and exhibited a positive correlation with intention, especially in NCP farmers without machines. These results confirm that the use of machinery in agricultural production relies heavily on family members [30].
Farmers perceived the use of machinery as positive for economic benefits (Figure 1). From sowing to harvesting, farmers are able to reduce labor intensity and can increase productivity through the use of machinery [31,32,33]. However, in NCP, farmers did not think machinery could improve irrigation and reduce production costs (Figure 1b), indicating that the use of irrigation equipment is limited by some social factors (e.g., land fragmentation and small field sizes). Different social referents may influence farmers’ decisions in different ways [34]. In general, researchers develop new machinery and develop new technologies, and agricultural advisors pass on the machinery and technologies to farmers [35]. Accordingly, it was found that most farmers maintained a high level of trust in researchers, particularly in NEP (Figure 2). Therefore, the quality of communication between researchers and farmers plays an important role in farmers’ decision-making [36]. Despite this, only 20% of farmers without machines expressed an intention to use machinery in the near future, with 33% of cooperative directors and 40% of machine operators choosing to use machinery depending on the situation. This finding indicates that there are still some barriers preventing farmers from using machinery.

4.2. The Main Obstacles to Using Machinery

4.2.1. Field Size and Fragmentation

In both regions, land fragmentation is a key barrier limiting the use of machines (Figure 4). In NCP, the per capita planted area of farmers without machines was only 0.44 ha. The use of tractors, which usually make multiple turning maneuvers in a field, would result in low mechanical productivity [37]. Although NEP has a large per capita surface, there is still a high degree of land fragmentation, with the average number of plots on a farm (cooperative) reported to range from 3.1 to 4.9 compared to more than 5.5 in NCP [38]. Because most farmers own more than one field and the distance between plots is often several hundred meters or even several kilometers, machine operators often travel a long distance but work only a few acres, which increases the operating cost of machinery and results in low economic efficiency [39]. There was a significant positive correlation between acreage and intention to use machinery in the future (Figure 6). Large acreage operations are typically more sensitive to inputs and profits [40].
In China, the average water productivity for food crop production is 1 kg/m3, which is only 50% of that in developed countries [41]. In NCP, which has insufficient rainfall and a high degree of land dispersion, most farmers use furrow irrigation, in which nearly 60% of the water is lost [42]. The use of modern irrigation equipment is limited by field size, which is why NCP farmers believed that using machinery did not improve irrigation (Figure 1). In the United States, on average, each farmer manages more than 100 ha of land, and the concentrated contiguous land greatly increases the efficiency of mechanical operations [43]. Pointer sprinklers typically have a single span length of 50 m, and approximately 28 ha of the field can be irrigated by completing a single turn, which maximizes economies of scale [44,45].

4.2.2. Mechanical Technology Training

Most of the farmers in NCP and NEP regarded the lack of machinery training as the main obstacle. Farmers without machines considered the lack of machinery training as the greatest obstacle (Figure 4 and Figure 5). The reason may be that, at present, most farmers in China lack basic scientific knowledge in agronomy and typically rely on the experience of their parents and friends [46]. Because of lack of effective training, some farmers have poor ability to operate machinery, particularly medium and large machines, potentially causing damage to the machines [47]. In China, technical training for farmers is currently mainly conducted in the form of classroom lectures and is often delivered as a one-time training session. There is little evidence on the effectiveness of such training [48]. This can lead to poor machine operation outcomes, such as herbicide damage and poor crop residual disposal, and may consequently affect crop yield and the efficiency of machinery use [49,50]. With the emergence of large and medium-sized tractors and high-performance and high-quality implements, effective technical training may be an important factor affecting farmers’ attitudes toward using machines.

4.2.3. Agricultural Machinery Prices and Food Prices

In general, the surveyed farmers agreed that the high price of purchasing machines was a barrier to use. This barrier was felt particularly by cooperative directors and farmers without machines in NEP (Figure 5) because these farmers had larger areas of land than those in NCP and required more medium and large tractors with efficient implements, which are also more expensive. However, the average income of the farmers growing cereal crops (wheat, maize, and rice) was less than $181.49 (in 2018 constant dollars)/ha over the past three years [51], whereas the cost of purchasing a piece of machinery is $1500 to $15,000. Thus, the low profitability would directly limit farmers’ intention to purchase machines, especially among cooperative directors (Figure 6).

4.3. Approaches for Promoting the Development of Agricultural Machinery in China

Farmers’ decisions are often influenced by interactions between dealers, manufacturers, and government agencies, and differences in environmental and cultural backgrounds entangle farmers in a large and complex network [52]. Therefore, it is necessary for governments to use diverse strategies to encourage farmers to use machinery. First, both NEP and NCP are suitable for large-scale mechanized production. For cooperative directors, farmland size was strongly positively correlated with the intention to use machinery (Figure 7), and land fragmentation was seen as the most critical barrier. Thus, the merge of small scale farmland may provide a feasible solution. A previous study reported that the development of high-quality farmland in which the fields are concentrated and contiguous, small to large, and curved to straight provide a suitable approach for facilitating agricultural mechanization [53]. The Vietnamese government is consolidating larger land size and larger plots and encouraging farmers to invest more in machinery use to increase higher farm incomes by substituting machinery for labor [54]. Currently, the Chinese government has set an annual target of developing 100 million mu (1 in 15 ha) of high-quality farmland in 2021, which will boost the widespread use of machinery [55].
For farmers without machines, the lack of machinery training and poor access to product information were found to be important barriers in the current study (Figure 5). Thus, these farmer may be positively influenced by a range of social norms, such as advice from agricultural researchers and advisors, to enhance motivation to use machinery. Interactive learning between farmers and teams of technical advisors, experts, and universities can encourage the development and application of innovative ideas [56]. A team at Eberswalde University in Germany established a farmer university network that includes farms, agricultural organizations, and research institutes. Using this approach, expert scholars can train farmers in the use of new technologies and farmers can give feedback to research institutions about the problems encountered in production. These positive interactions were found to promote continuous innovation in agricultural technology [57]. When conservation tillage was introduced in the UK, a continuous learning process was used to train farmers, and the researchers conducted technical follow-up after farmers adopted the new technology. This process enhances communication between researchers and farmers and ensures the implementation of new technology [58]. Commercial companies and university experimental stations may jointly provide machinery training courses, live demonstrations and practical operations on field days, and long-term intensive field coaching [59]. In addition, farmers can learn from each other and solve challenges related to machinery use in the actual planting process. This strategy is in line with the concept of “knowledge-attitude-practice” [60]. In China, collaboration between researchers and farmers may provide an effective approach for introducing new concepts to smallholder farms [61]. Farmers’ intentions to use machines were severely limited by the high costs of purchase and maintenance of machines and low annual income (Figure 4 and Figure 5). Machinery subsidies may provide a feasible way to remove these barriers. Some researchers have affirmed the positive impact of subsidies on farmers’ purchasing behavior, arguing that subsidies play a “well-leveraged” role [62,63]. However, it has also been pointed out that although subsidies can increase farmers’ enthusiasm for purchasing machines in the short term, in the long term, the rapid growth of machinery ownership, the gradual saturation of the market, and lower than expected returns from machine operations may have a negative impact on the demand for machinery [64]. In China, it is generally agreed that subsidies for machine purchases have a positive impact on agricultural output [65]. However, the current system of subsidies for machine purchase has some limitations, including narrow coverage, poor product quality, and poor awareness of after-sales service. These problems limit farmers’ motivation to purchase machinery [66]. During the development of agricultural mechanization in Japan in the 1970s, small-scale farmers had low efficiency in the use of machinery, and investment in purchasing machinery was difficult to recover. These problems resulted in lower income for farmers in a phenomenon referred to as “mechanized poverty” [67]. In China, where small-scale farmers are also dominant, this phenomenon should be changed. A targeted subsidy policy may be needed that considers the product quality, the income level of different regions, and interest subsidies for loans [68]. There may be some possible limitations in this study. The study area focused only on NEP and NCP, did not analyze barriers to mechanization development in northwestern and southern China, and lacked ongoing follow-up of individuals in the sample. Therefore, our estimates are likely to be conservative. In the future, we will refine the study for other regions as well as provide questionnaire feedback to the samples already studied and explain the reasons for the changes.

5. Conclusions

Most farmers were well aware of the benefits of using machinery. Nevertheless, 50%–79% of farmers expressed low or neutral intention to use machinery. The major barriers limiting farmers’ intention to use machines were the small scale of farmland, land fragmentation, lack of machinery training, and high costs of purchasing machines. The current findings suggest that the government should make policies to support farmers to merge small-scale fields and develop high-quality farmland suitable for mechanized production, enhance machinery training, promote cooperative development, and establish a targeted subsidy mechanism. These recommendations may also be applicable to other developing countries with similar social and economic conditions regarding agricultural development.

Author Contributions

Formal analysis, Y.H.; investigation, S.Y. and Z.W.; resources, G.M.; writing—original draft preparation, Y.H.; writing—review and editing, G.M.; project administration, F.Z. All authors have read and agreed to the published version of the manuscript.

Funding

This research was supported by the Program for the Introduction of International Advanced Agricultural Science and Technology (948 Program, 2016X24) of the Ministry of Agriculture and Rural Affairs, China.

Institutional Review Board Statement

All experiments were performed following the relevant guidelines and regulations set by the Ministry of Agriculture of the People’s Republic of China. Ethical approval on animal survival was given by the animal ethics committee of CAAS-IAS (IAS2019-57).

Informed Consent Statement

Informed consent was obtained from all subjects involved in the study.

Data Availability Statement

The datasets presented in this study are available from the corresponding author on reasonable request.

Acknowledgments

We sincerely thank all the farmers surveyed for their friendly cooperation and the local officials who provided useful advice and information regarding the location of the farmers.

Conflicts of Interest

The authors declare that the research was conducted in the absence of any commercial or financial conflict of interest.

References

  1. Lowder, S.K.; Skoet, J.; Raney, T. The number, size, and distribution of farms, smallholder farms, and family farms worldwide. World Dev. 2016, 87, 16–29. [Google Scholar] [CrossRef] [Green Version]
  2. Guarin, A.; Rivera, M.; Pinto, C.T.; Guiomar, N.; Sumane, S.; Moreno, O.M. A new typology of small farms in Europe. Glob. Food Secur-Agr. 2020, 26, 100389. [Google Scholar] [CrossRef]
  3. MARA (Ministry of Agriculture and Rural Affairs). National Data; Ministry of Agriculture and Rural Affairs: Beijing, China, 2020. (In Chinese)
  4. MARA (Ministry of Agriculture and Rural Affairs). Promote the Overall Development of the Action Program for the Promotion of Key Technologies in Agricultural Mechanization; Ministry of Agriculture and Rural Affairs: Beijing, China, 2018. (In Chinese)
  5. BEA (U.S. Bureau of Economic Analysis). BEA Statistical Databases; U.S. Bureau of Economic Analysis: Washington, DC, USA, 2020.
  6. NBSC (National Bureau of Statistics of China). National Data; National Bureau of Statistics of China: Beijing, China, 2020. (In Chinese)
  7. Zhao, C.J. State-of-the-art and recommended developmental strategic objectives of smart agriculture. Smart Agric. 2021, 1, 1–7. [Google Scholar]
  8. Feng, J.Y.; Lu, P.; Mu, W.S.; Zhang, X.S.; Fu, Z.T. Farmers’ brand perception toward agricultural machinery in China. Afr. J. Agr. Res. 2011, 6, 1966–1971. [Google Scholar]
  9. Wang, S.K.; Li, D.W.; Li, T.T.; Liu, C.Q. Land use transitions and farm performance in China: A perspective of land fragmentation. Land 2021, 10, 792. [Google Scholar] [CrossRef]
  10. Wang, X.B.; Yamauchi, F.; Huang, J.K.; Rozelle, S. What constrains mechanization in Chinese agriculture? Role of farm size and fragmentation. China Econ. Rev. 2020, 62, 101221. [Google Scholar] [CrossRef]
  11. Huang, Z.H.; Guan, L.J.; Jin, S.S. Scale farming operations in China. Int. Food Agribus. Manag. 2017, 20, 191–200. [Google Scholar] [CrossRef]
  12. Pan, D. The impact of agricultural technology training on rural residents’ income: A study based on the propensity score matching method. J. Nanjing Agri Univ. 2014, 5, 62–69. (In Chinese) [Google Scholar]
  13. Fan, L.X.; Niu, H.P.; Yang, X.M.; Qin, W.; Bento, P.M.; Coen, J.R.; Violette, G. Factors affecting farmers’ behaviour in pesticide use: Insights from a field study in northern China. Sci. Total Environ. 2015, 537, 360–368. [Google Scholar] [CrossRef]
  14. Eurostat. Small and Large Farms in the EU-Statistics from the Farm Structure Survey; Eurostat: Luxembourg, 2021. [Google Scholar]
  15. Fleisher, B.M.; Liu, Y.H. Economies of scale, plot size, human-capital, and productivity in Chinese agriculture. Qtrly. Rev. Econ. Financ. 1992, 32, 112–123. [Google Scholar]
  16. Masuda, K. Energy efficiency of intensive rice production in Japan: An application of data envelopment analysis. Sustainability 2018, 10, 120. [Google Scholar] [CrossRef] [Green Version]
  17. Matsukura, S.; Nanseki, T.; Fujii, Y.; Sato, M.; Chomei, Y.; Miyazumi, M. Effect of farming skill and farm size on production costs on large rice farms: A simulation analysis by FAPS-DB. Agri. Info. Res. 2015, 24, 35–45. [Google Scholar]
  18. Nguyen, T.H.; Thai, T.Q.; Tran, V.T.; Pham, T.P.; Doan, Q.C.; Vu, K.H.; Doan, H.G.; Bui, Q.T. Land Consolidation at the Household Level in the Red River Delta, Vietnam. Land 2020, 9, 196. [Google Scholar] [CrossRef]
  19. Nguyen, H.Q.; Warr, P. Land consolidation as technical change: Economic impacts in rural Vietnam. World Dev. 2020, 127, 104750. [Google Scholar] [CrossRef]
  20. Tamirat, T.W.; Pedersen, S.M.; Lind, K.M. Farm and operator characteristics affecting adoption of precision agriculture in Denmark and Germany. Acta Agr. Scand. B-Soil Plant Sci. 2018, 68, 349–357. [Google Scholar] [CrossRef]
  21. Novelli, S. Determinants of environmentally-friendly farming. Calitatea 2018, 19, 340–346. [Google Scholar]
  22. Durczak, K.; Ekielski, A.; Kozlowski, R.; Zelazinski, T.; Pilarski, K. A computer system supporting agricultural machinery and farm tractor purchase decisions. Heliyon 2020, 6, 10. [Google Scholar] [CrossRef]
  23. Daum, T.; Huffman, W.E.; Birner, R. How to create conducive institutions to enable agricultural mechanization: A comparative historical study from the United States and Germany. Work. Pap.-Dep. Econ. Iowa State Univ. 2018, 18009, 45. [Google Scholar]
  24. Zhang, E.P.; Zhao, X.; Wei, Y.H.; Chen, F.; Zhang, H.L. Farmers’ perception and problems of conservation tillage extension. Agric. Sci. Technol. 2014, 16, 166–173. [Google Scholar]
  25. Hijbeek, R.; Pronk, A.A.; van Ittersum, M.K.; Verhagen, A.; Ruysschaert, G.; Bijttebier, J.; Zavattaro, L.; Bechini, L.; Schlatter, N.; Ten Berge, H.F.M. Use of organic inputs by arable farmers in six agro-ecological zones across Europe: Drivers and barriers. Agric. Ecosyst. Environ. 2019, 275, 42–53. [Google Scholar] [CrossRef]
  26. Zhang, T.; Hou, Y.; Meng, T.; Ma, Y.; Tan, M.; Zhang, F.; Oenema, O. Replacing synthetic fertilizer by manure requires adjusted technology and incentives: A farm survey across China. Resour. Conserv. Recycl. 2021, 168, 105301. [Google Scholar] [CrossRef]
  27. Tan, M.; Hou, Y.; Zhang, L.; Shi, S.; Long, W.; Ma, Y.; Zhang, T.; Li, F.; Oenema, O. Operational costs and neglect of end-users are the main barriers to improving manure treatment in intensive livestock farms. J. Clean. Prod. 2021, 289, 125149. [Google Scholar] [CrossRef]
  28. Hijbeek, R.; Pronk, A.A.; van Ittersum, M.K.; ten Berge, H.F.M.; Bijttebier, J.; Verhagen, A.; Nicholson, F. What drives farmers to increase soil organic matter? Insights from the Netherlands. Soil Use Manag. 2018, 34, 85–100. [Google Scholar] [CrossRef] [Green Version]
  29. Xu, D.D.; Deng, X.; Guo, S.L.; Liu, S.Q. Labor migration and farmland abandonment in rural China: Empirical results and policy implications. J. Environ. Manag. 2018, 232, 738–750. [Google Scholar] [CrossRef]
  30. White, B. Agriculture and the generation problem: Rural youth, employment and the future of farming. IDS Bull. Inst. Dev. Stud. 2012, 43, 9–19. [Google Scholar] [CrossRef] [Green Version]
  31. Pretty, J. Agricultural sustainability: Concepts, principles and evidence. Philos. Trans. R. Soc. B Biol. Sci. 2008, 363, 447–465. [Google Scholar] [CrossRef] [Green Version]
  32. Wang, X.B.; Yamauchi, F.; Otsuka, K.; Huang, J.K. Wage Growth, Landholding, and Mechanization in Chinese Agriculture. World Dev. 2016, 86, 30–45. [Google Scholar] [CrossRef] [Green Version]
  33. Tavenner, K.; Wijk, M.; Fraval, S.; Hammond, J.; Baltenweck, I.; Teufel, N.; Kihoro, E.; Haan, N.; Etten, J.; Steinke, J.; et al. Intensifying Inequality? Gendered trends in commercializing and diversifying smallholder farming systems in East Africa. Front. Sustain. Food Syst. 2019, 3, 10. [Google Scholar] [CrossRef]
  34. Cai, T.; Steinfeld, C.; Chiwasa, H.; Ganunga, T. Understanding Malawian farmers’ slow adoption of composting: Stories about composting using a participatory video approach. Land Degradat. Dev. 2019, 30, 1336–1344. [Google Scholar] [CrossRef]
  35. Yang, J.C. Science and technology backyard improves farmers’ productivity. Sci. China Life Sci. 2016, 59, 1348–1349. [Google Scholar] [CrossRef] [Green Version]
  36. Wigboldus, S.; Hammond, J.; Xu, J.C.; Yi, Z.F.; He, J.; Klerkx, L.; Leeuwis, C. Scaling green rubber cultivation in Southwest China-An integrative analysis of stakeholder perspectives. Sci. Total Environ. 2017, 580, 1475–1482. [Google Scholar] [CrossRef] [PubMed]
  37. Cao, Q.J.; Li, G.; Yang, F.T.; Jiang, X.L.; Diallo, L.M.; Chen, X.F. Plough pan impacts maize grain yield, carbon assimilation, and nitrogen uptake in the maize belt of Northeast China. Emir. J. Food Agr. 2017, 29, 502–508. [Google Scholar] [CrossRef] [Green Version]
  38. Wang, Y.H.; Zang, L.Z.; Araral, E. The impacts of land fragmentation on irrigation collective action: Empirical test of the social-ecological system framework in China. J. Rural Stud. 2020, 78, 234–244. [Google Scholar] [CrossRef]
  39. Wang, L.; Qi, Z.R.; Pang, Q.H.; Xiang, Y.B.; Sun, Y.L. Analysis on the agricultural green production efficiency and driving factors of urban agglomerations in the middle reaches of the Yangtze River. Sustainability 2021, 13, 97. [Google Scholar] [CrossRef]
  40. Ju, X.T.; Gu, B.J.; Wu, Y.Y.; Galloway, J.N. Reducing China’s fertilizer use by increasing farm size. Glob. Environ. Change 2016, 41, 26–32. [Google Scholar] [CrossRef]
  41. Wu, P.T.; Jin, J.M.; Zhao, X.N. Impact of climate change and irrigation technology advancement on agricultural water use in China. Clim. Change 2010, 100, 797–805. [Google Scholar] [CrossRef]
  42. Zhu, X.F.; Li, Y.Z.; Li, M.Y.; Pan, Y.Z.; Shi, P.J. Agricultural irrigation in China. J. Soil Water Conserv. 2013, 68, 147A–154A. [Google Scholar] [CrossRef] [Green Version]
  43. Weber, J.G.; Key, N. Do wealth gains from land appreciation cause farmers to expand acreage or buy land? Am. J. Agr. Econ. 2014, 96, 1334–1348. [Google Scholar] [CrossRef]
  44. USDA-NASS. Census of Agricultural: Irrigation and Water Management Survey-Volume 3-Special Studies—Part 1; Washington, D.C. USDA, National Agricultural Statistic Service: Washington, DC, USA, 2019.
  45. Yenny, U.P.; Jose, C.; Eva, T.M.; Antonio, M.C. Role of transpiration reduction during center-pivot sprinkler irrigation in application efficiency. J. Irrig. Drain. Eng. 2013, 139, 221–232. [Google Scholar]
  46. Zhao, R.; Qiu, X.L.; Chen, S.Z. Empirical study on the effects of technology training on the forest-related income of rural poverty-stricken households-based on the psm method. Sustainability 2021, 13, 7143. [Google Scholar] [CrossRef]
  47. Chen, X.G.; Wen, H.J.; Zhang, W.R.; Pan, F.C.; Zhao, Y. Advences and progress of agricultural machinery and sensing technology fusion. Smart Agric. 2021, 2, 1–16. [Google Scholar]
  48. Huang, J.K.; Huang, Z.; Jia, X.P.; Hu, R.H.; Xiang, C. Long-term reduction of nitrogen fertilizer use through knowledge training in rice production in China. Agric. Syst. 2015, 135, 105–111. [Google Scholar] [CrossRef]
  49. Singh, G.; Zhao, B. Agricultural mechanization situation in Asia and the pacific region. Ama-Agr. Mech. Asia Af. 2016, 47, 15–25. [Google Scholar]
  50. Chen, H.B.; Lan, Y.B.; Fritz, B.K.; Hoffmann, W.C.; Liu, S.B. Review of agricultural spraying technologies for plant protection using unmanned aerial vehicle (UAV). Int. J. Agr. Biol. Eng. 2021, 14, 38–49. [Google Scholar] [CrossRef]
  51. NDRC (National Development and Reform Commission). National Data; National Development and Reform Commission: Beijing, China, 2020. (In Chinese)
  52. Kanter, D.R.; Bartolini, F.; Kugelberg, S.; Leip, A.; Oenema, O.; Uwizeye, A. Nitrogen pollution policy beyond the farm. Nat. Food 2019, 1, 27–32. [Google Scholar] [CrossRef] [Green Version]
  53. Du, Y.N.; Xu, Y.L.; Zhang, L.Y.; Song, S.F. Can China’s food production capability meet her peak food demand in the future? Int. Food Agribus. Man. 2020, 23, 1–17. [Google Scholar]
  54. Markussen, T.; Tarp, F.; Huy, D.T.; Nguyen, D.A. Inter- and intra-farm land fragmentation in Viet Nam. Wider Work. Pap. 2016, 11, 27. [Google Scholar]
  55. CPG (Central People’s Government of the People’s Republic of China). Opinions on Accelerating the Modernization of Agriculture and Rural Areas by Comprehensively Promoting Rural Revitalization; Central People’s Government of the People’s Republic of China: Beijing, China, 2021. (In Chinese)
  56. World Bank. Agricultural Knowledge and Information Systems (AKIS)—Agricultural Research, Extension and Education; World Bank: Washington, DC, USA, 2012. [Google Scholar]
  57. Munchhausen, S.V.; Haring, A.M. Lifelong learning for farmers: Enhancing competitiveness, knowledge transfer and innovation in the eastern German state of Brandenburg. Stud. Agric. Econ. 2012, 114, 86–92. [Google Scholar] [CrossRef]
  58. Alskaf, K.; Sparkes, D.L.; Mooney, S.J.; Sjogersten, S.; Wilson, P. The uptake of different tillage practices in England. Soil Use Manag. 2020, 36, 27–44. [Google Scholar] [CrossRef]
  59. Zhang, X.; Yang, J.; Thomas, R. Mechanization outsourcing clusters and division of labor in Chinese agriculture. China Econ. Rev. 2017, 43, 184–195. [Google Scholar] [CrossRef]
  60. Bagheri, A.; Bondori, A.; Allahyari, M.S.; Damalas, C.A. Modeling farmers’ intention to use pesticides: An expanded version of the theory of planned behavior. Environ. Manag. 2019, 248, 109291. [Google Scholar] [CrossRef] [PubMed]
  61. Zhang, W.F.; Cao, G.X.; Li, X.L.; Zhang, H.Y.; Wang, C.; Liu, Q.Q.; Chen, X.P.; Cui, Z.L.; Shen, J.B.; Jiang, R.F.; et al. Closing yield gaps in China by empowering smallholder farmers. Nature 2016, 537, 671–674. [Google Scholar] [CrossRef] [PubMed]
  62. Mottaleb, K.A.; Krupnik, T.J.; Erenstein, O. Factors associated with small-scale agricultural machinery adoption in Bangladesh: Census findings. J. Rural Stud. 2016, 46, 155–168. [Google Scholar] [CrossRef] [Green Version]
  63. Baudron, F.; Sims, B.; Justice, S.; Kahan, D.G.; Rose, R.; Mkomwa, S.; Kaumbutho, P.; Sariah, J.; Nazare, R.; Moges, G.; et al. Re-examining appropriate mechanization in Eastern and Southern Africa: Two-wheel tractors, conservation agriculture, and private sector involvement. Food Secur. 2015, 7, 889–904. [Google Scholar] [CrossRef]
  64. Vanzetti, D.; Quiggin, J. A comparative-analysis of agricultural tractor investment models. Aust. J. Agr. Resour. Ec. 1985, 29, 122–141. [Google Scholar] [CrossRef] [Green Version]
  65. Pan, B.; Tian, Z.H. A research review on agricultural machinery purchase subsidy policy. J. China Agric. Univ. 2018, 23, 161–173. (In Chinese) [Google Scholar]
  66. Li, W.; Wei, X.P.; Zhu, R.X.; Guo, K.Q. Study on factors affecting the agricultural mechanization level in China based on structural equation modeling. Sustainability 2019, 11, 51. [Google Scholar] [CrossRef] [Green Version]
  67. Yagi, H.; Hayashi, T. Machinery utilization and management organization in Japanese rice farms: Comparison of single-family, multifamily, and community farms. Agribusiness 2021, 37, 393–408. [Google Scholar] [CrossRef]
  68. Huang, J.K.; Yang, G.L. Understanding recent challenges and new food policy in China. Glob. Food Secur. Agr. 2017, 12, 119–126. [Google Scholar] [CrossRef]
Figure 1. Attitudes toward machinery use among farmers in (a) Northeast China Plain (NEP) and (b) North China Plain (NCP). Data are mean ± standard deviation; error lines indicate standard deviation. Different colors indicate different attitude categories. * indicates mean strength score <3, indicating not significant.
Agriculture 12 00287 g001
Figure 2. The influence of eight social referents on machinery use among cooperative directors, farmers without machines, and machine operators: (a) NEP (N = 454) and (b) NCP (N = 569). Same as below. Lowercase letters indicate significant differences in referent scores among the three types of farmers, p < 0.05.
Agriculture 12 00287 g002
Figure 3. The influence of eight social referents on machinery use among farmers in NEP and NCP: (a) cooperative directors (N = 308), (b) farmers without machines (N = 577), and (c) machine operators (N = 138). * indicates p < 0.5, ** indicates p < 0.1.
Agriculture 12 00287 g003
Figure 4. Barriers to machinery use perceived among farmers in NEP and NCP.
Agriculture 12 00287 g004
Figure 5. Barriers to machinery use perceived by cooperative directors, farmers without machines, and machine operators in (a) NEP (N = 454) and (b) NCP (N = 569).
Agriculture 12 00287 g005
Figure 6. Farmers’ intention to use machinery among cooperative directors, farmers without machines, and machine operators during the next three years. Different colors indicate the relative proportion of farmers’ intention in %. (a) NEP (N = 454) and (b) NCP (N = 569).
Agriculture 12 00287 g006
Figure 7. Correlation between farmers’ intention to use machinery and the characteristics of cooperative directors, farmers without machines, and machine operators. Numbers indicate Spearman’s rho. * means p < 0.05. ** means p < 0.01. Larger ball size indicates higher correlation. Different colors indicate the relative direction (red for negative and green for positive). (a) NEP (N = 454) and (b) NCP (N = 569).
Agriculture 12 00287 g007
Table 1. Mean characteristics of surveyed cooperative directors, farmers without machines, and machine operators.
CharacteristicsCooperative DirectorsFarmers without MachinesMachine Operators
NCPNEPNCPNEPNCPNEP
Number of farmers surveyed15715137819934104
Mean managed farmland size (ha)6.1030.110.443.391.575.04
Average age53.1949.5656.1453.1750.5046.38
Average laborers per family1.781.891.881.971.822.00
Years of education9.119.208.488.678.828.70
Publisher’s Note: MDPI stays neutral with regard to jurisdictional claims in published maps and institutional affiliations.

