Article

Is the Two-Line Hybrid Rice a Hindrance to the Efficient Use of Nitrogen Fertilizer in China?

1
Crop Ecophysiology and Cultivation Key Laboratory of Sichuan Province, Rice Research Institute, Sichuan Agricultural University, Chengdu 611130, China
2
College of Agronomy, Sichuan Agricultural University, Chengdu 611130, China
3
Agricultural College, Xichang University, Xichang 615000, China
*
Author to whom correspondence should be addressed.
Agriculture 2022, 12(2), 250; https://doi.org/10.3390/agriculture12020250
Submission received: 6 January 2022 / Revised: 5 February 2022 / Accepted: 6 February 2022 / Published: 9 February 2022

Abstract

:
Two-line hybrid rice (2LH) is accompanied by more nitrogen (N) input. To explore the difference in response of two-line and three-line hybrid rice (3LH) to N application, a three-year split-plot experiment was conducted. Three 2LHs and three 3LHs were set as main plots, and four N rates including 0 kg ha−1 (N0), 90 kg ha−1 (N90), 150 kg ha−1 (N150), and 210 kg ha−1 (N210) were set as subplots. 3LH had more panicles and yielded 7.95%, 6.31%, and 5.48% higher than 2LH in N0, N90, and N150, respectively. 2LH had a greater panicle weight in N210 and yielded 1.45% higher than 3LH. Leaf area index (LAI) had the greatest effect on the yields of both 2LH and 3LH, while the contribution of light extinction coefficient (K) was 46.35% and 12.80% those of LAI, respectively. The LAI, K, and radiation interception rate (RIR) of 2LH were smaller than those of 3LH in N0 and N90. The K of 2LH increased significantly as the N rate increased from 150 kg ha−1 to 210 kg ha−1, while that of 3LH showed no significant change, making the maximum RIR of 2LH greater than that of 3LH. 2LH, which intercepted more radiation through greater leaf extension to achieve higher yields, was able to use nitrogen fertilizer efficiently under a high N rate in China.

1. Introduction

As nitrogen (N) is the main factor affecting rice yield, optimizing N management is important to achieve a continuous rice yield increase in China. However, N fertilizer application increased contentiously along with the breakthroughs of rice production, resulting in a production efficiency decline and nonpoint source N pollution intensification, significant obstacles of China’s rice production. Fertilizer reduction has already become a major task in rice production both from a research perspective and at the policy level [1,2,3]. Fertilizer reduction must be based on the actual conditions. Many studies have focused on the genotypic differences in N uptake and utilization among rice varieties, including different growth periods, different sink sizes, and different panicle weights [4,5,6]. Although those studies have provided references for N fertilizer reduction in rice production, the N use efficiency cannot serve directly as the basis for N fertilizer reduction. The increase in N rate notably reduced the agronomic efficiency of N fertilizer (AEN); however, it greatly improved the rice yield, i.e., the AEN in rice has dropped by more than 40% since the 1980s in China due to the increased N application; its yield growth is more impressive. Without N rate as a premise, it is difficult to directly use AEN as the basis for N fertilizer reduction. N tolerability is a concept highly relevant to actual production, which was once an important research topic in the field of rice breeding and cultivation [7,8,9]. As the definition of N tolerability has been relatively vague, it has gradually been marginalized in scientific research and used more in actual production. Based on previous studies and its meaning in production, we define N tolerability as the increase in yield as the amount of N applied increases, that is, the agronomic efficiency of additional N fertilizer (AEAN). Rice varieties with a high N tolerability could gain a high AEN under a large N rate; thus, their N fertilizer reduction potential is low; varieties with a low N tolerability could only obtain a significant AEN under a small N rate; thus, their N fertilizer reduction potential is high. Therefore, N tolerability is potentially a key indicator for N fertilizer reduction. The production of three-line (3LH) hybrid rice seed requires a male-sterile line, maintainer lines, and restorer line. Sterile lines have to cross with maintainer lines to produce seeds as their sterility is determined by the cytoplasm and the nucleus, and sterile lines cross with restorer lines to produce hybrid rice seeds for field production. The production of two-line (2LH) hybrid rice requires only a sterile line and restorer line. The fertility of sterile lines is not determined by the cytoplasm but regulated by the recessive sterility genes in the nucleus and the day length and temperature of the growing environment. Sterile lines transition from male sterility to male fertility with changes in day length and temperature. Seeds could be produced according to the fertility transition of photo-thermo-sensitive genic male-sterile lines. The sterile lines of 3LH must be planted with maintainer lines at a certain row ratio to become pollinated and produce seeds of the sterile line. The heterosis and breeding mechanism of 2LH is the same as those of 3LH, i.e., producing the hybrid generation seeds from two parents with different genetic composition and utilizing heterosis. As a typical low-sunshine and high-humidity rice region, hybrid rice breeding and large-scale rice production in Southwest China rely greatly on 3LH featuring low N rate and low yield potential [10,11,12]. In recent years, the planting scale of 2LH has expanded rapidly, which has produced more grains under a higher N rate compared with 3LH. Field observations and interviews have shown that, compared with 3LH, 2LH has shorter, narrower, and more upright leaves, making it less prone to lodging, diseases, and insect pests when densely planted in Southwest China. The high-N-tolerability feature makes 2LH popular with farmers who want to increase grain yield with simple ways, but it also poses a significant problem. Due to the scarcity of public reports on the N tolerability difference between 2LH and 3LH, increasingly higher N rates are being applied to 2LH, resulting in a much slower increase in AEN of rice production in Southwest China than those of the other regions, which not only reduces the economic benefits of rice production, but also contradicts the fertilizer reduction policy of China. In this study, the differences in N adaptability between 3LH and 2LH were investigated by setting different N rates, and the key morphological indicators causing the N adaptability differences were identified. This study could provide valuable theoretical support and technical guidance for the targeted N management practices of 2LH and 3LH.

2. Materials and Methods

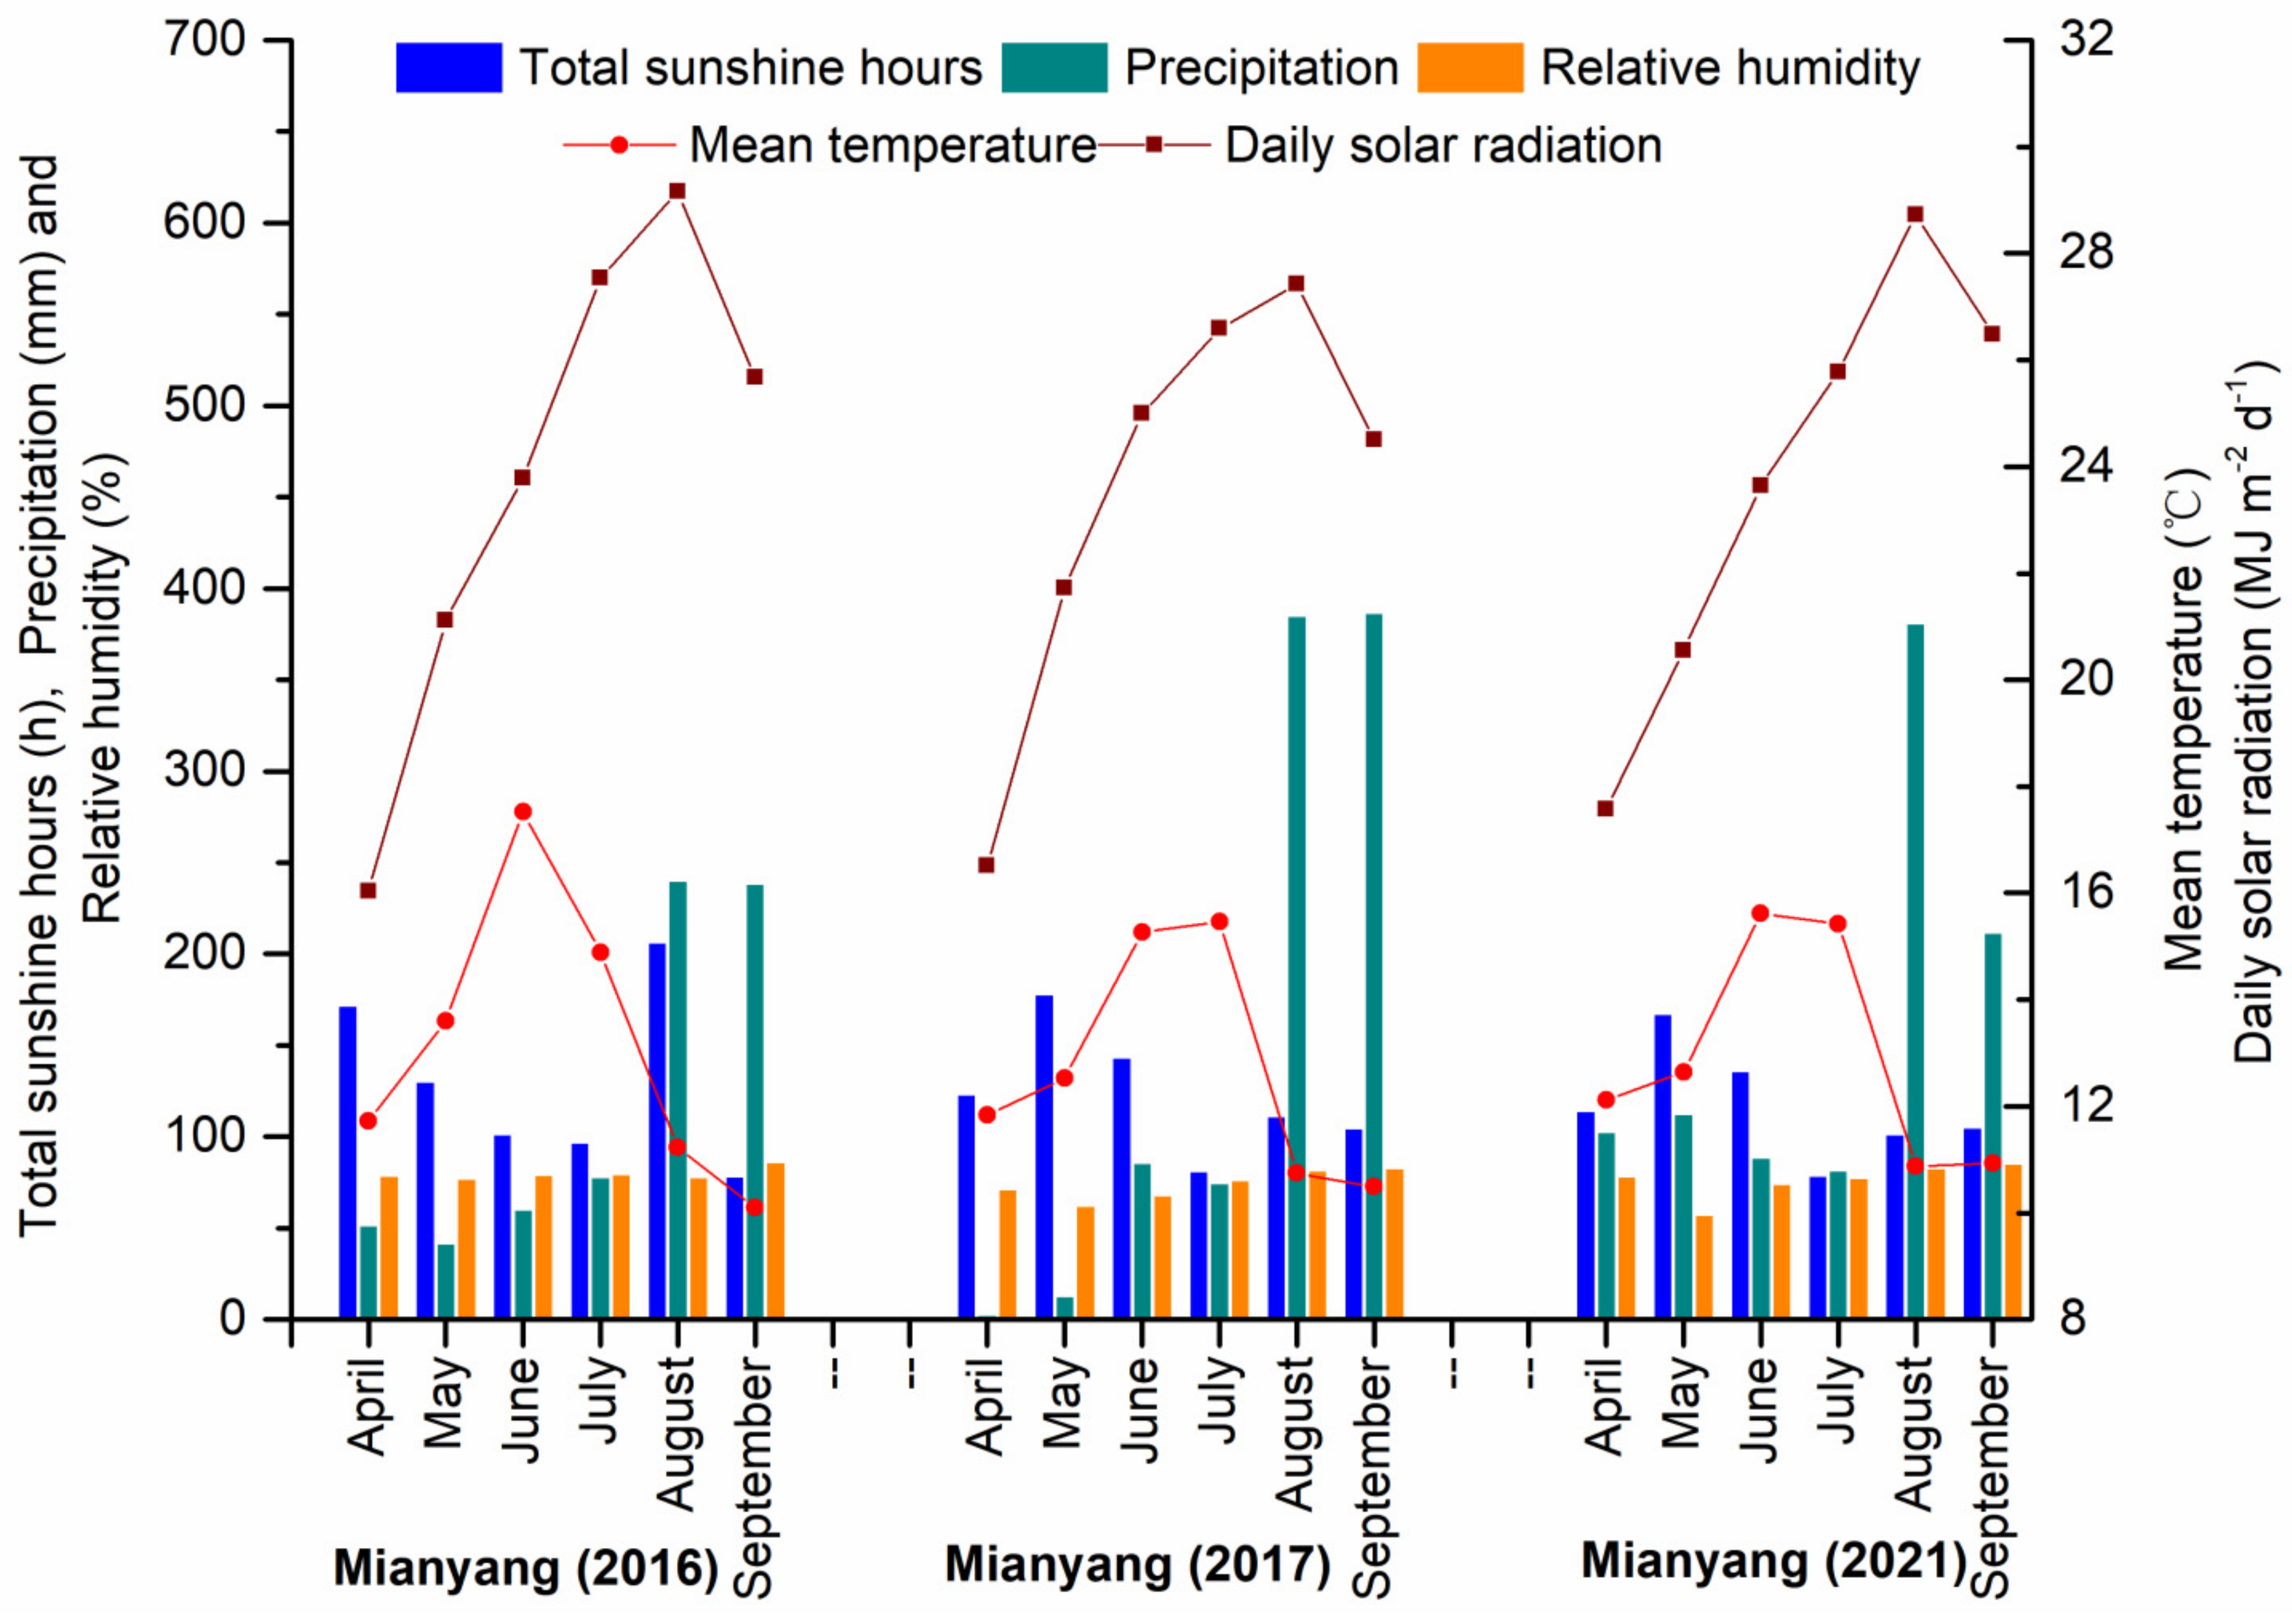
2.1. Experimental Sites

This study was conducted in 2016, 2017, and 2021 at the experimental farm of Southwest University of Science and Technology, Fucheng District, Mianyang, Sichuan Province (31°32′ N, 104°41′ E). The geography of Mianyang represents the typical hill characteristics of Southwest China. Climatic conditions during the experiments are shown in Figure 1.
The soil types of the trial fields were sandy clay loam in Mianyang. All soil measurements were taken prior to the start of any experiments. The organic matter content was determined by the Schollenberger method and the total nitrogen content was determined by the Kjeldah method. Additionally, soil phosphorus content was quantified using the Olsen-P test and continuous-flow analysis was used to evaluate both the NH4OAc-extractable potassium and the mineralized nitrogen content. Based on the content analyses of nitrogen, phosphorous, potassium, and organic matter, the soil fertility difference of the three experiments was small (Table 1).
Mianyang belongs to the Sichuan basin rice region, and paddy-upland rotation is the most common mode of production. The 2016 experiment was previously planted with wheat. The rice seeds were sown on 25 April , transplanted on 22 May, and harvested on 25 September. The 2017 experiment was previously planted with rapeseed. The rice seeds were sown on 21 April, transplanted on 20 May, and harvested on 23 September. The 2021 experiment was previously planted with wheat. The rice seeds were sown on 23 April, transplanted on 23 May, and harvested on 26 September. The topsoil nutrient contents of the experimental plots are shown in Table 1.

2.2. Experimental Materials

In this study, the 2LH and 3LH varieties widely planted in Southwest China were used as experimental materials. Among the six varieties, Yliangyou 1 (Y1, 2LH) and Fyou 498 (F498, 3LH) are high-yielding varieties, with no significant differences for grain yield and AEN. Longliangyou 1206 (L1206, 2LH) and Yixiangyou 2115 (Y2115, 3LH) are yield-quality-balanced varieties with a significantly lower grain yield and AEN than the high-yielding varieties. Jingliangyou 1377 (J1377, 2LH) and Chuanyou 8377 (C8377, 3LH) are high-quality rice varieties with the smallest grain yield and AEN. The length, width, opening angle, basal angle, and drooping degree of the top three leaves from 2LH were significantly smaller than those of 3LH. Thus, under field production conditions, the leaves of 2LH are short and upright, while the leaves of 3LH are broad and pendulous. Regional field interviews showed that 298 out of 373 farmers who had grown both 2LH and 3LH in the past five years considered compactness and upright leaves as the primary morphological characteristic that distinguished 2LH from 3LH. Grain yields and some morphological indicators of the six varieties are shown in Table 2, and the data were from the variety screening test (preparatory test) conducted earlier.

2.3. Experimental Design

The treatments of the three experiments were identical and adopted the two-factor split plot design. Six varieties, including J1377, L1206, Y1, C8377, Y2115, and F498, were set as the main plots, and the subplots were for the four N rates: 0 kg ha−1 (N0), 90 kg ha−1 (N90), 150 kg ha−1 (N150), and 210 kg ha−1 (N210). The experiments were replicated three times with a total of 24 treatments. The area of each subplot was 4.5 m × 5.0 m = 22.5 m2. The transplanting density in all three experiments was 33.3 cm × 16.7 cm. N fertilizer was applied 1 d before transplanting, 7 d after transplanting, at the fourth-to-last leaf stage, and at the penultimate leaf stage. The proportions of basal fertilizer, tillering fertilizer, spikelet-promoting fertilizer, and spikelet-preserving fertilizer were 0.3, 0.3, 0.2, and 0.2, respectively. In addition to N fertilizer, the base fertilizer also included 75 kg ha−1 P2O5 and 75 kg ha−1 K2O, and 75 kg ha−1 K2O was applied as spikelet-promoting fertilizer. The N, phosphorus, and potassium fertilizers used in the experiments were urea (46% N), calcium superphosphate (12% P2O5), and potassium chloride (60% K2O), respectively. Transplanting was performed in shallow water (approx. 1 cm). A 2 cm water layer was maintained in the fields 5–7 d after transplanting to ensure that the seedling turned green and survival. After that, the surface water layer was drained and a soil moisture of 70–80% of saturated water content was maintained before the booting stage. The fields were dried during the ineffective tillering stage. A 1–3 cm water layer was maintained above the soil surface during the booting stage, and alternate wetting and drying irrigation from heading to maturity was performed (irrigated to 1–3 cm and dried naturally to the water potential of −25 kPa at a soil depth of 20 cm). Weeds, insects, and disease were controlled as follows to avoid grain yield loss with the unmanned aerial vehicle (MG-1, DJI, China). Before sowing, imidacloprid and prochloraz were used to dress seeds to prevent bakanae and rice planthoppers. About 3 days after transplanting, pretilachlor was sprinkled to control weeds; 2 weeks after transplanting and at the booting stage, chlorpyrifos and Bot were sprinkled to control borers and sheath blight, and Bot was sprayed to control rice smut at the heading stage.

2.4. Measurement Items and Methods

2.4.1. Earbearing Tiller Percentage and Effective Panicle Rate at Heading Stage

Excluding border rows, fifteen rice plants in each subplot were tagged randomly for observation in order to calculate the average tiller number. All observations were then made at the jointing and heading stages, respectively. The number of tillers at the jointing stage was considered as the peak tiller number. The earbearing tiller percentage is defined as the number of panicles divided by the peak tiller number, and the effective panicle rate at the heading stage is calculated as the number of panicles divided by the number of tillers at the heading stage [13,14].

2.4.2. Growth Rate from the Jointing to Heading Stage

Three representative plants were selected from each subplot according to the average tiller number at the jointing stage and heading stage. The shoots of the selected plants were desiccated at 105 °C and oven-dried at 80 °C before measuring out to a constant weight. Growth rate is defined as the dry weight difference between the heading stage and the jointing stage divided by the number of days between the two stages [14].

2.4.3. Leaf Area Index (LAI) and Light Extinction Coefficient (K)

Excluding border rows, six representative plants were sampled and separated into green leaf blades, stems (culms plus sheaths), and panicles at the heading stage. Leaf area was determined using a leaf area meter (LI-3100, LI-COR, Lincoln, USA). LAI was calculated as the ratio of the leaf area to the land area. Photosynthetically active radiation (PAR, 400–700 nm) was measured using a linear quantum sensor (LI-191SA, LI-COR, Lincoln, USA) at the heading stage. Measurements were taken between 1130 h and 1300 h in each subplot of all experiments. The 1 m-long sensor was placed 50 cm above the canopy to measure all incoming PAR. Transmitted PAR (TPAR) was measured at the surface of the soil (1 cm) under the canopy [14].
Radiation interception rate (RIR) = 100%−TRAP / PAR
K = ﹣ln (TRAP / PAR) / LAI

2.4.4. AEN and AEAN

Excluding border rows, three plants with average panicle number were collected at the maturity stage. The aboveground portion was desiccated at 105 °C and oven-dried at 80 °C before measuring out to a constant weight; then, the dry matter was crushed and sieved [13]. The total N content was measured using a Kjeldahl analyzer (Kjeltec-8400, FOSS, Hillerød, Denmark).
AEN of N90 = (Yield of N90−Yield of N0) / 90 × 100%
AEN of N150 = (Yield of N150−Yield of N0) / 150 × 100%
AEN of N210 = (Yield of N210−Yield of N0) / 210 × 100%
AEAN of N(0–90) = AEN of N90
AEAN of N(90–150) = Yield of N150−Yield of N90) / 60 × 100%
AEAN of N(150–210) = Yield of N210−Yield of N150) / 60 × 100%

2.4.5. Yield and Yield Components

Excluding border rows, five plants with average panicle number were sampled at maturity to determine yield components. Panicles were hand-threshed, and unfilled spikelets were separated from filled spikelets by winnowing (HMC-67, Hoffman, Astoria, USA). Grain yield was determined from all remaining plants for each subplot, excluding those in border rows. Grain was dried in a hot air jet dryer and its moisture content was then determined using a cereal moisture tester (PM-8188, Kett; Tokyo, Japan). The grain yield of rough rice was reported at the moisture content of 0.135 g H2O g−1 fresh weight.

2.5. Data Processing

Statistical analysis was performed using Microsoft Excel 2016 (Microsoft Corp., Redmond, WA, USA) and IBM SPSS Statistics V20.0 (IBM Corp., Armonk, USA). The three experiments were first pooled and analyzed for the variance, revealing a significant year effect only on panicle number and panicle weight, and no significant interaction effects between year and other factors. Therefore, the AEN, LAI, and K analysis accounted for no year differences, and grain yield-related analysis was performed separately among years. The variety and nitrogen means were compared using a least significant difference test at the 0.05 probability level. Data plotting was performed using Origin Pro 9.0.0 SR2 (OriginLab Corp., Northampton, MA, USA).

3. Results and Analysis

3.1. Effect of N Application on Yield and Yield Components

As shown in Table 3, the yield, panicle number, panicle weight, LAI, and light extinction coefficient (K) at the heading stage were significantly affected by variety type, N application, and their interactive effect. Although panicle number and panicle weight varied significantly among years, the key indicators, such as grain yield, AEN, LAI, and K value at heading stage, showed no significant differences among years. In addition, variety type, N application, and variety type × N application did not significantly interact with year.
According to the results of the three-year replicated experiments shown in Table 4, the yield, panicle number, and panicle weight differed significantly between 2LH and 3LH, and the effect of N application was also significant. In the meantime, there was a significant interactive effect between variety type and N application. The yield of 3LH was 6.01%, 1.70%, and 4.38% higher than those of 2LH in 2016, 2017, and 2021, respectively. Under the four N rates, the panicle number of 3LH was higher than that of 2LH but the panicle weight of 3LH was lower, which was true across the three years. The advantage of 3LH in panicle number was greatest when the N rate was 150 kg ha−1, 18.56% higher than that of 2LH on average. The advantage narrowed to 12.75% when the N rate increased to 210 kg ha−1. In contrast, the advantage of 2LH over 3LH in panicle weight increased with the N rate. The panicle weight of 2LH was 12.35% and 14.38% higher than those of 3LH at 150 kg ha−1 and 210 kg ha−1, respectively. Therefore, the advantage of 3LH in yield was dominant at N rates no higher than 150 kg ha−1, and 7.95% (0 kg ha−1), 6.31% (90 kg ha−1), and 5.48% (150 kg ha−1) higher than those of 2LH, respectively. At the N rate of 210 kg ha−1, the 2LH had an advantage in yield, 1.45% higher than that of 3LH. With the increase in N rate, the yield growth rate of 2LH and 3LH was different. The yield increase in 3LH was lower than that in 2LH as the N rate increased from 150 kg ha−1 to 210 kg ha−1. The yield increase of 3LH was not significant in 2016, and the average yield increase was only 3.33% across the three years. In contrast, the yield increase of 2LH was significant, averaging 10.58%.

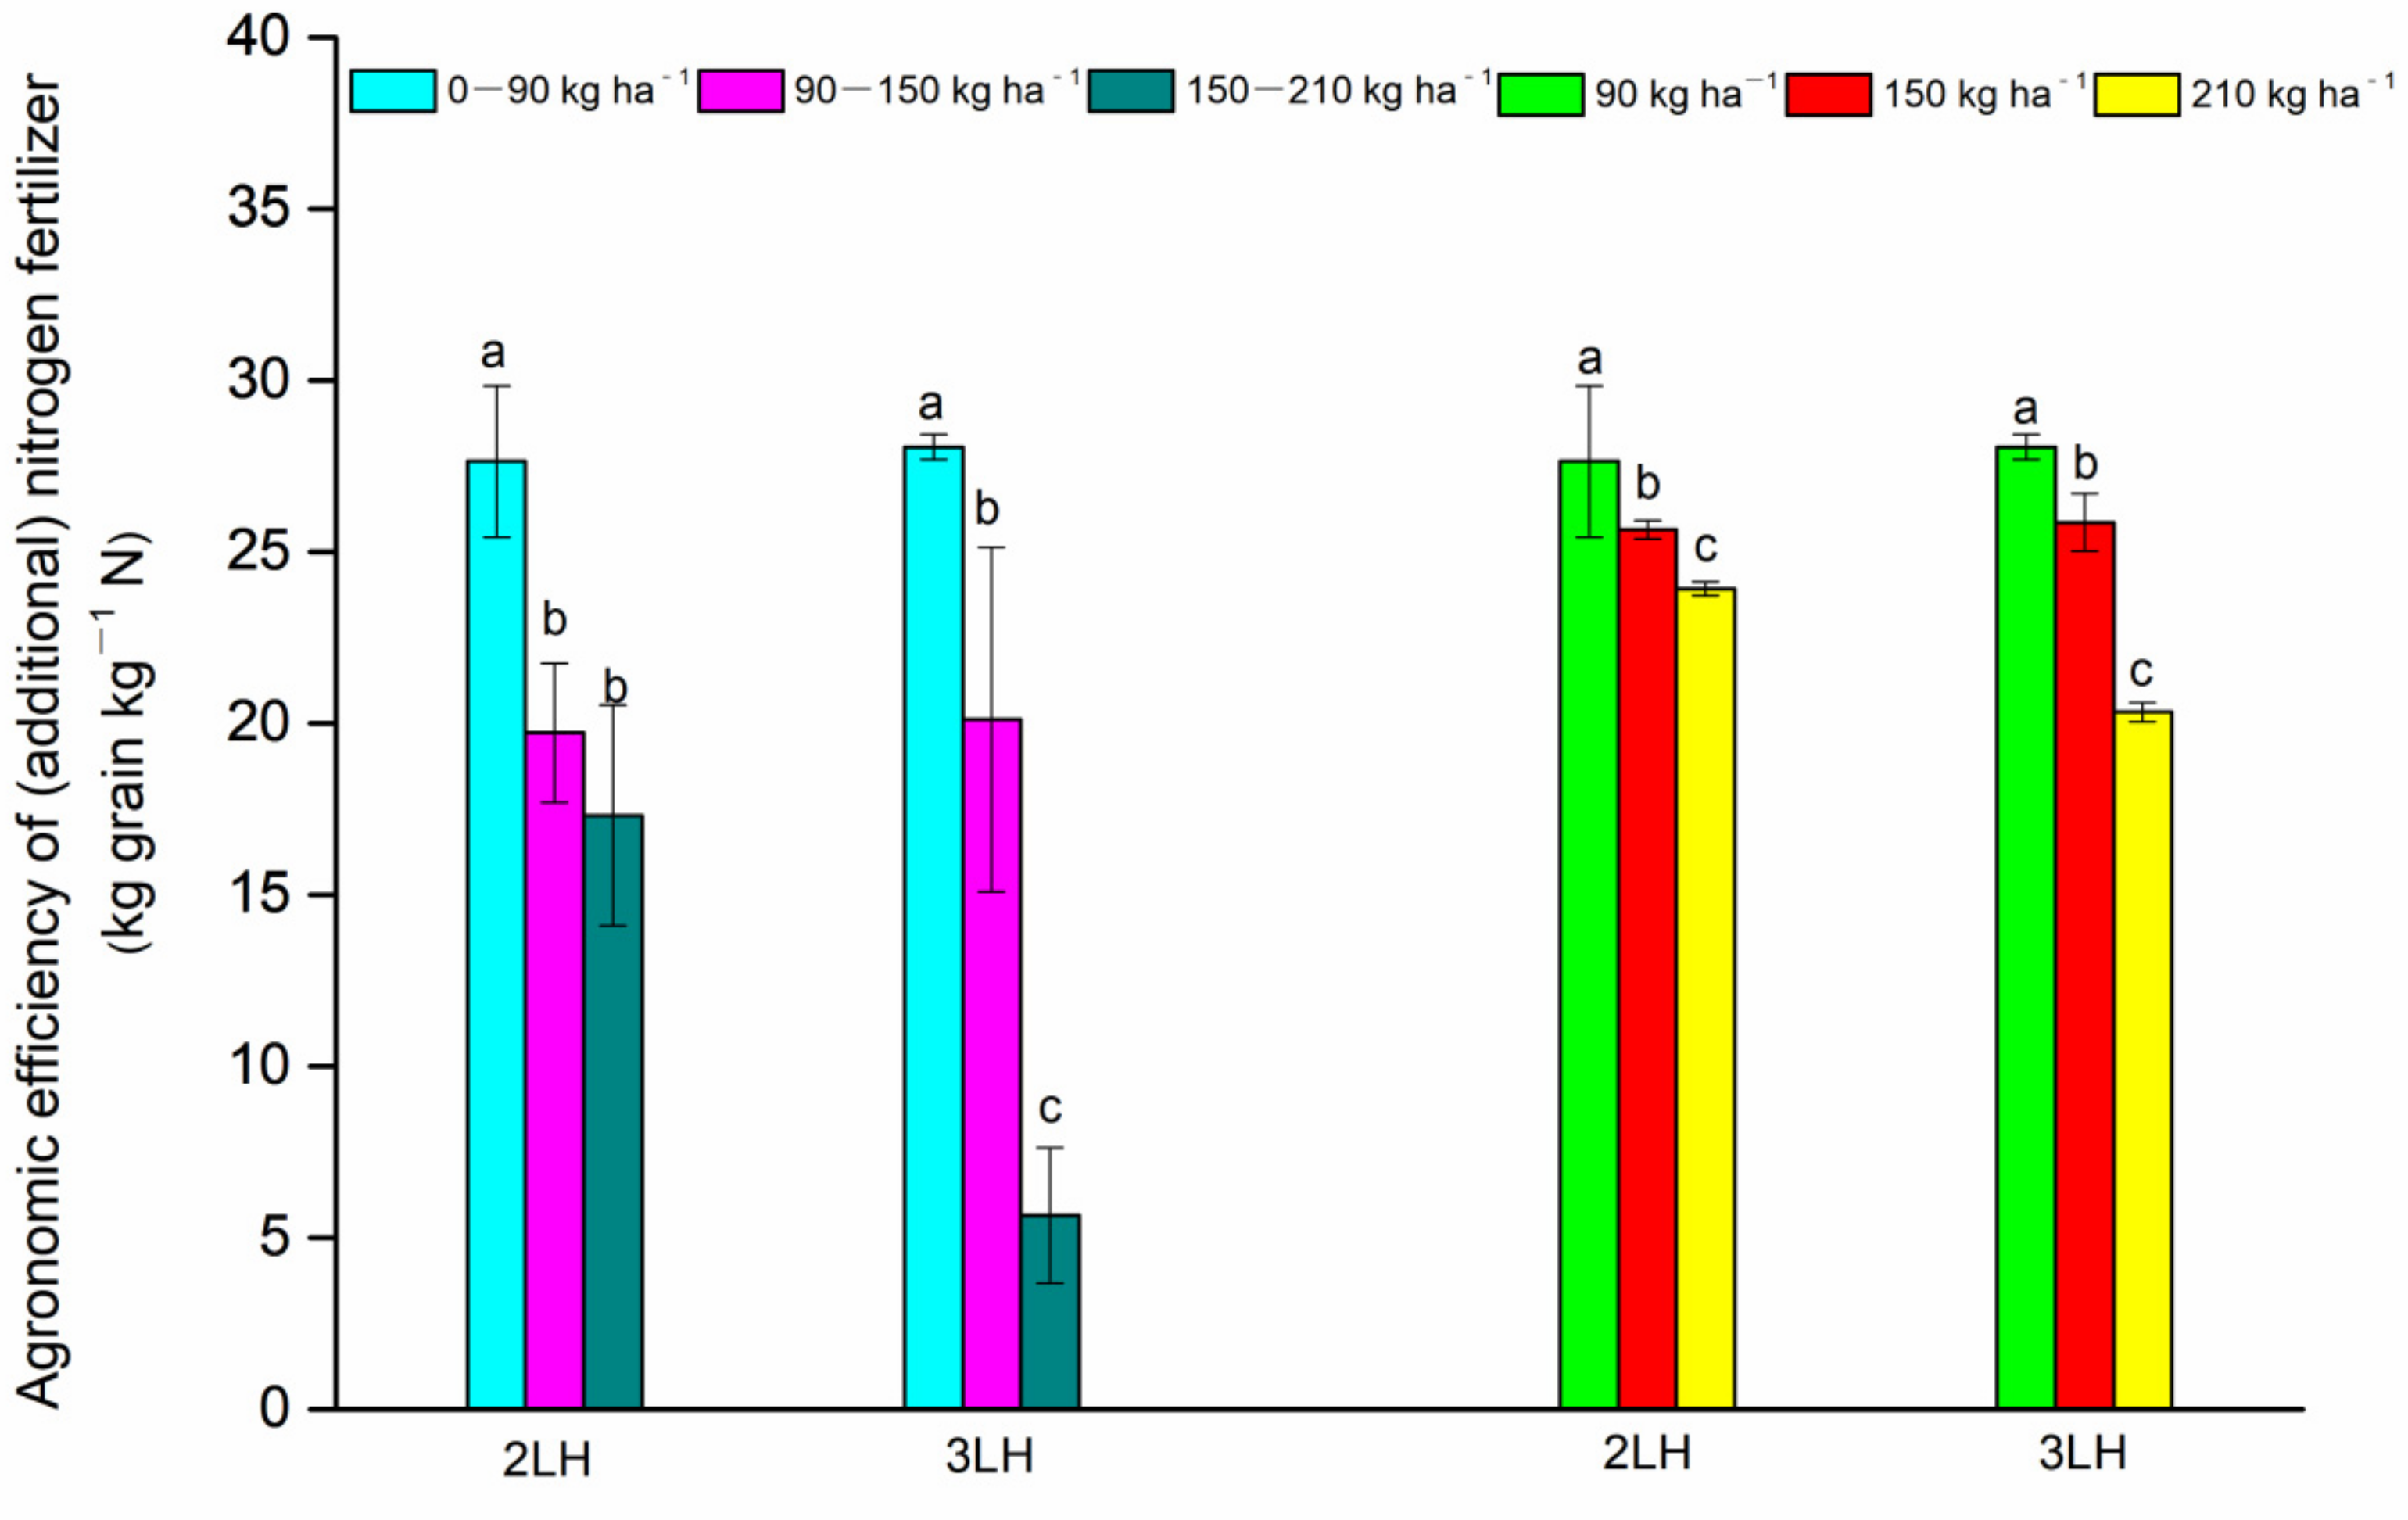
3.2. Effect of N Rate on AEN and AEAN

As the AEN showed no significant difference among years (Table 3), figures were plotted based on the means of the data from 2017, 2018, and 2021. Figure 2 shows the changes in agronomic efficiency of additional N fertilizer (AEAN) and AEN in the two variety types under different N rates. The 2LH and 3LH showed significantly decreasing AEN as the N rate increased from N90 to N210. The AEN of 3LH in N210 decreased by 21.38% compared to that in N150, while the decrease in that of 2LH was only 6.74%. The AEAN in 2LH and 3LH differed less in the N rate range of 0–90 kg ha−1 and 90–150 kg ha−1. With the further increase in N rate, the AEAN of 3LH decreased significantly by 71.87%, while the decrease in that of 2LH was only 12.23%, which was not significant. The difference between the two variety types in the AEAN was more prominent compared to the AEN.

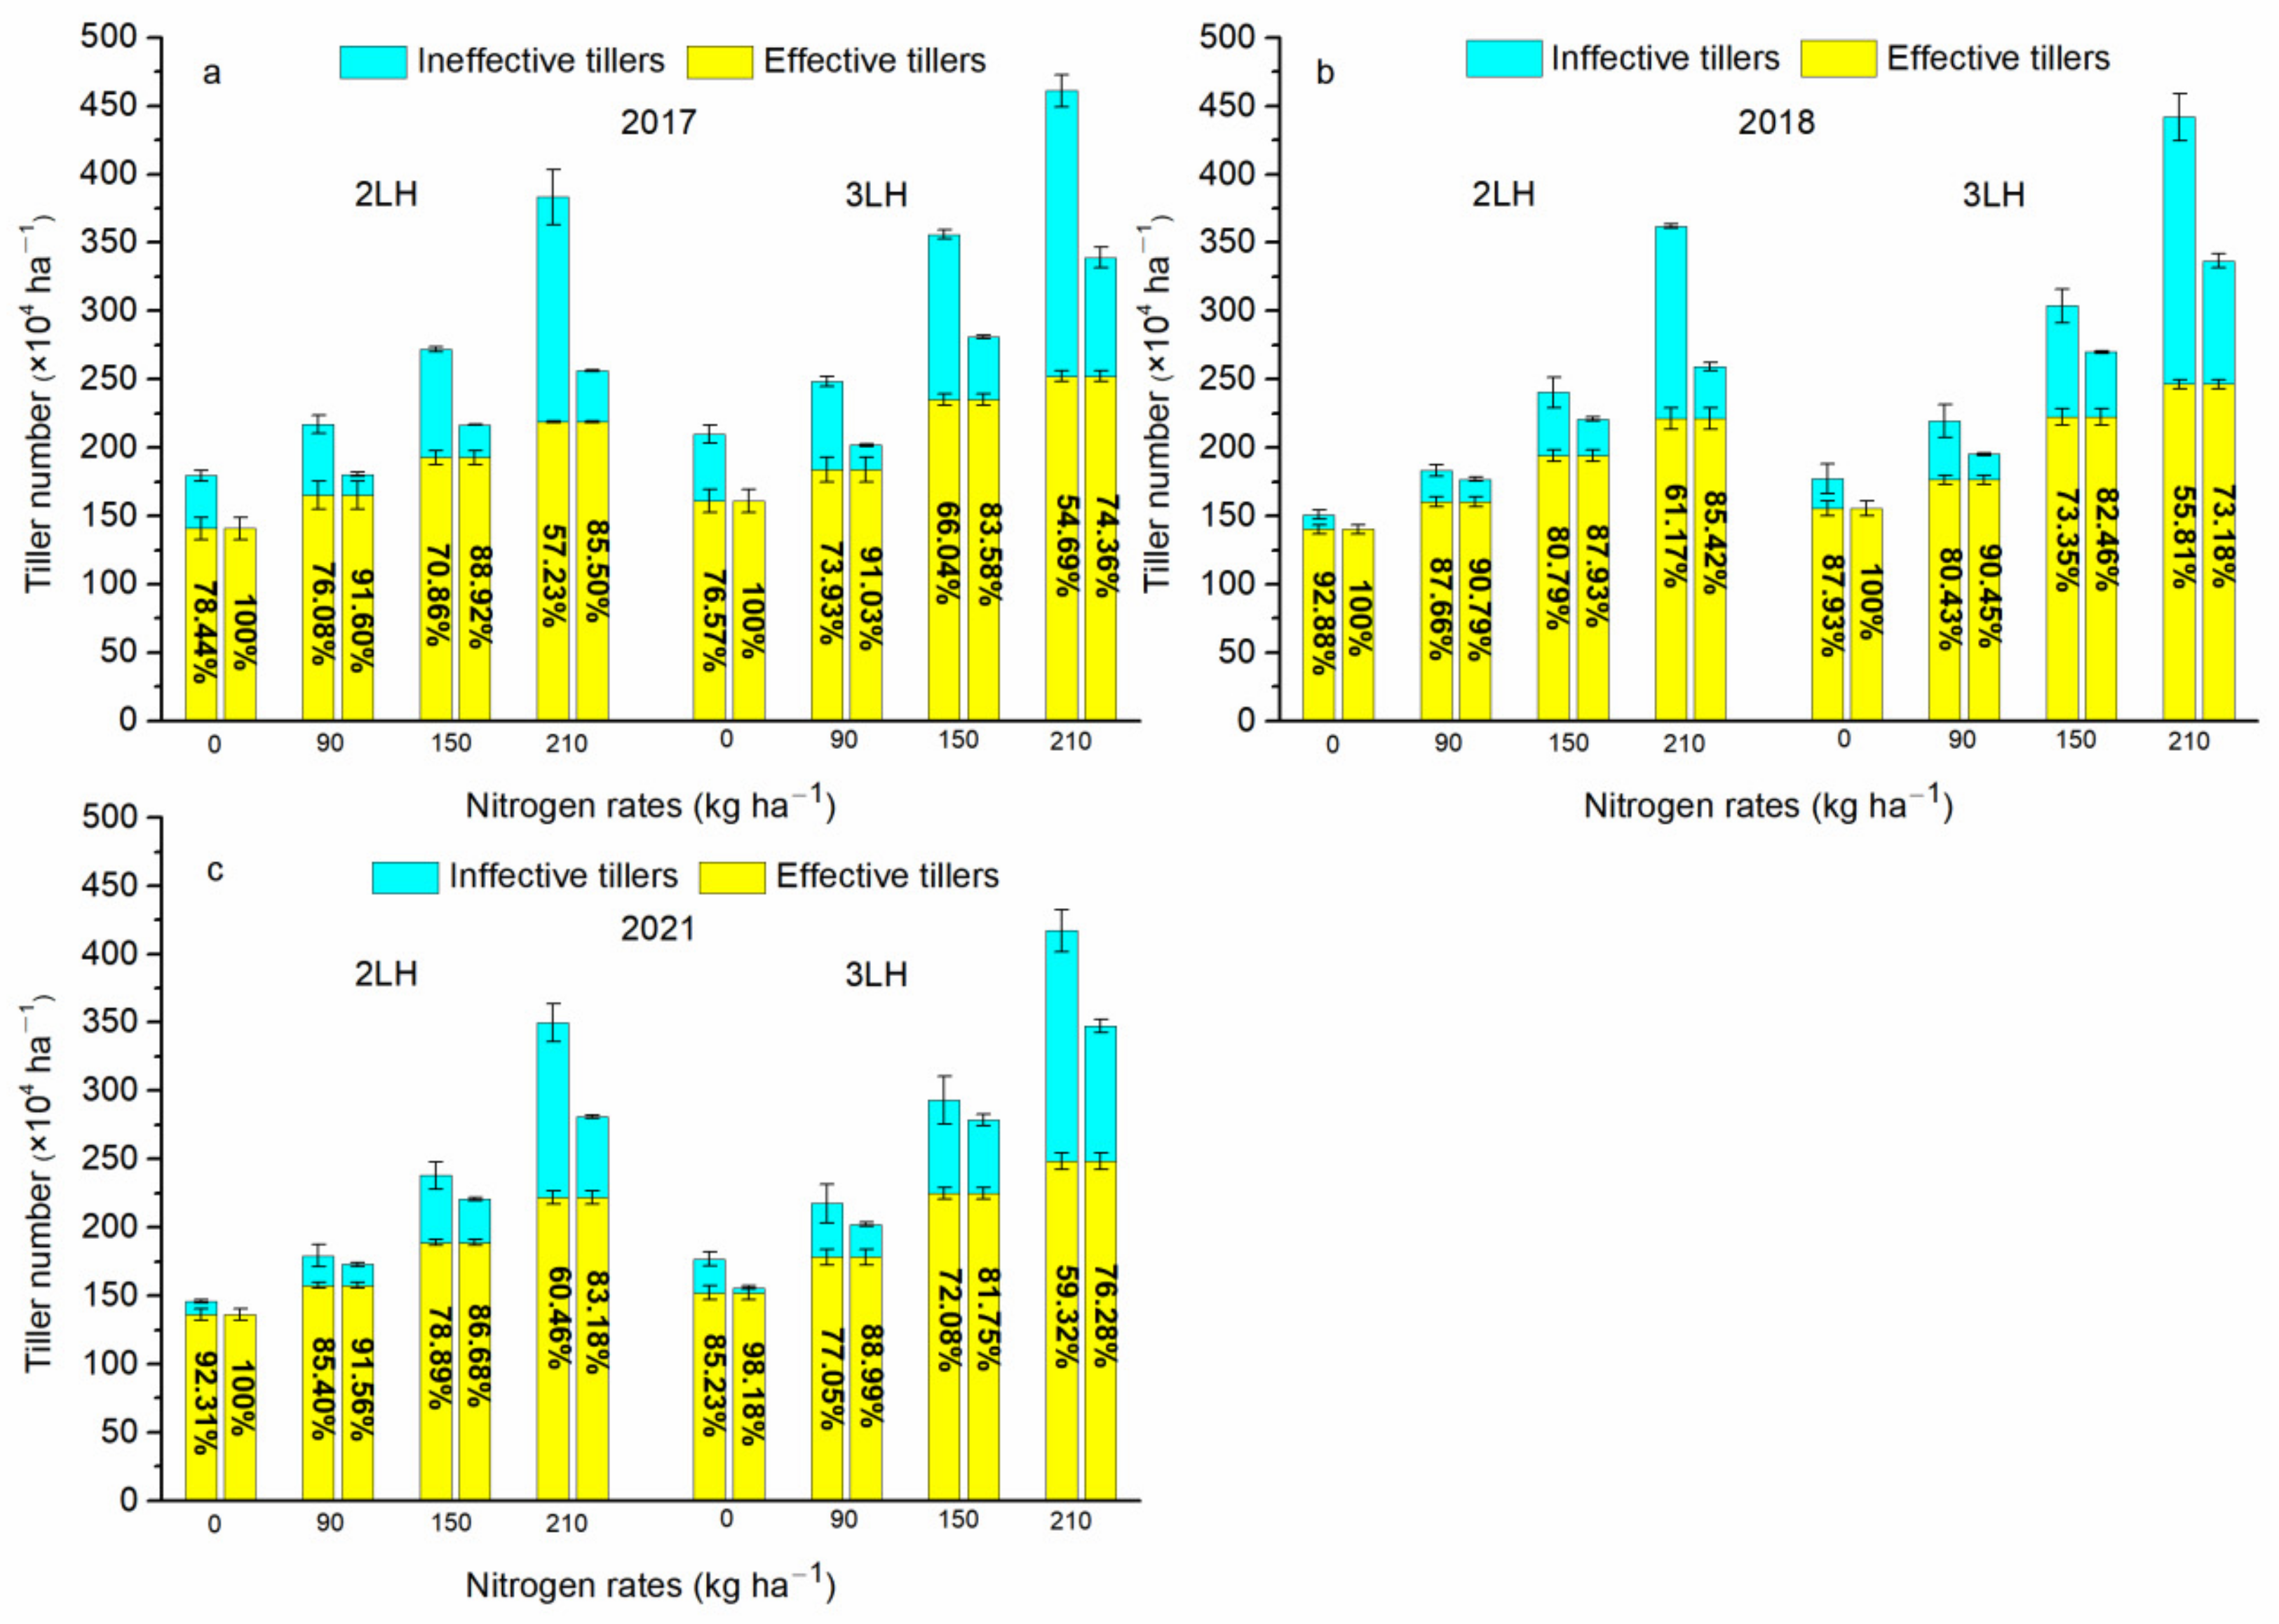
3.3. Effect of N Rate on Tiller and Panicle Development

The tiller and panicle development of the two variety types under different N rates is shown in Figure 3. Under all N rates, the tiller number of the 2LH population was lower than that of the 3LH population, but the earbearing tiller percentage was higher in 2LH. Under low-N conditions (N0 and N90), the three-year average earbearing tiller percentage of 2LH was 6.02% higher than that of 3LH, whereas under medium- and high-N conditions (N150 and N210), the advantage of 2LH in earbearing tiller percentage increased slightly to 7.01%. Unlike the earbearing tiller percentage, the advantage of 2LH in effective panicle rate at the heading stage gradually increased with higher N rate. Under low-N conditions, the three-year average effective panicle rate at the heading stage of 2LH was 1.02% higher than that of 3LH, whereas under medium- and high-N conditions, the advantage of 2LH in effective panicle proportion increased to 10.27%. Therefore, under high-N fertilizer conditions, the ineffective tillers died slower in 3LH from the jointing stage to the heading stage and competed with the effective tillers for nutrients and space, which was not conducive to the differentiation of the effective tillers to form large panicles.

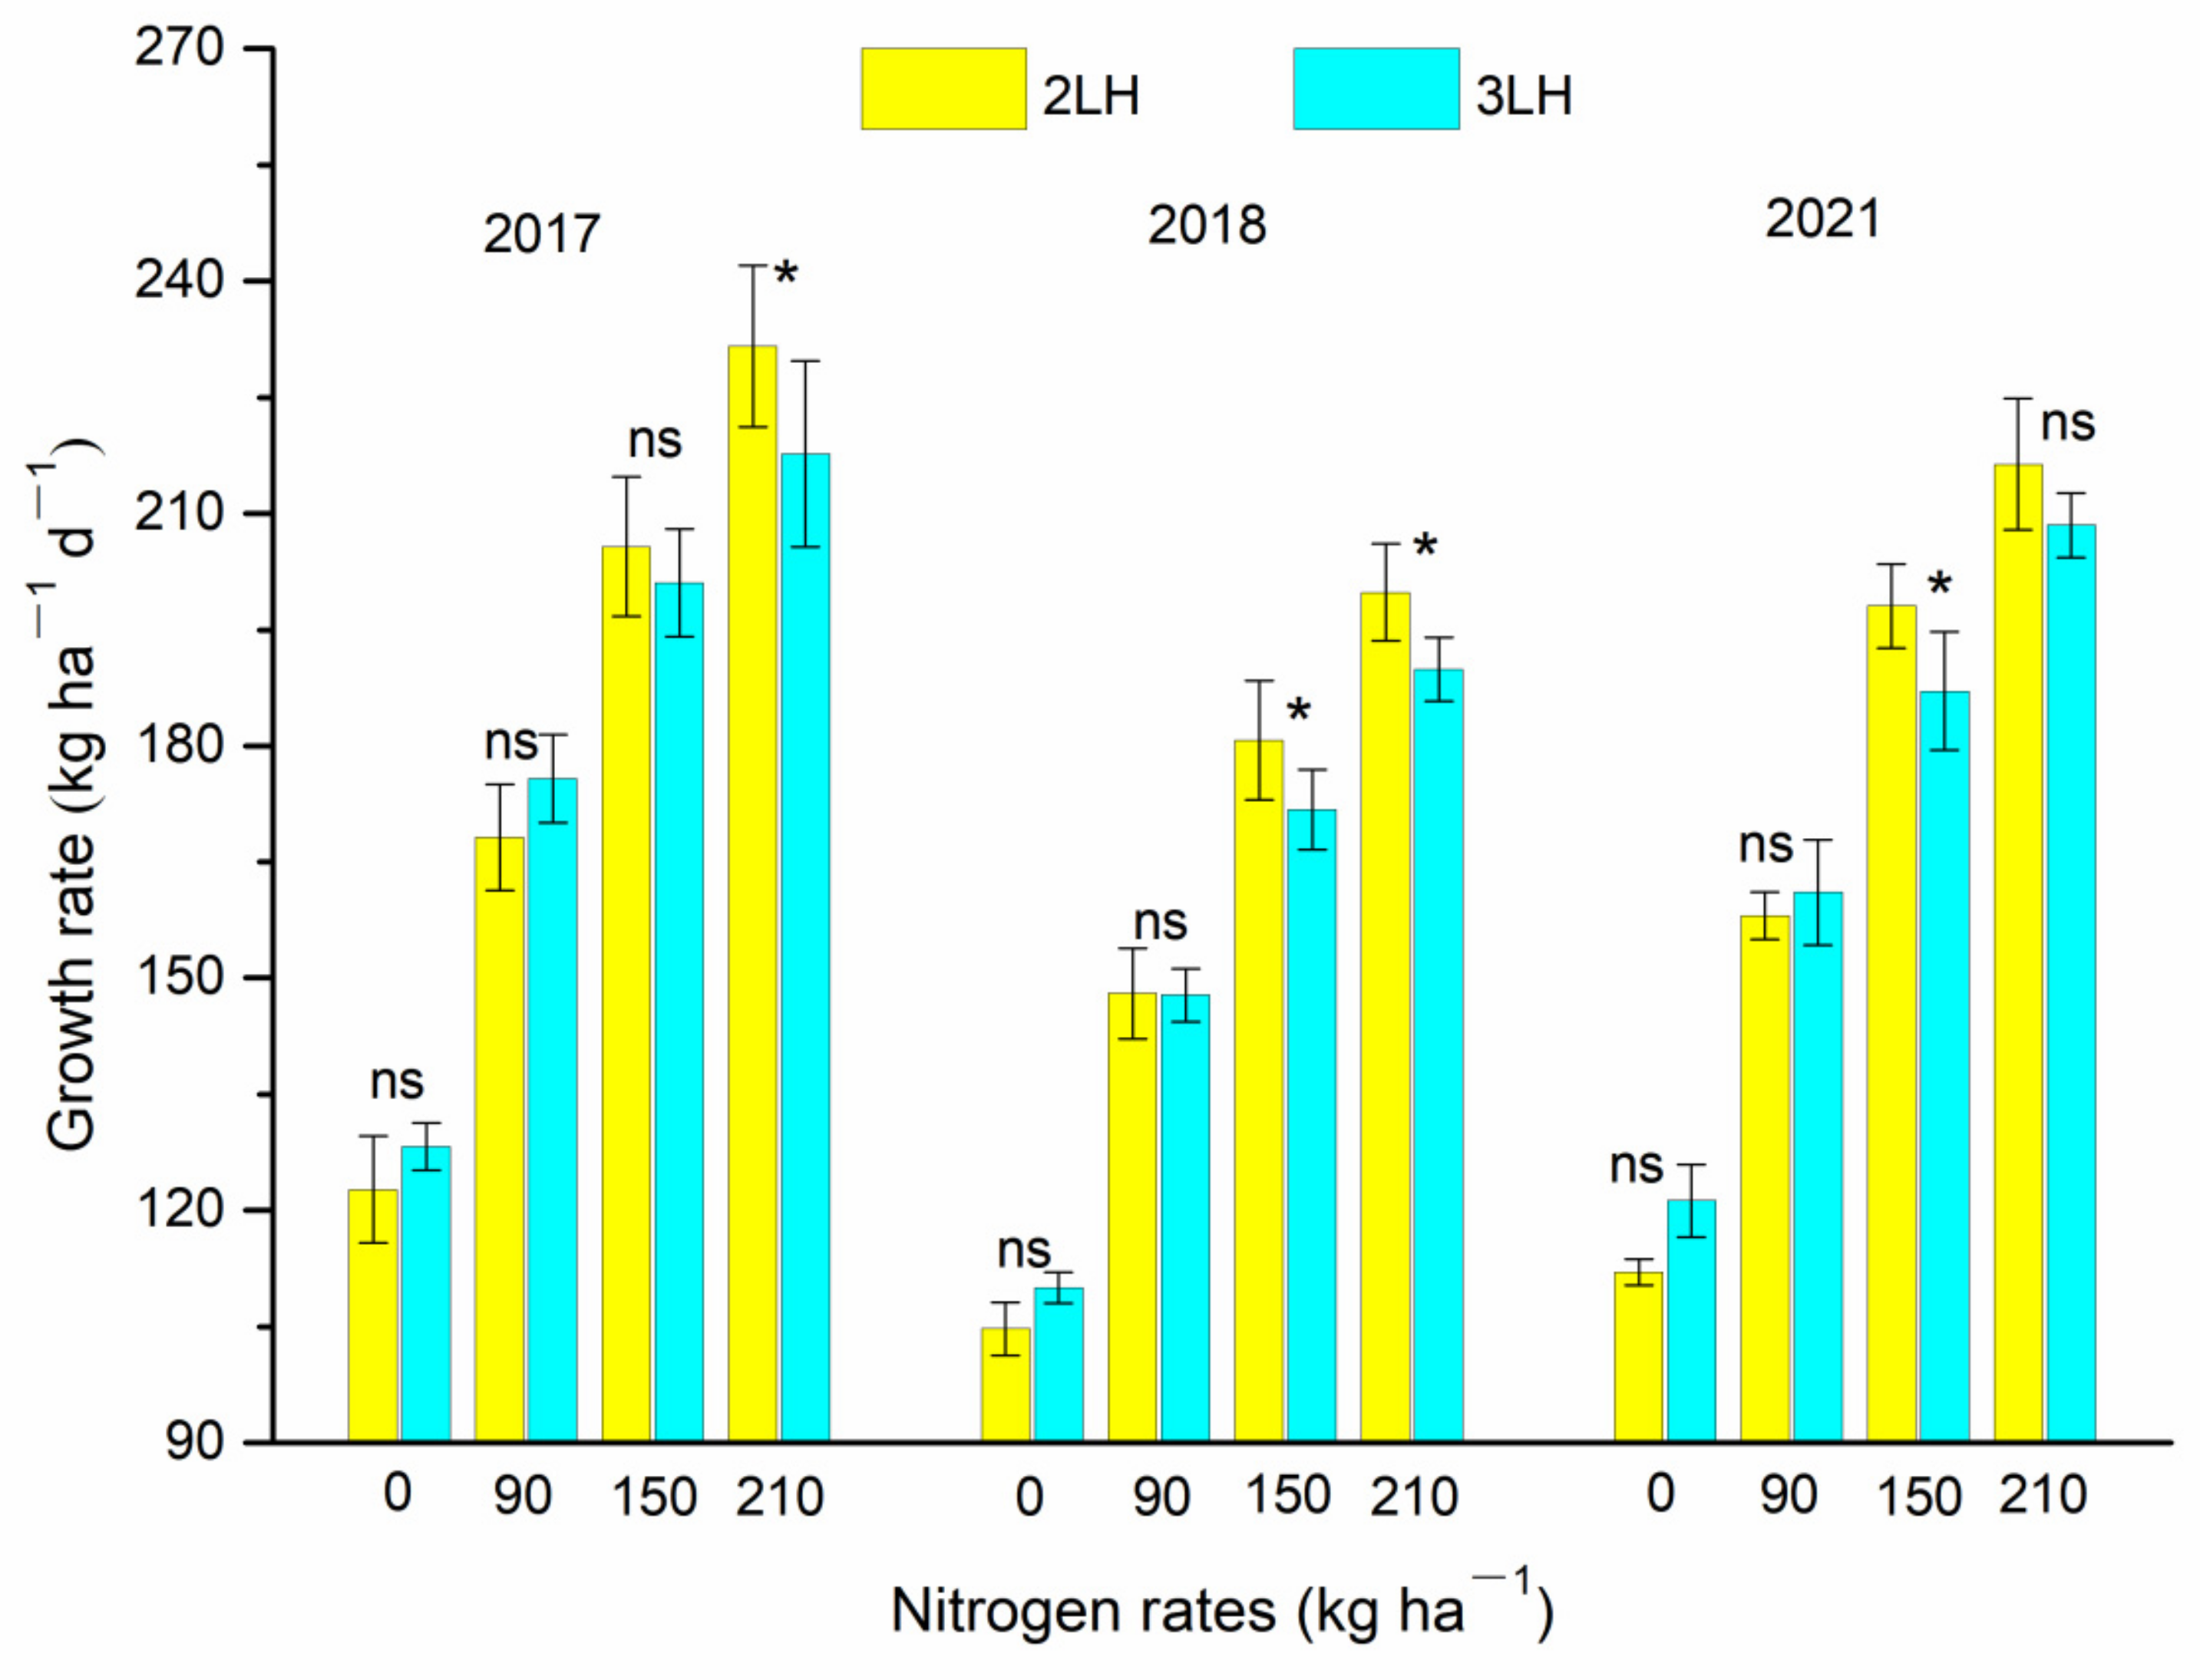
3.4. Effect of N Rate on Growth Rate from Jointing to Heading Stage

The growth rates of the two variety types from the jointing to heading stage under different N rates are shown in Figure 4. Under N0 and N90, the three-year average growth rate of 3LH was 4.65% and 2.49% higher compared to those of 3LH, which was not significant. Under N150 and N210, the three-year average growth rate of 2LH at the booting stage was 4.88% and 5.33% higher than those of 3LH, respectively. All growth rate differences were significant except for the ones under N150 in 2017 and N210 in 2021. Thus, 2LH grew more rapidly at the booting stage under higher N rates and could provide more nutrients for tiller differentiation and panicle formation.

3.5. Effect of N Rate on LAI, RIR, and Light Extinction Coefficient at the Jointing Stage

The light extinction coefficient represents the projection area of the leaves on the ground; a larger K indicates a larger leaf basal angle and a larger degree of extension. The changes in LAI, RIR, and K of the rice plants are shown in Table 5. The LAI of 3LH was higher than that of 2LH. Specifically, the LAI of 3LH under N210 was 15.83% (2017), 14.57% (2018), and 16.87% (2021) higher than those of 2LH, respectively. The RIR of 2LH and 3LH increased significantly with the increase in N rate, but the RIR of 2LH increased more rapidly. The RIR of 2LH surpassed that of 3LH as the N rate reached 150 kg ha−1. Specifically, the RIR of 2LH under N210 was 1.53% (2017), 3.53% (2018), and 1.94% (2021) higher than those of 3LH, respectively. According to the formulas, light extinction coefficient K is positively correlated with RIR and negatively correlated with LAI. Therefore, the K of 3LH under N0 was 4.43% (2017), 5.70% (2018), and 4.79% (2021) higher than those of 2LH, respectively. However, the K of 2LH under N210 was 27.94% (2017), 38.52% (2018), and 28.17% (2021) higher than those of 3LH, respectively. Comparing the K of 2LH and 3LH under different N rates revealed that the leaves of 3LH were more extended under the N rates of 0 and 90 kg ha−1; as the N rate increased to 150 and 210 kg ha−1, the leaf extension rate of 2LH was already significantly higher than that of 3LH, which was more favorable for the rice plant to receive more light energy for photosynthesis.

3.6. Effects of Morphological Indicators on the RIR, Yield, and AEN at the Heading Stage

The regression analysis results of RIR with LAI and K at the heading stage are shown in Table 6. In 2LH, the effects of LAI and K on RIR were similar as the effect of LAI was only 1.66% higher. In 3LH, the effect of leaf area on RIR was approximately 46.93% higher than that of leaf extension.
In this study, peak tiller number, growth rate from jointing to heading stage, effective panicle rate at heading stage, LAI, and K were closely related to each other in covariance (Table 3). In this study, partial least squares regression was used to analyze the relationship between relevant indicators and yield and AEAN (Table 7). In this way, the covariance interference was avoided and the yield and AEAN was considered simultaneously thanks to the advantage of partial least squares regression in multiple-dependent-variable analysis to suit the requirements of N adaptability studies. The determination coefficients of the fitted equation of morphological indicators and yield reached 0.85; thus, the degree of explanation was high. The determination coefficient of the fitted equation of morphological indicators and the AEAN in 2LH was also significant (R2 = 0.5672 **). The morphological indicators were not closely correlated with the AEAN in 3LH (R2 = 0.0719). In 2LH, LAI had the greatest effect on yield. The effects of peak tiller number, effective panicle rate, and K at the heading stage were similar in magnitude, but the effect of effective panicle rate was negative, unlike the positive ones of peak tiller number and K. In 3LH, LAI also had the greatest effect on yield, but the effects of peak tiller number and K reduced to a minimum. In 2LH, the effect of K on AEAN was greater than the other indicators, but its effect was negative, indicating that the increase in K was not synchronized with the increase in AEAN.

4. Discussion

4.1. Yield Responses to N Rate

From the end of the 20th century to the beginning of the 21st century, a large number of 2LH varieties were developed using photo-thermo-sensitive nuclear sterile and wide-compatibility materials, whose nutritional and physiological characteristics and plant characteristics were studied by cultivation and breeding experts [15,16,17], which strongly promoted the application of 2LH in production. As 2LH had a larger panicle and longer grain filling duration, its N uptake intensity in the middle and late grain filling stage was higher than that of 3LH, resulting in a larger yield increase as the N rate increased from 150 to 225 kg ha−1, while 3LH had a yield decrease [15]. The yield increase of 2LH was 10.58% as the N rate increased from 150 to 210 kg ha−1, which was much higher than that of 3LH (3.33%). Thus, 2LH in the three-year study showed a better response to high N application. With the increase in N rate, the panicle weight of the two variety types increased to the maximum in N90 and gradually decreased, while the effective panicle number gradually increased. Therefore, the advantage of 3LH in effective panicles was more predominant at N rates below 150 kg ha−1, which compensated for their disadvantage in panicle weight and contributed to consistently higher yields than 2LH. As the N rate increased from 150 to 210 kg ha−1, the growth momentum of effective panicle number in 3LH decreased, but the panicle weight still decreased with a large momentum, resulting in a slowed down yield increase. Thus, the additional 60 kg ha−1 N even had a nonsignificant yield-increasing effect in 2016, resulting in a significant reduction in AEAN. In 2LH, however, as the N rate increased from 150 to 210 kg ha−1, the effective panicle number increased steadily while the panicle weight decreased slowly, resulting in a significant yield increase. In addition, the AEAN did not decrease significantly, driving 2LH to overtake 3LH in terms of yield and AEN. Therefore, 3LH is more advantageous in yield under low-N conditions, while 2LH responds better to high N and is more likely to achieve yield breakthrough under high-N conditions.
Previous studies have suggested that effective panicle number is significantly and positively correlated with yield in almost all rice cropping areas, and the effect of panicle weight on yield is more predominant when environmental conditions are more favorable [18,19]. Therefore, in this study, the response of yield to N rates was also analyzed from the perspective of effective panicle number and panicle weight. The increase in effective panicle number and the decrease in panicle weight with the increase in N rate were both unidirectional without any significant inflection point. Both the highest yield and the lowest AEN occurred under the N210 treatment with the highest effective panicle number and the lowest panicle weight, which clearly made the effective panicle number the primary factor affecting yield and AEN. Effective panicle number is constrained by the peak tiller number and earbearing tiller percentage in both directions, and the number of effective panicles per unit area cannot be increased indefinitely, due to the limitation of radiation and heat, which is especially true in Southwest China with low insolation and high humidity, where the number of effective panicles is more constrained and lower than those of other rice cropping areas in China [20,21,22]. The peak tiller number increased rapidly with higher N rate. Although the limitation of radiation and heat led to decreasing earbearing tiller percentage, the increase in peak tiller number was more dominant, resulting in a significant increase in the effective panicle number. Thus, the promotion effect of the peak tiller number on the number of effective panicles was important, i.e., the contribution of the peak tiller number to yield was positive.
High earbearing tiller percentage based on suitable panicle number is an important marker of high yield [23,24]. When 2LH and 3LH were analyzed separately, the effect of effective panicle number was accentuated as the promoting effect of N application on yield was unidirectional. Therefore, the earbearing tiller percentage subject to the peak tiller number showed a negative correlation with yield, and the effective panicle proportion at the heading stage, which is closely related to the panicle development rate, also showed a similar pattern. However, cross-referencing the earbearing tiller percentage in 2LH and the effective panicle rate at the heading stage with those of 3LH revealed that the correlation between the two factors and yield is more complicated. Under N0 and N90, where the peak tiller number was low, the earbearing tiller percentage advantage of 2LH averaged 6.02% and the effective panicle rate at the heading stage decreased to 1.02%. Thus, the ineffective tillers of 2LH died slowly from the jointing to heading stage and competed with the effective tillers for space and nutrients, which is not conducive to the formation of large panicles. Therefore, under low N-conditions, 2LH not only has a low number of effective panicles, but also lacks the physiological basis to support the formation of large panicles, making the inferior yield inevitable. In N150 and N210 with higher peak tiller number, 2LH had a low percentage of ineffective tillers that died quickly, driving growth rates from the jointing to heading stage to outperform 3LH and providing more nutrients for the formation of large panicles [25]. This constitutes an important guarantee that the panicle weight of 2LH does not decrease drastically despite the significant increase in effective panicle number, and further contributes to the significant yield increase of 2LH, which eventually manifests as a better response to high-N applications.

4.2. N Rates Affect the Light Extinction Coefficient

The LAI and light extinction coefficient performed most differently on yield among the morphological indicators. LAI was always the most influential and stable indicator in 2LH and 3LH, while the light extinction coefficient contributed much more to the yield of 2LH than 3LH, showing a different specificity than LAI. The effect of LAI and light extinction coefficient on yield was consistent with the effect of RIR but to a greater extent as the greater radiation intercepted by the population was beneficial to the yield increase. In 2LH, the contribution of leaf extension rate to yield was approximately 46.35% that of LAI. In 3LH, however, only the leaf area had a significant effect on yield; the effect of leaf extension rate was weak, about 12.80% of the effect of LAI. Leaf uprightness facilitates a lower light extinction coefficient and allows the lower leaves to receive more radiation, and the net assimilation rate of 2LH with upright leaves is high and has a significant yield advantage over 3LH in areas with superior radiation and heat [26,27,28,29]. In this study, 2LH also had a lower light extinction coefficient than 3LH, which is consistent with previous findings. However, the leaf extension rate in 2LH responded more positively to N rates. Under low N rate, leaves of 3LH were more extended than 2LH overall, which facilitated a higher RIR. With increasing N rate, the leaf area of 2LH increased insignificantly but leaf extension rate increased significantly, while 3LH only had a significant increase in leaf area with little response in leaf extension rate. As a result, the RIR of 2LH exceeded that of 3LH, possibly an important reason for the nondramatic reduction in panicle weight under high-N conditions in 2LH, which played a positive role in the better N response of 2LH. Although the accelerated leaf extension of 2LH under high-N conditions effectively increased the yield, the N fertilizer efficiency was still decreasing. Therefore, the contribution of light extinction coefficient to the AEAN was negative in 2LH.

5. Conclusions

In N0, N90, and N150, 3LH had a greater advantage in effective panicle number and yielded 7.95%, 6.31%, and 5.48% higher than those of 2LH, respectively. In N210, 2LH had a greater advantage in panicle weight and yielded 1.45% higher than that of 3LH. LAI had the greatest effect on the yield of both 2LH and 3LH, while the light extinction coefficient reflecting the extent of leaf extension only greatly affected the yield of 2LH. Under a high N rate, 2LH intercepted more radiation through greater leaf extension to achieve higher yields and mitigate the AEN decrease, showing a stronger ability to adapt to a high-N environment. As far as the results of this study are concerned, the large-scale application of 2LHs is required to break the bottleneck of low rice yield potential in Southwest China. For China with a large population and small arable land, ensuring food ration security is the first priority, so although the high yield of 2LHs is based on higher N fertilizer inputs, the higher yield and AEN of 2LHs are more attractive at the moment. In addition, the seed cost of 2LH is no more expensive than that of 3LH, so the economic benefit of 2LH production is more prominent than 3LH, which is conducive to improving farmers’ enthusiasm for rice production. 2LH is not only a hindrance to the efficient use of N fertilizer in China, but also an important measure to boost rice production in China. With the development of hybrid rice breeding technology, 3LH with upright leaves has appeared. Whether it can tolerate high N as with 2LH warrants in-depth study.

Author Contributions

Conceptualization, N.L.; methodology, Z.Y.; software, Q.C. and R.L.; validation, N.L.; formal analysis, Y.Z.; investigation, Z.Y. and Q.C.; resources, N.L.; data curation, J.Z. and N.L.; writing—original draft preparation, Z.Y. and Q.C.; writing—review and editing, C.S.; visualization, F.L.; supervision, T.L. and Y.S.; project administration, J.M.; funding acquisition, N.L. and Z.Y. All authors have read and agreed to the published version of the manuscript.

Funding

This research was funded by the Applied Basic Research Program, grant number 2021YJ0281 and the APC was funded by the Scientific Research Fund of Sichuan Provincial Education Department.

Institutional Review Board Statement

Not applicable.

Data Availability Statement

The data that support the findings of this study are available from the corresponding author upon reasonable request.

Acknowledgments

This study was supported by the Scientific Research Fund of Sichuan Provincial Education Department, grant number 18ZA0390.

Conflicts of Interest

The authors declare that they have no known competing financial interest or personal relationships that could have appeared to influence the work reported in this paper.

References

  1. Zhang, Y.; Yu, Q. Identification of current research intensity and influence factors of agricultural nitrogen loss from cropping systems. J. Clean. Prod. 2020, 276, 123308. [Google Scholar] [CrossRef]
  2. Li, D.; Zhai, Y.; Lei, Y.; Li, J.; Teng, Y.; Lu, H.; Xia, X.; Yue, W.; Yang, J. Spatiotemporal evolution of groundwater nitrate nitrogen levels and potential human health risks in the Songnen Plain, Northeast China. Ecotox. Environ. Safe. 2021, 208, 111524. [Google Scholar] [CrossRef]
  3. Fu, J.; Jian, Y.; Wu, Y.; Chen, D.; Zhao, X.; Ma, Y.; Niu, S.; Wang, Y.; Zhang, F.; Xu, C.; et al. Nationwide estimates of nitrogen and phosphorus losses via runoff from rice paddies using data-constrained model simulations. J. Clean. Prod. 2020, 276, 123642. [Google Scholar] [CrossRef]
  4. Shen, X.; Zhang, L.; Zhang, J. Ratoon rice production in central China: Environmental sustainability and food production. Sci. Total Environ. 2020, 764, 142850. [Google Scholar] [CrossRef]
  5. Chen, Z.; Zhang, H.; Xue, J.; Liu, S.; Chen, F. A nine-year study on the effects of tillage on net annual global warming potential in double rice-cropping systems in Southern China. Soil Till. Res. 2021, 206, 104797. [Google Scholar] [CrossRef]
  6. Xu, P.; Zhou, W.; Jiang, M.; Khan, I.; Shaaban, M.; Jiang, Y.; Hu, R. Nitrogen fertilizer application in the rice-growing season can stimulate methane emissions during the subsequent flooded fallow period. Sci. Total Environ. 2020, 744, 140632. [Google Scholar] [CrossRef]
  7. Guo, X.H.; Wang, X.C.; Meng, T.; Zhang, H.J.; Ao, X.; Wang, H.Y.; Xie, F.T. Comparison on morphological, yield, and quality traits of soybean cultivars developed in different years from Liaoning and Ohio. Sci. Agric. Sin. 2015, 48, 4240–4253, (In Chinese with English Abstract). [Google Scholar]
  8. Li, H.Z.; Cui, X.F.; Cui, M.Z.; Lin, Z.W.; Tang, Y.W. Studies on nitrate reductase activity and nitrogen response in crop plants Ⅲ. the relation of nitrate reductase activity with characters of cultivar in the succession of rice cultivated in Northern China. Acta Agron. Sin. 1988, 14, 163–166, (In Chinese with English Abstract). [Google Scholar]
  9. Tang, Y.W.; Lin, Z.W.; Chen, J.X. Studies on correlation between nitrate reductase activity and nitrogen response in crop plants and its application in biochemical plant breeding. Sci. Agric. Sin. 1985, 18, 39–45, (In Chinese with English Abstract). [Google Scholar]
  10. Huang, M.; Lei, T.; Cao, F.; Chen, J.; Zou, Y. Solar radiation utilization characteristics of double-season rice in China. Agron. J. 2021, 113, 270–275. [Google Scholar] [CrossRef]
  11. Liu, K.; Li, T.; Chen, Y.; Huang, J.; Qiu, Y.; Li, S.; Wang, H.; Zhu, A.; Zhuo, X.; Yu, F.; et al. Effects of root morphology and physiology on the formation and regulation of large panicles in rice. Field Crop. Res. 2020, 258, 107946. [Google Scholar] [CrossRef]
  12. Huang, L.; Yang, D.; Li, X.; Peng, S.; Wang, F. Coordination of high grain yield and high nitrogen use efficiency through large sink size and high post-heading source capacity in rice. Field Crop. Res. 2019, 233, 49–58. [Google Scholar] [CrossRef]
  13. Yang, Z.Y.; Shu, C.H.; Zhang, R.P.; Yang, G.T.; Wang, M.T.; Qin, J.; Sun, Y.J.; Ma, J.; Li, N. Comparison of tolerances to nitrogen fertilizer between compact and loose hybrid indica rice varieties. Acta Agron. Sinica. 2021, 47, 1593–1602. [Google Scholar] [CrossRef]
  14. Yang, Z.Y.; Li, N.; Ma, J.; Sun, Y.J.; Xu, H. High-yielding traits of heavy panicle varieties under triangle planting geometry: A new plant spatial configuration for hybrid rice in China. Field Crops Res. 2014, 168, 135–147. [Google Scholar] [CrossRef]
  15. Shi, Q.H.; Pan, X.H.; Zhang, P.L.; Zhong, X.H. Studies on the mechanism of ultra-high yield of two-line hybrid rice Ⅰ. a preliminary study on the nutrition characteristics of two-line hybrid rice. Acta Agric. Univer Jiangxi 1993, 15, 6–11, (In Chinese with English Abstract). [Google Scholar]
  16. Xiao, D.X.; Pan, X.H.; Shi, Q.H. A preliminary study on the vascular bundle characters and its relation to the field-grain rate in two lines hybrid rice (F1). Acta Agric. Univer. Jiangxi 1993, S2, 50–54, (in Chinese with English Abstract). [Google Scholar]
  17. Zhuang, B.H.; Lin, F.; Hong, Z.F. Physiological regulations on fertility of two-line intersubspecies rice hybrids. Chin. J. Rice Sci. 1994, 8, 111–114, (In Chinese with English Abstract). [Google Scholar]
  18. Huang, M.; Zou, Y.B.; Jiang, P.; Xia, B.; Md, I.; Ao, H.J. Relationship between grain yield and yield components in super hybrid rice. Sci. Agric. Sin. 2011, 10, 1537–1544. [Google Scholar] [CrossRef]
  19. Huang, M.; Jiang, L.; Xia, B.; Zou, Y.B.; Jiang, P.; Ao, H. Yield gap analysis of super hybrid rice between two subtropical environments. Aust. J. Crop. Sci. 2013, 7, 600–608. [Google Scholar]
  20. Zhu, C.; Ouyang, Y.; Diao, Y.; Yu, J.; Luo, X.; Zheng, J.; Li, X. Effects of mechanized deep placement of nitrogen fertilizer rate and type on rice yield and nitrogen use efficiency in Chuanxi Plain China. J. Integr. Agr. 2021, 20, 581–592. [Google Scholar] [CrossRef]
  21. Yang, Z.; Li, N.; Ma, P.; Li, Y.; Zhang, R.; Song, Q.; Guo, X.; Sun, Y.; Xu, H.; Ma, J. Improving nitrogen and water use efficiencies of hybrid rice through methodical nitrogen-water distribution management. Field Crop. Res. 2020, 246. [Google Scholar] [CrossRef]
  22. Van Wart, J.; Kersebaum, C.; Peng, S.; Milner, M.; Cassman, K.G. Estimating crop yield potential at regional to national scales. Field Crop. Res. 2013, 143, 34–43. [Google Scholar] [CrossRef] [Green Version]
  23. Ling, Q.H.; Su, Z.F.; Zhang, H.Q. Relationship between earbearing tiller percentage and population quality and its influential factors in rice. Acta Agron. Sin. 1995, 21, 463–469, (In Chinese with English Abstract). [Google Scholar]
  24. Jiang, P.Y.; Hong, X.F.; Feng, D.L.; Ma, Y.F.; Shi, J.L.; Ni, Z.R.; Liu, Z.H. Relation between percentage of ear-bearing of colony in the middle phase and photosynthesis efficiency in the late in rice. Sci. Agric. Sin. 1994, 27, 8–14, (In Chinese with English Abstract). [Google Scholar]
  25. Horie, T.; Lubis, I.; Takai, T.; Ohsumi, A.; Kuwasaki, K.; Katsura, K.; Nii, A. Physiological traits associated with high yield potential in rice. Rice Sci. Innov. Impacts Livelihood. IRRI Manila. 2003, 2003, 117–146. [Google Scholar]
  26. Hu, N.; Lu, C.G.; Yao, K.M.; Zou, J.S. Simulation on distribution of photosyn-thetically active radiation in canopy and optimum leaf rolling index in rice with rolling leaves. Rice Sci. 2009, 16, 217–225. [Google Scholar] [CrossRef]
  27. Peng, G.F.; Li, Y.Z.; Yang, G.Q. Studies on super-high yield characteristics and culture of two-line hybrid rice Pei’ai 64S/E32 I determinants of super high yield. Hybrid. Rice 2000, 15, 27–29, (In Chinese with English Abstract). [Google Scholar]
  28. Ding, C.; Luo, X.; Wu, Q.; Lu, B.; Ding, Y.; Wang, S.; Li, G. Compact plant type rice has higher lodging and N resistance under machine transplanting. J. Integr. Agric. 2021, 20, 65–77. [Google Scholar] [CrossRef]
  29. Zhang, J.; Zhu, L.; Yu, S.; Jin, Q. Involvement of 1-Methylcyclopropene in Plant Growth, Ethylene Production, and Synthase Activity of Inferior Spikelets in Hybrid Rice Differing in Panicle Architectures. J. Plant. Growth Regul. 2014, 33, 551–561. [Google Scholar] [CrossRef]
Figure 1. Precipitation, total sunshine hours, relative humidity, mean temperature, and daily solar radiation across the growing seasons of rice in Mianyang. Precipitation and total sunshine hours are mon3LHy totals. Temperatures, daily solar radiation, and relative humidity are the mon3LHy averages.
Agriculture 12 00250 g001
Figure 2. Agronomic efficiency of (additional) nitrogen fertilizer of two rice types. 2LH: two-line hybrid rice; 3LH: three-line hybrid rice. Different letters above the three adjacent bars represent significant difference at p < 0.05 among N treatments.
Agriculture 12 00250 g002
Figure 3. Tillering characteristics of two rice types with different nitrogen rates in 2016 (a), 2017 (b), and 2021 (c). 2LH: two-line hybrid rice; 3LH: three-line hybrid rice. The left side of the two adjacent bars represents jointing stage, and the right side represents heading stage.
Agriculture 12 00250 g003
Figure 4. Growth rate of two rice types with different nitrogen rates from jointing stage to heading stage. 2LH: two-line hybrid rice; 3LH: three-line hybrid rice. ns: not significant; *: significant at the p = 0.05 level.
Agriculture 12 00250 g004
Table 1. Average values for selected soil characteristics of composite topsoil samples (0–20 cm) from the experimental fields in 2016, 2017, and 2021.
YearOrganic Matter (g kg−1)Total N (g kg−1)Available (mg kg−1)pHBulk DensityField Capacity
NPK(g cm−3)(%, v/v)
201623.231.96104.1023.90106.996.361.3520.12
201725.002.30125.9029.13116.536.381.3217.73
202124.552.09121.7126.09112.886.591.2320.03
Table 2. Main characteristic parameters of yield and plant type of experimental varieties.
Variety TypeVarietyPanicle (m−2)Panicle Weight (g)Grain Yield
(g m−2)
AEN(kg kg−1)Leaf Opening AngelLeaf Basal AngelLeaf Drooping Degree
Flag Leaf2nd Leaf From Top3rd Leaf From TopFlag Leaf2nd Leaf From Top3rd Leaf From TopFLAG Leaf2nd Leaf From Top3rd Leaf From Top
Two-line hybrid riceJ1377191.52b5.41bc1032.74b20.83c13.60e17.44d20.04c11.48e14.96c2.11b2.48d1.46b191.52b
L1206175.77c6.33a1109.68a22.88b14.23d18.29c20.40c11.97d15.10c2.27b3.19c1.15b175.77c
Y1183.2bc6.24a1143.16a25.63a14.04de18.01c20.52c11.99d15.50c2.05b2.51d1.13b183.2bc
Three-line hybrid riceC8377208.69a4.87c1016.44b20.86c18.86c24.71b27.18b13.40c18.45b5.47a6.27b3.77a208.69a
Y2115188.91b6.11a1092.59a24.52ab21.24a25.95a28.25a15.58a18.89ab5.66a7.06a3.93a188.91b
F498207.61a5.79ab1143.98a26.48a19.97b25.63a27.99a14.57b19.07a5.40a6.56ab3.84a207.61a
AEN: agronomic efficiency of N fertilizer. Values within a column followed by different letters are significantly different at p < 0.05 under different cultivars at 5% level.
Table 3. Analysis of variance showing the significance probability of each effect for grain yield, panicles, panicle weight, AEN, LAI, and K value at heading stage.
VarianceGrain YieldPanicle NumberPanicle Weight AEN LAI At Heading StageK Value At Heading Stage
V343.91 **226.24 **29.75 **3.63 *229.19 **19.10 **
N909.08 **137.19 **766.89 **35.10 **259.14 **25.39 **
V × N11.41 **17.40 **6.70 **5.12 *4.06 *12.75 **
Y1.77ns13.46 **12.81 **0.48ns2.31ns1.21ns
V × Y2.69ns0.30ns2.91ns0.60ns0.88ns0.04ns
N × Y0.62ns0.79ns0.25ns0.63ns0.51ns0.64ns
V × N × Y0.36ns0.37ns0.15ns0.49ns0.25ns0.59ns
V: variety type; N: nitrogen rate; Y: year; LAI: leaf area index; AEN: agronomic efficiency of nitrogen fertilizer. ns: not significant; *: significant at the p = 0.05 level; **: significant at the p = 0.01 level.
Table 4. Effects of N rates on grain yield and yield components of two rice types.
Variety TypeN Treatment201620172021Mean of 2016, 2017, and 2021
Panicle (×104 ha−1)Panicle Weight
(g)
Grain Yield
(kg ha−1)
Panicle (×104 ha−1)Panicle Weight (g)Grain Yield (kg ha−1)Panicle (×104 ha−1)Panicle Weight (g)Grain
Yield
(kg ha−1)
Panicle (×104 ha−1)Panicle Weight (g)Grain Yield
(kg ha−1)
Two-line hybrid rice (2LH)N0140.73d5.25d7389.61d140.15d5.29d7407.74d136.12d5.15d7009.07d139.00d5.23d7268.81d
N90165.16c6.05a9983.81c160.54c6.24a10,017.92c157.55c5.88a9267.13c161.08c6.06a9756.29c
N150192.58b5.86b11,279.37b194.08b5.78b11,220.40b188.91b5.74b10,848.33b191.86b5.79b11,116.03b
N210218.94a5.66c12,382.86a221.40a5.60c12,412.32a222.00a5.44c12,081.80a220.78a5.57c12,292.33a
Mean 179.355.7110,258.91179.045.7310,264.60176.145.569801.58178.185.6710,108.36
Three-line hybrid rice (3LH)N0160.74d5.09b8177.11c155.54d5.03c7822.05d152.11d4.96c7540.87d156.13d5.03c7846.68d
N90183.72c5.83a10,712.15b176.34c5.85a10,310.38c178.20c5.67a10,093.73c179.42c5.78a10,372.09c
N150234.96b5.19b12,185.60a222.52b5.20b11,577.15b224.93b5.08b11,414.20b227.47b5.16b11,725.65b
N210252.02a4.93c12,425.97a246.29a4.89d12,047.86a248.48a4.78d11,875.60a248.93a4.87d12,116.48a
Mean207.865.2610,875.21200.175.2410,439.36200.935.1210,231.10202.995.2110,515.22
F valueV2370.82 **980.56 **240.75 **971.12 **559.94 **253.18 **168.79 **611.20 **28.02 *36,851 **711.24 **197.33 *
N576.90 **139.33 **389.85 **2146.86 **245.69 **619.75 **3397.85 **188.42 **691.06 **1527.90 **174.22 **493.26 **
V*N12.70 **26.15 **3.53 *15.38 **15.64 **5.04 *38.61 **30.71 **8.03 **20.06 **18.85 **5.21 *
V: variety type; N: nitrogen rate; Values within a column followed by different letters are significantly different at p < 0.05 among N treatments. *: significant at the p = 0.05 level; **: significant at the p = 0.01 level.
Table 5. Effects of nitrogen rates on LAI, RIR, and K value of the whole plant at heading stage in two rice types.
Variety TypeN Treatment201620172021
LAIRIRK (×10−3)LAIRIRK (×10−3)LAIRIRK (×10−3)
Two-line hybrid rice (2LH)N06.45c78.74d240.32c6.00d77.00c246.30b5.96c76.64c244.76b
N907.40b83.87c247.82c6.80c81.98c253.99b6.86b82.71b256.19b
N1508.14a92.16b315.45b7.32b89.09b305.56b7.63a91.60a331.50a
N2108.59a95.61a367.88a8.03a95.86a398.33a8.06a94.04a351.55a
Mean7.6587.60292.877.6585.98301.057.1386.25296.00
Three-line hybrid rice (3LH)N07.39d84.28c250.97a6.45d81.12b260.35a6.77d82.35c256.48a
N908.29c87.71b252.91a7.72c87.72a273.60a7.78c87.00b267.20a
N1509.30b90.47b253.47a8.33b88.85a274.04a8.80b89.06ab252.02a
N2109.95a94.17a287.53a9.20a92.59a287.57a9.42a92.25a274.29a
Mean8.7389.16261.228.7387.57273.898.1987.66262.50
F valueV188.78 **117.27 **14.42ns478.44 **2.28ns3.64ns148.98 **1.15ns4.76ns
N67.08 **63.14 **20.15 **93.70 **23.22 *5.86 *66.17 **61.38 **7.86 **
V * N0.73ns6.12 **7.50 **2.17ns2.38ns3.32ns0.93ns6.17 **6.55 **
LAI: leaf area index; RIR: radiation interception rate; K: light extinction coefficient. V: variety type; N: nitrogen rate. Values within a column followed by different letters are significantly different at p < 0.05 among N treatments. ns: not significant; *: significant at the p = 0.05 level; **: significant at the p = 0.01 level.
Table 6. Linear regression equations of LAI and K value at the heading stage for radiation interception rate.
Variety TypeTraitsStandard Regression Coefficient R2
Two-line hybrid rice (2LH)LAI0.552 **0.933 **
K0.543 **
Three-line hybrid rice (3LH)LAI0.789 **0.952 **
K0.537 **
LAI: leaf area index; K: light extinction coefficient; **: significant at the p = 0.01 level.
Table 7. Contribution of morphology-related indicators to yield and agronomic efficiency of nitrogen fertilizer.
Variety TypeTraitsGrain YieldAEAN
Standard Partial Regression CoefficientR2Standard Partial Regression CoefficientR2
Two-line hybrid rice (2LH)Peak tiller number0.28020.8620 **−0.13510.5672 **
Growth rate from jointing to heading0.08760.1883
Effective panicle rate at heading−0.2779−0.1452
LAI0.59240.0738
K0.2746−0.2330
Three-line hybrid rice (3LH)Peak tiller number0.07230.8575 **0.20230.0719ns
Growth rate from jointing to heading0.1425−0.054
Effective panicle rate at heading−0.15610.0943
LAI0.57890.0774
K0.07410.1331
LAI: leaf area index; K: light extinction coefficient; AEN: agronomic efficiency of nitrogen fertilizer. ns: not significant; **: significant at the p = 0.01 level.
Publisher’s Note: MDPI stays neutral with regard to jurisdictional claims in published maps and institutional affiliations.

