Article

Effect of Straw Length, Stubble Height and Rotary Speed on Residue Incorporation by Rotary Tillage in Intensive Rice–Wheat Rotation System

1
Key Laboratory of Intelligent Agricultural Equipment of Jiangsu Province, College of Engineering, Nanjing Agricultural University, Nanjing 210031, China
2
School of Arts and Design, Huizhou University, Huizhou 516007, China
3
International Maize and Wheat Improvement Center (CIMMYT), Southern Africa Regional Office, 12.5 KM Peg, Mazowe Road, Mount Pleasant, Harare P.O. Box MP 163, Zimbabwe
*
Author to whom correspondence should be addressed.
Agriculture 2022, 12(2), 222; https://doi.org/10.3390/agriculture12020222
Submission received: 30 December 2021 / Revised: 26 January 2022 / Accepted: 27 January 2022 / Published: 3 February 2022

Abstract

:
High-yielding agriculture in an intensive rice–wheat rotation system leads to plenty of residues left in the field after harvest, which is detrimental to seeding operation, seed germination, and early plant growth. Some residue thus needs to be incorporated into the soil. Providing the relationship between tillage operations and residue incorporation and establishing a mathematical model play important roles in residue management and the design of tillage machinery. In order to obtain detailed data on the interaction between residue incorporation and tillage operations, a multifunctional field-testing bench with precise parameter control was developed to assess residue incorporation characteristics of rotary tillage, and we investigated the effects of straw length, stubble height and rotary speed on residue incorporation. Three experimental factors affecting residue incorporation performance were studied, i.e., six lengths of straw (30–150 mm), four heights of stubble (50–200 mm), and three rotary speeds (240–320 rpm). Chopped straw and stubble with certain sizes were prepared for the test, and we measured the burying rate and distribution uniformity of residue after rotary tillage. The results indicated that straw length, stubble height, and rotary speed all impact residue incorporation quality. The burying rate and distribution uniformity of residue decreased with the increase in straw length and stubble height; a lower rotary speed parameter buried less residue and distributed it with worse uniformity than a higher one. It is suggested that farmers determine the straw length and stubble height at the stage of harvest according to the required burying rate and distribution uniformity of residue.

1. Introduction

Over recent decades, threatened food security due to rapid worldwide population growth has led to efforts in increasing agricultural food production [1,2]. However, high-yielding agriculture leads to plenty of crop residues being left in the field after harvest, which is detrimental to seeding operation, seed germination, and early plant growth [3,4,5,6]. Agricultural producers thus have been seeking suitable tillage operations to alleviate the problems of excessive crop residues.
Crop residues are an important renewable biological resource since they provide organic material and nutrients required to improve soil health [7,8,9]. Crop residues are treated by burning, causing environmental pollution and squandering biological resources. In contrast, residues incorporated into the soil by tillage practices can increase soil organic matter and fertility, improve soil pore structure and promote crop growth [10,11,12,13,14,15]. However, the rate and degree of organic matter accumulation with residues’ incorporation vary widely due to differences in residue distribution position, soil type, and climate [16,17]. Many residues accumulate on the ground after harvest, which makes seeding operations difficult and decreases residue decomposition rate [18,19]. Residues incorporated into the soil evenly are conducive to the complete contact between residues and microorganism for increasing residue decomposition rate, and can greatly reduce the consumption of chemical fertilizer in the field [20,21,22]. Therefore, evaluating the residue incorporation fraction and its spatial distribution by different tillage operations is important for guiding agricultural producers to undertake sowing and fertilization operations as well as soil conservation management measures.
Previous many studies have found that straw displacement and residue burying rate were affected by tillage depth, forwarding speed, the type of tools, residue length, and soil conditions [23,24,25]. For example, deeper tillage depth and higher speed could increase straw burying rate [26], the application of a trash board could improve the residue burying and displacement performance in plough tillage [25], and short residue length is conducive to residue incorporation to acquire a better burying rate in sweep tillage [27]. However, little research has been performed on how residue conditions and tillage operations affect the spatial distribution of residues, although the importance of a better understanding of the distribution state of residues after being incorporated into the soil has been emphasized by a number of authors [28,29,30]. Hence, providing the relationship between tillage operations and residue spatial distribution, and establishing a mathematical model, play an important role in residue management and tillage parameter selection.
In the intensive rice–wheat rotational farming carried out in east China, excessive residue is left in the field after harvesting [5,31] Limited annual heat resources in these agricultural areas also compels timely preparation of seedbeds within the constraints of short transitional periods between crops. Thus, establishment of the second crop on excessive residue-covered soil is challenging. Farmers’ typical practice of conventional tillage was to cut the residue into a proper length and then incorporate the residue uniformly into the soil by rotary tillage [32]. This soil tillage measure is relatively efficient in alleviating the problems of excessive residues. However, residue incorporation quality after rotary tillage varies widely due to differences in the residue parameters and tillage operations. Detailed data are also lacking on the quantitative relationship between tillage parameters (e.g., straw length, stubble height, and rotary speed) and straw incorporation quality.
Many studies have been conducted to explore residue incorporation characteristics of different tillage tools under precise control conditions [18,32,33,34,35]. Most studies have been based on an indoor soil bin condition. Although the benefits of the soil bin test are well-known, there are many limitations in the experimental conditions. For example, the influence of stubble factor on residue incorporation cannot be implemented in the test, and there are also some differences between indoor-remolded soil and field soil. So, accurate data are still lacking on the interactions between crop residue and tillage operations under field test conditions. In addition, more detailed studies of the spatial distribution of residue after being incorporated into the soil, as well as residue incorporation characteristics of rotary tillage, are required. Therefore, a quantitative investigation into the relationship between tillage parameters and residue incorporation in an intensive rice–wheat rotation system under field test conditions is necessary. Based on these findings, a field-testing bench and a residue coordinate digitizer were developed to obtain sufficient field test data under precise control conditions, as well as to comprehensively understand the effect of tillage operations on the burying rate and distribution uniformity of residue. The specific objectives include: (i) use the multifunctional field-testing bench to perform residue incorporation characteristics of rotary tillage (ii) investigate the effect of straw length and stubble height on residue distribution and residue burying on field conditions, and (iii) the effect of rotary speed on the residue incorporation quality.

2. Materials and Methods

In November 2020, these experiments were conducted in the Babaiqiao, Nanjing Agricultural University, Jiangsu Province, China (118°55′ E, 32°25′ N). The tillage test was carried out in the field after the rice-crop harvesting in autumn. The soils in the field were clay loam, and the site had a long history of rice–wheat rotation. Before the start of the experiments, soil physical properties (cone index, moisture content, bulk density) and straw parameters (length, height, density) were measured, and the results are presented in Table 1. The specific operations were that the collected soil and straw samples were weighed and dried in an oven and weighed again to determine soil moisture content and dry bulk density, as well as the wet and dry densities of the straw.

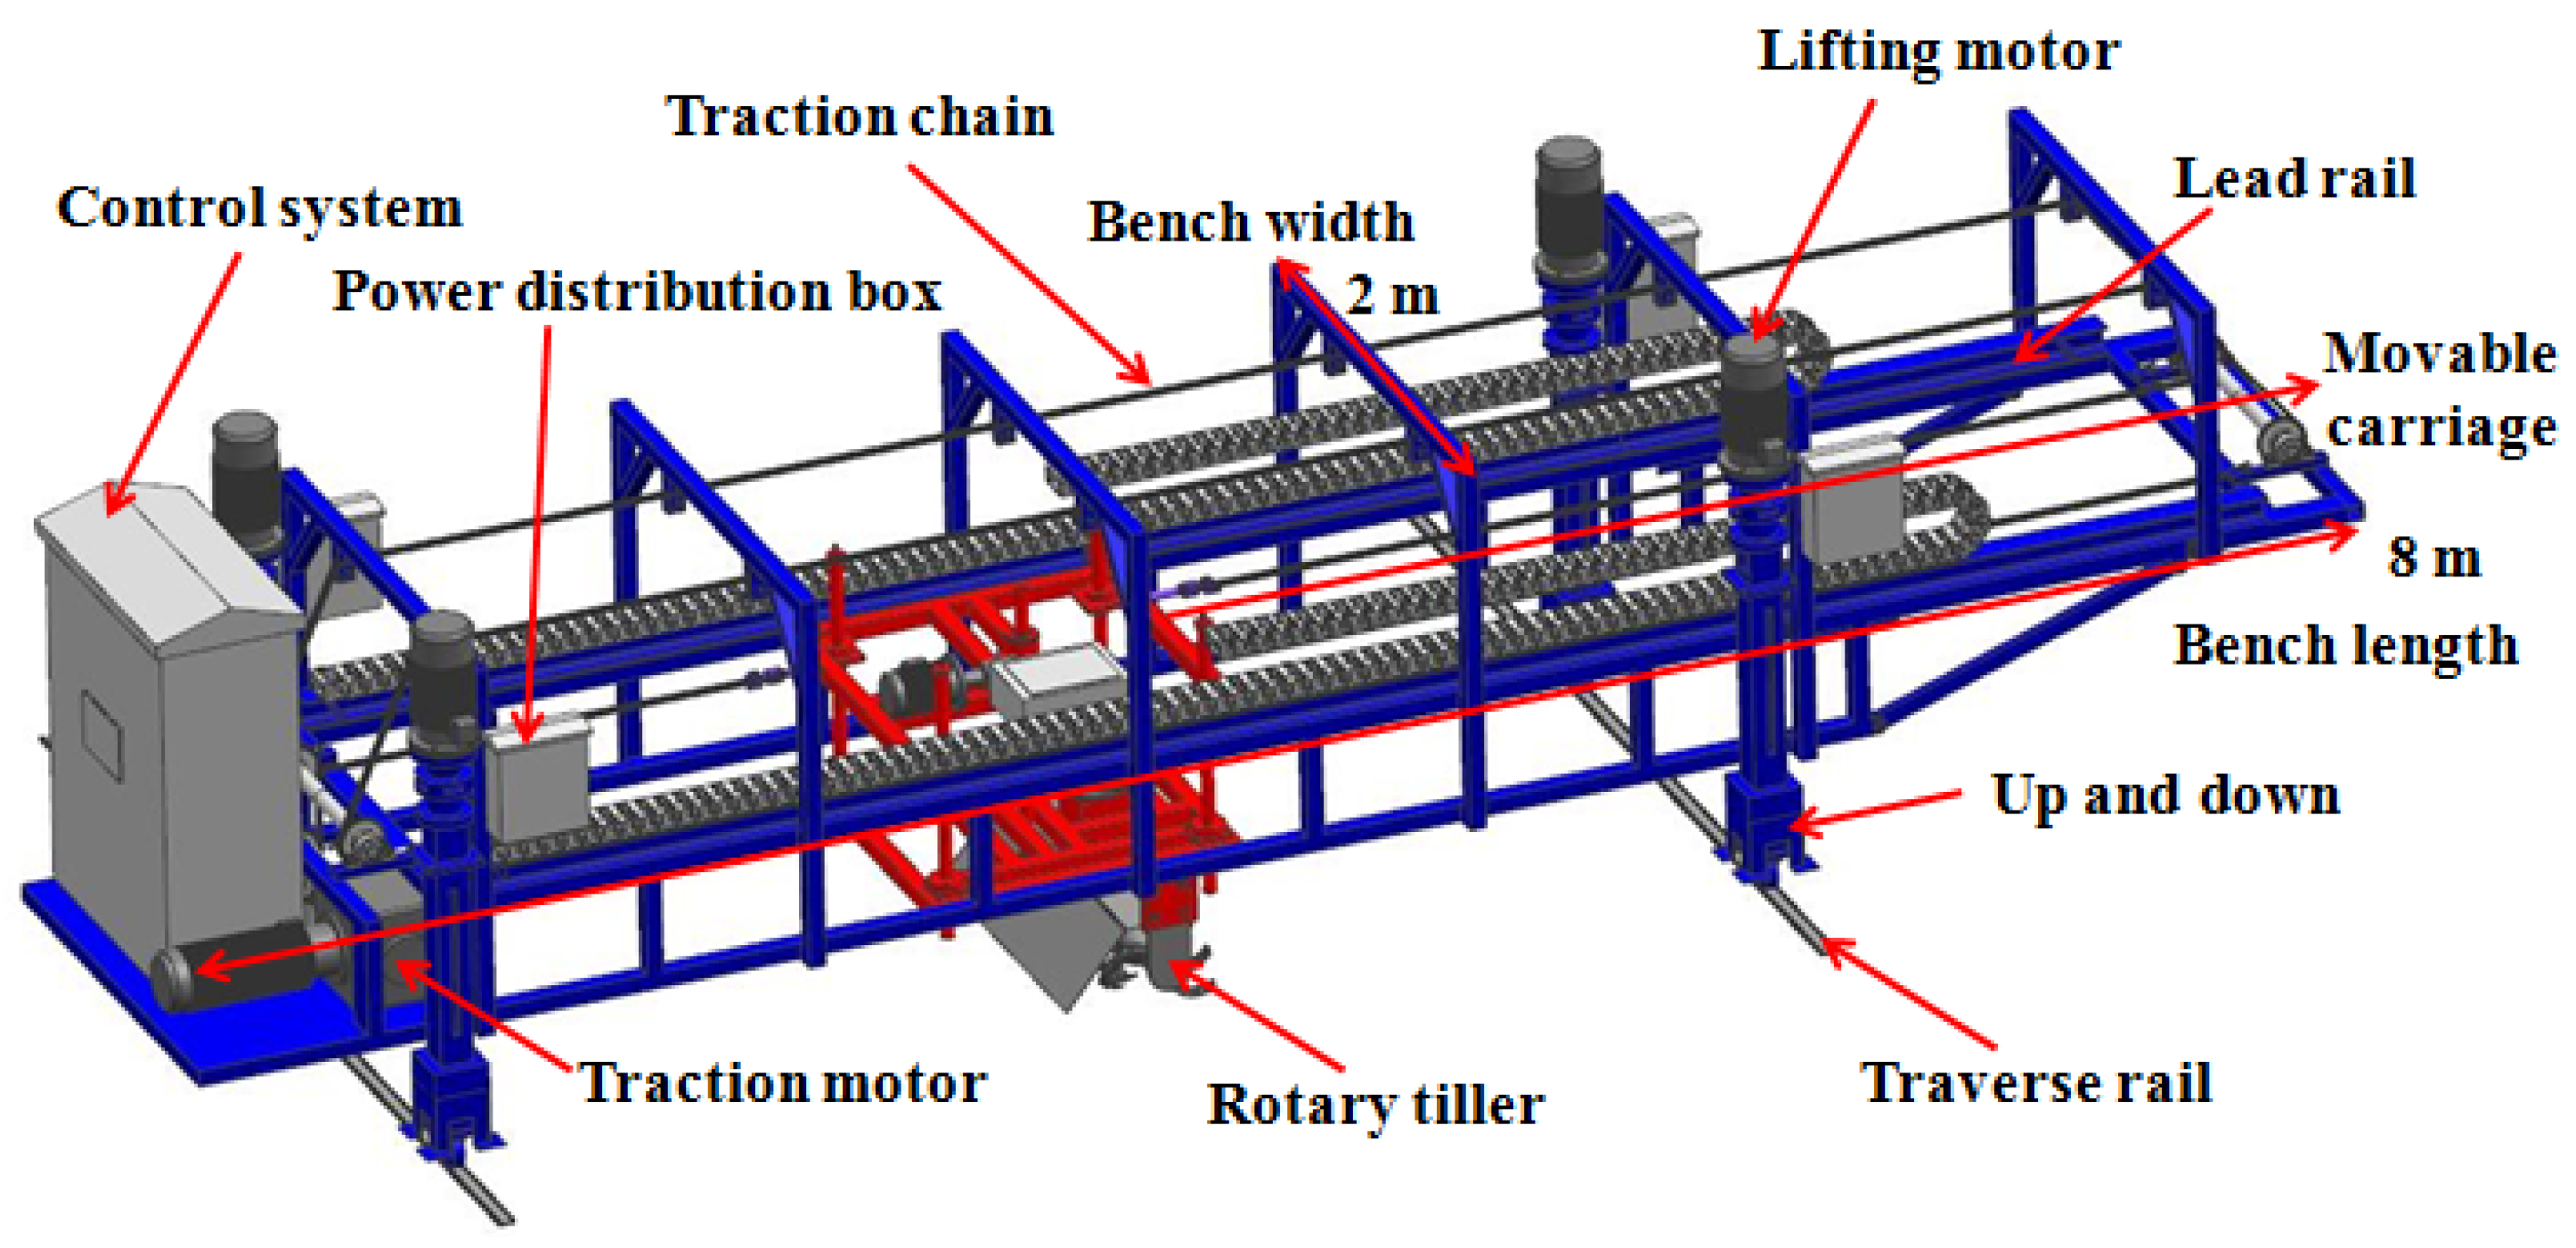
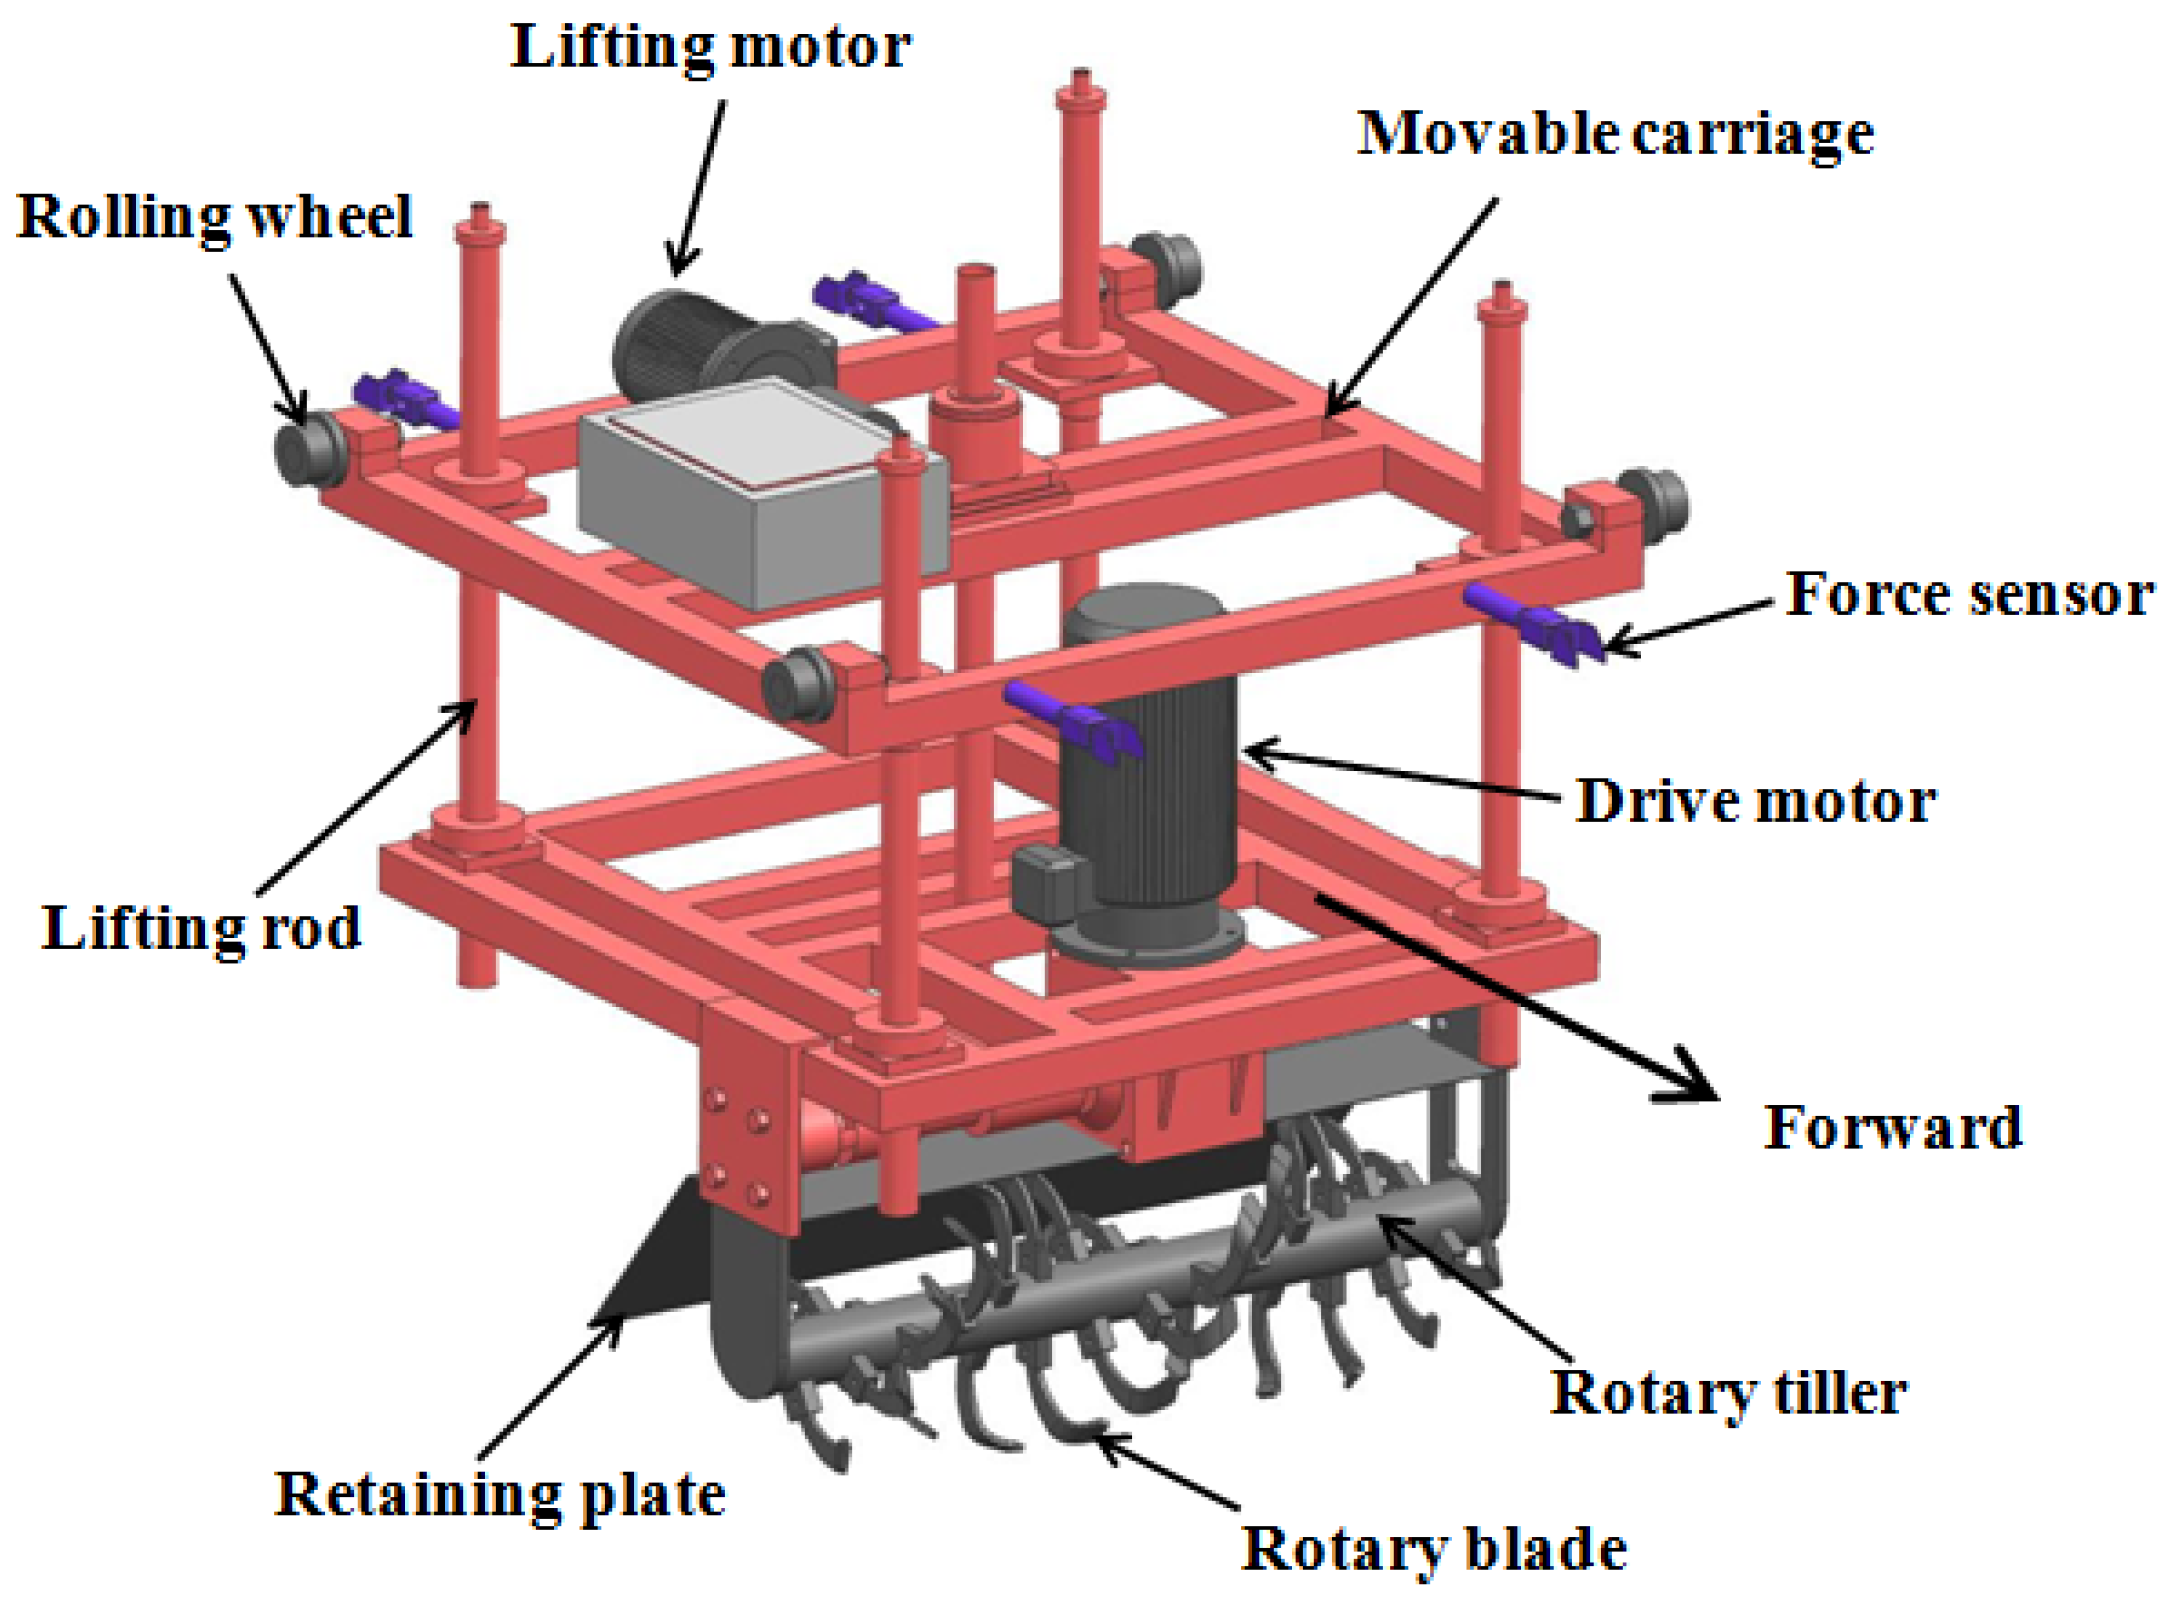
2.1. Description of the Test Bench and Tillage Tool

A safe and easy to operate multifunctional field-testing bench was developed for this study. Its main features include a movable carriage, rotary tiller, traction motor, lifting motor, electric generator, power distribution box, and control system. The rectangular steel tubes of various sizes were welded to construct an 8000 mm-long and 2000 mm-wide test bench (Figure 1). The movable carriage is transported on twin lead rails with an adjustable speed of 0.05–1 m s−1. A traction motor and four lifting motors drive the carriage to move forward and backward and up and down, respectively. The test bench was powered by a 13.5 kW electric generator, and there was a complex control system to complete power transmission and operation control.
A 225 mm-rotary-radius C-type blade (IT225) was selected due to its widespread application in the annual rice–wheat rotating fields managed in east China regions. The blades are fixed on the rotary tiller and move with the movable carriage (Figure 2). The moveable carriage in the test bench was equipped with a 6.3 kW drive motor for driving the rotary blades to rotate, and the rotary speed of the rotary tiller was adjustable from 0 to 600 rpm. The tillage depth, rotation rate, and forward speed are easy to adjust through a wireless control handle.

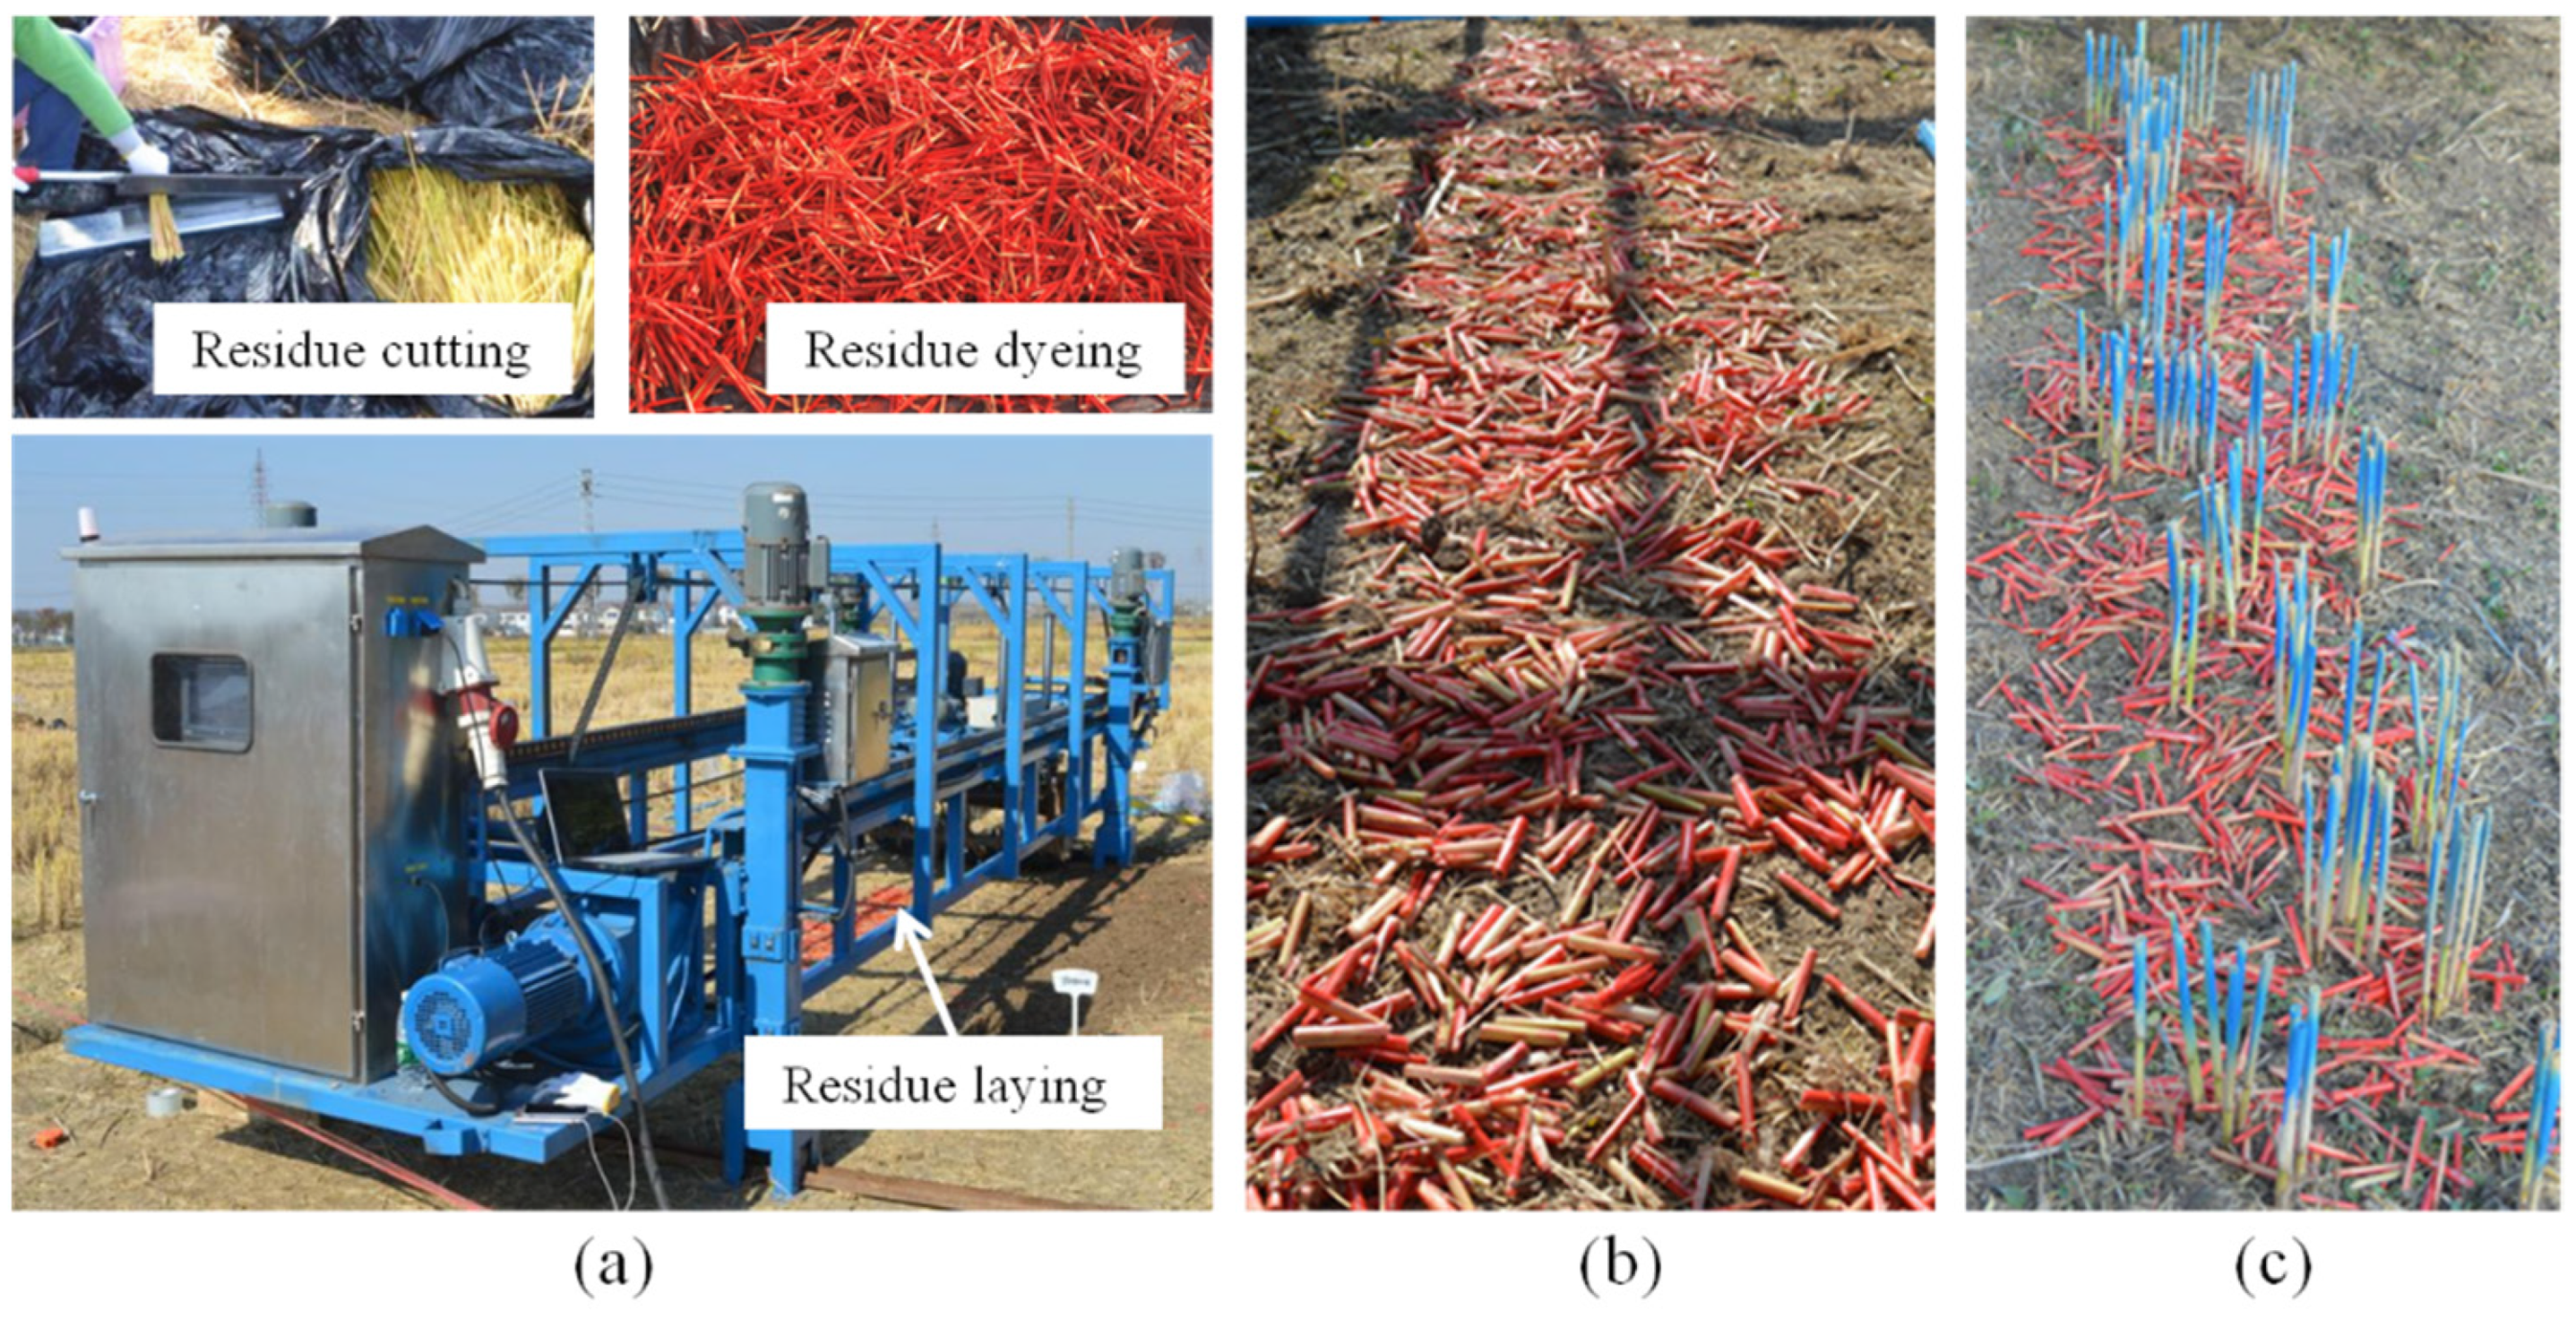
2.2. Residue Preparation

Before the field test, straw length, stubble height, and the amount of residue after rice harvest were observed and measured. The straw lengths were found to range from 30–150 mm, and the stubble heights ranged from 50 to 200 mm. The amount of total residue was 8012 kg ha−1. In this study, we wanted to determine an appropriate straw length and stubble height for residue incorporating. Therefore, straw lengths of 30, 50, 75, 100, 125, and 150 mm, and stubble height of 50, 100, 150, and 200 mm were selected for the experiments. The stems of rice residues were collected from the field and chopped into specific lengths with a chip cutter, and then laid evenly under the test plots after being dyed red (for better observation) with spray paint (Figure 3a). There are two methods of residue preparation; one is to lay the straw on the soil face after stubble removal (Figure 3b), and the other is to cut the stubble to the required height with a pair of scissors and then lay the straw on the soil face (Figure 3c). The amount of residue laid in the two ways was identical, which was 8012 kg ha−1, to simulate the actual field state after harvesting.

2.3. Experimental Design

In this study, three experiments were carried out to investigate the effect of residue parameters (straw chopping length and stubble height) and rotary speed on residue burying and residue spatial distribution. The purpose of experiment 1 was to study the effect of straw chopping length on residue incorporation by rotary tillage. The data on residue burying and residue spatial distribution were acquired using rotary tillage with six straw lengths. A rotary tillage operation with rotary speed of 280 rpm and forward speed of 0.5 m s−1 was implemented in the experiment.
The purpose of experiment 2 was to explore the effect of stubble height on residue burying and residue spatial distribution using the four straw mixtures. Residue mixture 1 (M1) consisted of 50 mm-high stubble and 50 mm-long chopping straw. Residue mixture 2 (M2) consisted of 100 mm-high stubble and 50 mm-long chopping straw. Residue mixture 3 (M3) included 150 mm-high stubble and 50 mm-long chopping straw and residue mixture 4 (M4) comprised 200 mm-high stubble and 50 mm-long chopping straw. Each mixture had 8012 kg ha−1 of residue cover, and the operation parameters were the same as in experiment 1.
The purpose of experiment 3 was to investigate the effect of rotary speed on residue burying and residue spatial distribution. The straw length of 50 mm, forward speed of 0.5 m s−1, and three rotary speeds of 240, 280, and 320 rpm were selected in this experiment. The tillage depth was 100 mm in all three tests, and each test was repeated three times. There were 39 field plots in three experiments, and each were 2 m long and 0.5 m wide.

2.4. Measurements

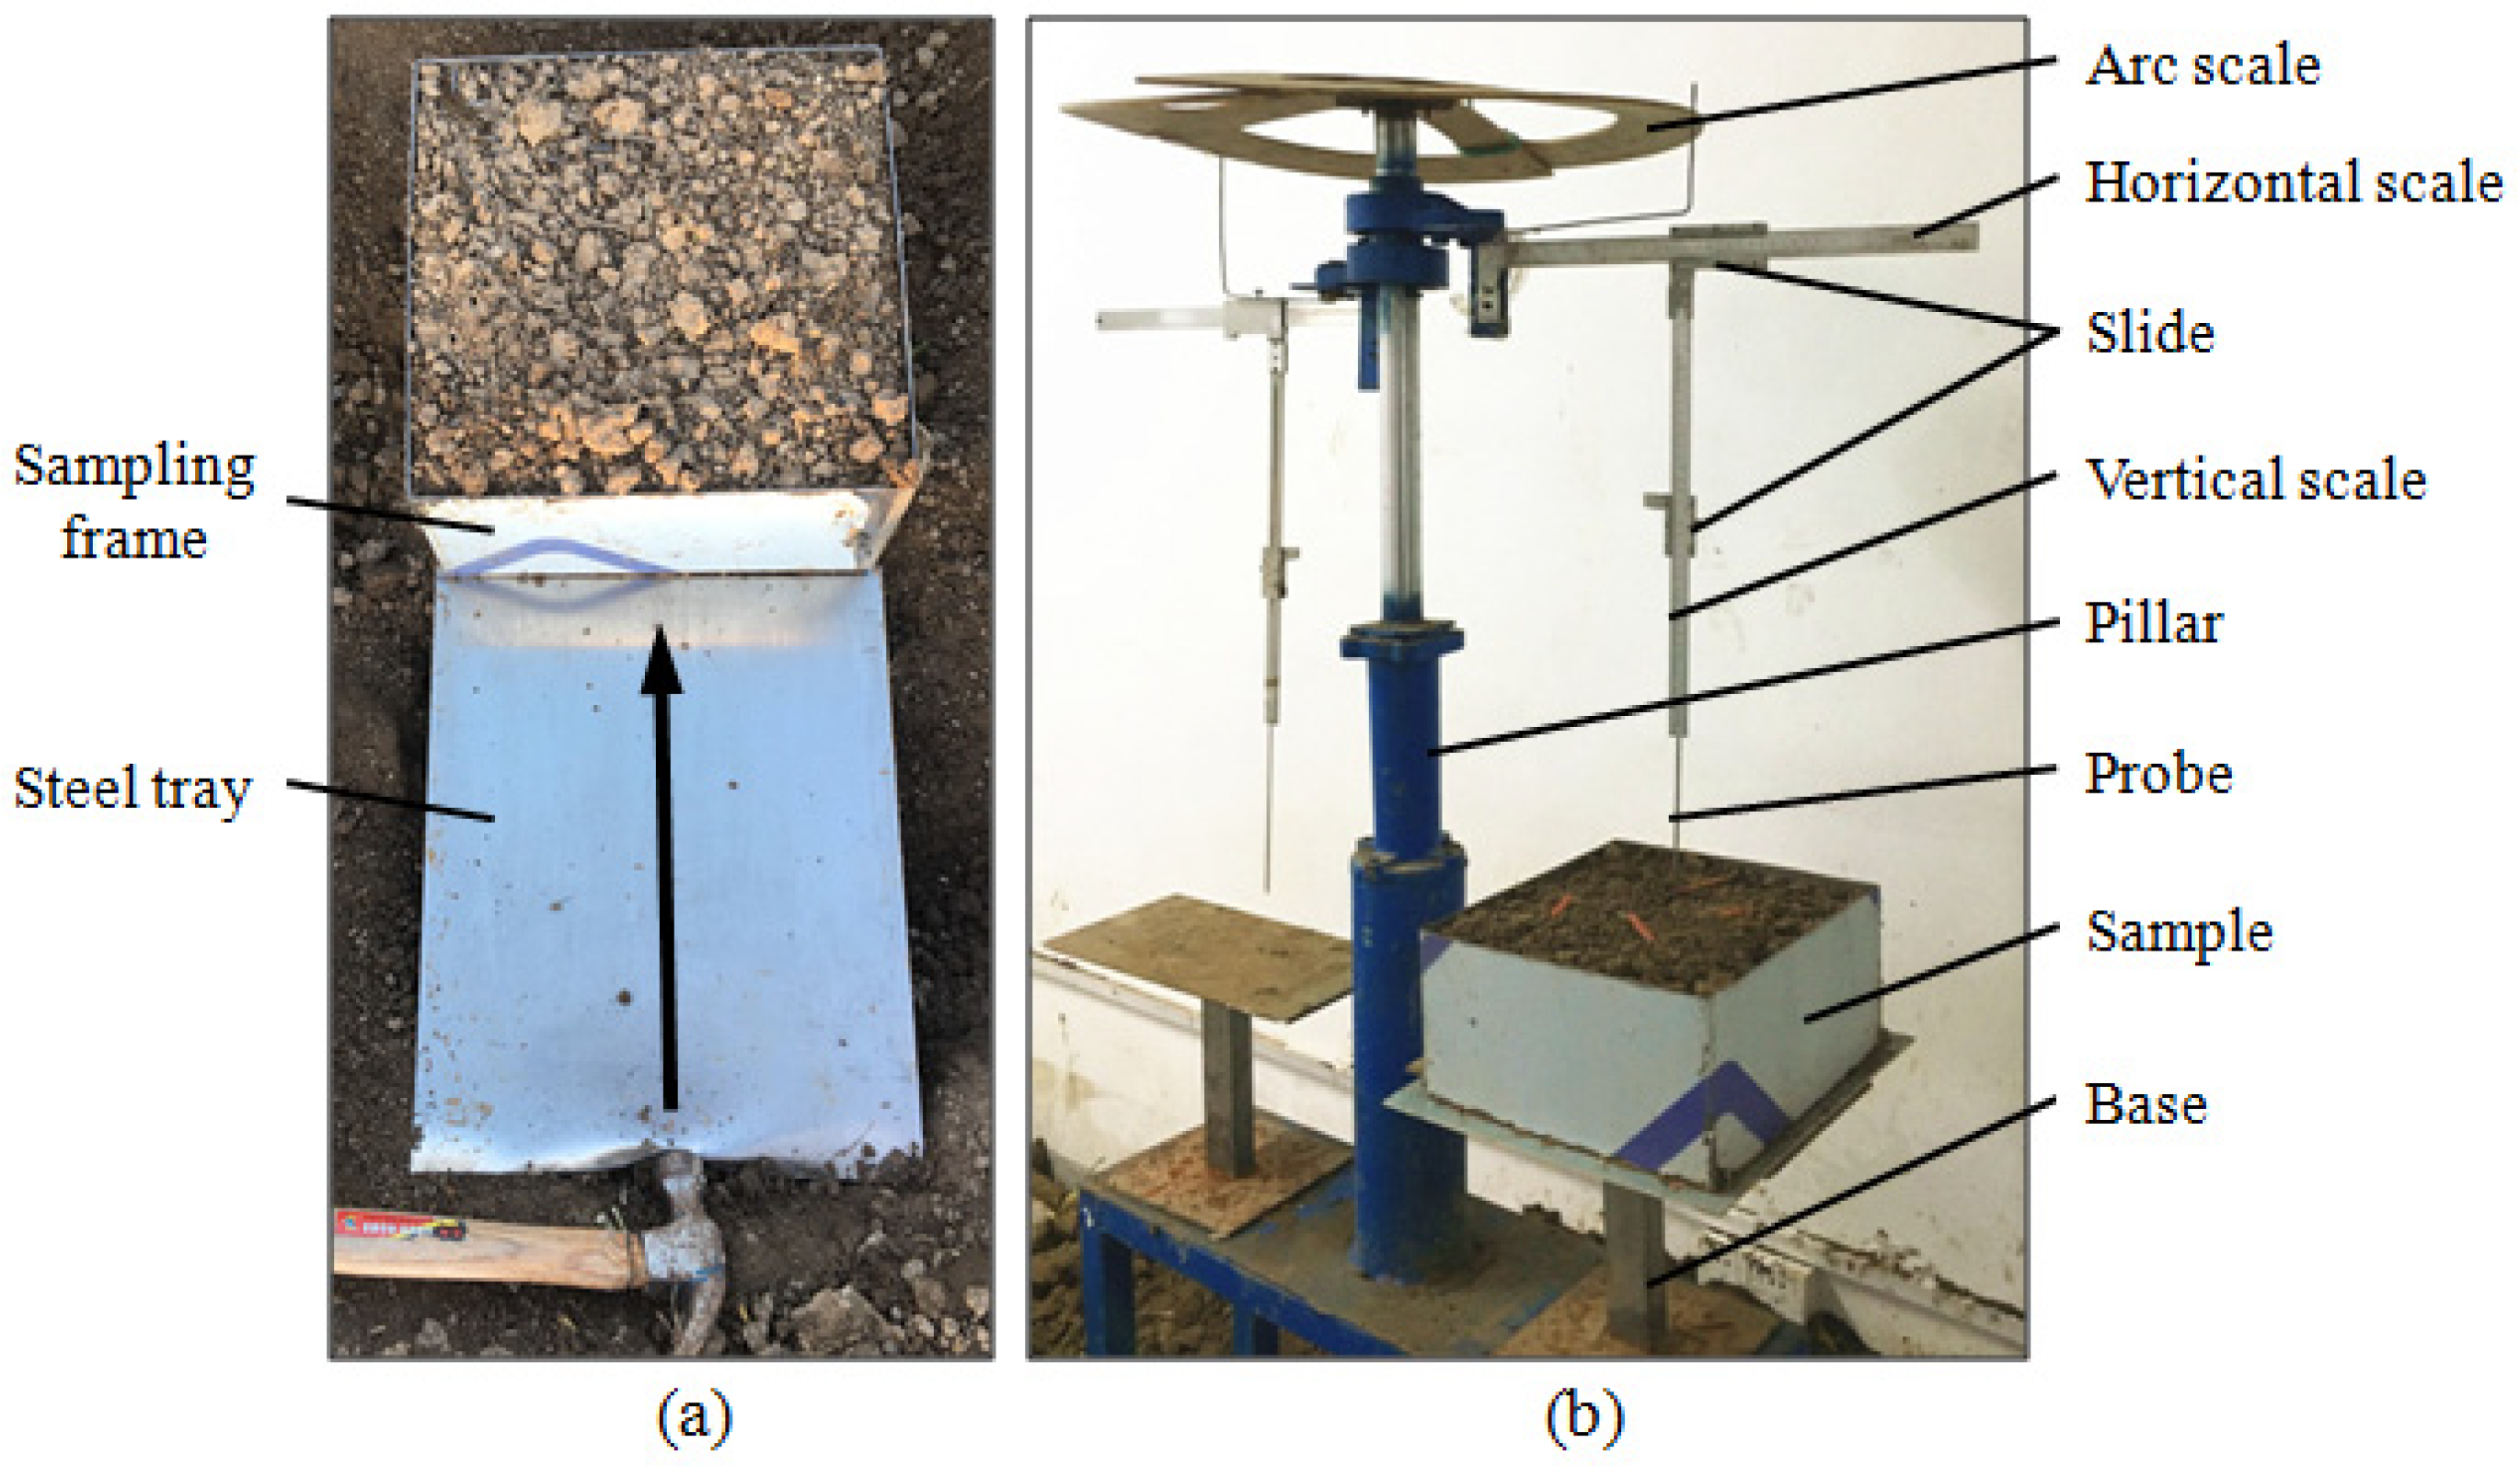
2.4.1. Residue Burying

The burying of residue is an important index to evaluate the quality of residue incorporation. The higher burying rate of residue implies a better quality of residue incorporation. The burying rate of residues was calculated according to the equation proposed by Fang [32]:
N = m q m h m q × 100 %
where mq (kg) is the total weight of residue before tillage and mh (kg) is the total weight of residue after tillage.

2.4.2. Residue Distribution

  • (A) Sample collection and measurement
In the process, samples of soil–residue mixture were collected from the surface after rotary tillage, and the residue spatial coordinates were measured. Considering the average depth of the soil layer after tillage was about 150 mm, we made many steel sampling frames with dimensions of 300 × 300 × 150 mm. For collecting our sample, a sampling frame was placed in the middle of the tilled area and then we knocked it completely into the soil layer with a steel hammer. Finally, the sample of soil–residue mixture was taken out after a steel tray was embedded to the root of the sampling frame (Figure 4a). After all samples were collected in this way, they were taken back to the laboratory for further measurement and analysis.
A residue spatial coordinate digitizer was developed to measure the residue spatial position and to obtain the data of residue distribution uniformity. It is mainly composed of four parts: an arc scale, a horizontal scale, a vertical scale and a pillar (Figure 4b). The horizontal scale and vertical scale are fixed on the pillar, and above them is the arc scale. In the horizontal direction, the arc rotation arc and horizontal distance can be measured by rotating the horizontal scale along the pillar and moving along the slider. In the vertical direction, we also can obtain the vertical distance according to the slider position in the vertical scale. Because there was less residue bending after tillage, since experimental materials were the main stalk of paddy residue with high moisture content and short length, it was reasonable to use the coordinates of the residue head and tail instead of the position of the whole residue. Therefore, the digitizer is reliable enough to ascertain the location of the residue by measuring the coordinates of residue.
  • (B) Analysis of residue distribution
Firstly, the residue absolute coordinates were saved in the *. IBL format (a coordinate point file format) and inputted into the 3D software Pro/Engineer 5.0 (PTC, America) to create the 3D model of residue distribution automatically (Figure 5a). Secondly, a multiscale segmentation of the 3D model of residue spatial distribution was conducted to analyze the uniformity of residue distribution. The model was not only divided with a 50 mm-length scale in the depth direction (Figure 5b), but also segmented with a 50 × 50 × 50 mm-cube scale in the overall direction (Figure 5c). Finally, the total length of residue in each segment area was calculated by the 3D software.
The uniformity of residue distribution could be accurately analyzed by the coefficient of variation of residue total length (CV) in each segment area, and the smaller the CV, the more uniform the residue distribution, which implies the better quality of residue distribution. The CV was calculated with the following equation:
C V = S D A V × 100 %
where SD is the standard deviation of residue total length and AV is the average value of residue total length.
The 3D model of residue spatial distribution was segmented into three layers on average in the depth direction, namely the upper layer (UL), the middle layer (ML), and the lower layer (LL). Total length of all residues in each layer under different treatments was calculated, and then the proportion of residue in each layer was analyzed to evaluate the uniformity of residue spatial distribution in the depth direction. A higher proportion of straw in ML and LL implies better residue distribution in the depth direction. The 3D model of residue spatial distribution was further divided into 108 small cubes in the overall direction, where the size of each cube was 50 × 50 × 50 mm. The CV in each cube was analyzed to evaluate the uniformity of residue distribution. It could easily be judged that the better quality of residue distribution in the overall direction was due to the smaller CV in each cube.

2.5. Data Analysis

The data were subjected to statistical analysis by one-way factorial analysis of variance (ANOVA) using IBM-SPSS Statistics 22 software (IBM Corp., Armonk, NY, USA). Multiple comparisons were made to assess the difference among various treatments based on the least significant difference (LSD at p = 0.05).

3. Results and Discussion

3.1. Effect of Straw Length on Residue Burying and Distribution

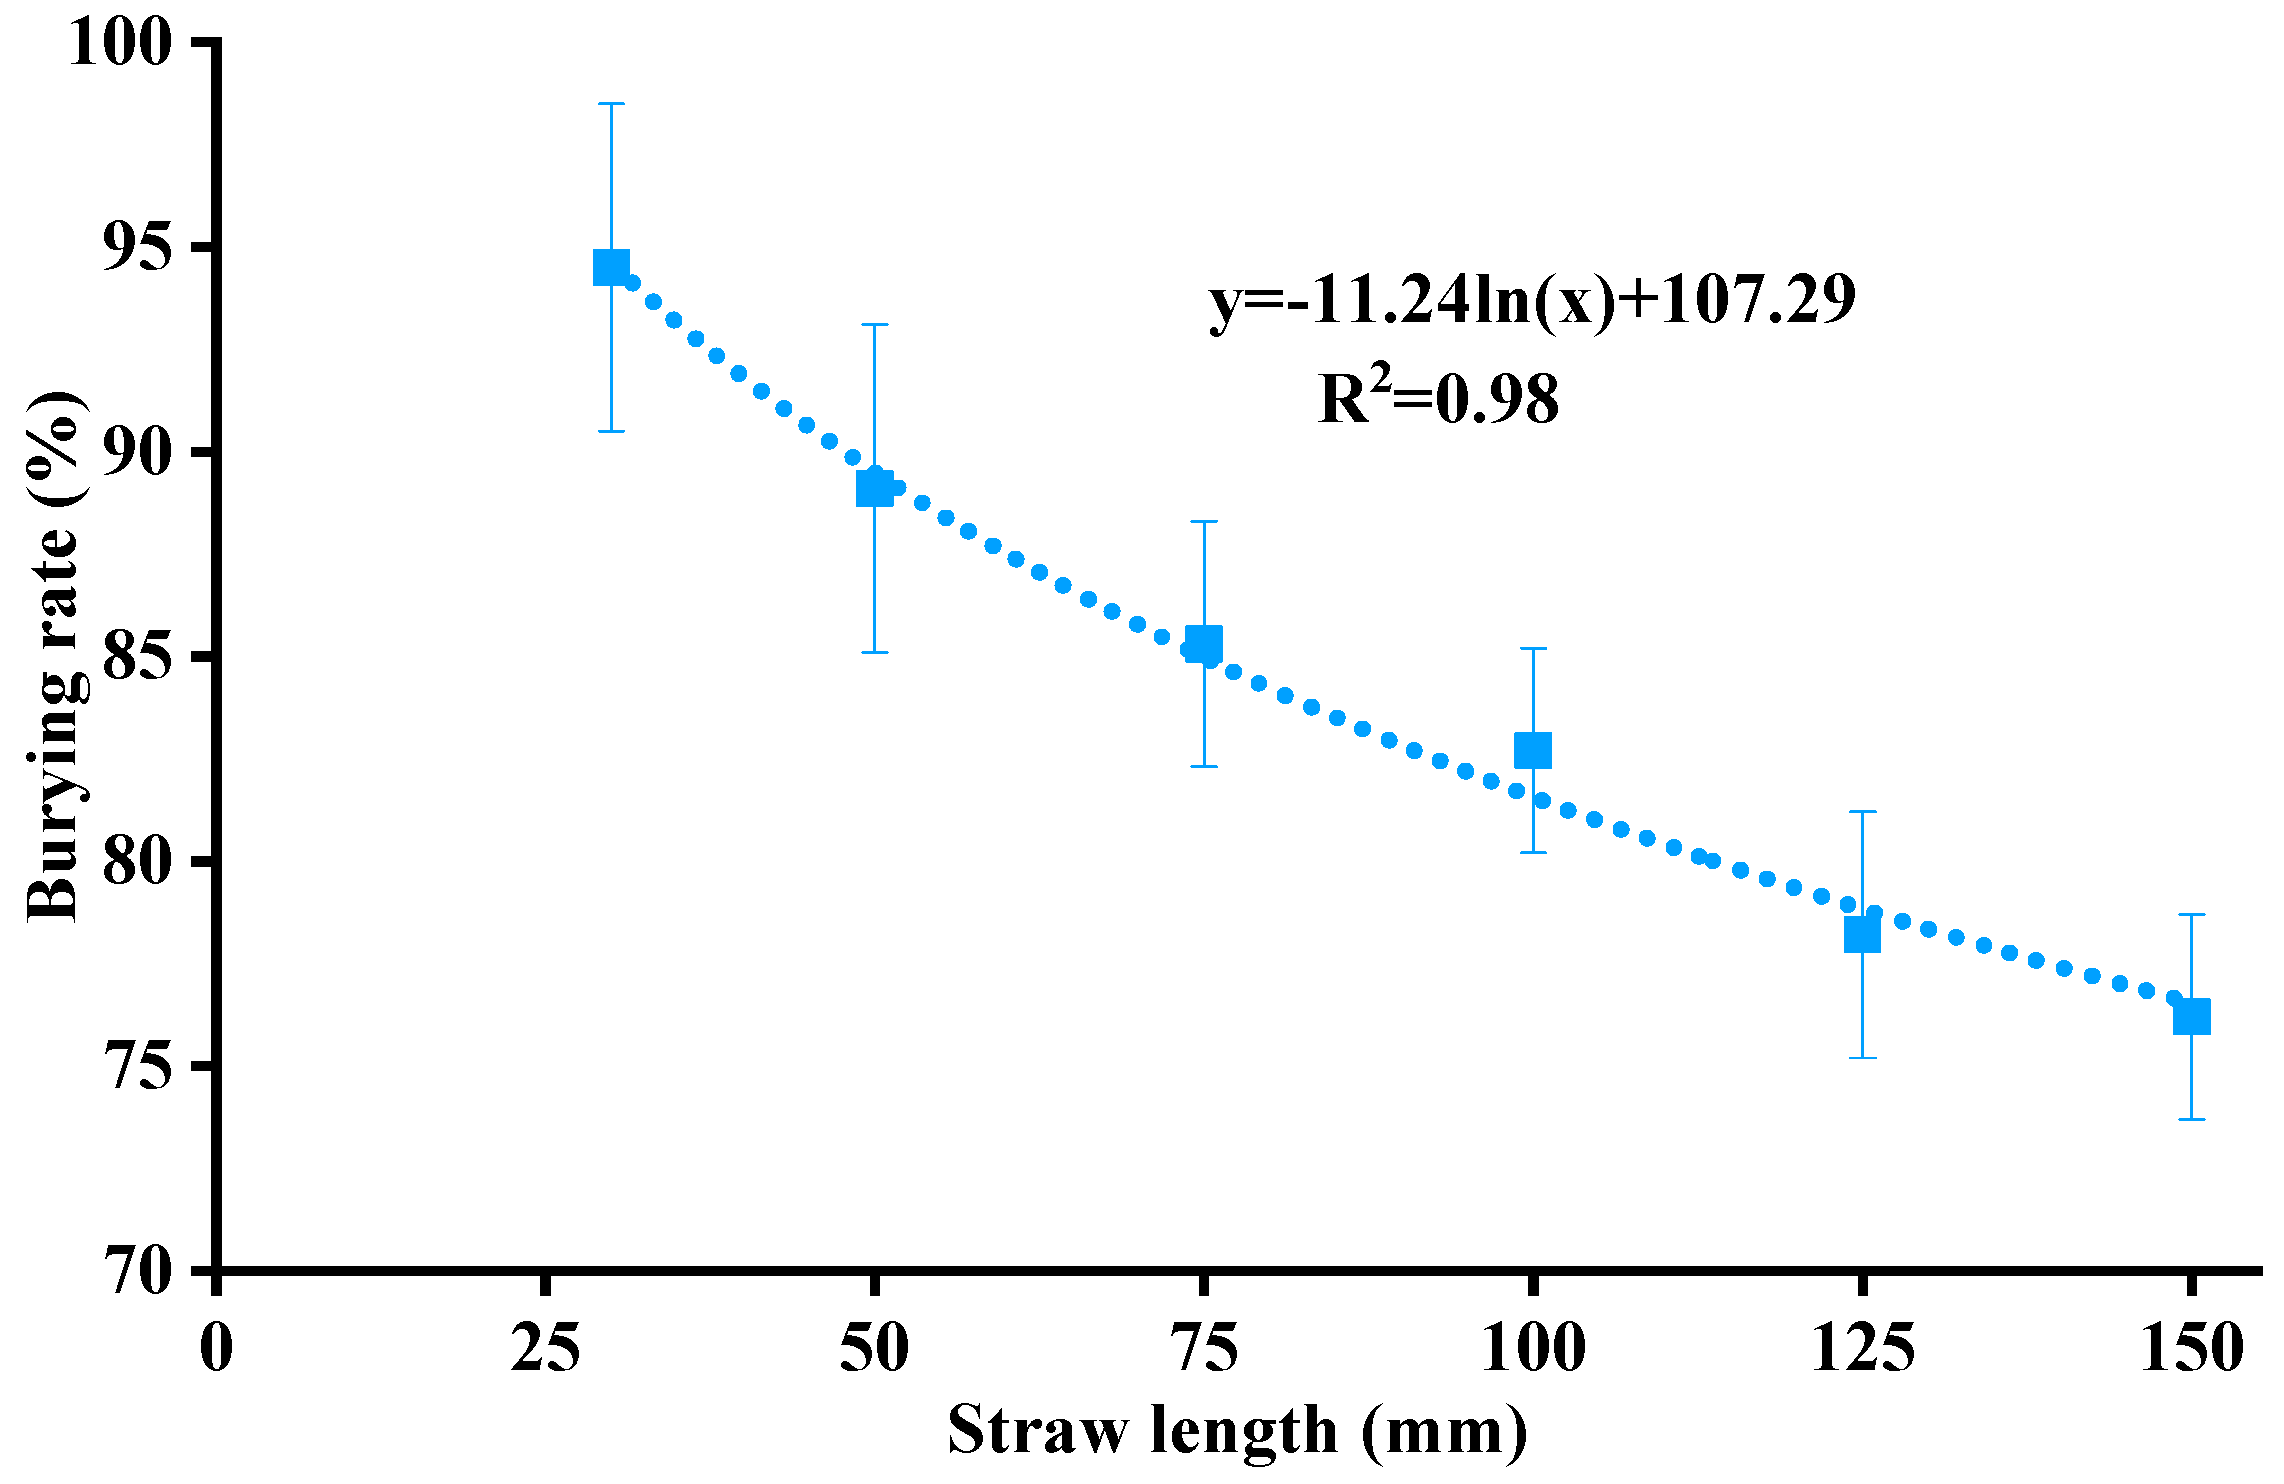
3.1.1. Residue Burying

According to the experimental results, residue burying rate decreased with straw length, and showed a nonlinear logarithmic relationship (Figure 6). The results showed that most of the residue could be buried in the soil by rotary tillage in the length range of straw from 30 to 150 mm. However, there were great differences in residue burying rate with different straw chopping lengths after rotary tillage. Under the straw length of 30 mm, there was a good burying effect, and the burying rate was as high as 94.5%. Yet, there was an unfavorable burying effect under 125 and 150 mm, and the burying rates were only 78.2% and 76.2%, respectively. Therefore, short residue is more conductive to residue incorporation than long residue.

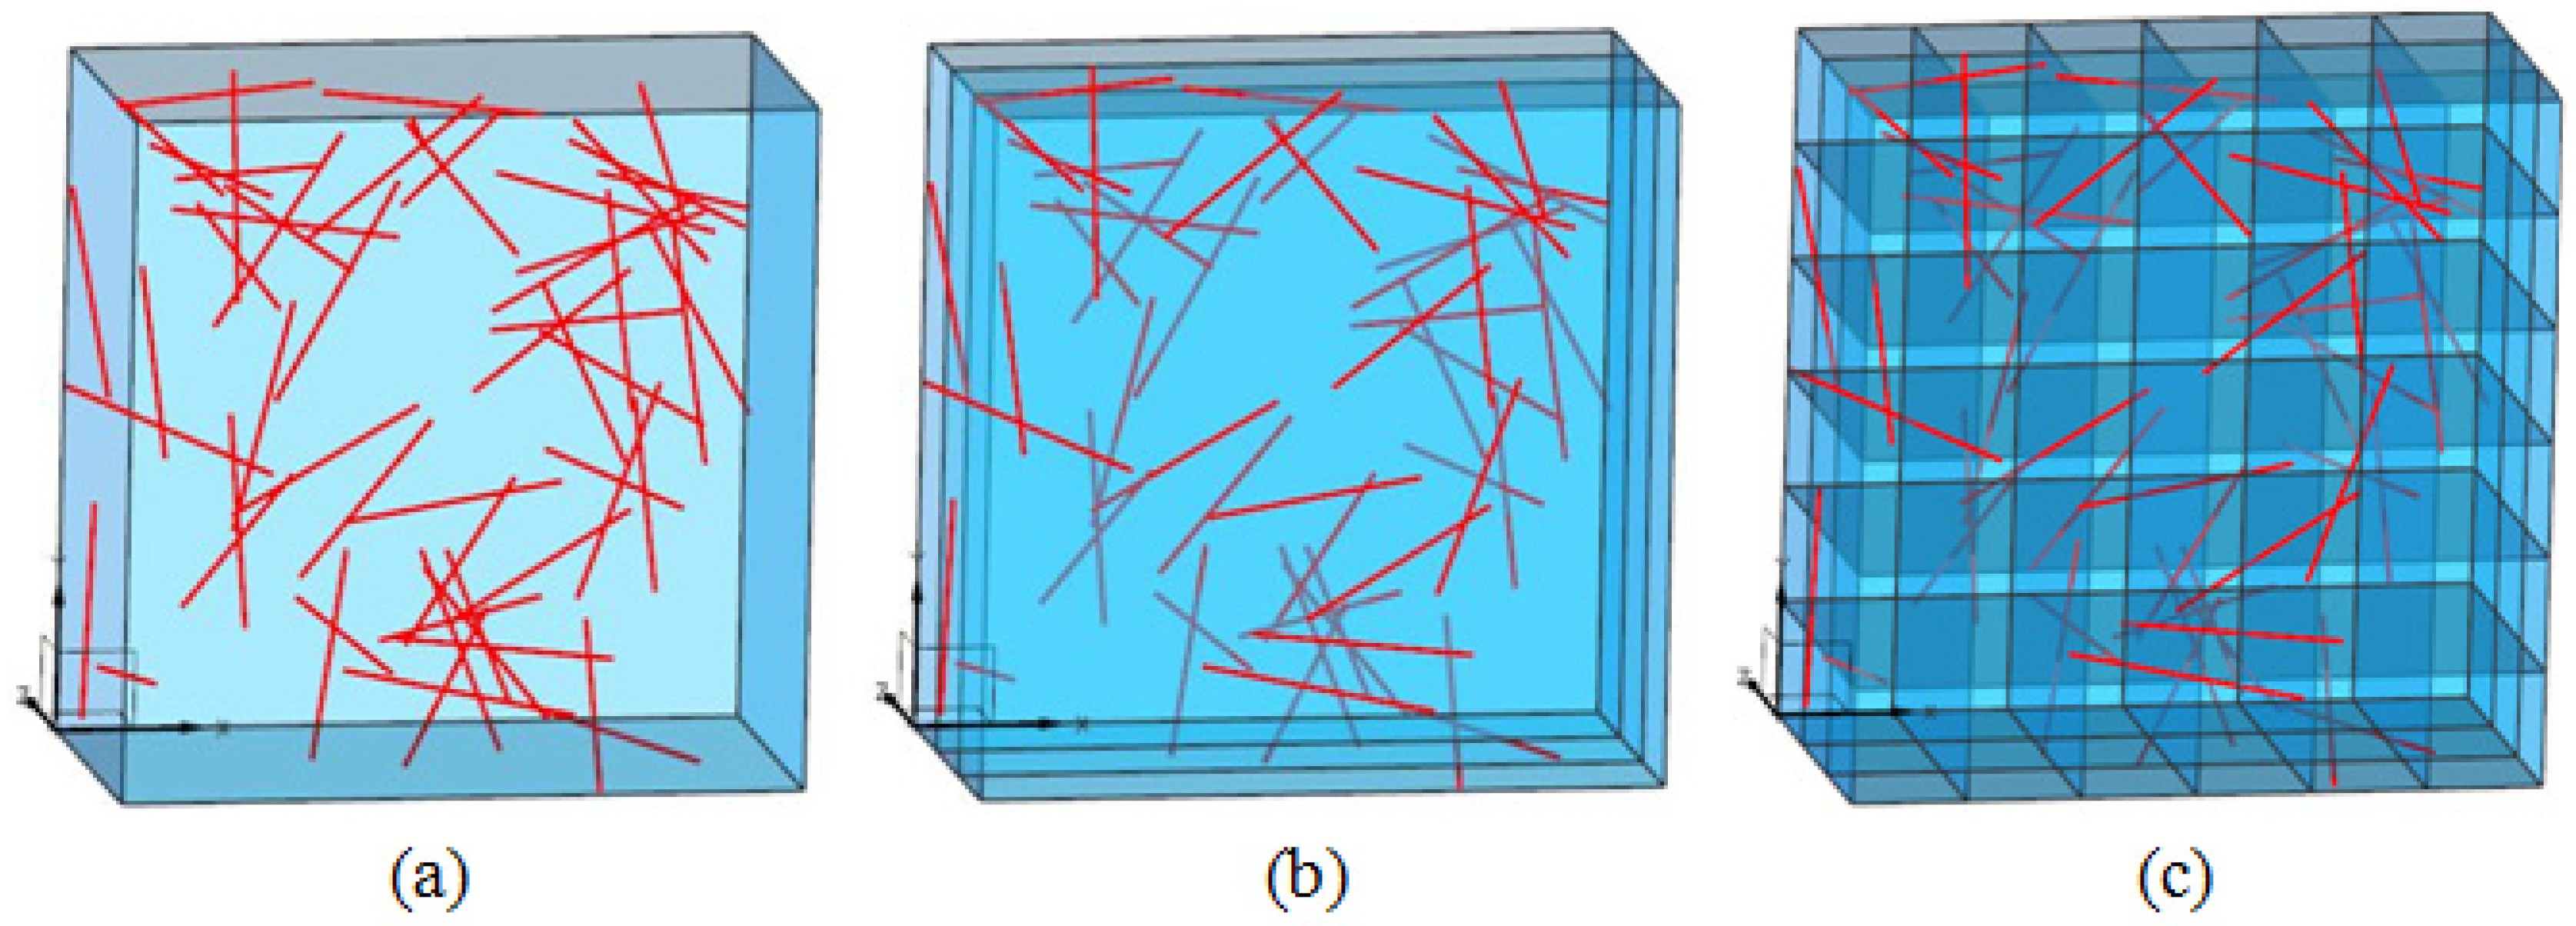
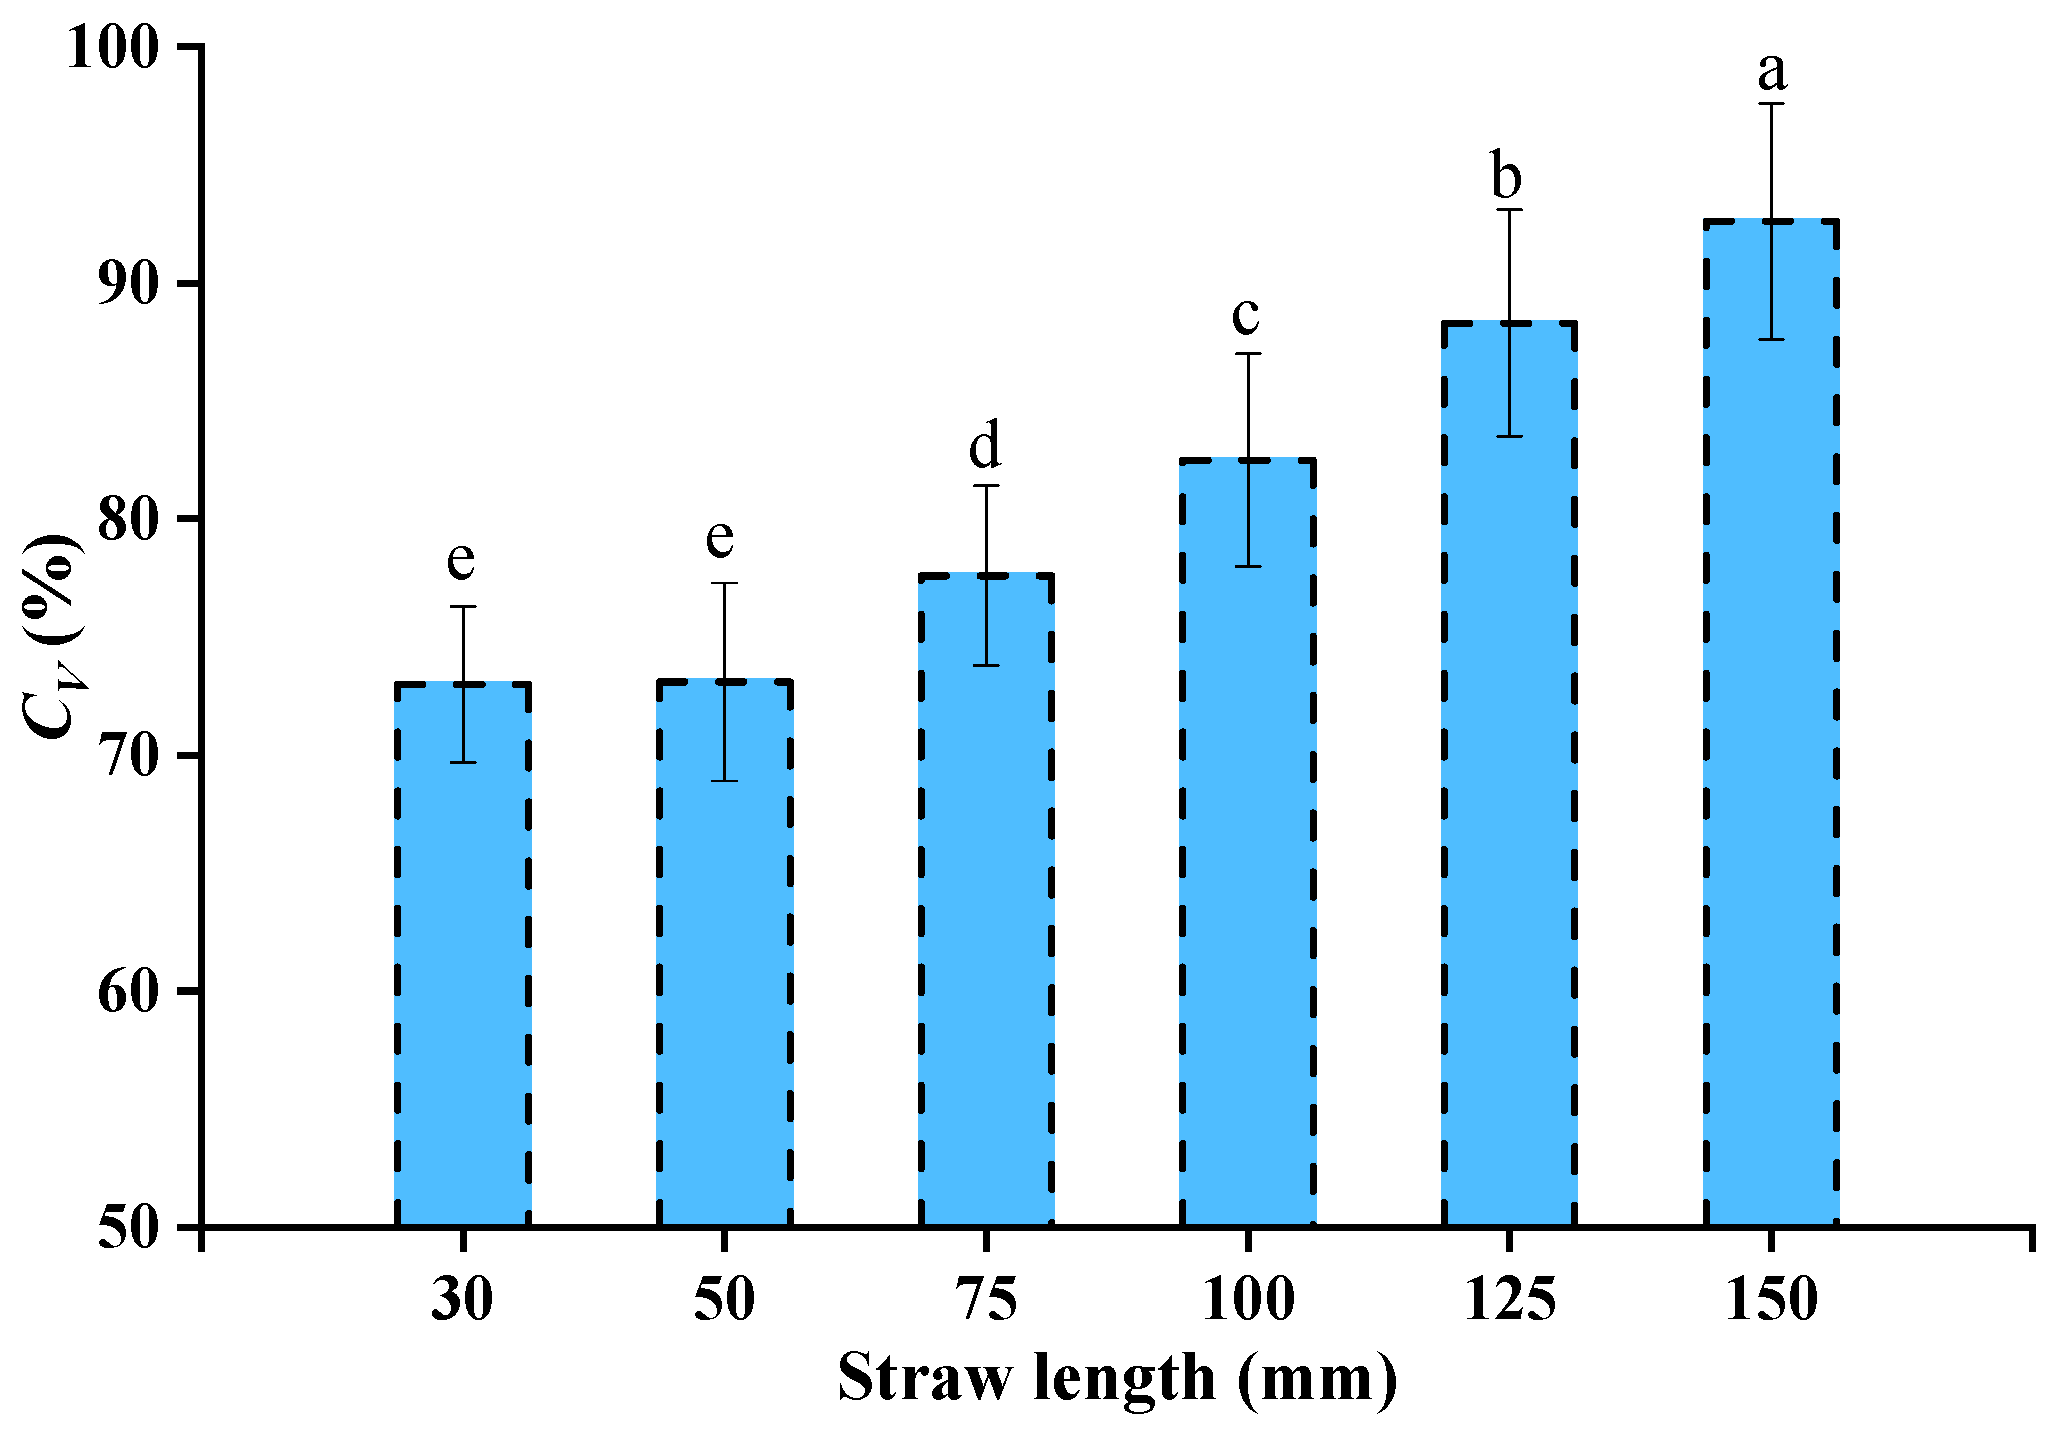
3.1.2. Residue Distribution

The total length and proportion of residue in each layer at different straw chopping lengths are listed in Table 2. The results indicate that the longer the residues were, the more difficult it was to incorporate them into the soil by rotary tillage. The proportion of residue in the ML and LL decreased gradually with the increase in straw chopping length. The proportions of residue in the UL under the straw lengths of 125 and 150 mm were 42.3% and 47.3%, respectively. Almost half of the residue was distributed in the sowing depth layer of 0–50 mm, which potentially would cause straw overhead wheat seeds (straw hair pinning) and blocking of the sowing tools (furrow openers, coulters, etc.). So, these two treatments are not suitable for high-quality seeding operations. In contrast, the uniformity of residue spatial distribution under the straw lengths of 30 and 50 mm were better in all three layers, and the proportion of residue in the LL were 34.7% and 32.4%, respectively, which was conducive to residue decomposition and wheat sowing. In addition, the proportion of residue under the straw lengths of 125 and 50 mm in the LL were only 17.5% and 11.9%, respectively, and most of the residue was distributed in the UL and ML. This finding indicates that the long residue was not easily incorporated in the LL, and the main reason was that long residue had a small moving distance in the depth direction after rotary tillage.
The quality of residue distribution could be evaluated comprehensively through further dividing the 3D model of residue into small cubes in the overall direction. The quality of residue distribution in the overall direction under different straw lengths is as shown in Figure 7. The results indicate that with the increase in straw length, the CV in each cube increased gradually. The CV in each cube under the straw lengths of 30 and 50 mm were lower, at 72.9% and 73.1%, respectively. In contrast, the CV in each cube under the straw length of 150 mm was the highest, at 92.6%. According to these experimental results, it was suggested that the long residue should be chopped into the short residue as far as possible by the harvester while considering low-energy consumption, which could improve the spatial distribution quality of the residue after rotary tillage.

3.2. Effect of Stubble Height on Residue Burying and Distribution

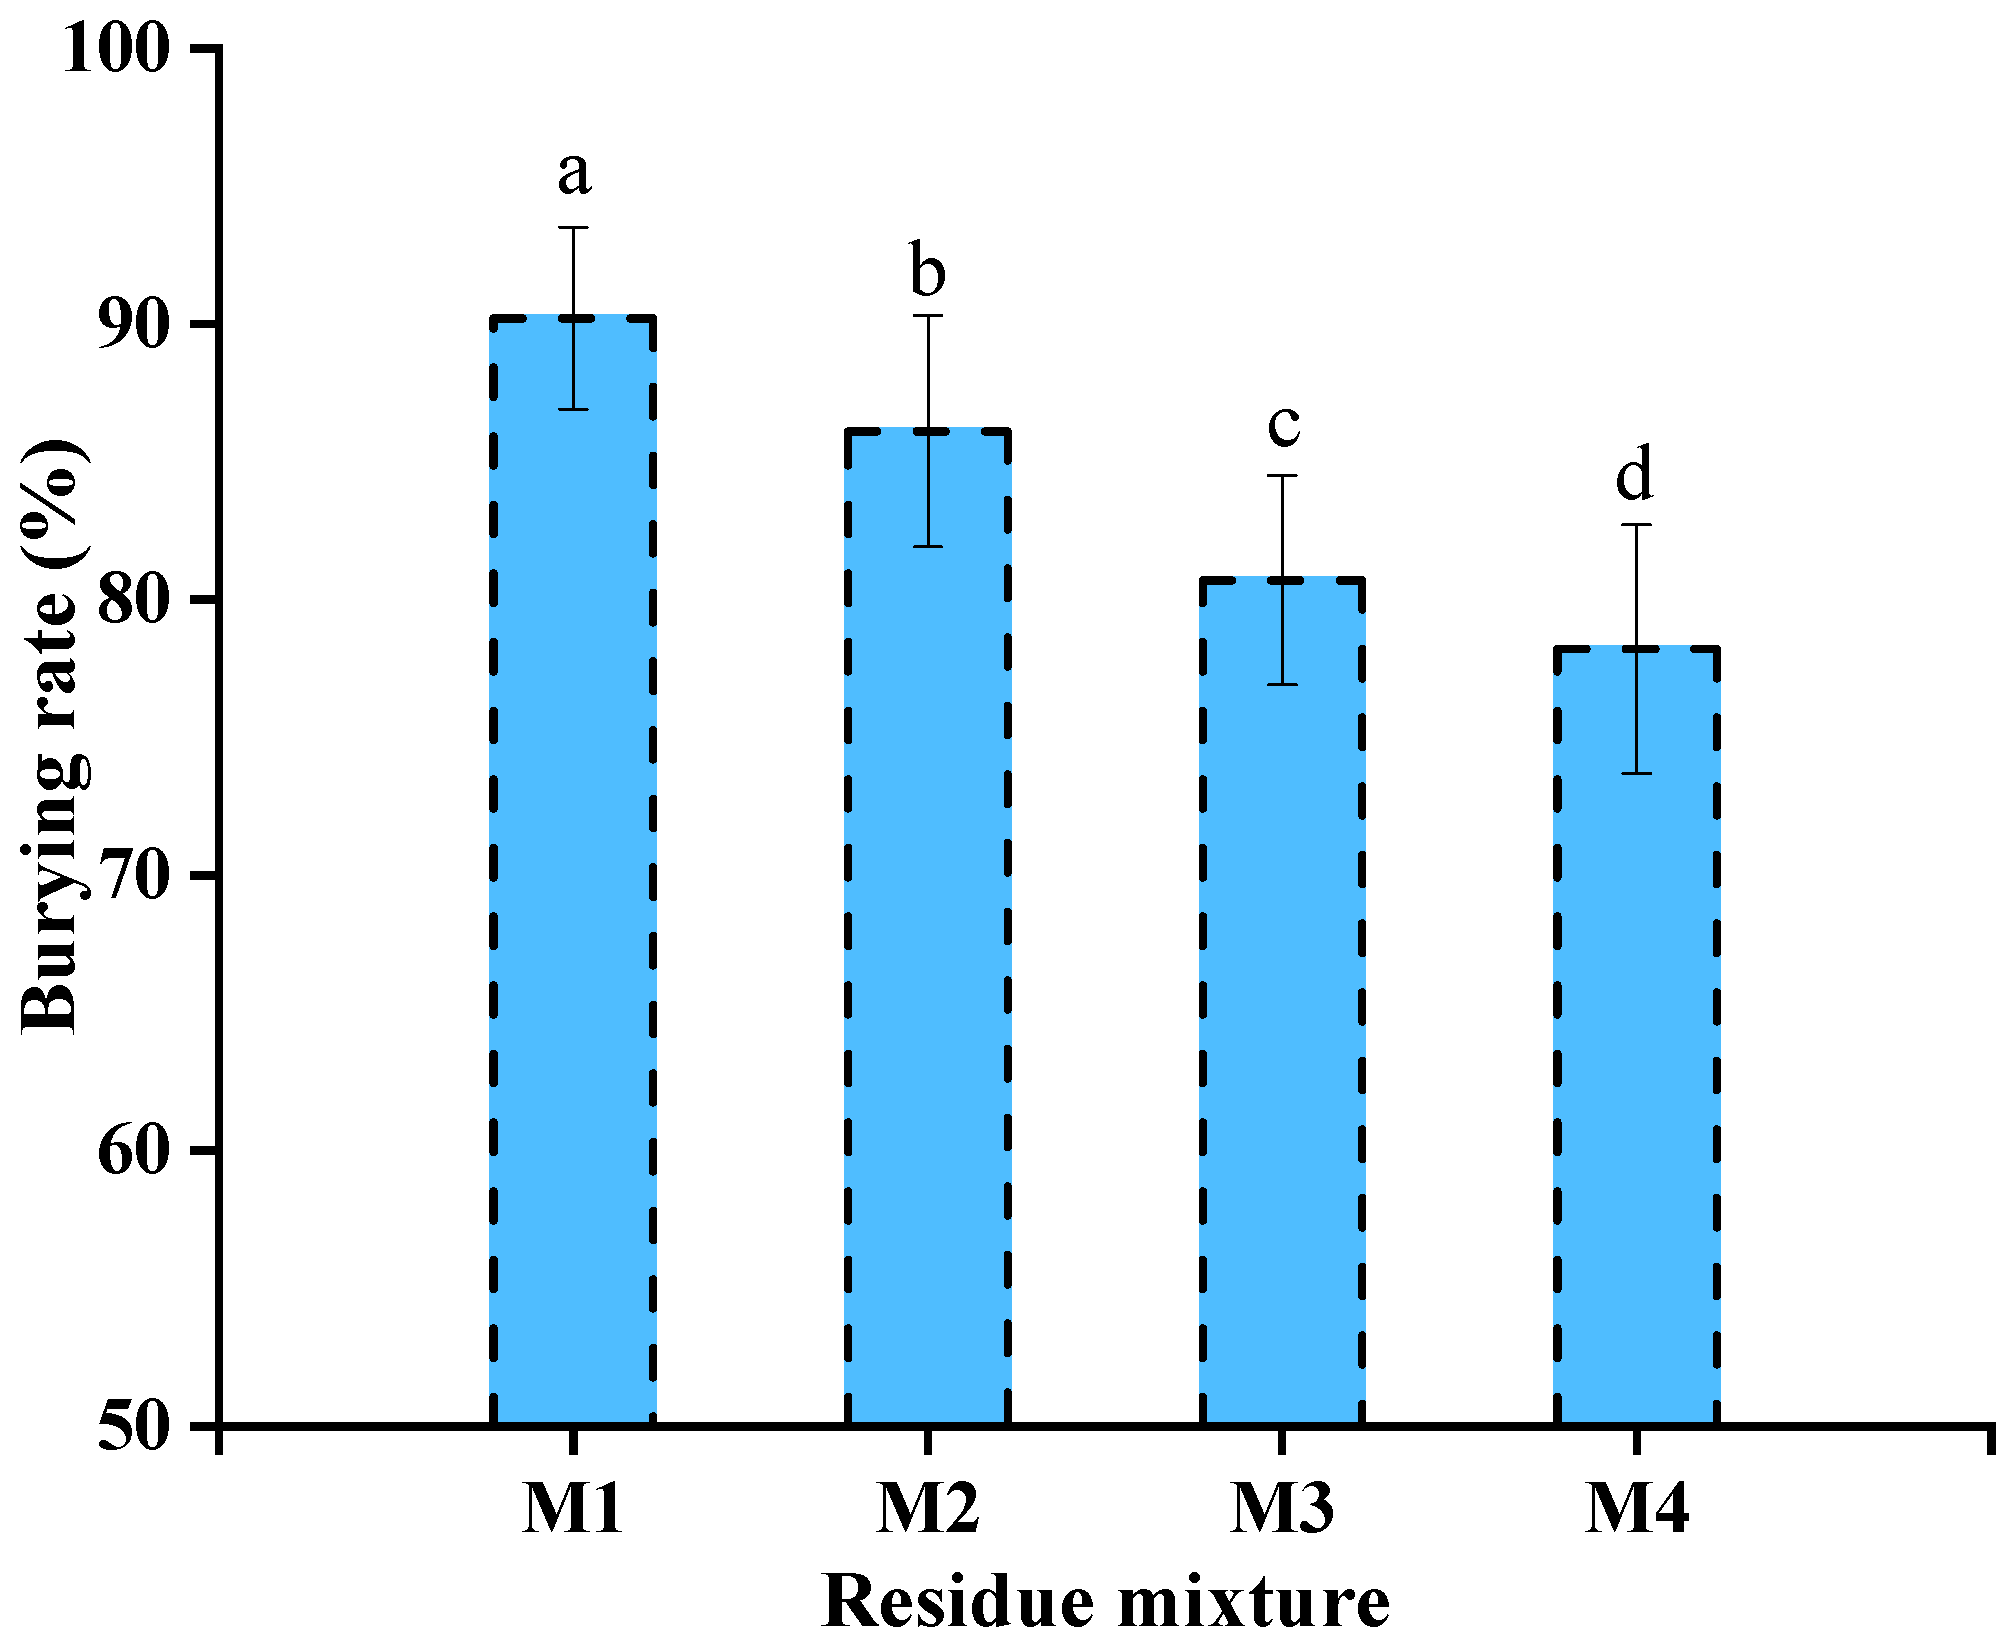
3.2.1. Residue Burying

Figure 8 shows the relationship between burying rate and four residue mixtures. The height of stubble had a significant impact on residue burying. With the increase in stubble height, the residue burying rate decreased gradually with the same straw chopping length. Under the stubble heights of 50 and 100 mm, there was a high burying effect, and the burying rate in M1 and M2 were 90.2% and 86.2%, respectively. However, there was an unfavorable burying effect under the stubble heights of 150 and 200 mm, and the burying rates in M3 and M4 were only 80.7% and 78.2%, respectively. For four residue mixtures used under rotary tillage condition, the stubble height of 100 mm was a dividing point. When stubble height was less than 100 mm, there was a high burying rate for residue incorporating into the soil by rotary tillage, and this is suitable for high-quality seeding operations. It is recommended to reduce the stubble height during harvester operation in order to obtain a high burying rate after straw incorporation by rotary tillage.

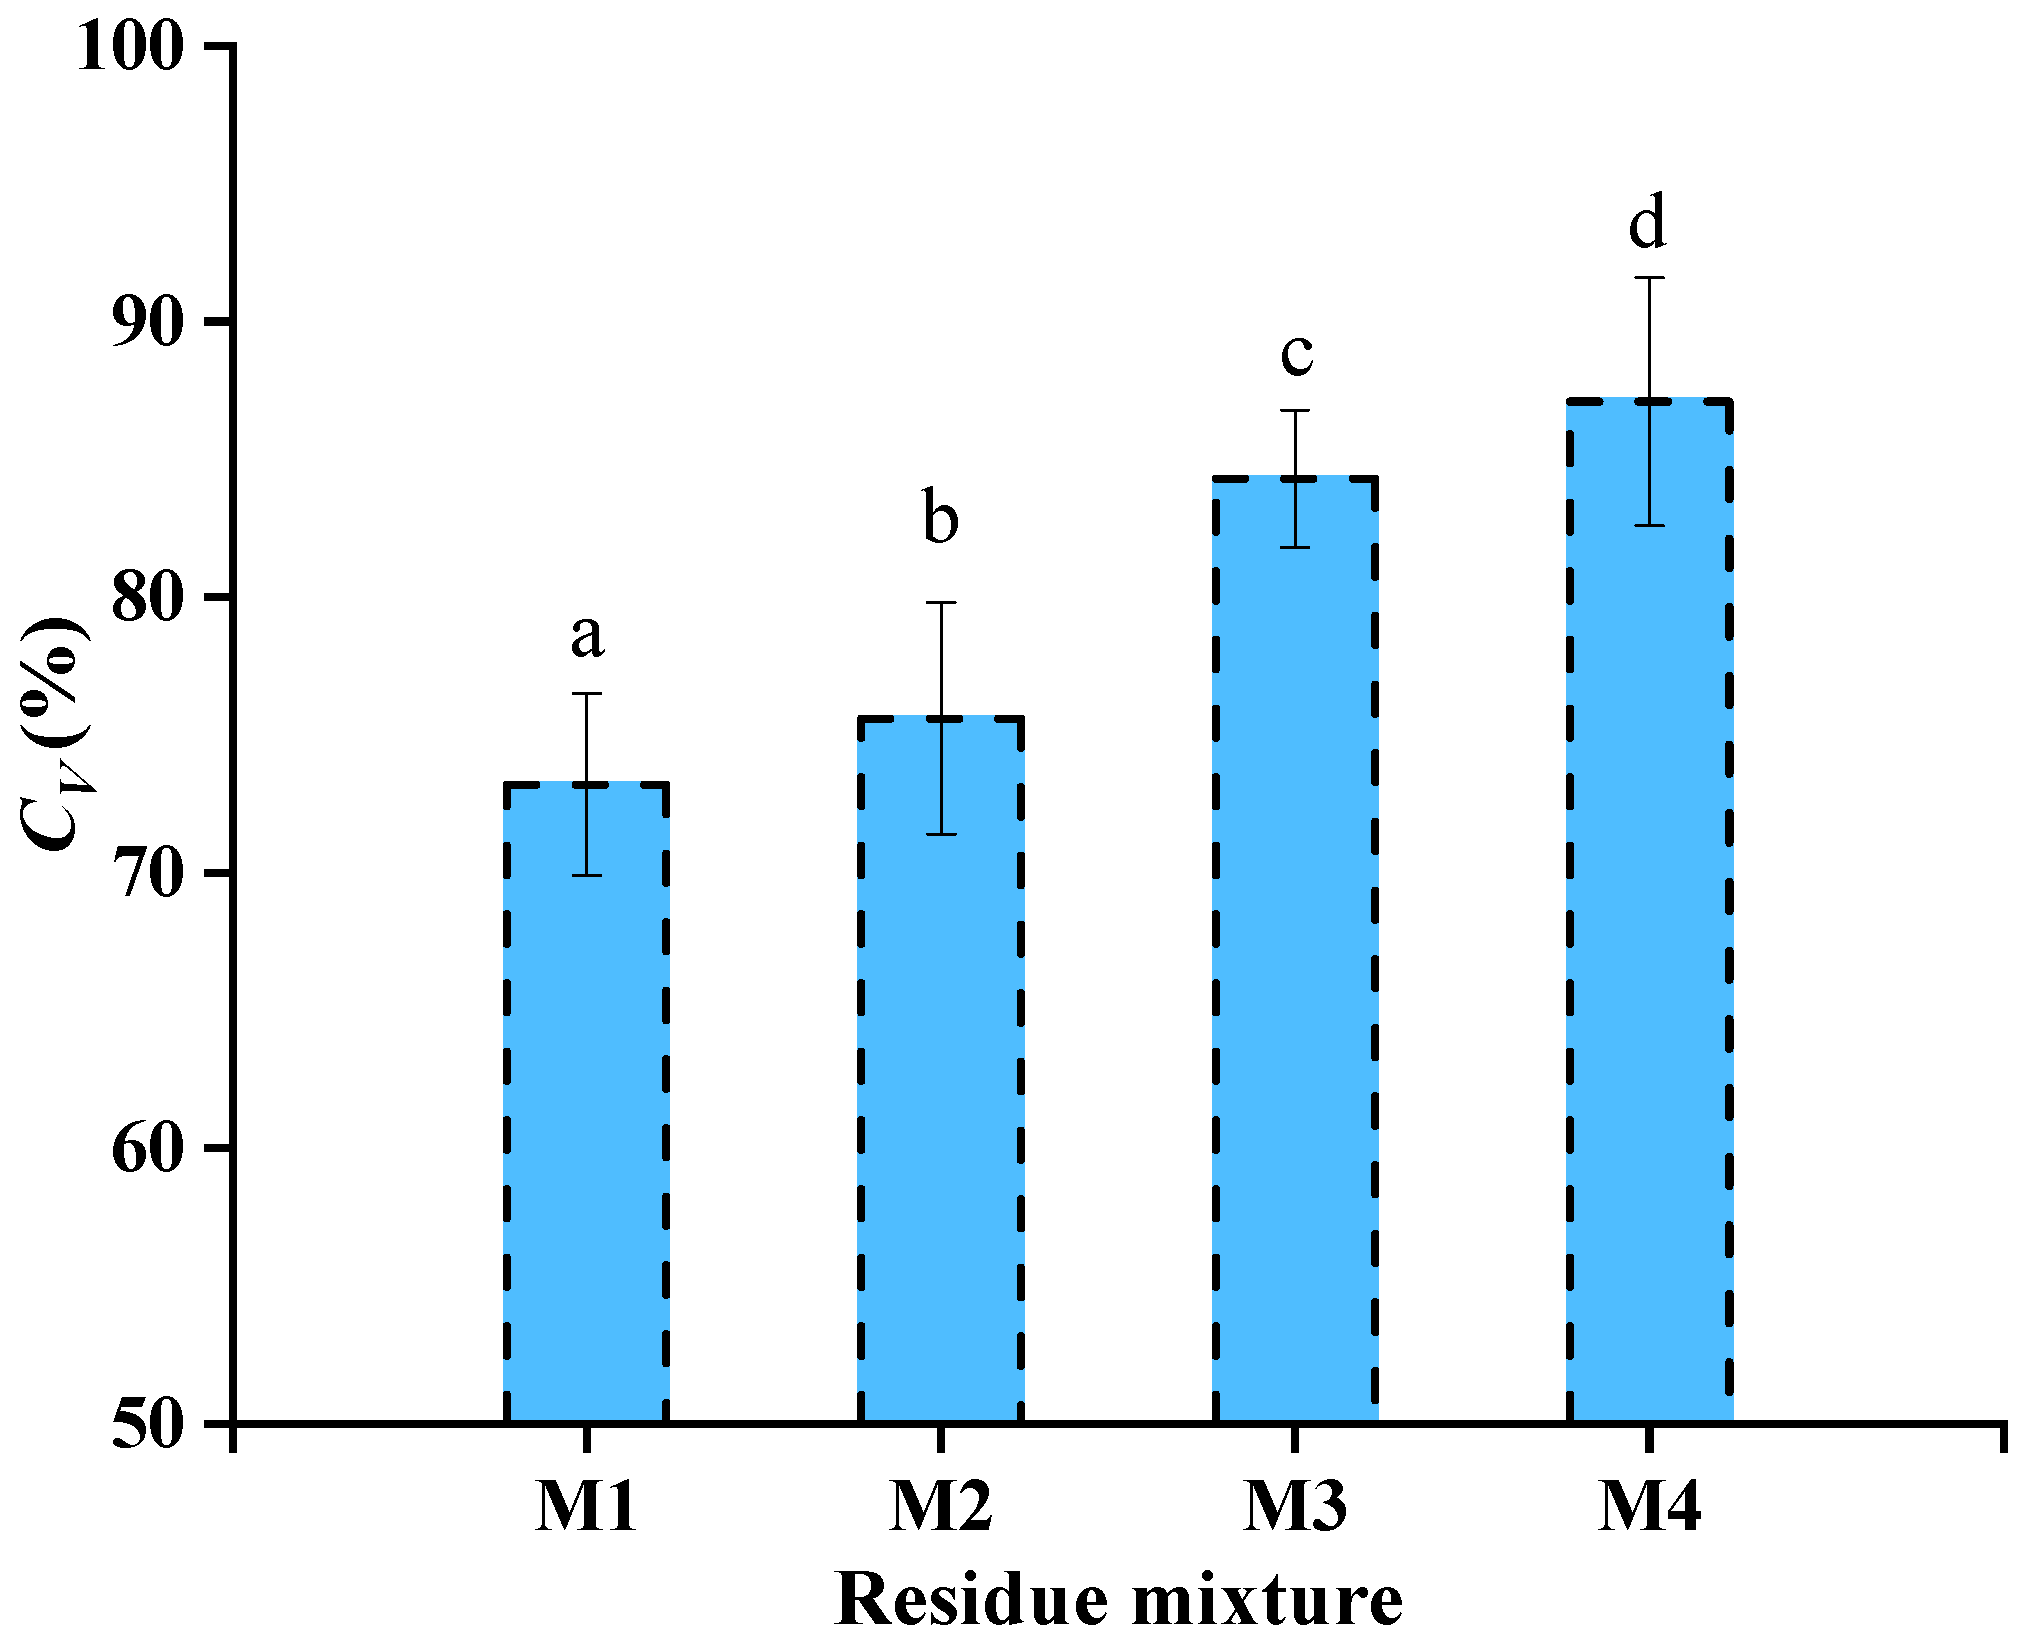
3.2.2. Residue Distribution

Table 3 compares the total length and proportion of residue in each layer for four residue mixtures. As discussed in previous sections, when stubble was higher than 100 mm, it was difficult to incorporate the residue into the soil by rotary tillage. It appears that the proportion of residue in the ML and LL decrease with increasing stubble height. The percentages of residue in the UL under the M3 and M4 were 40.4% and 44.2%, respectively. More than 40% of the residue was dispersed in the sowing depth layer with 0–50 mm, which was not conducive to the subsequent sowing operation. However, the proportion of residue in the ML and LL under the M1 and M2 were higher, at 71.2% and 66.4%, respectively, which implies that more residues could be incorporated into the deep soil. This finding indicates that high stubble was not easily incorporated in the soil, and it also affects the burying of chopped straw. It is suggested that the stubble height should be kept as low as possible during harvesting, which could improve the quality of residue incorporation after rotary tillage.
In order to further accurately quantify the distribution of residue incorporated into the soil, the 3D model of residue was divided into small cubes in the overall direction. Figure 9 shows the quality of residue distribution in the overall direction under different residue mixtures. The results indicate that the CV in each cube was increased with the increasing stubble height. The CV in each cube under the M1 and M2 were lower, at 73.2% and 75.5%, respectively. However, when the stubble heights were 150 and 200 mm, there was an unfavorable effect on the uniformity of residue distribution. The CV in each cube under the M4 was the highest, at 87.1%. It was suggested that the stubble height should be kept lower than 100 mm, and the straw length should not be longer than 50 mm. Under this condition, one could obtain a relatively high quality of residue incorporation after rotary tillage.

3.3. Effect of Rotary Speed on Residue Burying and Distribution

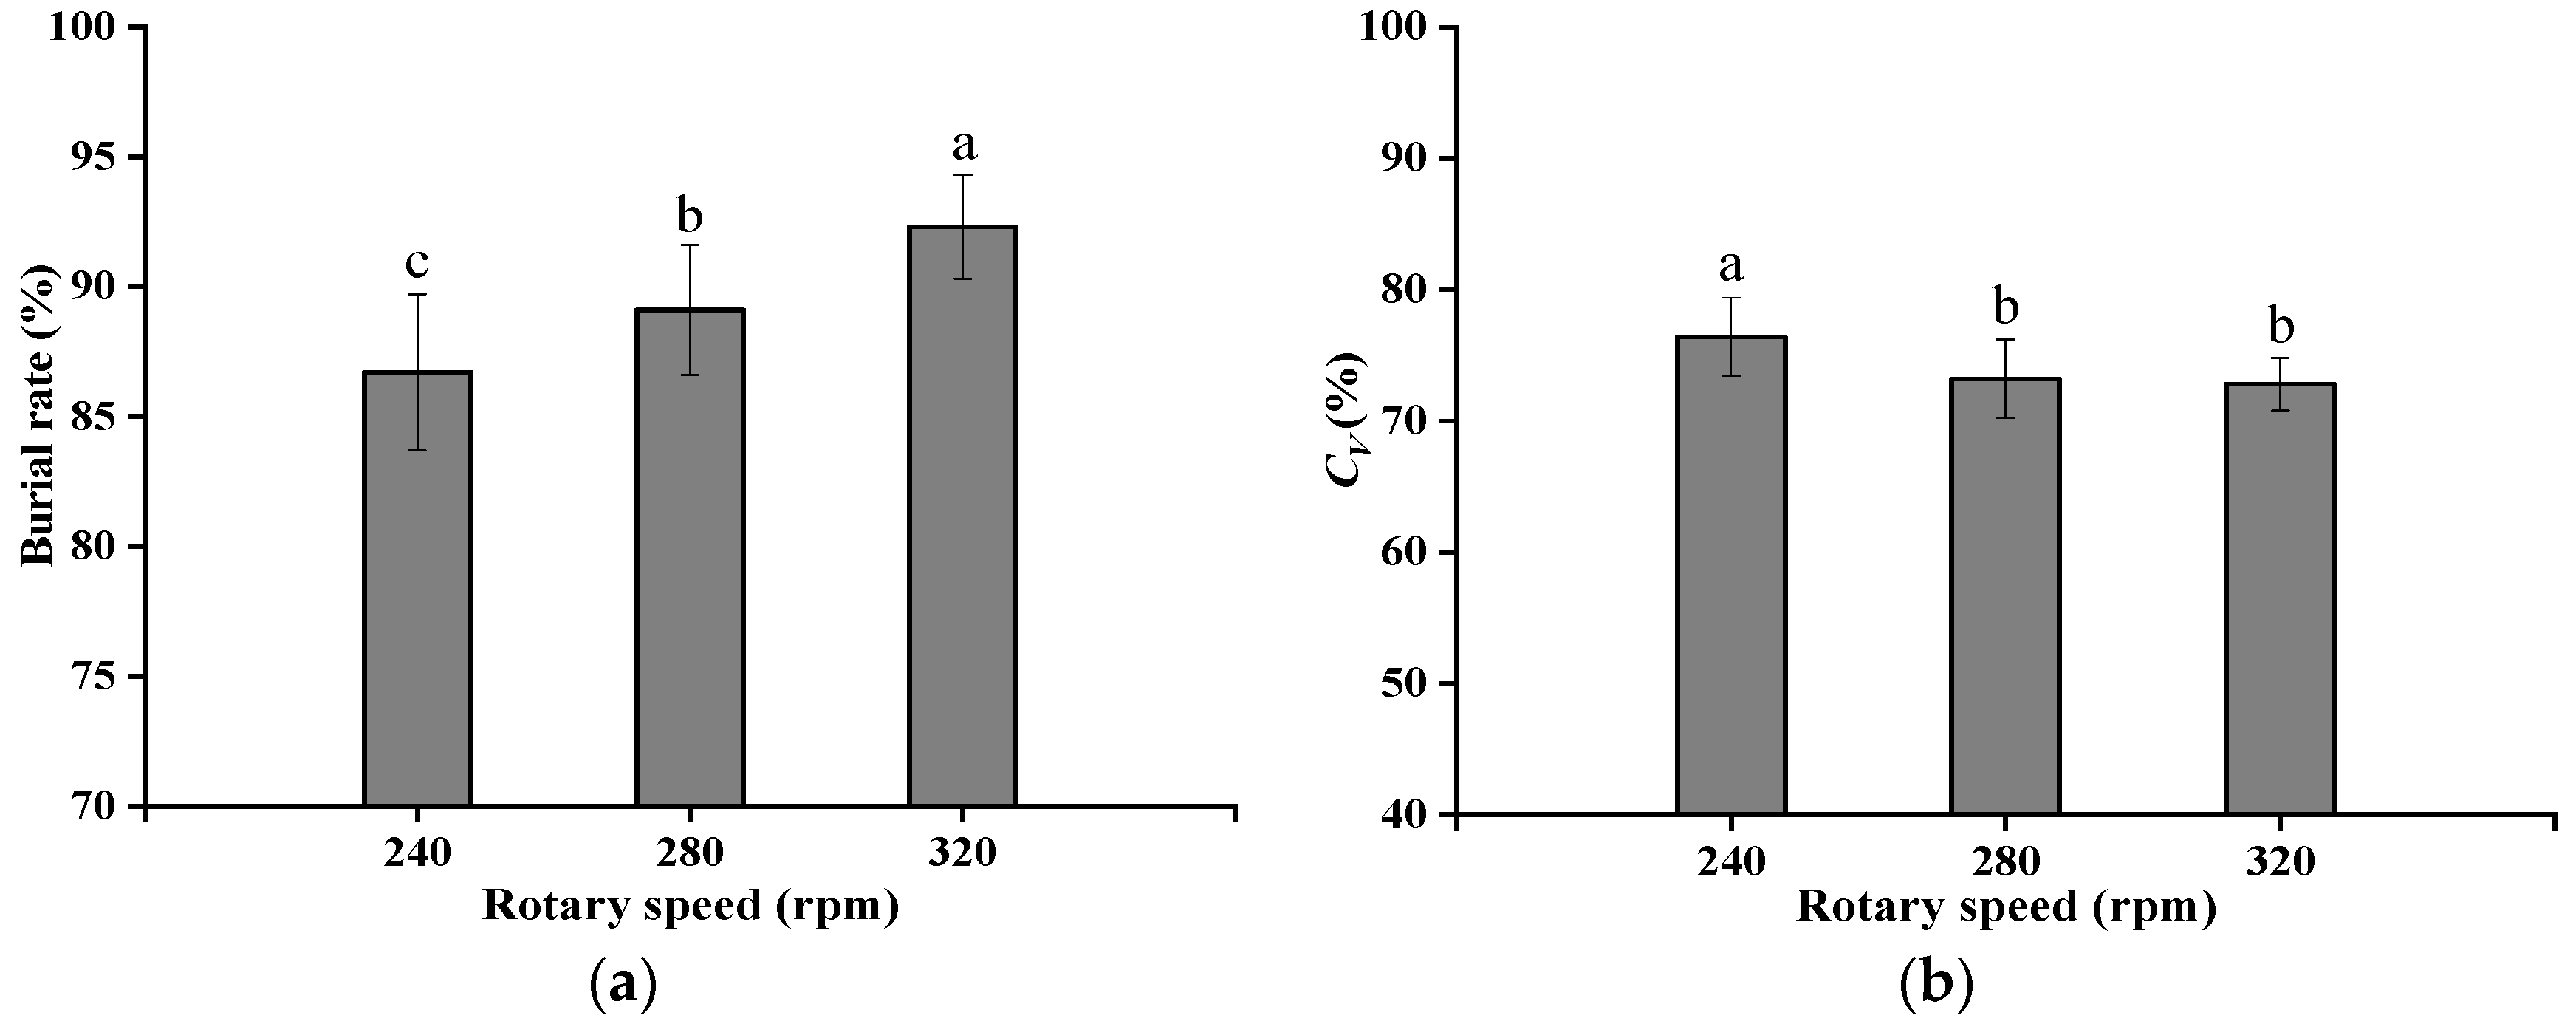
3.3.1. Residue Burying

The straw length of 50 mm was selected to explore the effect of rotary speed on residue burying, and results of burying rate at the three rotary speeds are shown in Figure 10a. The results indicate that higher rotary speed buried more residue than the lower one. For the rotary speed of 320 rpm, there was about 92.3% of residue incorporated into the soil after tillage. At the rotary speed of 240 rpm, the percent of burying residue was decreased to 86.7%. The main reason is that under high-speed rotary tillage, on the one hand, the straw can easily to move downward into the soil by the action of rotary blades, on the other hand, the resulting small clod makes it easier to bury residue.

3.3.2. Residue Distribution

Total lengths and proportions of residue in each layer at different rotary speeds are listed in Table 4. The results indicate that proportion of residue in the ML and LL increased with the increasing rotary speed. The percent of residue in the UL at the rotary speed of 320 rpm was the lowest, 25.7%, which was conducive to the subsequent sowing operation. In contrast, for the rotary speed of 240 rpm, the proportion of residue in the UL increased by 6.5%, and was more likely to cause residue overhead wheat seeds. However, with the increase in rotary speed, the energy consumption of rotary tillage will also increase, so a balance between rotary speed and residue incorporation needs to be found.
The quality of residue distribution in the overall direction at different rotary speeds was shown in Figure 10b. The results showed that the CV in each cube was decreased slightly with the increasing rotary speeds. The CV value in each cube at the rotary speed of 240 rpm was the biggest, at 76.4%. For the rotary speeds of 280 and 320 rpm, The CV values were lower, at 3.2%, and 72.8%, respectively. There is an increasing trend in the quality of residue distribution with the rotary speeds of 240 to 280 rpm, but there are no significant trend changes with the rotary speeds of 280 to 320 rpm. The main reason is that the rotary blades could mix residue and soil well when the rotary speed was larger than 280 rpm.

3.4. Discussion of Tillage Operation Effect on Residue Incorporation Using Field-Testing Bench

Residue burying and distribution are affected by many factors, such as tillage tools, stubble height, residue length, and tillage operation parameters. Soil bin studies carried out by previous research workers showed that shorter residue had a positive effect on increase straw burying rate and improving residue distribution quality [27,28], and the field experiments carried out in our study also obtained similar results. Intensive high-yielding agriculture leads to plenty of crop straw being left in the field, which is detrimental to seeding operation, seed germination, and early plant growth [4,36]. The field investigation indicated that when straw length and stubble high were less than 100 mm, most of the residue could be buried in the soil by rotary tillage and could be evenly distributed in the soil space. In addition, it was also found that slower operation speed will decrease residue incorporation, which is similar to Fang [32]. Therefore, it is feasible to select appropriate combinations of straw length, stubble height, and rotary speed to improve quality of residue incorporation by rotary tillage in intensive rice–wheat rotation system. How residue conditions and tillage operations impact residue incorporation was difficult to investigate through tractor field operation due to too many uncontrollable variables. Although the experimental factors are easy to control, soil bin experiments also make it difficult to fully simulate the actual complex field conditions. Thus, a field-testing bench was developed to assess residue incorporation characteristics of rotary tillage. Compared with soil bin tests, experiments conducted in the field will be more accurate to study the experimental factors affecting residue burying and distribution. In this study, a new field test approach for promoting exploration of complex field conditions was introduced, and the first data on straw length, stubble height, and rotary speed effect on residue burying and distribution were provided. These data would be very important for establishing mathematical model between tillage operations and residue incorporation, so as to provide guidance for residue management and the design of tillage machinery.

4. Conclusions

Field experiments were conducted to study the effects of straw length, stubble height, and rotary speed on residue burying and distribution. A field-testing bench was developed to assess residue incorporation characteristics of rotary tillage at different straw lengths, stubble heights, and rotary speeds. The conclusions drawn were as follows:
(i)
Straw length and stubble height had a significant effect on residue burying and distribution. The burying rate and spatial distribution quality of residue decreased with the increase in straw length and stubble height. The residue incorporation quality with a 30 mm straw length was better than other treatments, and the burying rate and CV were 94.5%, and 72.9%, respectively. There was an excellent residue incorporation quality with 50 mm stubble height, and the burying rate and CV were 90.2% and 73.2%, respectively.
(ii)
The lower rotary speed parameter buried less residue and dispersed it with worse uniformity than the higher one. Compared to the value at 240 rpm, the percent of burying residue could be increased by 5.6% at 320 rpm.
(iii)
Straw length, stubble height, and rotary speed all impact residue incorporation quality. It is suggested that farmers determine the straw length and stubble height at the stage of harvest according to the burying rate and distribution uniformity of residue. A higher speed of rotary tillage (320 rpm) is recommended, as higher speed can increase burying and distribution quality of residue.

Author Contributions

Conceptualization, G.X. and Q.D.; methodology, G.X. and Y.X.; investigation, G.X.; writing—original draft preparation, G.X.; writing—review and editing, G.X., Y.X., M.A.M., R.H. and Q.D.; visualization, Y.X.; supervision, Q.D.; funding acquisition, Q.D. and R.H. All authors have read and agreed to the published version of the manuscript.

Funding

This research was funded by the National Key Research and Development Program of China (No. 2016YFD0300908) and the Graduate Student Research Innovation Program of Jiangsu province (No. KYCX21_0573).

Institutional Review Board Statement

Not applicable.

Informed Consent Statement

Not applicable.

Data Availability Statement

Data contained within the article.

Conflicts of Interest

The authors declare no conflict of interest.

References

  1. Karandish, F. Applying grey water footprint assessment to achieve environmental sustainability within a nation under intensive agriculture: A high-resolution assessment for common agrochemicals and crops. Environ. Earth Sci. 2019, 78, 200. [Google Scholar] [CrossRef]
  2. Ittersum, V.; Martin, K. Crop Yields and Global Food Security. Will Yield Increase Continue to Feed the World? Eur. Rev. Agric. Econ. 2016, 97, 191–192. [Google Scholar] [CrossRef] [Green Version]
  3. Zhang, Y.; Liu, J.; Yuan, W.; Zhang, R.; Xi, X. Multiple Leveling for Paddy Field Preparation with Double Axis Rotary Tillage Accelerates Rice Growth and Economic Benefits. Agriculture 2021, 11, 1223. [Google Scholar] [CrossRef]
  4. Zeng, Z.; Chen, Y. Performance evaluation of fluted coulters and rippled discs for vertical tillage. Soil Tillage Res. 2018, 183, 93–99. [Google Scholar] [CrossRef]
  5. Torotwa, I.; Ding, Q.; Makange, N.R.; Liang, L.; He, R. Performance evaluation of a biomimetically designed disc for dense-straw mulched conservation tillage. Soil Tillage Res. 2021, 212, 105068–105077. [Google Scholar] [CrossRef]
  6. Wang, Y.; Adnan, A.; Wang, X.; Yang, S.; Shi, Y. Study of the Mechanics and Micro-Structure of Wheat Straw Returned to Soil in Relation to Different Tillage Methods. Agronomy 2020, 10, 894. [Google Scholar] [CrossRef]
  7. Binod, P.; Sindhu, R.; Singhania, R.R.; Vikram, S.; Devi, L.; Nagalakshmi, S.; Kurien, N.; Sukumaran, R.K.; Pandey, A. Bioethanol production from rice straw: An overview. Bioresour. Technol. 2010, 101, 4767–4774. [Google Scholar] [CrossRef]
  8. Yin, H.; Zhao, W.; Li, T.; Cheng, X.; Liu, Q. Balancing straw returning and chemical fertilizers in China: Role of straw nutrient resources. Renew. Sustain. Energy Rev. 2018, 81, 2695–2702. [Google Scholar] [CrossRef]
  9. Jane, J.; Veronica, A.M.; Cynthia, C.; Nancy, B. Crop and Soil Responses to Using Corn Stover as a Bioenergy Feedstock: Observations from the Northern US Corn Belt. Agriculture 2013, 3, 72–89. [Google Scholar]
  10. Zhang, P.; Wei, T.; Li, Y.; Wang, K.; Jia, Z.; Han, Q.; Ren, X. Effects of straw incorporation on the stratification of the soil organic C, total N and C:N ratio in a semiarid region of China. Soil Tillage Res. 2015, 153, 28–35. [Google Scholar] [CrossRef]
  11. Vera, J.C.; Valeiro, A.; Posse, G.; Acreche, M.M. To burn or not to burn: The question of straw burning and nitrogen fertilization effect on nitrous oxide emissions in sugarcane. Sci. Total Environ. 2017, 587, 399–406. [Google Scholar] [CrossRef] [PubMed]
  12. Xiu, L.; Zhang, W.; Sun, Y.; Wu, D.; Meng, J.; Chen, W. Effects of biochar and straw returning on the key cultivation limitations of Albic soil and soybean growth over 2 years. Catena 2019, 173, 481–493. [Google Scholar] [CrossRef]
  13. Chen, S.; Zhang, X.; Shao, L.; Sun, H.; Liu, X. Effects of straw and manure management on soil and crop performance in North China Plain. Catena 2019, 187, 104359–104369. [Google Scholar] [CrossRef]
  14. Li, Y.; Song, D.; Dang, P.; Wei, L.; Qin, X.; Siddique, K. Combined ditch buried straw return technology in a ridge-furrow plastic film mulch system: Implications for crop yield and soil organic matter dynamics. Soil Tillage Res. 2020, 199, 104596–104605. [Google Scholar] [CrossRef]
  15. Li, J.; Gan, G.; Chen, X.; Zou, J. Effects of Long-Term Straw Management and Potassium Fertilization on Crop Yield, Soil Properties, and Microbial Community in a Rice–Oilseed Rape Rotation. Agriculture 2021, 11, 1233. [Google Scholar] [CrossRef]
  16. Schomberg, H.H.; Steiner, J.L.; Unger, P.W. Decomposition and Nitrogen Dynamics of Crop Residues: Residue Quality and Water Effects. Soil Sci. Soc. Am. J. 1994, 58, 372–381. [Google Scholar] [CrossRef] [Green Version]
  17. Latifmanesh, H.; Deng, A.; Li, L.; Chen, Z.; Zhang, W. How incorporation depth of corn straw affects straw decomposition rate and C&N release in the wheat-corn cropping system. Agric. Ecosyst. Environ. 2020, 300, 107000–107007. [Google Scholar]
  18. Liu, J.; Chen, Y.; Kushwaha, R.L. Effect of tillage speed and straw length on soil and straw movement by a sweep. Soil Tillage Res. 2010, 109, 9–17. [Google Scholar] [CrossRef]
  19. Zhou, H.; Zhang, C.; Zhang, W.; Yang, Q.; Li, D.; Liu, Z.; Xia, J. Evaluation of straw spatial distribution after straw incorporation into soil for different tillage tools. Soil Tillage Res. 2020, 196, 104440–104449. [Google Scholar] [CrossRef]
  20. Brown, P.L.; Dickey, D.D. Losses of Wheat Straw Residue under Simulated Field Conditions. Soil Sci. Soc. Am. J. 1970, 34, 118–121. [Google Scholar] [CrossRef]
  21. Guérif, J.; Richard, G.; Dürr, C.; Machet, J.M.; Recous, S.; Roger-Estrade, J. A review of tillage effects on crop residue management, seedbed conditions and seedling establishment. Soil Tillage Res. 2001, 61, 13–32. [Google Scholar] [CrossRef]
  22. Guan, X.; Wei, L.; Turner, N.C.; Ma, S.; Yang, M.; Wang, T. Improved straw management practices promote in situ straw decomposition and nutrient release, and increase crop production. J. Clean. Prod. 2020, 250, 119511–119514. [Google Scholar] [CrossRef]
  23. Sommer, R.; Ryan, J.; Masri, S.; Singh, M.; Diekmann, J. Effect of shallow tillage, moldboard plowing, straw management and compost addition on soil organic matter and nitrogen in a dryland barley/wheat-vetch rotation. Soil Tillage Res. 2011, 115, 39–46. [Google Scholar] [CrossRef]
  24. Zeng, Z.; Ma, X.; Chen, Y.; Qi, L. Modelling residue incorporation of selected chisel ploughing tools using the discrete element method (DEM). Soil Tillage Res. 2020, 197, 104505–104518. [Google Scholar] [CrossRef]
  25. Eltom, A.F.; Ding, W.; Ding, Q.; Tagar, A.A.; Talha, Z.; Gamareldawla. Field investigation of a trash-board, tillage depth and low speed effect on the displacement and burial of straw. Catena 2015, 133, 385–393. [Google Scholar] [CrossRef]
  26. Hanna, H.M.; Melvin, S.W.; Pope, R.O. Tillage implement operational effects on residue cover. Appl. Eng. Agric. 1995, 11, 205–210. [Google Scholar] [CrossRef]
  27. Liu, J.; Ying, C.; Lobb, D.A.; Kushwaha, R.L. Soil-straw-tillage tool interaction: Field and soil bin study. Can. Biosyst. Eng. 2007, 49, 2. [Google Scholar]
  28. Davut, A.; Kamil, E. Rotary tiller velocity effects on the distribution of wheat (Triticum aestivum) residue in the soil profile. N. Z. J. Crop Hortic. Sci. 2008, 36, 247–252. [Google Scholar] [CrossRef]
  29. Na, L.; Li, Y.; Ping, C.; Jing, W.; Wei, G.; Pang, G.; Zhang, L. Depth of straw incorporation significantly alters crop yield, soil organic carbon and total nitrogen in the North China Plain. Soil Tillage Res. 2020, 205, 104772–104781. [Google Scholar]
  30. Tao, Z.; Li, C.; Li, J.; Ding, Z.; Xu, J.; Sun, X.; Zhou, P.; Zhao, M. Tillage and straw mulching impacts on grain yield and water use efficiency of spring maize in Northern Huang–Huai–Hai Valley. Crop J. 2015, 6, 445–450. [Google Scholar] [CrossRef] [Green Version]
  31. Prasad, R.; Gangaiah, B.; Aipe, K.C. Effect of crop residue management in a rice-wheat cropping system on growth and yield of crops and on soil fertility. Exp. Agric. 1999, 35, 427–435. [Google Scholar] [CrossRef]
  32. Fang, H.; Zhang, Q.; Chandio, F.A.; Guo, J.; Sattar, A.; Arslan, C.; Ji, C. Effect of straw length and rotavator kinematic parameter on soil and straw movement by a rotary blade. Eng. Agric. Environ. Food. 2016, 9, 235–241. [Google Scholar] [CrossRef]
  33. Zeng, Z.; Chen, Y. Simulation of straw movement by discrete element modelling of straw-sweep-soil interaction. Biosyst. Eng. 2019, 180, 25–35. [Google Scholar] [CrossRef]
  34. Matin, M.A.; Hossain, M.I.; Gathala, M.K.; Timsina, J.; Krupnik, T.J. Optimal design and setting of rotary strip-tiller blades to intensify dry season cropping in Asian wet clay soil conditions. Soil Tillage Res. 2020, 207, 104854–104864. [Google Scholar] [CrossRef]
  35. Fang, H.; Ji, C.; Tagar, A.A.; Zhang, Q.; Guo, J. Simulation analysis of straw movement in straw-soil-rotary blade system. Trans. Chin. Soc. Agric. Mach. 2016, 47, 60–67. (In Chinese) [Google Scholar]
  36. Wang, Y.; Adnan, A.; Wang, X.; Yang, S.; Shi, Y. Straw Incorporation Management Affects Maize Grain Yield through Regulating Nitrogen Uptake, Water Use Efficiency, and Root Distribution. Agronomy 2020, 10, 324. [Google Scholar]
Figure 1. Schematic structure of field-testing bench.
Agriculture 12 00222 g001
Figure 2. Schematic structure of movable carriage and rotary tiller.
Agriculture 12 00222 g002
Figure 3. Residue preparation. (a) Residue treatment, (b) straw laying on the soil face. (c) Straw and stubble laying on the soil face.
Agriculture 12 00222 g003
Figure 4. Sample collection and measurement. (a) Sample collection of the soil–residue mixture, (b) measurement of residue spatial coordinates.
Agriculture 12 00222 g004
Figure 5. Reconstruction and segmentation of residue distribution model in 3D software. (a) Residue distribution model, (b) model segmentation in the depth direction, (c) model segmentation in the overall direction.
Agriculture 12 00222 g005
Figure 6. Burying rate at different straw lengths.
Agriculture 12 00222 g006
Figure 7. Residue distribution quality in the overall direction under different straw lengths. Means for each factor followed by the same letter are not significantly different at p > 0.05 as tested by LSD; the error bars are standard deviations of means.
Agriculture 12 00222 g007
Figure 8. Relationship between residue mixture and burying rate. Means for each factor followed by the same letter are not significantly different at p > 0.05 as tested by LSD; the error bars are standard deviations of means. M1, residue mixture 1 consisted of 50 mm-high stubble and 50 mm-long chopping straw; M2, residue mixture 2 consisted of 50 mm-high stubble and 50 mm-long chopping straw; M3, residue mixture 3 consisted of 150 mm-high stubble and 50 mm-long chopping straw; M4, residue mixture 4 consisted of 200 mm-high stubble and 50 mm-long chopping straw.
Agriculture 12 00222 g008
Figure 9. Residue distribution quality in the overall direction under different residue mixtures. Means for each factor followed by the same letter are not significantly different at p > 0.05 as tested by LSD; the error bars are standard deviations of means.
Agriculture 12 00222 g009
Figure 10. Percent of burying rate and CV after tillage at the rotary speeds of 240, 280, and 320 rpm. (a) burying rate at three rotary speeds, (b) CV at three rotary speeds. Means for each factor followed by the same letter are not significantly different at p > 0.05 as tested by LSD; the error bars are standard deviations of means.
Agriculture 12 00222 g010
Table 1. Soil properties and straw parameters of experimental site.
Parameter Value
SoilTextureClay loam (21.20, 39.67 and 38.96% sand, silt and clay, respectively)
Cone index635, 1000, 987 kPa at 5, 10, and 15 cm depths, respectively
Moisture content22.6, 23.4, 24.8% at depth of 0–5, 5–10 and 10–15 cm, respectively
Dry bulk density1.29 g cm−3
StrawStraw length0–15 cm
Stubble height0–20 cm
Wet density8012 kg ha−1
Dry density3943 kg ha−1
Table 2. Total length and proportion of residue in each layer at different straw chopping lengths.
Layer, mmThe Total Length of Residue, mmThe Proportion of Residue, mm
305075100125150305075100125150
UL (0–50)1081 ± 741274 ± 911501 ± 1091575 ± 971650 ± 1151815 ± 11223.2 c28.3 c35.2 a38.1 a42.3 a47.3 a
ML (0–100)1965 ± 1391764 ± 1241580 ± 1021542 ± 911568 ± 1061568 ± 9342.1 a39.3 a37.1 a37.3 a40.2 a40.8 b
LL (0–150)1617 ± 1151458 ± 861181 ± 741017 ± 88683 ± 59456 ± 5734.7 b32.4 b27.7 b24.6 b17.5 b11.9 c
Means for each factor in the same column followed by the same letter are not significantly different at p > 0.05 as tested by LSD.
Table 3. Total length and proportion of residue in each layer for different residue mixtures.
Layer, mmThe Total Length of Residue, mmThe Proportion of Residue, mm
M1M2M3M4M1M2M3M4
UL (0–50)1302 ± 781502 ± 891663 ± 1391813 ± 12428.8 c33.6 b40.4 a44.2 a
ML (50–100)1721 ± 1231717 ± 1261495 ± 1281589 ± 8338.1 a38.4 a36.3 a38.7 b
LL(100–150)1494 ± 1021251 ± 97958 ± 77704 ± 6133.1 b28.0 c23.3 b17.1 c
Means for each factor in the same column followed by the same letter are not significantly different at p > 0.05 as tested by LSD.
Table 4. Total length and proportion of residue in each layer at different rotary speeds.
Layer, mmThe Total Length of Residue, mmThe Proportion of Residue, mm
240280320240280320
UL (0–50)1413 ± 1041301 ± 991204 ± 9632.2 b28.8 c25.7 c
ML (50–100)1617 ± 1111723 ± 1151839 ± 10836.8 a38.1 a39.3 a
LL (100–150)1362 ± 951495 ± 1071641 ± 10331.0 b33.1 b35.0 b
Means for each factor in the same column followed by the same letter are not significantly different at p > 0.05 as tested by LSD.
Publisher’s Note: MDPI stays neutral with regard to jurisdictional claims in published maps and institutional affiliations.

