Article

Nitrogen Fertilization Weakly Influences the Anatomy and Chemical Composition of Rice Leaves

1
Key Laboratory of Crop Genetics and Physiology of Jiangsu Province, Jiangsu Key Laboratory of Crop Cultivation and Physiology, Co-Innovation Center for Modern Production Technology of Grain Crops, Yangzhou University, Yangzhou 225009, China
2
Ministry of Agriculture Key Laboratory of Crop Ecophysiology and Farming System in the Middle Reaches of the Yangtze River, College of Plant Science and Technology, Huazhong Agricultural University, Wuhan 430070, China
*
Author to whom correspondence should be addressed.
Agriculture 2022, 12(2), 215; https://doi.org/10.3390/agriculture12020215
Submission received: 1 January 2022 / Revised: 28 January 2022 / Accepted: 30 January 2022 / Published: 1 February 2022

Abstract

:
In this paper, four rice genotypes showing different leaf mass per area (LMA) are used to explore the effects of nitrogen (N) supplies on rice leaf anatomy and leaf chemical composition as well as their impacts on leaf gas exchange parameters. The results showed that the mass-based and area-based leaf N contents as well as the net photosynthetic rate (A) under high N supply (HN) were all higher than those under a low N supply (LN). However, N supplies had no effect on stomatal conductance, mesophyll conductance, and photosynthetic N use efficiency. Moreover, N supplies had no significant effect on LMA and cell wall thickness. Leaf thickness and leaf density responses to N supplies were inconsistent in different genotypes. Except for the soluble sugar in Huanghuazhan and non-structural carbohydrates (NSC) in Sab Ini, N supplies showed no significant effects on mass-based leaf chemical components (pectic substance, hemicellulose, cellulose, lignin, total cell wall, soluble sugar, starch and NSC) content. The area-based leaf chemical components content showed significant differences between HN and LN in some occasions. The soluble sugar, NSC, hemicellulose, and lignin contents of Sab Ini under HN were higher than those under LN. The pectic substance, hemicellulose, and lignin contents of Huanghuazhan under LN were higher than those under HN. The cellulose and cell wall contents of Yongyou 12 under LN were higher than those under HN. Therefore, we conclude that nitrogen fertilization weakly influences the anatomy and chemical composition of rice leaves with a few exceptions.

1. Introduction

Mesophyll conductance to CO2 (gm, the reciprocal of mesophyll diffusing resistance to CO2) is an important limiting factor for leaf net photosynthetic rate (A) in C3 plants, in addition to stomatal conductance to CO2 (gs, the reciprocal of stomatal diffusing resistance to CO2) [1,2,3,4,5,6]. Except for being affected by leaf anatomical traits, especially the cell wall thickness (Tcw), gm is also influenced by leaf chemical components [1,7,8,9]. Leaf mass per area (LMA), a composite parameter describing leaf anatomy, can also reflects leaf chemical composition, as high LMA leaves usually contain more structural tissues, such as cell wall [10].
As a special structure existing in plant cells, the cell wall affects leaf physiological processes not only by its spatial structure, but also by its content and composition [11,12]. The cell wall is composed of pectic substances, hemicellulose, cellulose, and lignin [13]. Recently, the effects of cell wall content and composition on gm and leaf photosynthesis have attracted significant attention [14]. It was reported that high LMA rice genotypes invest more leaf biomass to cell walls and display lower gm [11]. Roig-Oliver et al. [12] reported that leaf gas exchange and leaf water relations in Hordeum vulgare and Triticum aestivum were correlated with leaf cell wall composition, as gm and A were negatively correlated with the content of pectic substances, and the bulk modulus of elasticity was negatively correlated with the ratio of cellulose and hemicellulose content to the pectic substance content. Except for cell wall compounds, other leaf chemical components also greatly impact leaf gas exchange, i.e., leaf nitrogen (N) content, leaf Rubisco content, and leaf nonstructural carbohydrates (NSC) content [15,16,17].
Overall, leaf anatomy and leaf chemical composition affect leaf gas exchange from multiple perspectives. Modifying leaf anatomy and regulating leaf chemical composition are feasible approaches for improving leaf photosynthetic capacity [11,18]. In addition to genetic improvement methods [5,19], other strategies in practice, such as fertilizer application, can also modify leaf anatomy and leaf chemical composition. In practice, N fertilizer is widely used to improve rice yield [20,21]. As one of the three essential elements for plant growth, N significantly impacts leaf photosynthetic rate [22,23]. Except for regulating chlorophyll and Rubisco contents, N can also influence leaf gas exchange by altering leaf anatomy [24,25]. However, the influences of N supplies on leaf anatomy resulted in varying conclusions [24,26], and further investigations are required regarding the responses of rice leaf anatomy to N supplies. Regarding the regulation of N on leaf chemical composition, previous studies have ascertained the effects of N supplies on leaf chlorophyll and Rubisco contents [5,23]. Recently, a study on maize revealed that a decreasing N application rate improved the cell wall content [27]. However, whether N application has an effect on the tradeoff between leaf functional inclusions and leaf structural components, and then affecting leaf gas exchange, is unknown.
In the present study, four rice genotypes showing different LMA—from a previous study [22]—are selected to explore the effects of N supply on leaf anatomy and leaf chemical composition as well as their effects on leaf gas exchange. The results may provide optimal N application strategies for high photosynthetic N use efficiency (PNUE) in rice.

2. Materials and Methods

2.1. Plant Materials and N Treatments

The experiment was conducted at the experimental farm of Huazhong Agricultural University, Wuhan, Hubei, China. Four rice genotypes were used to perform the research between May 2015 and September 2015, including Sab Ini, N22, Huanghuazhan, and Yongyou 12. After germination, the seeds were sowed on nursery plates. When developed three leaves, the seedlings were transplanted to 11 L pots, the planting density is three hills per pot and two seedlings per hill. Each pot was filled with 10 kg of soil. The soil had a clay loam texture, the pH was 7.13, the organic matter was 7.00 g kg−1, the total N was 0.07 mg kg−1, the available phosphorus (P) was 6.31 mg kg−1, and the available potassium (K) was 126.98 mg kg−1. P and K were applied as basal fertilizers at an amount of 0.15 g kg−1 soil. N was applied at a rate of 0.20 g N kg−1 soil for HN treatment (4:3:3 = basal fertilizer: mid-tillering stage topdressing: heading stage topdressing). No N was applied for LN treatment. There were 10 pots per treatment. Plants were grown outdoors; the climate in the experimental site was typically subtropical; the radiation intensity, average temperature, and relative humidity were about 20 MJ m−2 d−1, 30 °C, and 75%, respectively [22]. The plants were watered daily to avoid drought stress. Pests were intensively controlled using chemical pesticides.
Gas exchange and fluorescence parameters were measured in a climate-controlled growth chamber (Conviron GR48, Controlled Environments Ltd., Winnipeg, MB, Canada). The environment in the growth chamber was controlled, as PPFD was 1000 μmol m−2 s−1, the temperature was 28 °C, the relative humidity was 60% and the CO2 concentration was 400 µmol mol−1. All measurements were conducted on newly expanded flag leaves from three different pots for each treatment.

2.2. Gas Exchange and Fluorescence Parameters Measurements

Leaf gas exchange and chlorophyll fluorescence were measured using the portable photosynthesis system LI-6400XT (LI-CORInc., Lincoln, NE, USA) and leaf chamber Li-6400-40 (Li-Cor) in the morning (8:00–12:00). In the LI-6400XT cuvette, PPFD was maintained at 1500 μmol m−2 s−1, the ambient CO2 concentration was controlled to 400 μmol mol−1, leaf temperature was controlled to 28 °C, and the flow rate was set to 500 μmol s−1. When parameters were stable, gas exchange parameters and chlorophyll fluorescence parameters, including the steady-state fluorescence (Fs) and the maximum fluorescence ( F m ), were recorded with a light saturating pulse of 8000 μmol m−2 s−1. The photochemical efficiency of photosystem II (ΦPSII) was calculated as follows:
Φ PSII = F m F s F m
The electron transport rate (J) was calculated as follows:
J = PPFD · α β · Φ PSII
α is the leaf absorptance and β is the partitioning of absorbed quanta to photosystem II. The product αβ was determined according to Valentini et al. [28].
The variable J method was used to calculate Cc and gm as described in Harley et al. [29]. Cc and gm were calculated as follows:
C c = Γ * ( J + 8 ( A + R d ) ) J 4 ( A + R d )
g m = A C i C c
Γ* is the CO2 compensation point in chloroplasts without day respiration and Rd is the day respiration rate. Laisk method [30,31] was used to determine Rd and C i * (the apparent CO2 photocompensation point). In brief, A/Ci (CO2 concentration in the intercellular airspace) curves with the CO2 gradients of 100, 80, 50, and 25 μmol mol−1 were measured under three PPFDs (150, 300, and 600 μmol m−2 s−1) with an Li-6400-02B chamber (red-blue light source), then linear regression was performed to fit each A/Ci curve. The intersection point of the three A/Ci curves are C i * (x-axis) and Rd (y-axis) (Table S1). Γ* was calculated as follows:
Γ * = C i * + R d g m

2.3. Leaf Anatomy

LMA was measured according to Ye et al. [11]. Three leaves per replicate were detached to measure the leaf area using a leaf area analyzer (LI-Cor 3000C, LI-COR Inc., Lincoln, NE, USA). Leaves were then oven-dried at 80 °C until a constant weight was achieved. LMA was calculated as the ratio of leaf dry weight to leaf area.
Paraffin sections and ultrathin sections were prepared according to our previous study [11]. After being fixed in FAA buffer (38% formaldehyde, glacial acetic acid, and 70% alcohol) and being vacuumed, leaf samples were embedded in paraffin and leaf cross-sections were prepared by professionals. Paraffin sections were examined using a light microscope (LM) (Olympus IX71, Olympus Optical, Tokyo, Japan) and ×400 LM images were acquired. For transmission electron microscope (TEM) images, after being infiltrated with fixative 2.5% (v/v) glutaric aldehyde in 0.1 M phosphate buffer (pH = 7.6) in the vacuum chamber, leaf samples were embedded in Spurr’s epoxy resin (Sigma-Aldrich, St. Louis, MO, USA). Ultrathin sections were prepared by professionals. The ultrathin sections were examined using a TEM (Tecnai G2 20 TWIN, FEI Co., Hillsboro, OR, USA) and ×3500 TEM images were acquired.
LM images were used to measure the leaf cross-section area and width using ImageJ software [32]. Leaf thickness (LT) and leaf density (LD) were calculated as follows:
LT = A r e a   o f   l e a f   c r o s s s e c t i o n W i d t h   o f   l e a f   c r o s s s e c t i o n
LD = L M A L T
TEM images were used to measure Tcw. Five to thirteen images (at least 1 cell per image) were measured in each treatment.

2.4. Leaf Chemical Composition

Mass-based leaf N content (Nmass, %) was determined using an Elementar Vario MAX CN analyzer (Elementar Analysesysteme GmbH, Hanau, Germany). Narea is the result of Nmass multiplies LMA. PNUE was calculated as follows:
PNUE = A N a r e a
The soluble sugars and starch contents were determined according to Yoshida et al. [33], Pucher [34] and our previous study [11]. The NSC concentration refers to the sum of the concentrations of soluble sugars and starch.
The leaf cell wall compounds content was determined according to Peng et al. [13], Wu et al. [35] and our previous study [11]. The anthrone/H2SO4 method was used for determining total hexoses, and the orcinol/HCl assay was used for total pentoses [35,36,37]. The total lignin content of the raw samples was determined according to Laboratory Analytical Procedure of the National Renewable Energy Laboratory (NREL) [38] and Xu et al. [39].

2.5. Data Analysis

One-way and two-way analysis of variance (ANOVA) were used to test the effects of genotype, N treatment, and their interaction on parameters using Statistix 9.0 software (Analytical Software, Tallahassee, FL, USA). Graphs were created and linear regression analysis was performed to test the correlations between parameters using SigmaPlot 10.0 (Systat Software Inc., Richmond, CA, USA).

3. Results

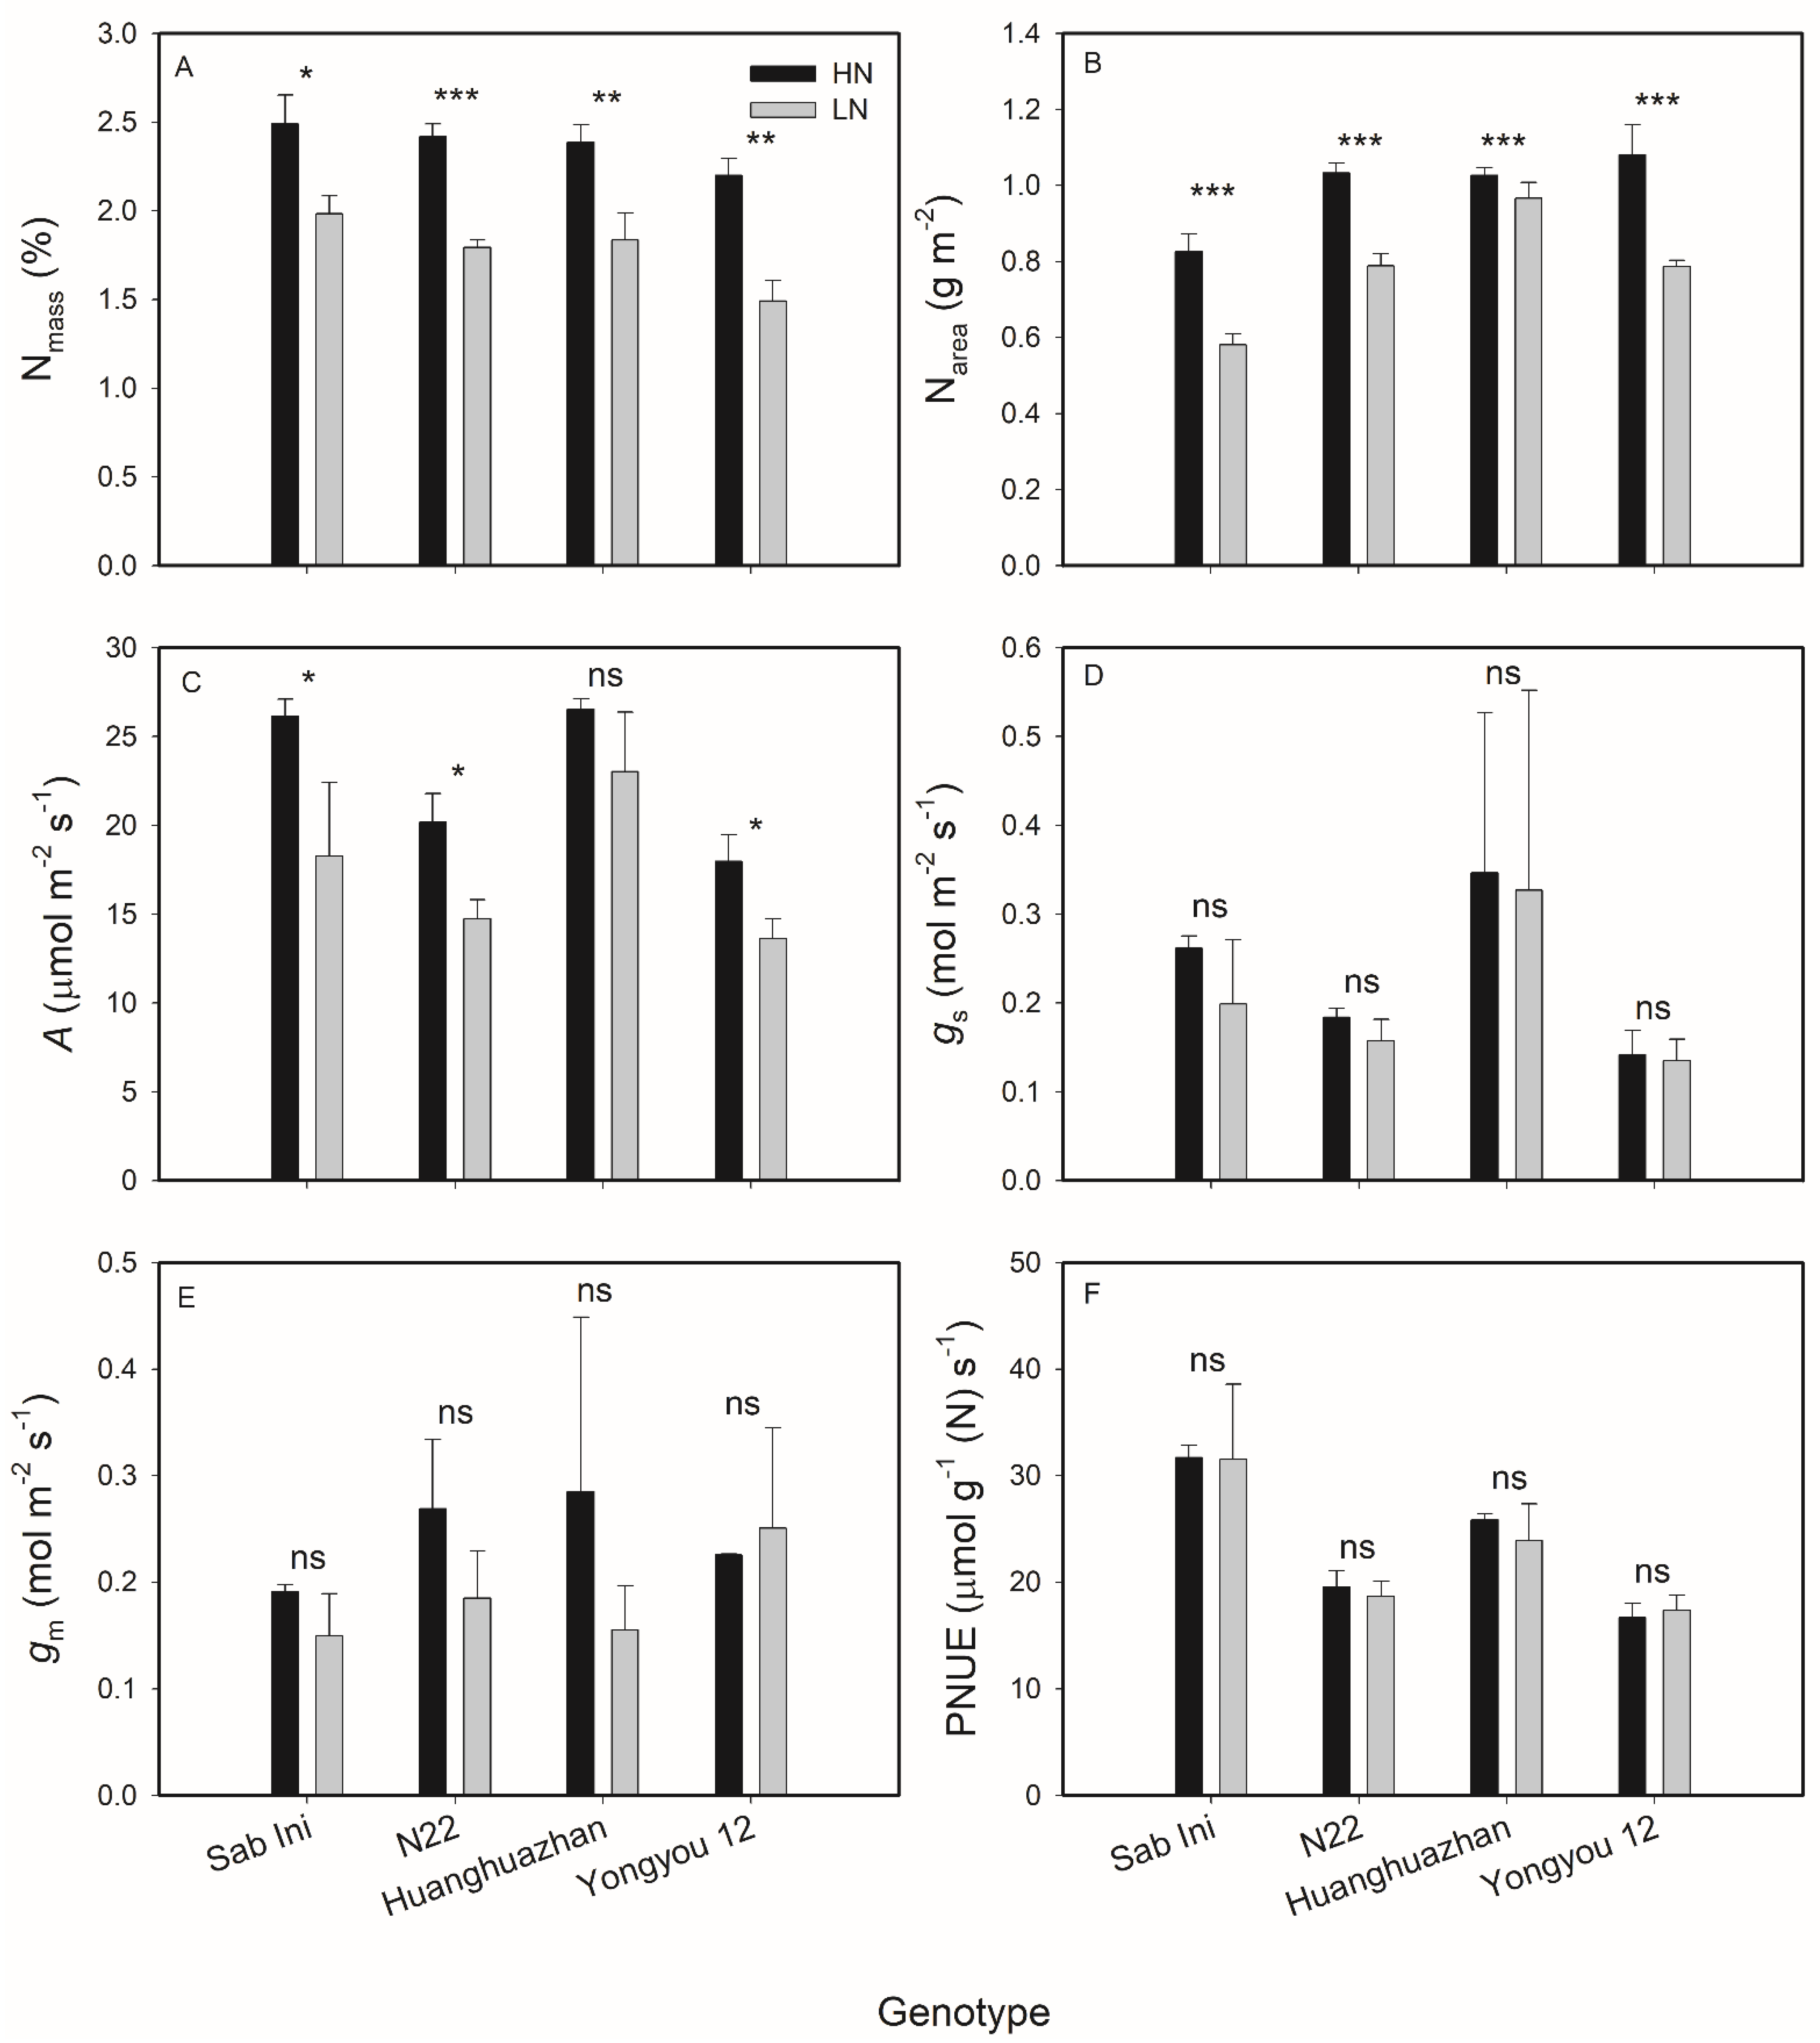
3.1. Effects of N Supplies on Rice Leaf N Content and Leaf Gas Exchange Parameters

Nmass, Narea, A, gs, gm, and PNUE of the four genotypes under HN and LN supplies are shown in Table S2. The ANOVA results of leaf N contents and gas exchange parameters between HN and LN for each genotype are shown in Figure 1. It can be observed that the Nmass and Narea of the four genotypes under HN were significantly higher than those under LN. Except for Huanghuazhan, A of the other three genotypes under HN were all higher than those under LN. gs, gm, and PNUE showed no significant differences between HN and LN among the four genotypes.

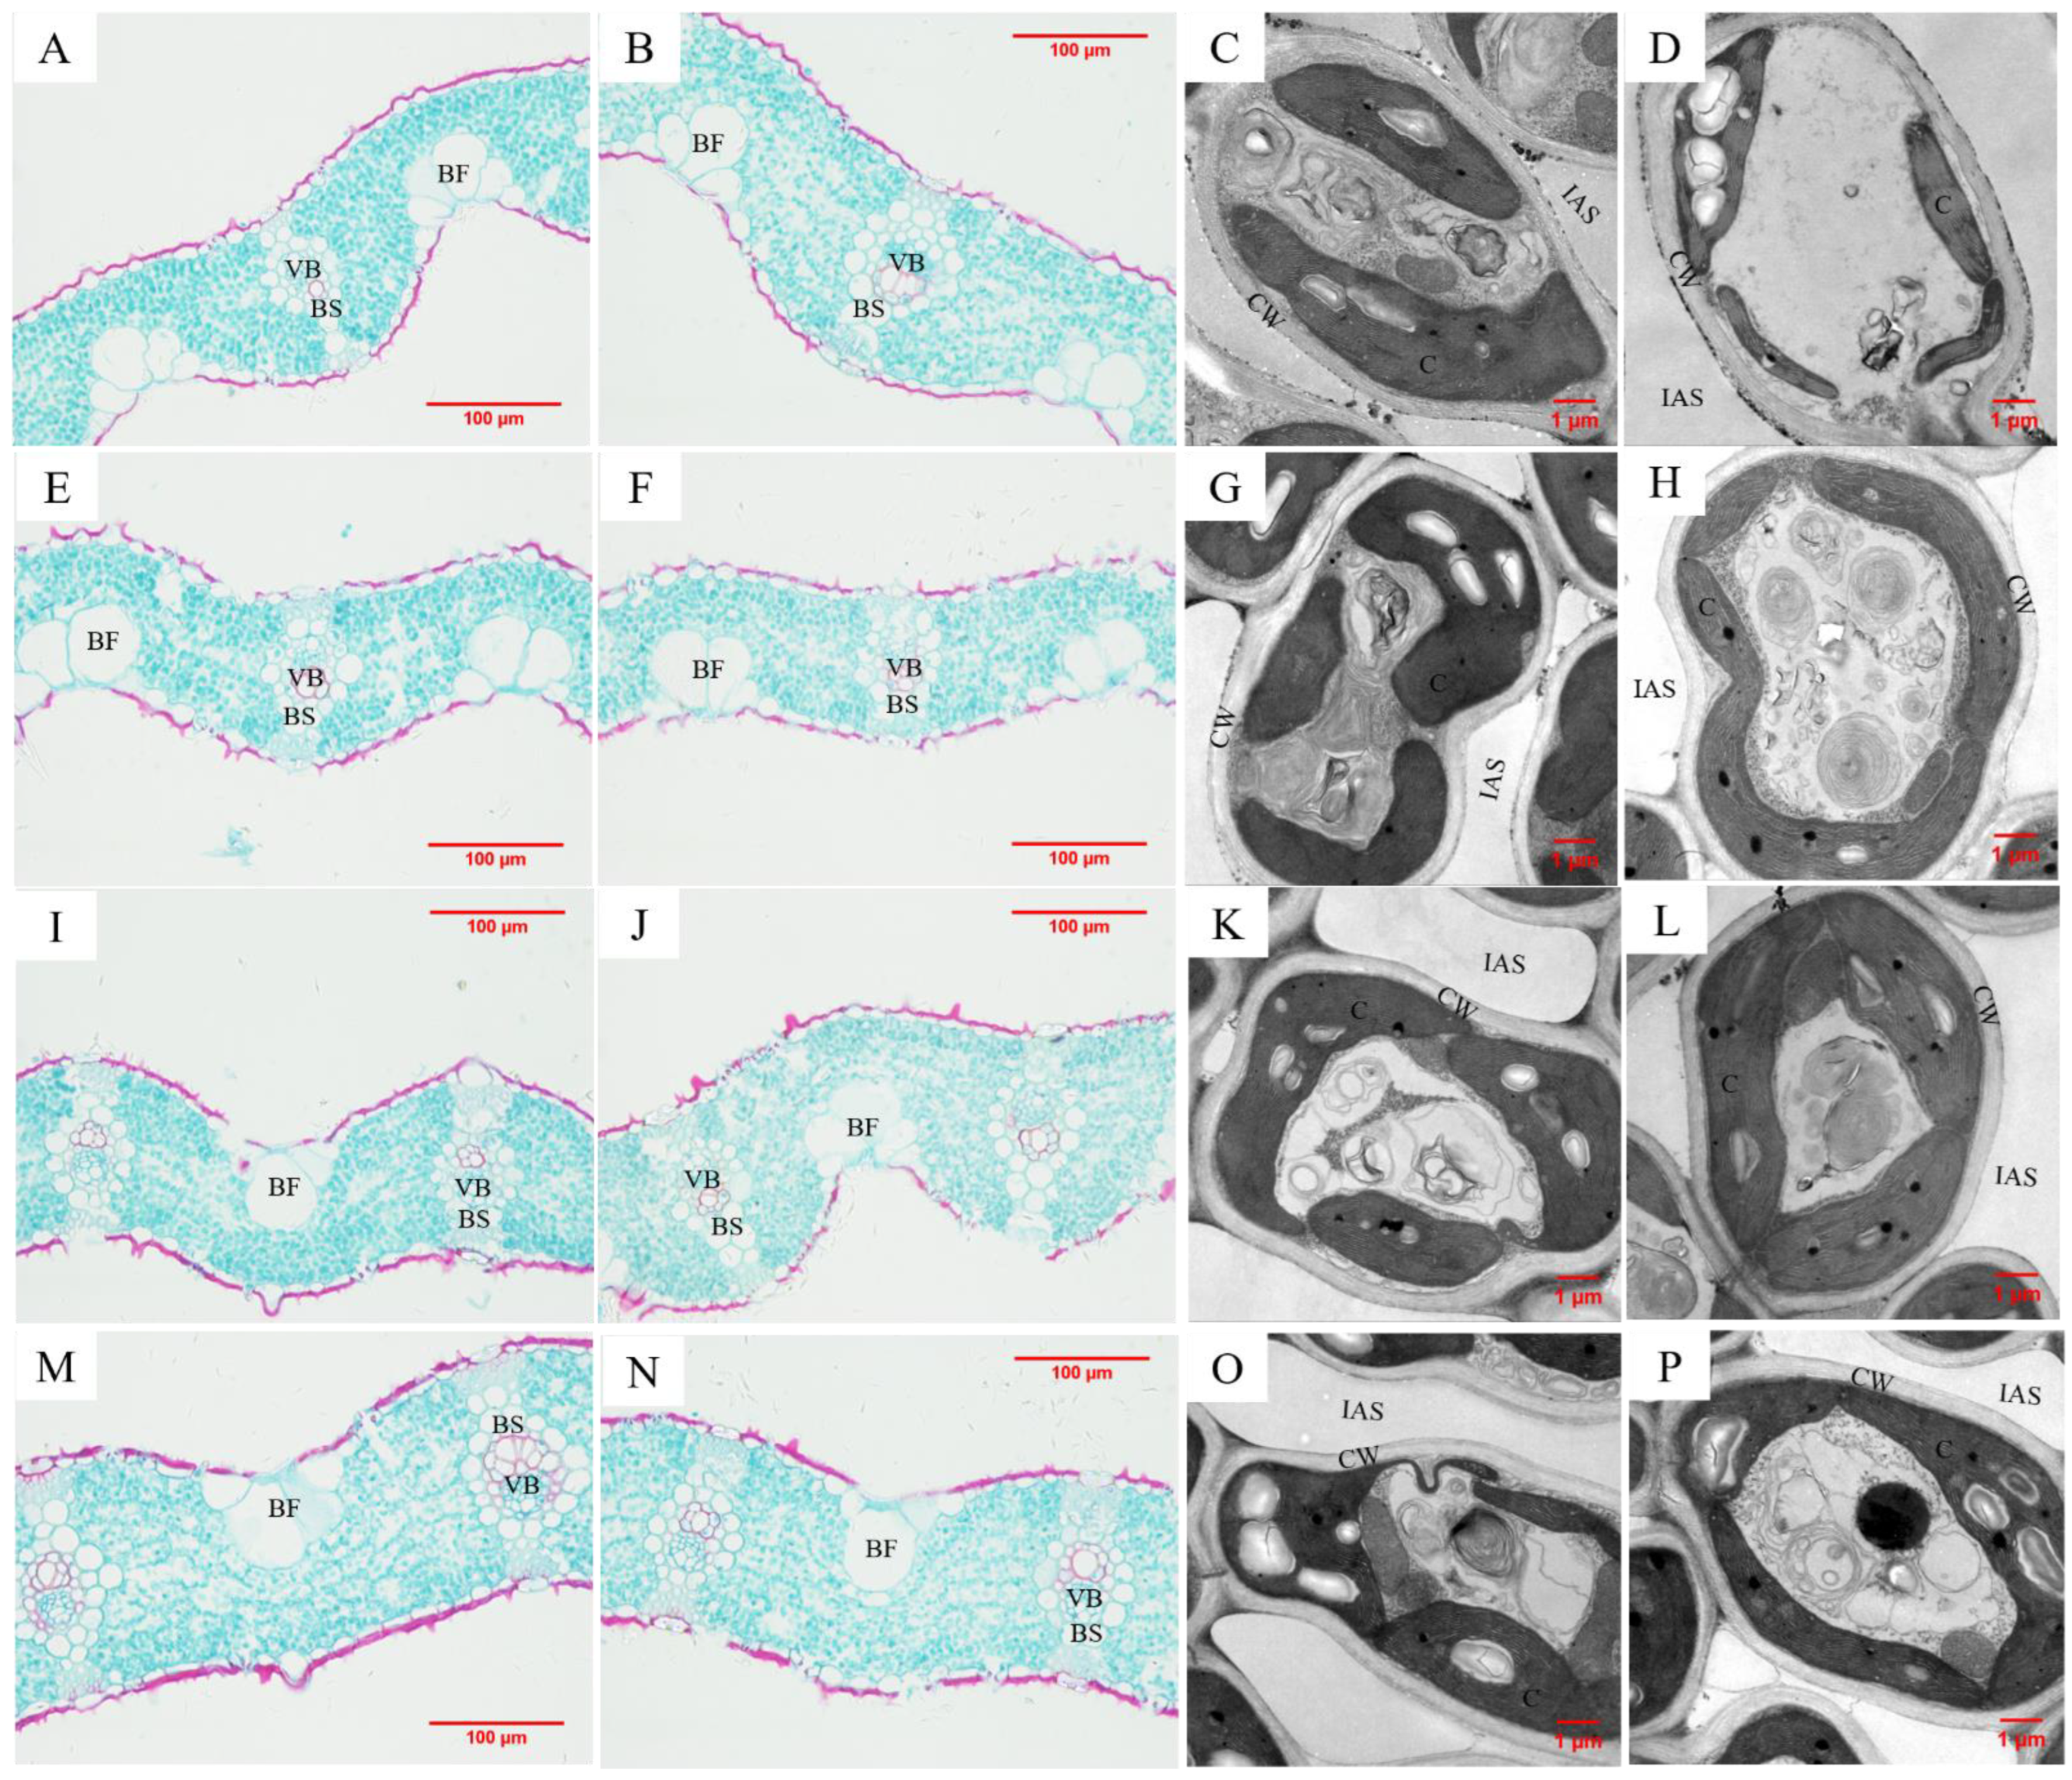
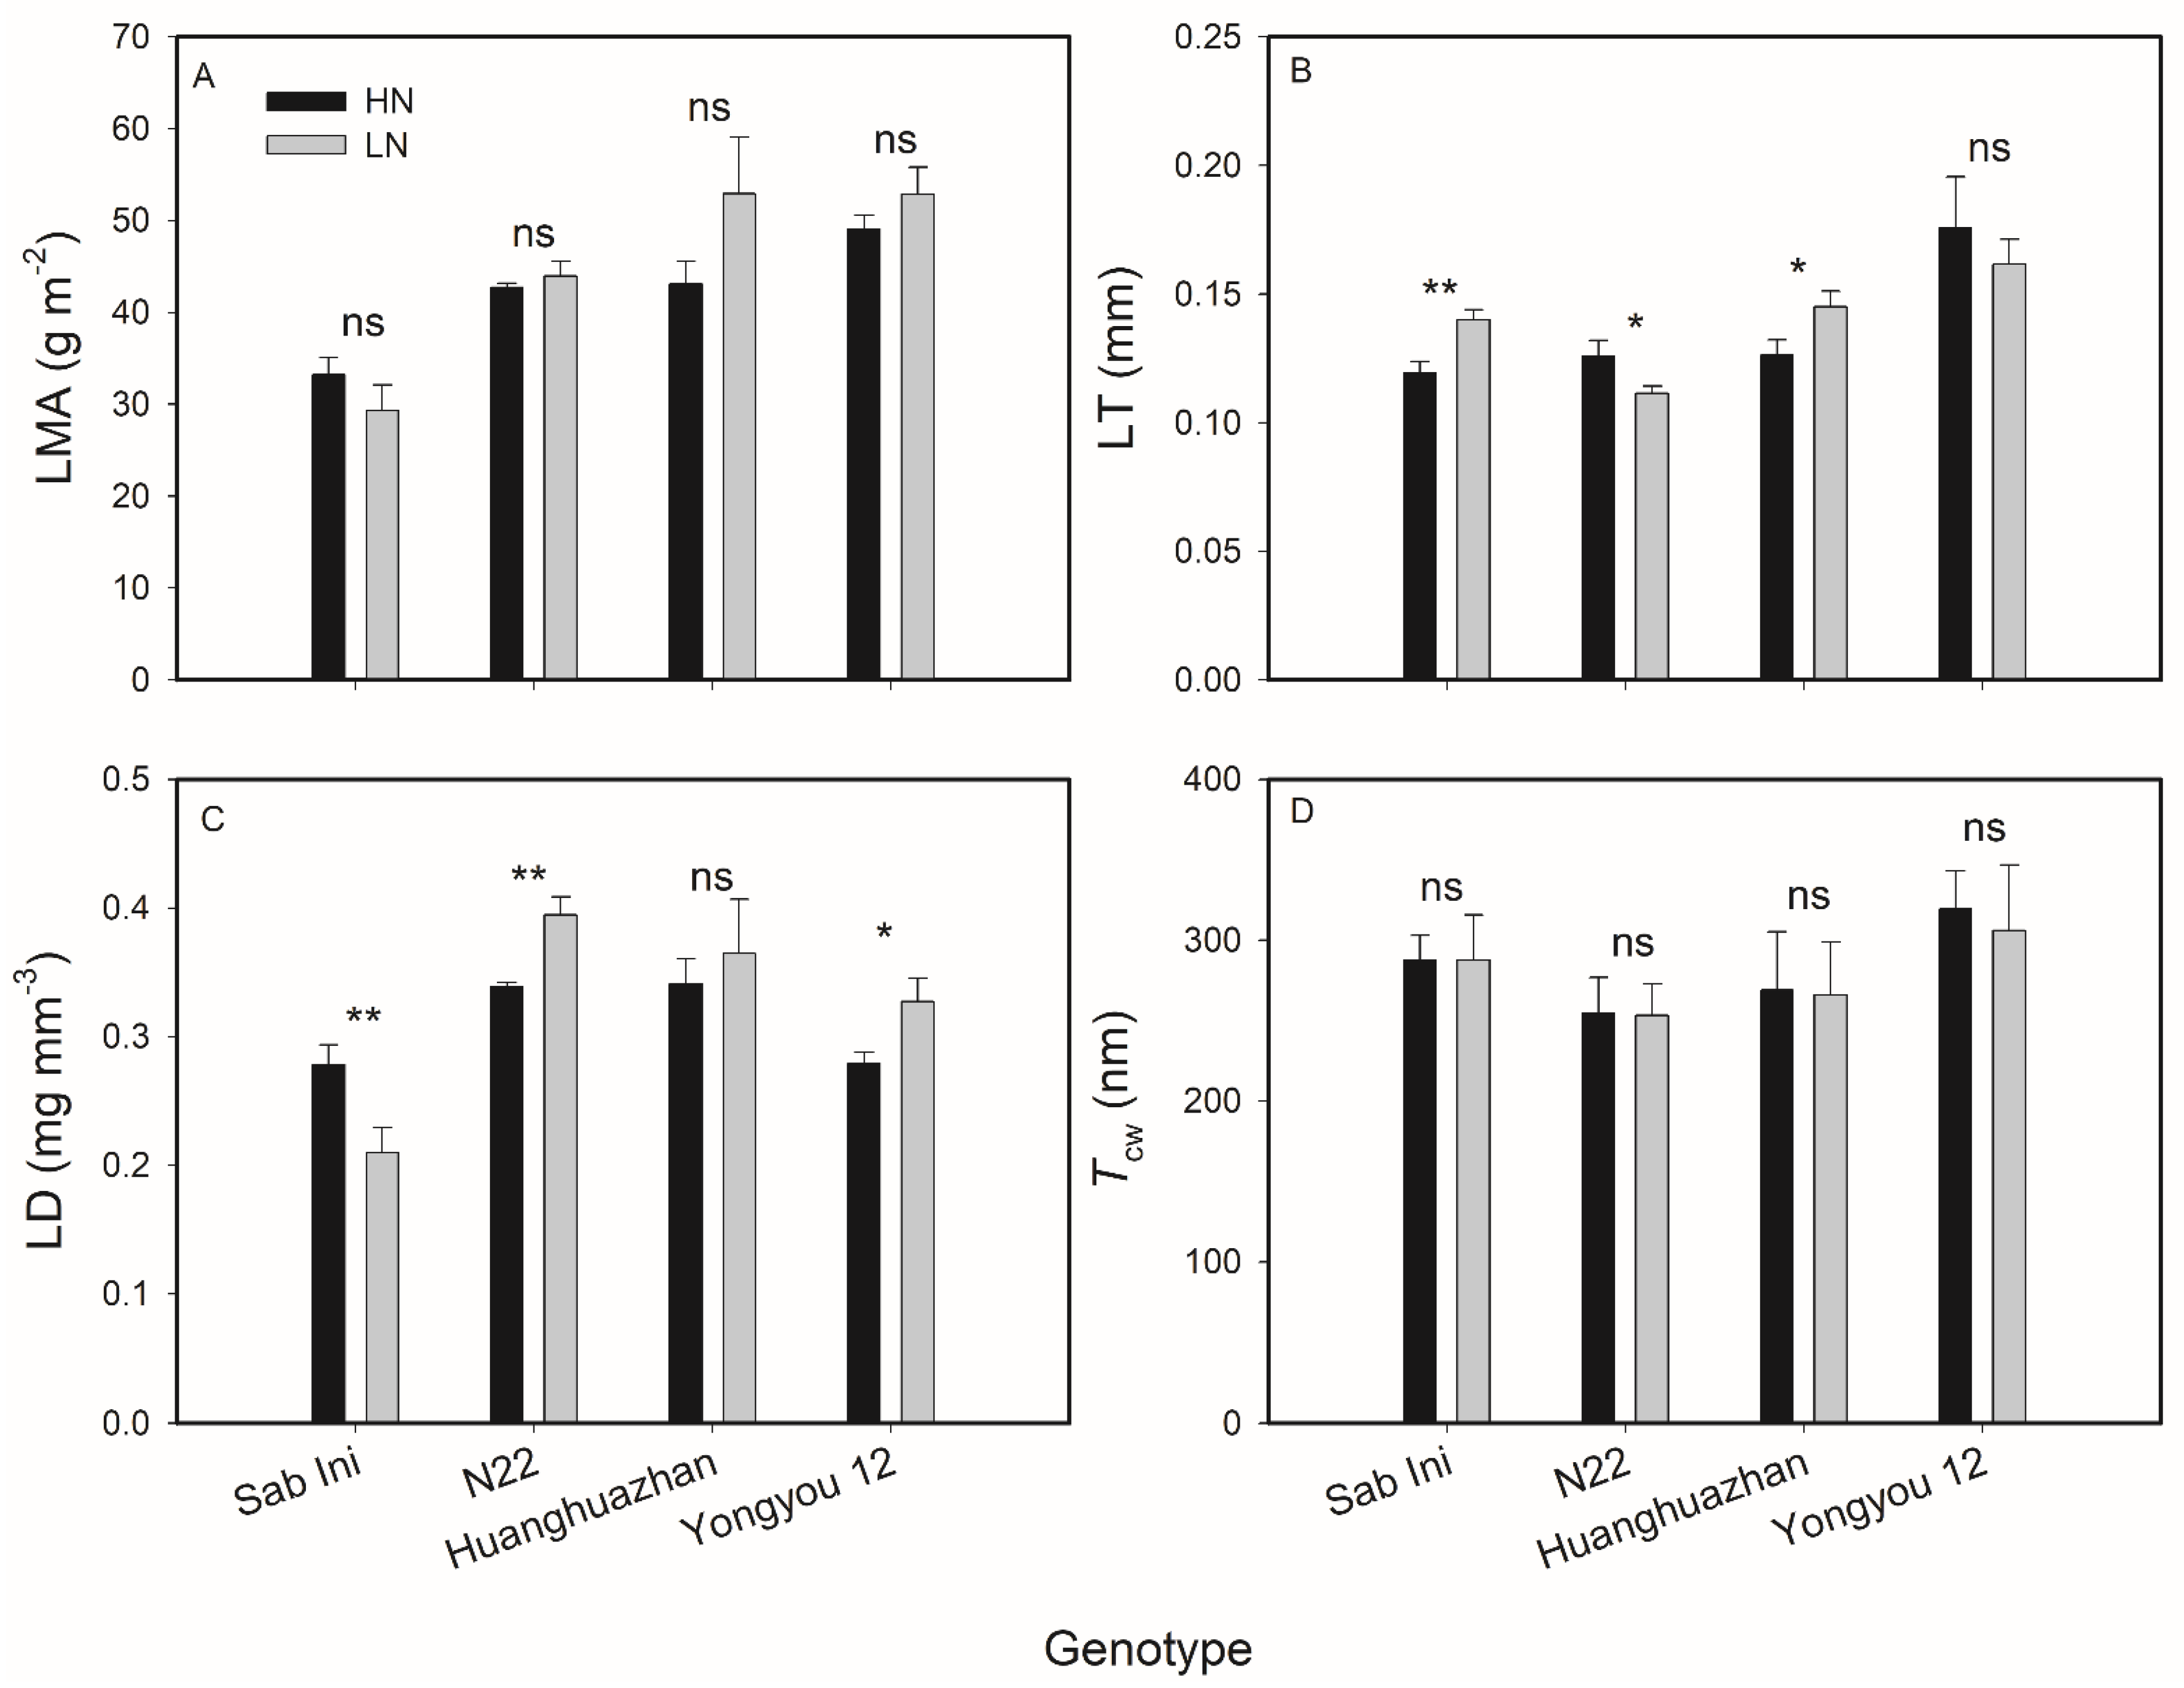
3.2. Effects of N Supplies on Rice Leaf Anatomical Traits

The LM and TEM images of the four genotypes under HN and LN are shown in Figure 2. The anatomical traits are presented in Table S3, and the ANOVA results of the anatomical traits between HN and LN for each genotype are presented in Figure 3. It can be observed that the LMA of the four genotypes showed no significant differences between HN and LN. Except for Yongyou 12, LT of the other three genotypes showed significant differences between HN and LN, but different genotypes responded differently to the N supplies; LT of Sab Ini and Huanghuazhan under LN were higher than those under HN, while LT of N22 under LN was lower than that under HN. Except for Huanghuazhan, LD of the other three genotypes all showed significant differences between HN and LN; LD of Sab Ini under LN was lower than that under HN, LD of N22 and Yongyou 12 under LN were higher than those under HN. Tcw of the four genotypes showed no significant differences between HN and LN.

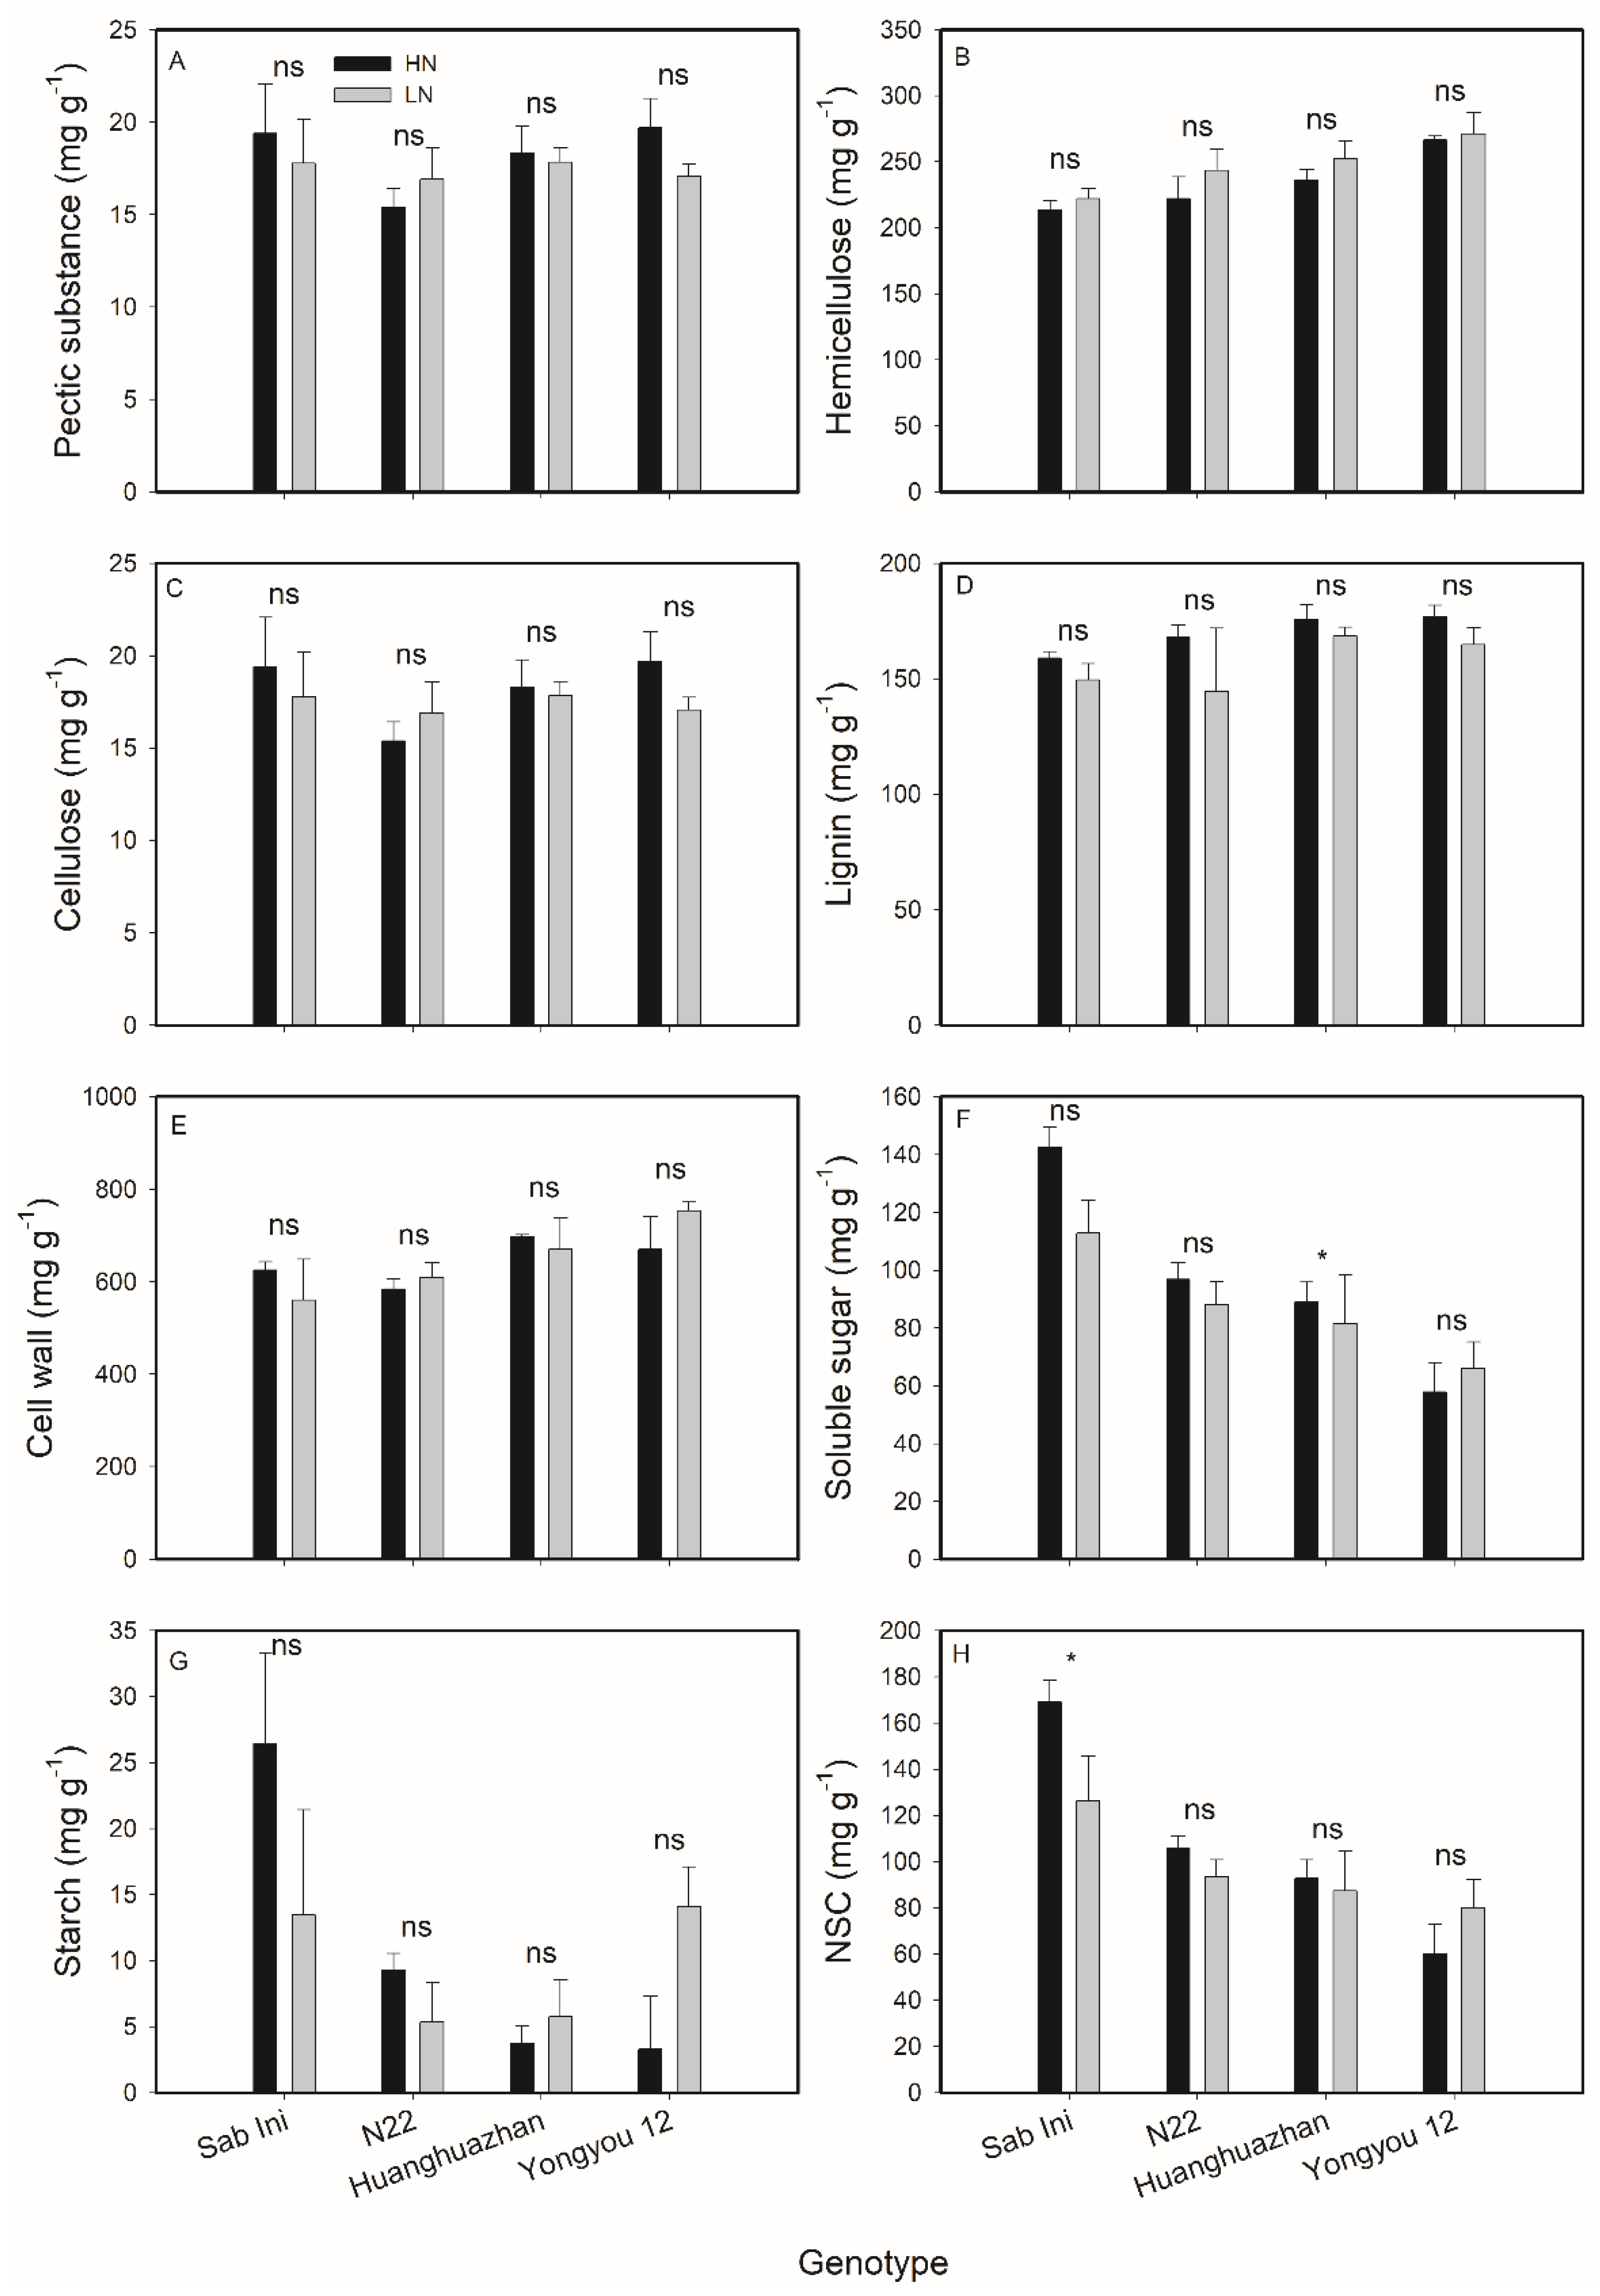
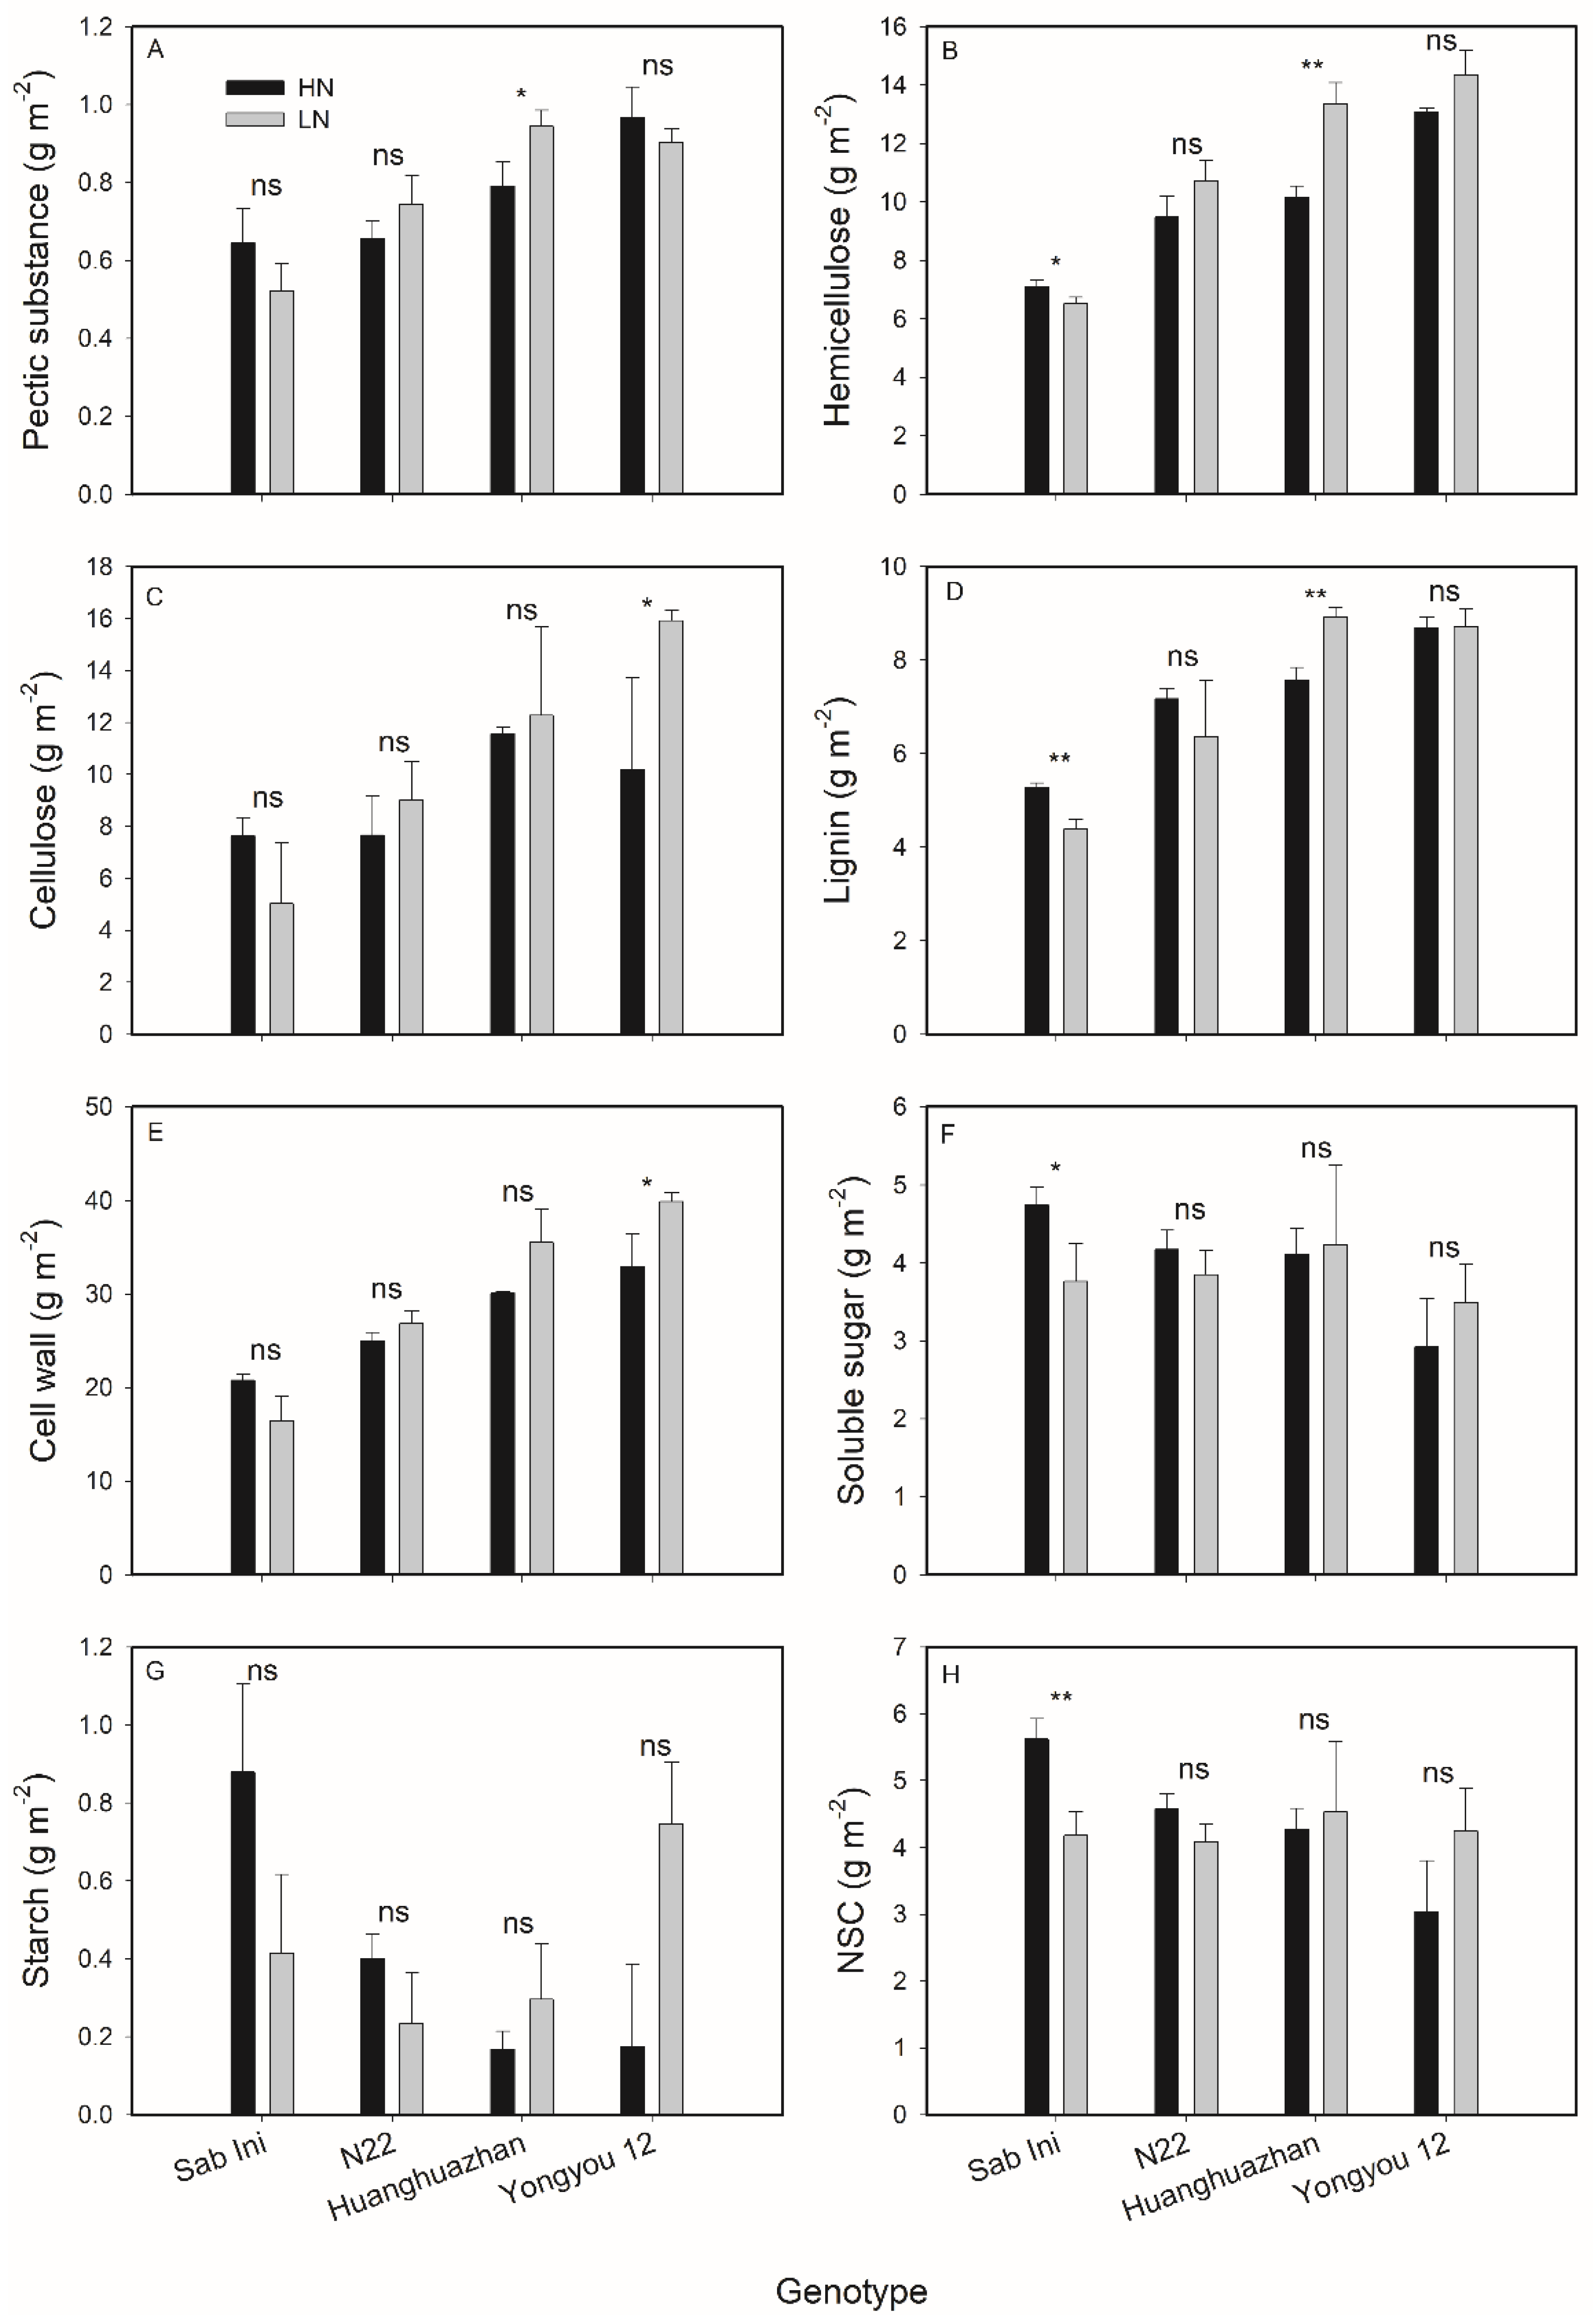
3.3. Effects of N Supplies on Rice Leaf Chemical Composition

The mass-based leaf chemical components content of the four genotypes are presented in Table S4; the ANOVA results of the mass-based leaf chemical components content between HN and LN for each genotype are shown in Figure 4. It can be observed that the soluble sugar content of Huanghuazhan under HN was higher than that under LN; the NSC content of Sab Ini under HN was higher than that under LN. Other mass-based leaf chemical components content of the four genotypes showed no significant differences between HN and LN.
The area-based leaf chemical components content is presented in Table S5; the ANOVA results of area-based leaf chemical components content between HN and LN for each genotype are shown in Figure 5. It can be observed that the pectic substance content of Huanghuazhan under LN was higher than that under HN; the hemicellulose content of Sab Ini under HN was higher than that under LN, while it showed an opposite result in Huanghuazhan; the cellulose content of Yongyou 12 under LN was higher than that under HN; the lignin content of Sab Ini under HN was higher than that under LN, and it showed an opposite result in Huanghuazhan; the cell wall content of Yongyou 12 under LN was higher than that under HN; the soluble sugar and NSC contents of Sab Ini under HN were higher than those under LN.

4. Discussion

Two N application rates were set in the present study to investigate the effects of N supplies on rice leaf anatomy and leaf chemical composition as well as their effects on leaf gas exchange. The results can provide optimal N application strategies for high photosynthetic N use efficiency (PNUE) in rice. The results showed that the Nmass and Narea of the four genotypes under HN were all higher than those under LN, indicating that the N supply significantly improved the leaf N contents. However, even under HN, the Narea of the four genotypes were only 0.83, 1.03, 1.03, and 1.08 g m−2, respectively, which showed relatively low levels. Among the four genotypes, A of Huanghuazhan showed no significant difference between HN and LN, while A of the other three genotypes under HN were all higher than those under LN, implying that A of Huanghuazhan was insensitive to N supply. gs, gm, and PNUE of the four genotypes showed no significant differences between HN and LN, perhaps due to the limited differences in Narea between HN and LN, especially for Huanghuazhan, of which the Narea under HN was only 6.3% higher than that under LN. To further investigate the effects of N application rates on rice, gs, gm, and PNUE need to enlarge the N treatment difference.
The effects of N supplies on LMA have been frequently reported; however, consentient conclusions are lacking. Domínguez et al. [40] found that LMA of Mediterranean woody plant decreased with Nmass. Li et al. [24] reported that LMA of rice cultivar Shanyou 63 and Yangdao 6 showed no differences between HN and LN. Liu and Li [26] investigated the response of LMA to N supplies in 12 rice cultivars, and found that the response of LMA to N supplies showed varietal differences; LMAs under HN were higher than those under LN in some cultivars, while no differences in other cultivars were shown. Xiong et al. [25] found that LMA of rice cultivar Heshengwanyou 1 showed no difference between HN and LN. In the present study, the LMA of rice flag leaves showed no differences between HN and LN, indicating that the N supplies had no significant effects on rice LMA.
The response of leaf thickness (LT) to N supplies showed varying results in previous studies. Li et al. [41] reported that rice LT decreased with N application rates. Xiong et al. [25] found that LT of rice cultivar Heshengwanyou 1 showed no difference between HN and LN. Different results may be attributed to different N treatment levels. In the present study, LT of Yongyou 12 showed no difference between HN and LN, while LTs of the other three cultivars showed different responses to N application rates. In addition, except for Huanghuazhan, LDs of the other three cultivars also showed different responses to N application rates. For Tcw, several previous studies showed that Tcw increased under N deficit [25,42]. In the present study, Tcw of the four genotypes all showed no significant differences between HN and LN, implying that rice leaf Tcw is not sensitive to N supplies. Modifying leaf anatomy by inputting more N to improve rice leaf photosynthetic capacity needs to be reconsidered.
Except for the anatomical traits mentioned above, other mesophyll anatomical traits associated with gm, including the mesophyll cell wall surface area exposed to intercellular airspace per leaf area (Sm), the surface area of chloroplasts exposed to intercellular airspace per leaf area (Sc) and the fraction of intercellular airspace (fias), were reported to be affected by N application rates. For example, Xiong et al. [25] found that Sm and Sc of HN rice leaves were higher than those of LN leaves. Whether N supplies affect these anatomical traits and then influences leaf gas exchange requires further investigation.
N supplies can affect the allocations of leaf dry matter to different compositions [27]. However, N supplies rarely affect the mass-based leaf chemical components content, which refers to the concentrations of the chemical components, with a very few exceptions. The area-based leaf chemical components content showed significant differences between HN and LN on some occasions. In Yongyou 12, the total cell wall content under LN was higher than that under HN. The possible reason may be that an N deficit forced Yongyou 12 to allocate more leaf mass to structural tissues, mainly referring to cell walls, to support leaves and enhance toughness [43]. Therefore, although the cell walls of Yongyou 12 have not responded to N supplies in its structure, it showed a response in its content. Applying more N fertilizer may thin the cell wall of this widely grown and high-yielding cultivar in China, and then improve the photosynthetic capacity and further increase the yield.
Except for influencing the allocation of leaf mass, N can also affect the allocation of N to each chemical component. Mu et al. [27] found that, under N deficit, maize tended to allocate more N to bioenergetics to sustain electron transport. Liu et al. [44] reported that under LN, oilseed rape invested more N to photosynthetic processes, while investing less N to non-photosynthetic components. The effects of N supply on the allocation of N to each component, especially to structural tissues and proteins associated with photosynthesis in rice, requires further investigation.

5. Conclusions

Nmass and Narea under HN were both higher than those under LN. Except for Huanghuazhan, A values of the rice genotypes under HN were all higher than those under LN; gs, gm, and PNUE all showed no significant differences between HN and LN. LMA and Tcw showed no significant differences between HN and LN; the responses of LT and LD to N supply showed varying differences. Mass-based leaf chemical components content showed no obvious differences between HN and LN. For area-based leaf chemical components, the soluble sugar and NSC contents decreased under LN in Sab Ini, and the cell wall content increased under LN in Yongyou 12. Further investigation is needed regarding the various differences in the responses of leaf chemical components content to N supplies.

Supplementary Materials

The following supporting information can be downloaded at: https://www.mdpi.com/article/10.3390/agriculture12020215/s1. Table S1: The apparent CO2 photocompensation point (Ci*) and the day respiration rate (Rd) in the flag leaves of the tested rice genotypes under different nitrogen supplies; Table S2: Effects of nitrogen supplies on leaf nitrogen contents, gas exchange parameters and photosynthetic nitrogen use efficiency in the flag leaves of the tested rice genotypes; Table S3: Effects of nitrogen supplies on leaf anatomical traits in the flag leaves of the tested rice genotypes; Table S4: Effects of nitrogen supplies on mass-based leaf chemical compositions in the flag leaves of the tested rice genotypes; Table S5: Effects of nitrogen supplies on area-based leaf chemical compositions in the flag leaves of the tested rice genotypes.

Author Contributions

Investigation, M.Y., Z.Z. (Zhengcan Zhang), and G.H.; supervision, Z.Z. (Zujian Zhang); writing—original draft, M.Y.; writing—review and editing, Z.Z. (Zujian Zhang). All authors have read and agreed to the published version of the manuscript.

Funding

This research was Funded by China Postdoctoral Science Foundation (2021M702769).

Conflicts of Interest

The authors declare no conflict of interest.

References

  1. Evans, J.R.; Kaldenhoff, R.; Genty, B.; Terashima, I. Resistances along the CO2 diffusion pathway inside leaves. J. Exp. Bot. 2009, 60, 2235–2248. [Google Scholar] [CrossRef] [Green Version]
  2. Li, Y.; Gao, Y.; Xu, X.; Shen, Q.; Guo, S. Light-saturated photosynthetic rate in high-nitrogen rice (Oryza sativa L.) leaves is related to chloroplastic CO2 concentration. J. Exp. Bot. 2009, 60, 2351–2360. [Google Scholar] [CrossRef]
  3. Yamori, W.; Nagai, T.; Makino, A. The rate-limiting step for CO2 assimilation at different temperatures is influenced by the leaf nitrogen content in several C3 crop species. Plant Cell Environ. 2011, 34, 764–777. [Google Scholar] [CrossRef]
  4. Flexas, J.; Barbour, M.M.; Brendel, O.; Cabrera, H.M.; Carriquí, M.; Díaz-Espejo, A.; Gallé, A. Mesophyll diffusion conductance to CO2: An unappreciated central player in photosynthesis. Plant Sci. 2012, 193, 70–84. [Google Scholar] [CrossRef]
  5. Adachi, S.; Nakae, T.; Uchida, M.; Soda, K.; Takai, T.; Oi, T.; Hirasawa, T. The mesophyll anatomy enhancing CO2 diffusion is a key trait for improving rice photosynthesis. J. Exp. Bot. 2013, 64, 1061–1072. [Google Scholar] [CrossRef] [Green Version]
  6. Gago, J.; Carriquí, M.; Nadal, M.; Clemente-Moreno, M.J.; Coopman, R.E.; Fernie, A.R.; Flexas, J. Photosynthesis optimized across land plant phylogeny. Trends Plant Sci. 2019, 24, 947–958. [Google Scholar] [CrossRef] [PubMed]
  7. Nakhoul, N.L.; Davis, B.A.; Romero, M.F.; Boron, W.F. Effect of expressing the water channel aquaporin-1 on the CO2 permeability of Xenopus oocytes. Am. J. Physiol.-Cell Physiol. 1998, 274, C543–C548. [Google Scholar] [CrossRef] [PubMed]
  8. Uehlein, N.; Lovisolo, C.; Siefritz, F.; Kaldenhoff, R. The tobacco aquaporin NtAQP1 is a membrane CO2 pore with physiological functions. Nature 2003, 425, 734–737. [Google Scholar] [CrossRef] [PubMed]
  9. Huang, X.; Wang, Z.; Huang, J.; Peng, S.; Xiong, D. Mesophyll conductance variability of rice aquaporin knockout lines at different growth stages and growing environments. Plant J. 2021, 107, 1503–1512. [Google Scholar] [CrossRef] [PubMed]
  10. Poorter, H.; Niinemets, Ü.; Poorter, L.; Wright, I.J.; Villar, R. Causes and consequences of variation in leaf mass per area (LMA): A meta-analysis. New Phytol. 2009, 182, 565–588. [Google Scholar] [CrossRef]
  11. Ye, M.; Zhang, Z.; Huang, G.; Xiong, Z.; Peng, S.; Li, Y. High leaf mass per area Oryza genotypes invest more leaf mass to cell wall and show a low mesophyll conductance. AoB Plants 2020, 12, plaa028. [Google Scholar] [CrossRef]
  12. Roig-Oliver, M.; Fullana-Pericàs, M.; Bota, J.; Flexas, J. Adjustments in photosynthesis and leaf water relations are related to changes in cell wall composition in Hordeum vulgare and Triticum aestivum subjected to water deficit stress. Plant Sci. 2021, 311, 111015. [Google Scholar] [CrossRef] [PubMed]
  13. Peng, L.; Hocart, C.H.; Redmond, J.W.; Williamson, R.E. Fractionation of carbohydrates in Arabidopsis root cell walls shows that three radial swelling loci are specifically involved in cellulose production. Planta 2000, 211, 406–414. [Google Scholar] [CrossRef] [PubMed]
  14. Flexas, J.; Clemente-Moreno, M.J.; Bota, J.; Brodribb, T.J.; Gago, J.; Mizokami, Y.; Nadal, M.; Perera-Castro, A.V.; Roig-Oliver, M.; Sugiura, D.; et al. Cell wall thickness and composition are involved in photosynthetic limitation. J. Exp. Bot. 2021, 72, 3971–3986. [Google Scholar] [CrossRef] [PubMed]
  15. Taylaran, R.D.; Adachi, S.; Ookawa, T.; Usuda, H.; Hirasawa, T. Hydraulic conductance as well as nitrogen accumulation plays a role in the higher rate of leaf photosynthesis of the most productive variety of rice in Japan. J. Exp. Bot. 2011, 62, 4067–4077. [Google Scholar] [CrossRef] [PubMed] [Green Version]
  16. Makino, A. Rubisco and nitrogen relationships in rice: Leaf photosynthesis and plant growth. J. Soil Sci. Plant Nutr. 2003, 49, 319–327. [Google Scholar] [CrossRef] [Green Version]
  17. Azcón-Bieto, J. Inhibition of photosynthesis by carbohydrates in wheat leaves. Plant Physiol. 1983, 73, 681–686. [Google Scholar] [CrossRef] [PubMed] [Green Version]
  18. Bailey-Serres, J.; Parker, J.E.; Ainsworth, E.A.; Oldroyd, G.E.; Schroeder, J.I. Genetic strategies for improving crop yields. Nature 2019, 575, 109–118. [Google Scholar] [CrossRef] [PubMed] [Green Version]
  19. Takai, T.; Adachi, S.; Taguchi-Shiobara, F.; Sanoh-Arai, Y.; Iwasawa, N.; Yamamoto, T. A natural variant of NAL1, selected in high-yield rice breeding programs, pleiotropically increases photosynthesis rate. Sci. Rep. 2013, 3, 2149. [Google Scholar] [CrossRef]
  20. Peng, S.; Garcia, F.V.; Laza, R.C.; Sanico, A.L.; Visperas, R.M.; Cassman, K.G. Increased N-use efficiency using a chlorophyll meter on high-yielding irrigated rice. Field Crop Res. 1996, 47, 243–252. [Google Scholar] [CrossRef]
  21. Huang, L.; Sun, F.; Yuan, S.; Peng, S.; Wang, F. Different mechanisms underlying the yield advantage of ordinary hybrid and super hybrid rice over inbred rice under low and moderate N input conditions. Field Crops Res. 2018, 216, 150–157. [Google Scholar] [CrossRef]
  22. Ye, M.; Peng, S.; Li, Y. Intraspecific variation in photosynthetic nitrogen-use efficiency is positively related to photosynthetic rate in rice (Oryza sativa L.) plants. Photosynthetica 2019, 57, 311–319. [Google Scholar] [CrossRef] [Green Version]
  23. Evans, J.R. Nitrogen and photosynthesis in the flag leaf of wheat (Triticum aestivum L.). Plant Physiol. 1983, 72, 297–302. [Google Scholar] [CrossRef] [PubMed] [Green Version]
  24. Li, Y.; Ren, B.; Ding, L.; Shen, Q.; Peng, S.; Guo, S. Does chloroplast size influence photosynthetic nitrogen use efficiency? PLoS ONE 2013, 8, e62036. [Google Scholar] [CrossRef] [Green Version]
  25. Xiong, D.; Liu, X.; Liu, L.; Douthe, C.; Li, Y.; Peng, S.; Huang, J. Rapid responses of mesophyll conductance to changes of CO2 concentration, temperature and irradiance are affected by N supplies in rice. Plant Cell Environ. 2015, 38, 2541–2550. [Google Scholar] [CrossRef]
  26. Liu, X.; Li, Y. Varietal difference in the correlation between leaf nitrogen content and photosynthesis in rice (Oryza sativa L.) plants is related to specific leaf weight. J. Integr. Agric. 2016, 15, 2002–2011. [Google Scholar] [CrossRef]
  27. Mu, X.; Chen, Q.; Chen, F.; Yuan, L.; Mi, G. Within-leaf nitrogen allocation in adaptation to low nitrogen supply in maize during grain-filling stage. Front. Plant Sci. 2016, 7, 699. [Google Scholar] [CrossRef] [Green Version]
  28. Valentini, R.; Epron, D.; De Angelis, P.; Matteucci, G.; Dreyer, E. In situ estimation of net CO2 assimilation, photosynthetic electron flow and photorespiration in Turkey oak (Q. cerris L.) leaves: Diurnal cycles under different levels of water supply. Plant Cell Environ. 1995, 18, 631–640. [Google Scholar] [CrossRef]
  29. Harley, P.C.; Loreto, F.; Di Marco, G.; Sharkey, T.D. Theoretical considerations when estimating the mesophyll conductance to CO2 flux by analysis of the response of photosynthesis to CO2. Plant Physiol. 1992, 98, 1429–1436. [Google Scholar] [CrossRef] [PubMed] [Green Version]
  30. Brooks, A.; Farquhar, G.D. Effect of temperature on the CO2/O2 specificity of ribulose-1,5-bisphosphate carboxylase/oxygenase and the rate of respiration in the light. Planta 1985, 165, 397–406. [Google Scholar] [CrossRef]
  31. von Caemmerer, S.; Evans, J.R.; Hudson, G.S.; Andrews, T.J. The kinetics of ribulose-1, 5-bisphosphate carboxylase/oxygenase in vivo inferred from measurements of photosynthesis in leaves of transgenic tobacco. Planta 1994, 195, 88–97. [Google Scholar] [CrossRef]
  32. Schneider, C.A.; Rasband, W.S.; Eliceiri, K.W. NIH Image to ImageJ: 25 years of image analysis. Nat. Methods 2012, 9, 671. [Google Scholar] [CrossRef] [PubMed]
  33. Yoshida, S.; Forno, D.A.; Cock, J.H.; Gomez, K.A. Laboratory Manual for Physiological Studies of Rice; International Rice Research Institute Press: Manila, Philippine, 1976. [Google Scholar]
  34. Pucher, G.W.; Leavenworth, C.S.; Vickery, H.B. Determination of starch in plant tissues. Plant Physiol. 1932, 20, 850–853. [Google Scholar]
  35. Wu, Z.; Zhou, H.; Zhang, S.; Liu, Y. Using 222Rn to estimate submarine groundwater discharge (SGD) and the associated nutrient fluxes into Xiangshan Bay, East China Sea. Mar. Pollut. Bull. 2013, 73, 183–191. [Google Scholar] [CrossRef]
  36. Fry, S.C. The Growing Plant Cell Wall: Chemical and Metabolic Analysis; Longman Group Limited: Harlow, UK, 1988. [Google Scholar]
  37. Dische, Z. Color reactions of carbohydrates. Methods Carbohydr. Chem. 1962, 1, 475–514. [Google Scholar]
  38. Sluiter, A.; Hames, B.; Ruiz, R.; Scarlata, C.; Sluiter, J.; Templeton, D.; Crocker, D. Determination of structural carbohydrates and lignin in biomass. Lab. Anal. Proced. 2008, 1617, 1–16. [Google Scholar]
  39. Xu, N.; Zhang, W.; Ren, S.; Liu, F.; Zhao, C.; Liao, H.; Xu, Z.; Huang, J.; Li, Q.; Tu, Y.; et al. Hemicelluloses negatively affect lignocellulose crystallinity for high biomass digestibility under NaOH and H2SO4 pretreatments in Miscanthus. Biotechnol. Biofuels 2012, 5, 58. [Google Scholar] [CrossRef] [Green Version]
  40. Domínguez, M.T.; Aponte, C.; Pérez-Ramos, I.M.; García, L.V.; Villar, R.; Marañón, T. Relationships between leaf morphological traits, nutrient concentrations and isotopic signatures for Mediterranean woody plant species and communities. Plant Soil 2012, 357, 407–424. [Google Scholar] [CrossRef] [Green Version]
  41. Li, J.; Yang, J.; Fei, P.; Song, J.; Li, D.; Ge, C.; Chen, W. Responses of rice leaf thickness, SPAD readings and chlorophyll a/b ratios to different nitrogen supply rates in paddy field. Field Crop Res. 2009, 114, 426–432. [Google Scholar]
  42. Polesskaya, O.G.; Kashirina, E.I.; Andreeva, S.E.; Goryaeva, O.V.; Glazunova, M.A.; Alekhina, N.D. Morphophysiological indices of the source leaf in wheat plants acclimated to conditions of nitrogen nutrition. Russ. J. Plant Physiol. 2001, 48, 716–722. [Google Scholar] [CrossRef]
  43. Takashima, T.; Hikosaka, K.; Hirose, T. Photosynthesis or persistence: Nitrogen allocation in leaves of evergreen and deciduous Quercus species. Plant Cell Environ. 2004, 27, 1047–1054. [Google Scholar] [CrossRef]
  44. Liu, T.; Lu, J.; Ren, T.; Li, X.; Cong, R. Relationship between photosynthetic nitrogen use efficiency and nitrogen allocation in photosynthetic apparatus of winter oilseed rape under different nitrogen levels. J. Plant Nutr. Fert. 2016, 22, 518–524, (In Chinese, with English Abstract). [Google Scholar]
Figure 1. Variations in mass-based leaf nitrogen content (Nmass, (A)), area-based leaf nitrogen content (Narea, (B)), leaf net photosynthetic rate (A, (C)), stomatal conductance (gs, (D)), mesophyll conductance (gm, (E)), and photosynthetic nitrogen use efficiency (PNUE, (F)) in the flag leaves of the four rice genotypes between high (HN) and low (LN) N supply. Parameters were compared between HN and LN for each genotype based on the least significant difference (LSD) test at the 0.05 probability level. *, p < 0.05; **, p < 0.01; ***, p < 0.001; ns, non-significant.
Agriculture 12 00215 g001
Figure 2. Light microscope and transmission microscope images of Sab Ini (AD), N22 (EH), Huanghuazhan (IL) and Yongyou 12 (MP) under high (HN) (A,E,I,M; C,G,K,O) and low (LN) (B,F,J,N; D,H,L,P) nitrogen supply. VB, vascular bundle; BS, vascular bundle sheath; BF, bulliform cell; IAS, intercellular airspace; CW, cell wall; C, chloroplast.
Agriculture 12 00215 g002
Figure 3. Variations in leaf mass per area (LMA, (A)), leaf thickness (LT, (B)), leaf density (LD, (C)) and cell wall thickness (Tcw, (D)) in the flag leaves of the four rice genotypes between high (HN) and low (LN) nitrogen supply. Parameters were compared between HN and LN for each genotype based on the least significant difference (LSD) test at the 0.05 probability level. *, p < 0.05; **, p < 0.01; ns, non-significant.
Agriculture 12 00215 g003
Figure 4. Variations in mass-based pectic substances content (A), hemicellulose content (B), cellulose content (C), lignin content (D), cell wall content (E), soluble sugar content (F), starch content (G) and non-structural carbohydrates (NSC) content (H) in the flag leaves of the four rice genotypes between high (HN) and low (LN) nitrogen supply. Parameters were compared between HN and LN for each genotype based on the least significant difference (LSD) test at the 0.05 probability level. *, p < 0.05; ns, non-significant.
Agriculture 12 00215 g004
Figure 5. Variations in area-based pectic substances content (A), hemicellulose content (B), cellulose content (C), lignin content (D), cell wall content (E), soluble sugar content (F), starch content (G) and non-structural carbohydrates (NSC) content (H) in the flag leaves of the four rice genotypes between high (HN) and low (LN) nitrogen supply. Parameters were compared between HN and LN for each genotype based on the least significant difference (LSD) test at the 0.05 probability level. *, p < 0.05; **, p < 0.01; ns, non-significant.
Agriculture 12 00215 g005
Publisher’s Note: MDPI stays neutral with regard to jurisdictional claims in published maps and institutional affiliations.

