Article

Modelling of Mechanical Properties of Fresh and Stored Fruit of Large Cranberry Using Multiple Linear Regression and Machine Learning

1
Department of Food and Agriculture Production Engineering, University of Rzeszow, 4 Zelwerowicza Street, 35-601 Rzeszów, Poland
2
Department of Biosystems Engineering, Faculty of Environmental and Mechanical Engineering, Poznań University of Life Sciences, Wojska Polskiego 50, 60-627 Poznań, Poland
3
Institute of Agricultural Engineering, Wrocław University of Environmental and Life Sciences, 37b Chełmonskiego Street, 51-630 Wrocław, Poland
*
Author to whom correspondence should be addressed.
Agriculture 2022, 12(2), 200; https://doi.org/10.3390/agriculture12020200
Submission received: 28 December 2021 / Revised: 24 January 2022 / Accepted: 28 January 2022 / Published: 31 January 2022
(This article belongs to the Special Issue Digital Innovations in Agriculture)

Abstract

:
The study investigated the selected mechanical properties of fresh and stored large cranberries. The analyses focused on changes in the energy requirement up to the breaking point and aimed to identify the apparent elasticity index of the fruit of the investigated large cranberry fruit varieties relating to harvest time, water content, as well as storage duration and conditions. After 25 days in storage, the fruit of the investigated varieties were found with a decrease in mean acidity, from 1.56 g⋅100 g−1 to 1.42 g⋅100 g−1, and mean water content, from 89.71% to 87.95%. The findings showed a decrease in breaking energy; there was also a change in the apparent modulus of elasticity, its mean value in the fresh fruit was 0.431 ± 0.07 MPa, and after 25 days of storage it decreased to 0.271 ± 0.08 MPa. The relationships between the cranberry varieties, storage temperature, duration of storage, x, y, and z dimensions of the fruits, and their selected mechanical parameters were modeled with the use of multiple linear regression, artificial neural networks, and support vector machines. Machine learning techniques outperformed multiple linear regression.

1. Introduction

The large cranberry (Vaccinium macrocarpon Aiton) is mainly cultivated as an industrial crop in North America (Canada and north-eastern regions of the USA) since peat soils and wetlands, commonly occurring there, constitute the optimum substrate for cranberry cultivation; the crop is also grown in Europe, mainly in Latvia and Belarus, and, in recent years, in south-eastern Poland [1]. The highest harvest in 2019 was recorded in the USA and amounted to 359,110 tons from a cultivation area of 15,580 ha. In Canada 172,440 tons were harvested from an area of 6393 ha, while in Belarus 235 tons of cranberries from an area of 101 ha [2].
Depending on the variety, the fruit of the large cranberry is spherical with a common diameter of 20 mm and skin color ranging from pink to dark purple [3]. Cranberry fruit and juice are highly valued in medicine because of their antimicrobial and antimycotic properties, producing beneficial effects, for instance, in the treatment of kidney diseases and inflammation of the urinary tract [4,5]. The high contents of polyphenols, including anthocyanins, flavonoids, stilbenes, phenolic acids, and proanthocyanidins also confirm the fact that cranberry fruits offer health benefits [6,7].
The harvesting of cranberries in large plantations is carried out using highly efficient mechanical shakers. “Wet harvesting” technology (where a given section of the plantation is flooded with water) makes it possible to increase the effectiveness of the harvest and to reduce damage to fruit collected mechanically, compared to fruit collected using the “dry harvest” method [8,9,10]. Mechanical defects occurring during harvest, transportation to a processing plant, and handling activities such as cleaning, rinsing, and other post-harvest operations adversely affect the quality of the raw material, eliminating a part of or an entire batch designated for commerce or food processing. This is linked to the fact that the fruit is crushed or bruised leading to a decrease in water content, as well as changes in the texture and firmness of the berries [11]. A decrease in water content in soft fruit after storage was reported in prior literature [12,13].
There is increased usage of this raw material and higher demands regarding quality requirements defined by food and pharmaceutical industries for cranberries, which predominantly are harvested mechanically in commercial plantations. For this reason, it is necessary to investigate the mechanical properties, which will make it possible to determine the timing of harvest and storage conditions. A study investigating the mechanical properties of cranberry skin and flesh was conducted by Gorzelany et al. [14]. Skin and flesh puncture testing was carried out with a cylindrical stamp, with a diameter of 2 mm, which was pressed into the fruit. The recorded measurements included puncture strength and energy and absolute lengthwise deformation.
Given the spherical shape of cranberries of the selected varieties, their mechanical properties may be determined using methodology applicable to spherical fruit, such as high-bush blueberries, redcurrants, tomatoes, onions, and Brussels sprouts [15,16]. The analysis of force-displacement relation showed the value of acceptable force and relative displacement as a reaction to preset load.
In a uniaxial compression test, applied with quasi-static loading, cranberries were compressed between two flat horizontal planes until breaking point [17]. To interpret the results, it is necessary to apply the appropriate statistical methods which make it possible to accurately assess the effect of the selected factors on the relevant mechanical parameters of the fruit of large cranberries as well as the chemical characteristics of the raw material.
Mathematical modelling is a very common method used in food technology and agriculture [18,19,20,21,22]. Accurate models allow the prediction of the physicochemical properties of food and optimize storage conditions. There are two approaches to the mathematical modelling of the mechanical properties of food. The first is based on experimental data (empirical), and the second is based on the physical nature of the phenomenon (theoretical). Since empirical modelling is more precise and easier to develop [23], this approach is becoming increasingly popular. Various methods and techniques are employed for empirical modelling in the food industry, including artificial intelligence techniques such as artificial neural networks (ANNs) and support vector machines (SVMs). Many applications of empirical modelling in the food industry were reported in prior literature. The ANN technique was useful for the determining changes in the water content, protein, and gluten in stored wheat [24], for accurate and rapid prediction of the moisture and fat content of tofu [25], for the development of a crispness prediction model of crunchy food [26], or the estimation of sugar concentration in food products [27]. Chauchard et al. [28] proposed the sensor for acidity prediction in grapes based on NIR spectroscopy and Least-Squared Support Vector Machine regression. The same technique was employed to predict the mechanical properties of prawns [29]. The Support Vector Machine was reported as a regression technique for the development of an accurate model of the soluble solid content of apples [30].
The aim of this research was to investigate the effect of the duration of storage on the fruits’ selected physical (content of water and total acidity) and mechanical properties, including deformation, breaking energy, and apparent elasticity index. The results obtained can be considered a useful tool when the harvesting, transportation, and processing of cranberry fruits is developed and optimized. The acquired results were assessed using statistical analysis and mathematical modelling. The comparison of models developed with the use of multiple linear regression and machine learning was the additional aim of the research.

2. Materials and Methods

2.1. Characteristics of the Research Material

The research material consisted of three cranberry fruit varieties: Ben Lear, Pilgrim, and Stevens, obtained from a plantation located in Radomyśl nad Sanem (50°40′52″ N 21°56′41″ E; Stalowa Wola District, Podkarpackie Region). The cranberry plantation was established in 2014 on plots with a modified substrate, the top layer of which was fine-grained washed sand with a thickness of 0.4 m. The meteorological conditions in the year of research are characterized in Table 1 [31].
Fruits were collected in the maturation stage (fruit being ready for harvest). The date of fruit harvest depended on the variety: 29 September 2018 for the Stevens variety and 10 October 2018 for the Pilgrim and Ben Lear varieties. Fruits of each cranberry variety were divided into three batches: two were placed in cold storage at temperatures of 4 °C and 10 °C, and one sample was stored at a temperature of 20 °C.

2.2. Measurement of the Chemical Properties

The water content of the fresh cranberries and the material kept in cold storage (randomly selected plant samples) was determined using the dryer method (105 °C)—PN-90/A-75101-03 [32], whereas total acidity of the material was determined in accordance with PN-90/A-75101-04 [33].

2.3. Measurement of the Mechanical Properties

The selected mechanical parameters of cranberry fruit (randomly selected samples) were determined in the uniaxial compression test between two horizontal plates using a Zwick/Roell 2010 testing machine (ZwickRoell GmbH & Co. KG, Ulm, Germany). The following parameters were defined for the measurement process: initial stress applied to the sample was 0.1 N, and the speed of the loading panel during the test was 0.5 mm⋅s−1. Values of maximum breaking force F (N) and deformation λ [mm] were recorded after each series of measurements. Characteristics of the force—deformation were determined based on the strength test. A summary value of the unit energy inputs (work) was considered in calculating the values of the apparent elasticity index Ec as a measure of the effective value of mechanical resistance of the investigated material.
E c = 0 λ F λ · d λ 0.26 · x · y · λ
where Ec is an apparent modulus of elasticity, F is a maximum breaking force (N), x and y are the dimensions of the ellipsoid in the direction perpendicular to the acting load (mm), and λ is a deformation in the direction of the loading applied (mm).

2.4. Method of Building Linear Models Using Multiple Linear Regression

Multiple linear regression (MLR) is the most commonly used linear regression. It is often used as a predictive tool, and it helps to explain the relationship between multiple independent variables (X1, X2Xk) and the tested dependent variable (Y). The model’s coefficient of determination, R2, explains the percentage variation in the dependent variable explained by the model; in other words, it is a measure of model fit.
The computational problem of multiple regression is to fit a straight line to a set of points. The most frequently used method for its implementation is the method of least squares. The method enables adjusting parameters of the regression equation so that the sum of squares of distances of measurement points from the determined line is as small as possible.
The equation of the regression line is in the form:
Y = β 0 + β 1 X 1 + β 2 X 2 + + β k X k + ε
where Y is the dependent (explained) variable, [X1, X2,…, Xk] are the independent (explanatory) variables, [β0, β1, β2,…, βk] are the parameters of the equation, and ε is the random component (model residual).
In this study, three regression models were built. The models were named Rλ, RW, and REc, according to the labels of the independent characteristics that were analyzed (λ—deformation, W—breaking energy, and Ec—modulus of elasticity). The whole set of available measurement data consisted of 244 records and included six independent traits: variety, storage temperature, duration of storage, and the x, y, and z dimensions were used for the analyses.

2.5. Artificial Neural Networks

Artificial neural networks (ANNs) are a group of tools that are very useful for regression, classification, clustering, and other tasks. The most important advantage of ANNs is the fact that they are trained based on a data set (e.g., experimental data set) and, therefore, don’t have to be programmed. This means that no prior knowledge about modelled phenomenon is necessary. In this research, a multilayer perceptron (MLP) was used for nonlinear regression. MLP consists of layers: an input layer, one or more hidden layers, and an output layer. The hidden layers and the output layer are composed of very simple units called artificial neurons. The input layer is composed of nodes that transfer input signals into the structure of ANN. In MLP, signals are forwarded only from the input layer through the hidden layers to the output layer where the output signals of ANN are produced (with no feedback loops). For this research, MLP with one hidden layer was used. The error backpropagation algorithm was employed for MLP training to adjust the connection weights in the network starting from their initial random values. The training process minimizes the error between the target output vector and output signals calculated by the ANN. Some parameters need to be adjusted in the MLP development process, namely the number of neurons in the hidden layers and transfer functions of neurons. During this research, these parameters were adjusted using a trial-and-error method. For each regression model, 5000 ANNs were trained with the use of Statistica v. 13 software. The number of neurons in the hidden layer was changed from 10 to 40. Different activation functions were used, namely sigmoid, hyperbolic tangent, and exponential. The experimental data set of 244 vectors were first normalized and then divided randomly into training, test, and validation sets at a 70:15:15 ratio.

2.6. Sensitivity Analysis

Sensitivity analysis in neural networks is a method that provides information about the relative importance of independent input variables in the model. In this research, the sensitivity analysis implemented in a Statistica v. 13 environment was used to calculate the influence of the input parameters on the output parameter of the ANN model. This method consists of two steps. First, the values of each input variable are replaced by its mean value, calculated based on the training data set. Then an error ratio is calculated. The error ratio is a quotient of the network error with a certain input changed by its mean value, and the network error with the input with the original value is calculated. Based on the error ratios of all input parameters, a percentage influence of independent input variables on the output of an ANN model can be determined. A similar sensitivity analysis method was used by Hadzima-Nyarko et al. [34] to model and analyze the structural damage after an earthquake.

2.7. Support Vector Machines

The support vector machine (SVM) was first proposed by Vapnik [35]. This technique is generally used for classification or nonlinear regression. There are many papers describing details of the underlying concept and the theoretical background of SVM [36,37]. Two types of SVM models can be used for the regression process: ε-type and υ-type support vector regression method. For this research, the ε-SVM regression model was used. The regression function is defined as:
y = f x = w T φ x + b
where w is the weights vector and b is the bias, x is an input feature vector, and y is target vector. The objective function (4) is minimized.
1 2 w T w + C i = 1 N ξ i + C i = 1 N ξ i
subject to the constraints
w T φ x i + b y i ε + ξ i y i w T φ x i b ε + ξ i ξ i ,   ξ i 0 ,   i = 1 ,   ,   N
where C is the capacity constant, ε is the size of the ε-insensitive tube which can be interpreted as the accuracy demanded for the approximation, ϕ(x) is the kernel function, and ξ i ,   ξ i are slack variables. The kernel function is crucial for the performance of the SVM model. Kernel functions used for SVM regression models are e.g., polynomial, sigmoid, and radial basis function (RBF). RBF kernel was reported as the most appropriate for nonlinear regression [38]. Gaussian radial basis function (6) was used as a kernel function in this study.
K x i , x = exp ( γ | x x i | 2 )
When the ε-SVM regression model with RBF kernel function is used, the three parameters should be adjusted: C, ε, and γ. Proper tuning of these parameters can greatly improve the generalization capacity of the model. The correct value of γ parameter in RBF kernel can avoid under-fitting and over-fitting phenomena in prediction [39]. The ε influences the bias significantly, and its optimal value depends on the type of noise present in the dataset [40,41]. The C parameter affects the number of support vectors, and the proper value of C can minimize the over-fitting problem [42]. In this research, C, ε, and γ were adjusted by the trial-and-error method. The dataset was randomly divided into training and validation sets in a ratio of 3:1. The ten-fold cross-validation method was used. All experiments were performed in Statistica v. 13 software.

2.8. Criteria of Accuracy Assessment of Models

The accuracy of the models developed in this research was evaluated based on two criteria, namely coefficient of correlation (R) and root mean squared error (RMSE) which are calculated as follows:
R = ( Y m e a s Y ¯ m e a s ) Y p r e d Y ¯ p r e d ( Y m e a s Y ¯ m e a s ) 2 Y p r e d Y ¯ p r e d 2
R M S E = 1 n i = 1 n Y p r e d Y m e a s 2
where: Ypred is the absolute predicted value, Y ¯ p r e d is the average predicted value, Ymeas is the absolute measured (experimental) value, and Y ¯ m e a s is the average of measured values.
The better a model is, the closer to 1 the R-value is and the closer to 0 the RMSE value is.

3. Results

3.1. Water Content

The mean water content in the fresh fruits of the relevant large cranberry varieties is detailed in Table 2. The results differed slightly and ranged between 89.19 and 90.05%. After 14 days in storage, the water content of the berries decreased on average by 1% compared to fresh fruit. After 25 days of storage the lowest water content was found in the Pilgrim variety (87.66%) and the highest value of the parameter was identified in the Stevens variety (88.12%).

3.2. Acidity of Cranberries

The mean acidity of the fresh fruit representing the selected cranberry varieties is presented in detail in Table 3. The mean acidity was in the range of 1.50–1.60 g⋅100 g−1. After 14 days in storage, the acidity of the berries decreased on average by 0.08 g⋅100 g−1 compared to fresh fruit. After 25 days of storage the lowest acidity was found in the Stevens variety (1.30 g⋅100 g−1) and the highest value of the parameter was identified in the Pilgrim variety (1.50 g⋅100 g−1). Compared to fresh fruit, the most significant decrease in acidity following 25 days of storage was observed in the case of the Stevens variety.

3.3. Mechanical Properties of Cranberry Fruit

Based on the test results (Table 4), it was observed that irrespective of the variety and storage conditions (4 °C, 10 °C, 20 °C), there was a relationship between the selected mechanical parameters of cranberry fruit and duration of storage. The lowest values of the mechanical parameters were identified in the fruit kept in storage for 25 days. Analysis of the specific mechanical parameters showed a significant decrease in their values, which were as follows:
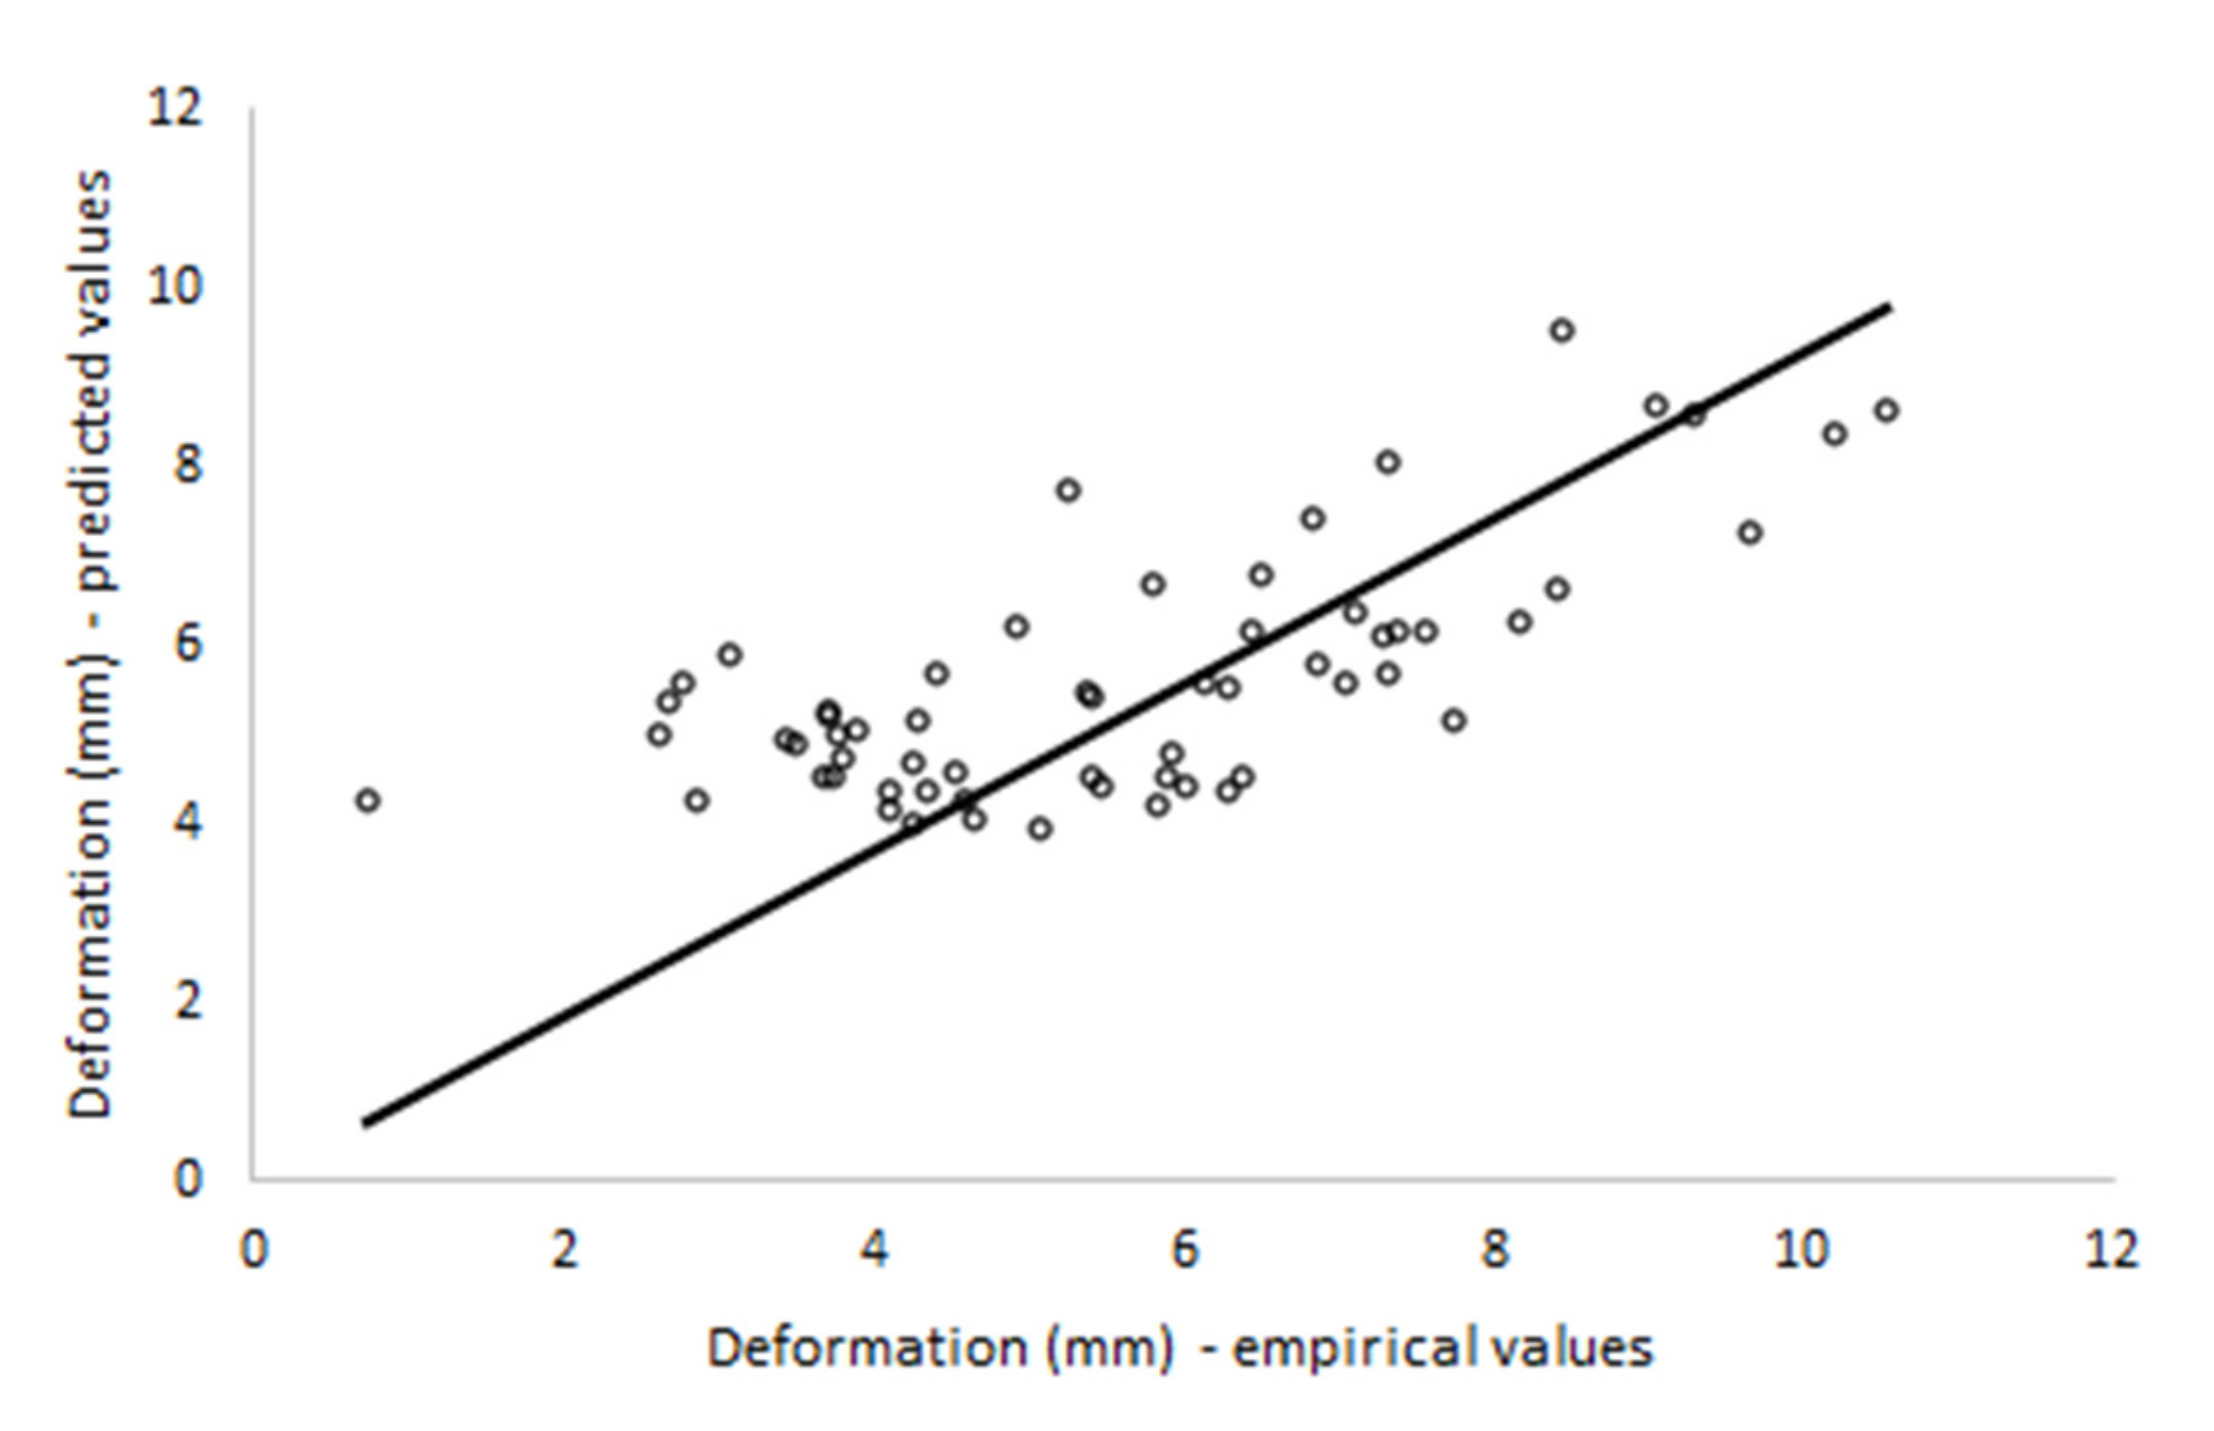
deformation at the breaking point (λ) 7.83 ± 1.47 mm, after 25 days in storage 4.20 ± 1.54 mm;
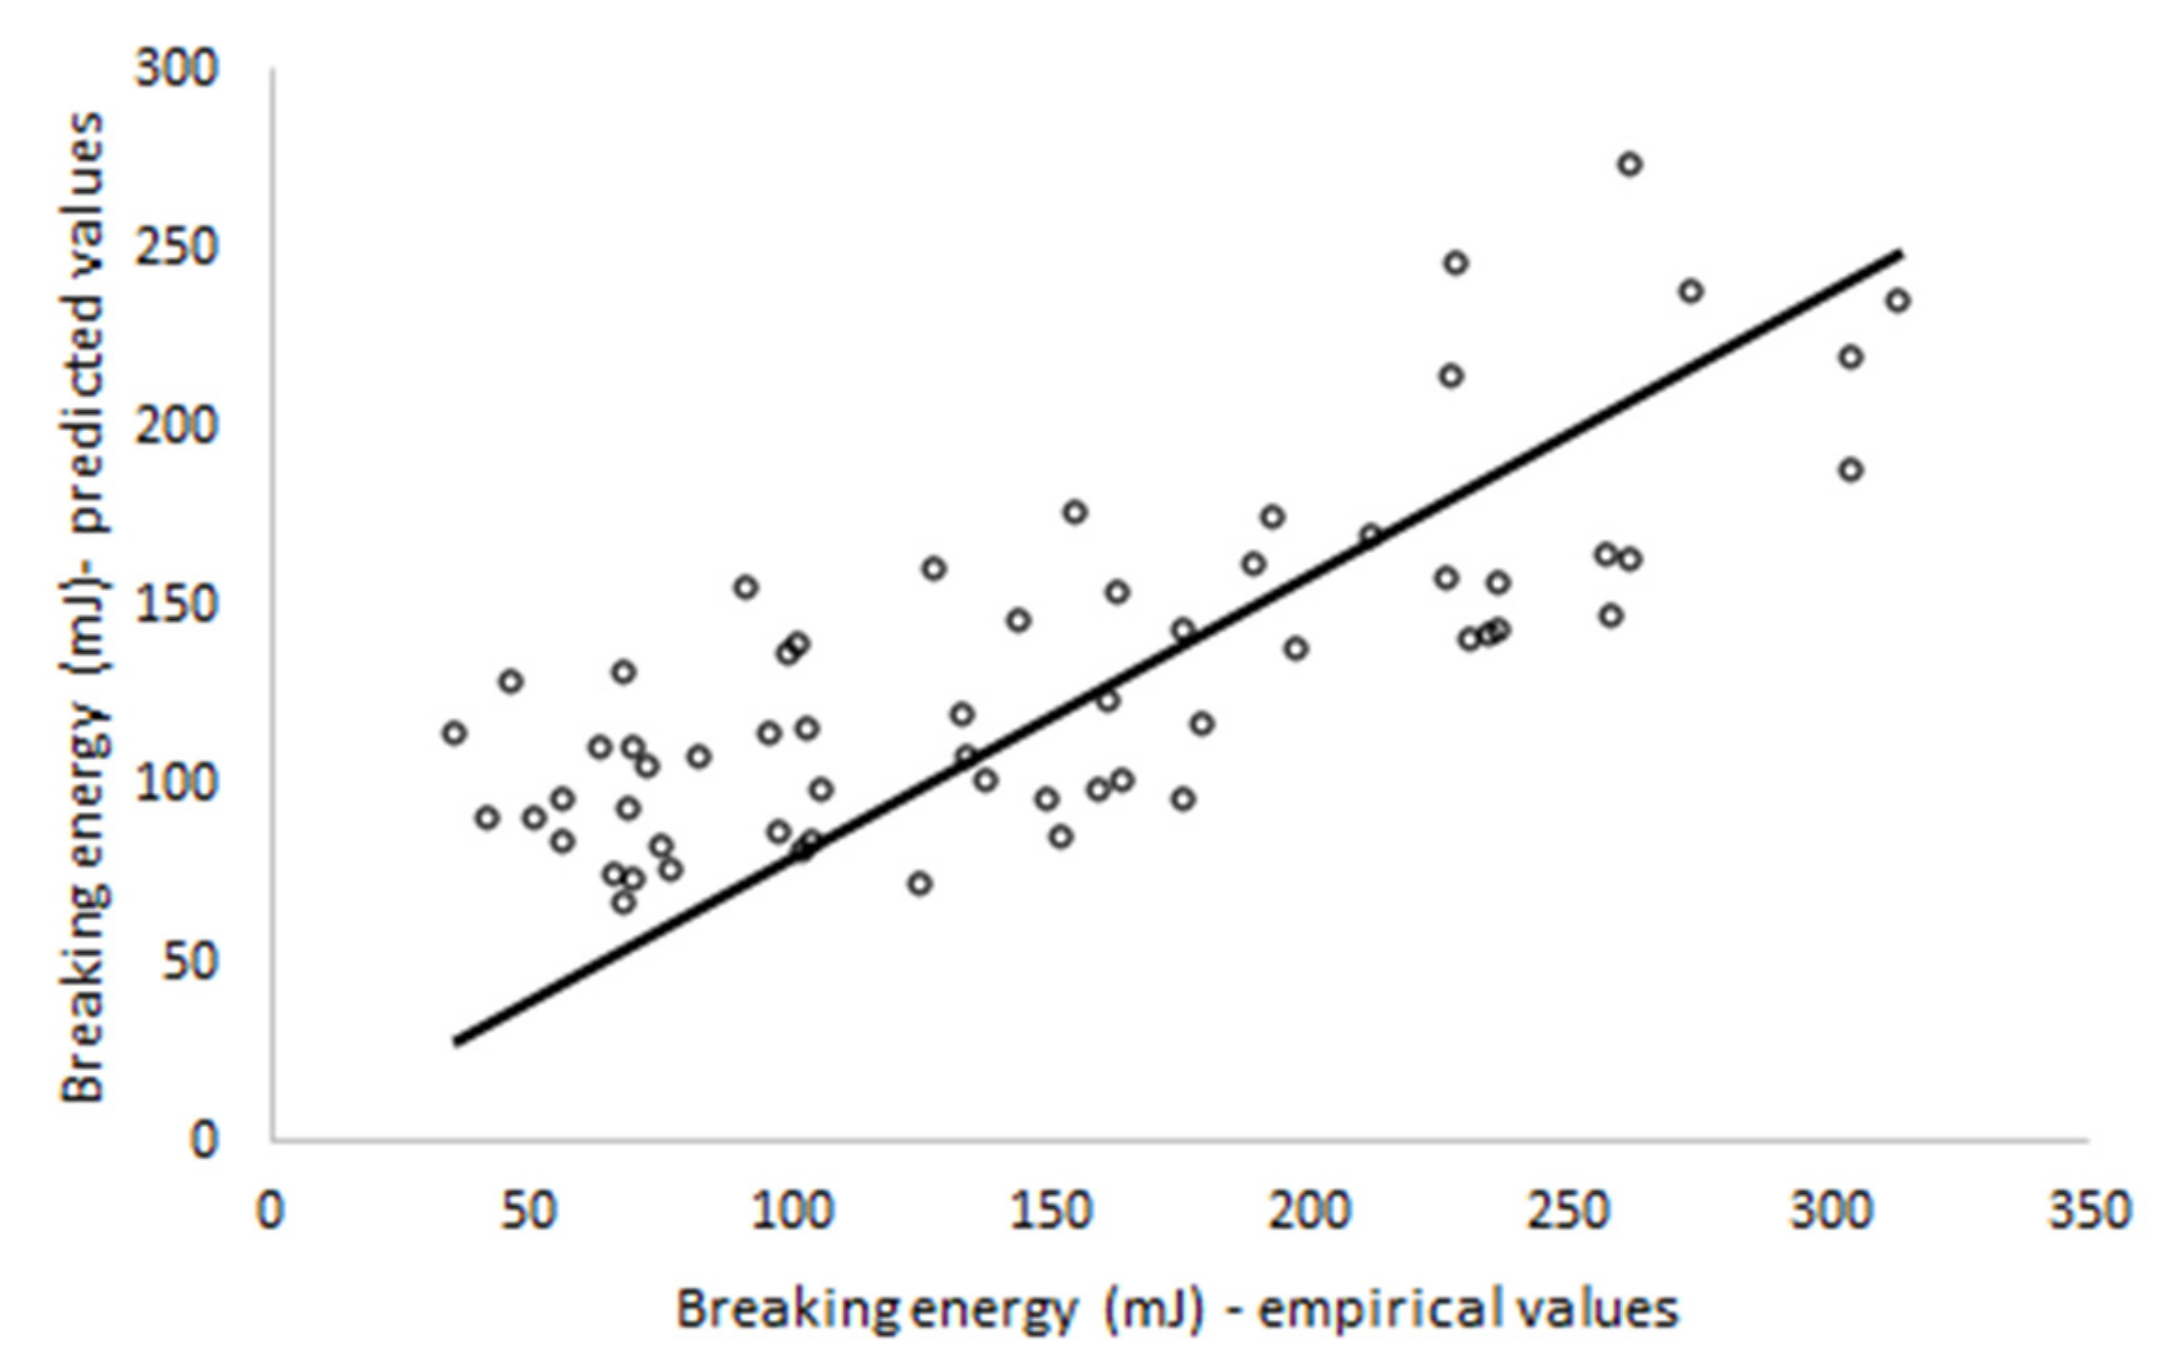
breaking energy (W) 230.74 ± 56.96 mJ, after 25 days in storage 94.96 ± 43.25 mJ;
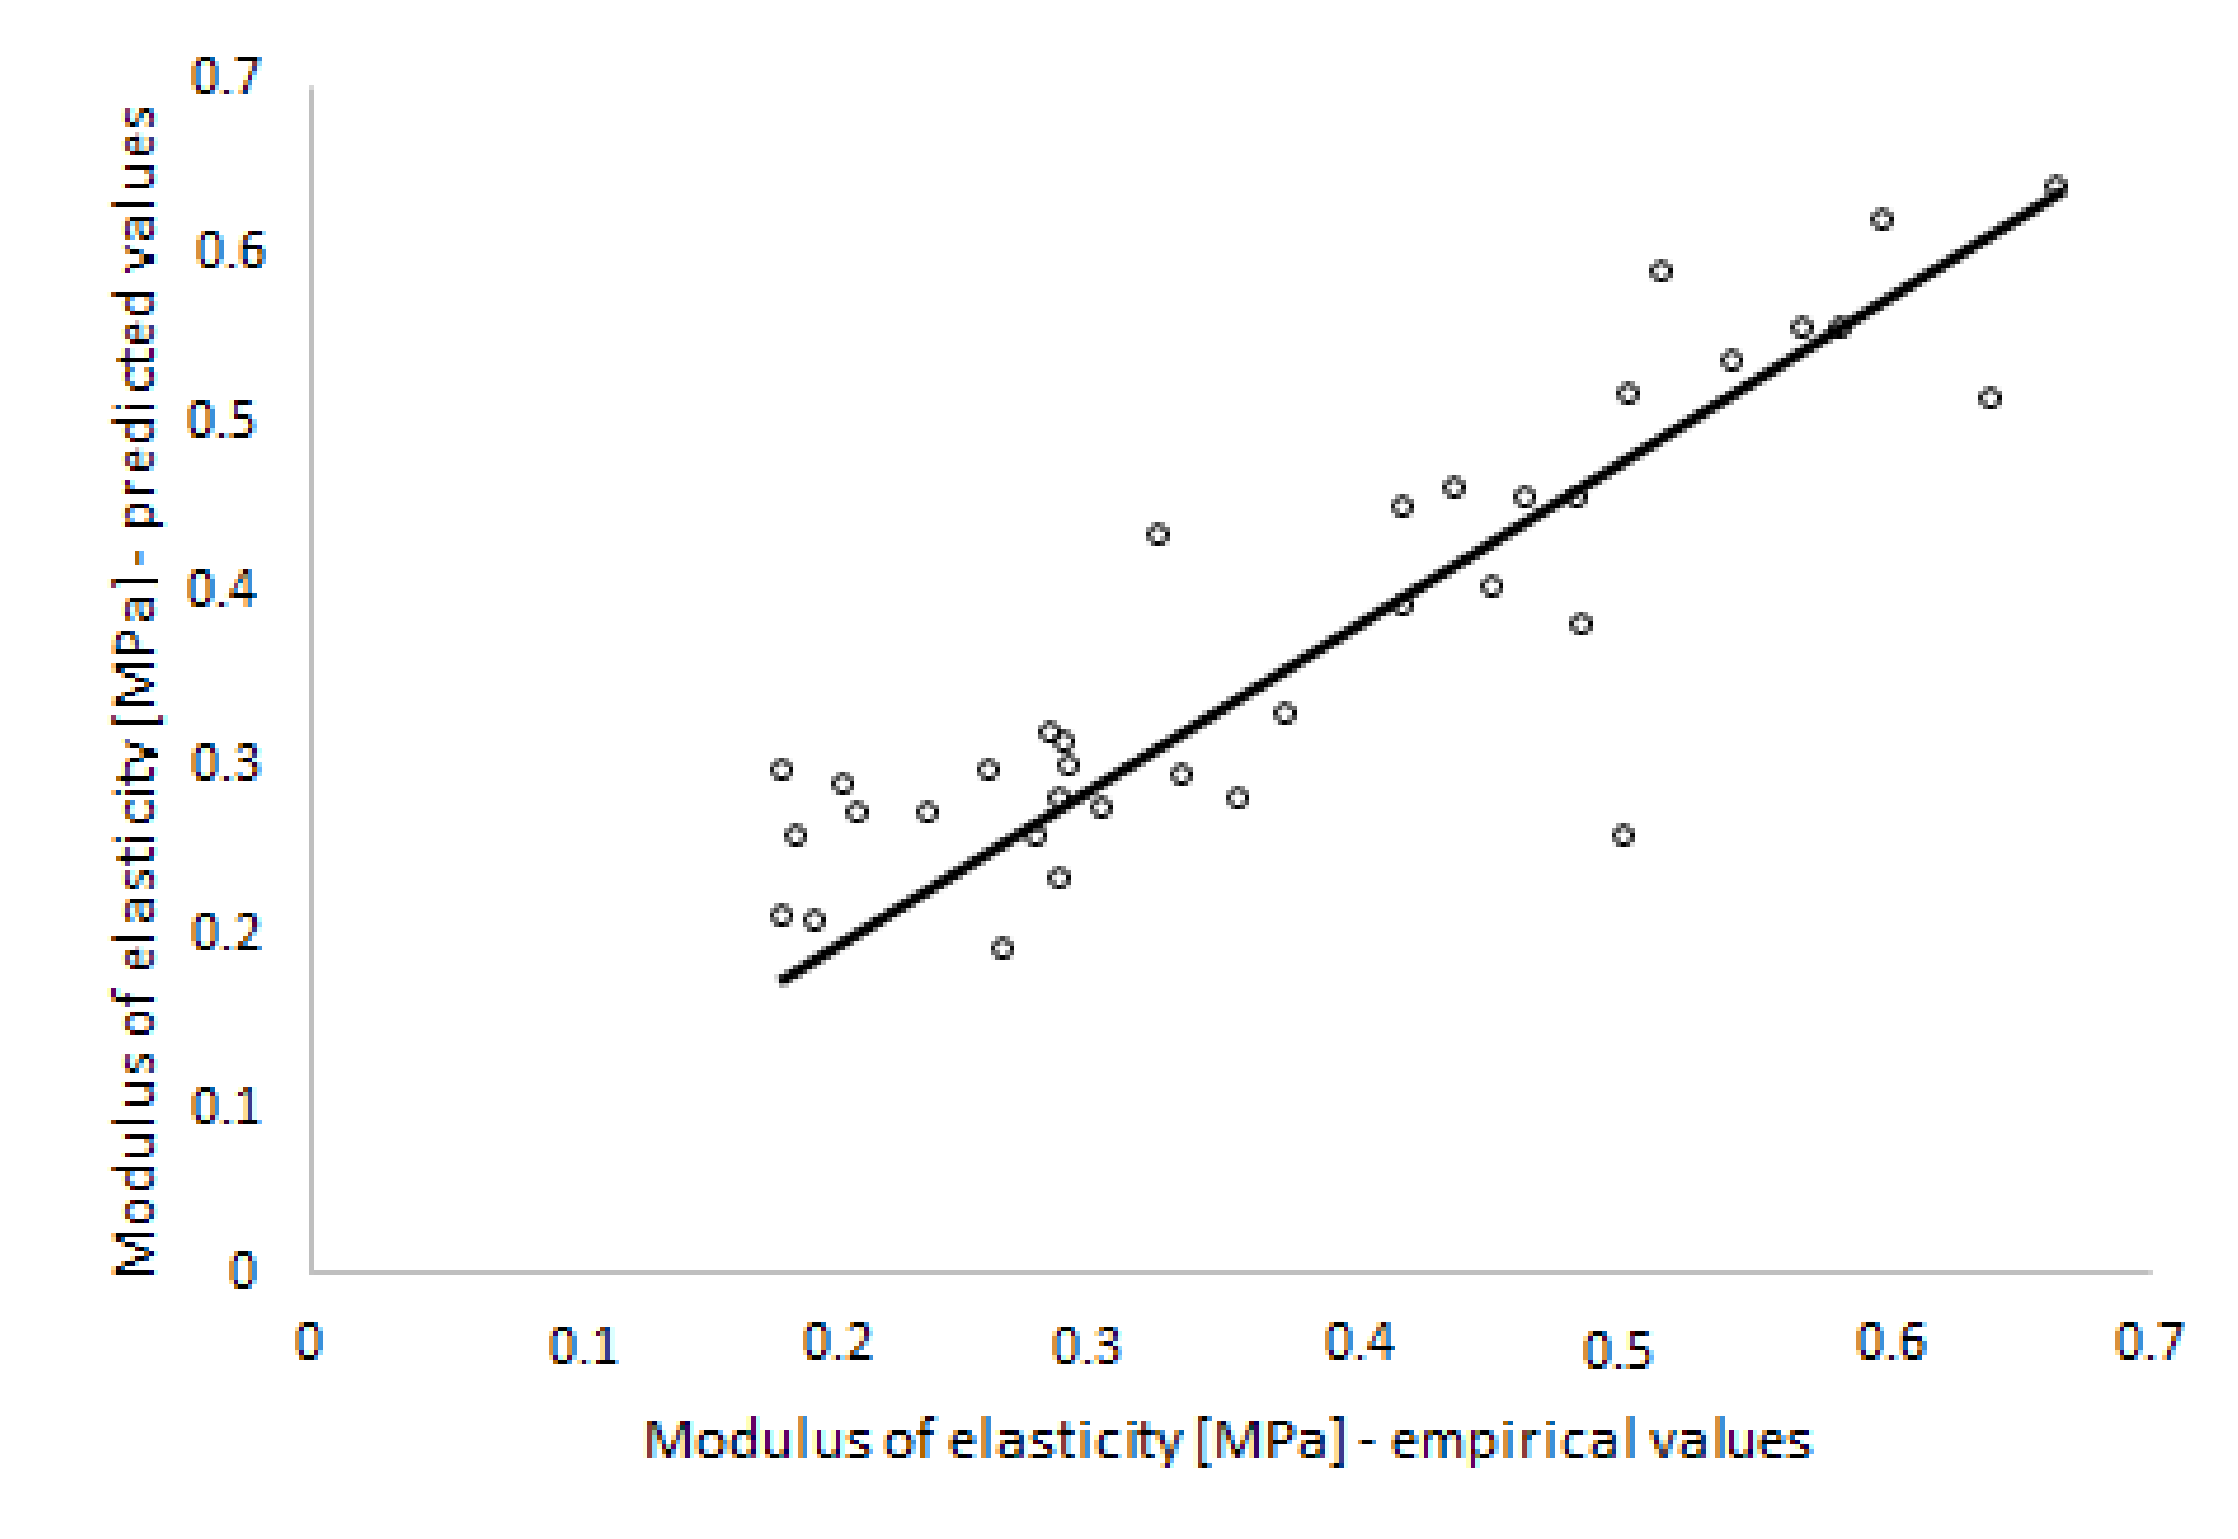
apparent elasticity module (Ec) 0.4306 ± 0.07 MPa, after 25 days in storage 0.2715 ± 0.08 MPa.

3.4. The Results of Multiple Linear Regression

The developed Rλ, RW, and REc regression models were based on six independent variables (variety, storage temperature, duration of storage, x, y and z dimensions). Detailed results of the multiple regression analysis for the presented independent variables and the dependent variables are presented in Table 5.
The variable for which statistical significance was not confirmed at the α = 0.05 level in all models was storage temperature. In the Rλ model, the statistically significant traits were variety, y and x. Whereas in the RW model, the statistically significant traits were: variety, storage time, and the y, x, and z dimensions. The situation was different in the REc model, where only two variables were statistically significant, namely the y and z dimensions.
Based on the results from Table 5, considering only statistically significant traits, multiple regression equations were constructed for each model, which took the form:
Rλ = 17.272 + 0.299 · Vr − 0.131 · y − 0.586 · z
RW = 508.691 + 13.223 · Vr − 1.809 · ST − 7.273 · y − 16.374 · x + 3.736 · z
REc = 0.810 − 0.01· y − 0.013· z

3.5. Artificial Neural Networks

For each output parameter (λ, W and Ec) a separate neural model was developed (NNλ, NNW, NNEc). In Table 6, the structure and quality metrics of the best neural models are presented. Model structure means the number of neurons in each layer of MLP: input—hidden—output. The number of nodes in the input layer equals the number of input parameters of model, which is six. The number of neurons in the hidden layer was selected by trial-and-error method. In the output layer there is one neuron calculating the value of the output value of neural model.
For deformation, the best architecture of the model is 48 neurons in the hidden layer. This model is of rather low accuracy with an R-value of 0.69 for the train data set and 0.68 for the validation data set. Better performance was obtained in the case of NNW model. The best architecture of ANN is network containing 10 neurons in the hidden layer with R value of 0.80 for train data set and 0.74 for the validation data set. For the NNEc the best model was achieved for architecture with 47 neurons in the hidden layer. The accuracy of this model can be stated as satisfactory with a relatively high R-value (0.89 for the train data set and 0.88 for the validation data set).

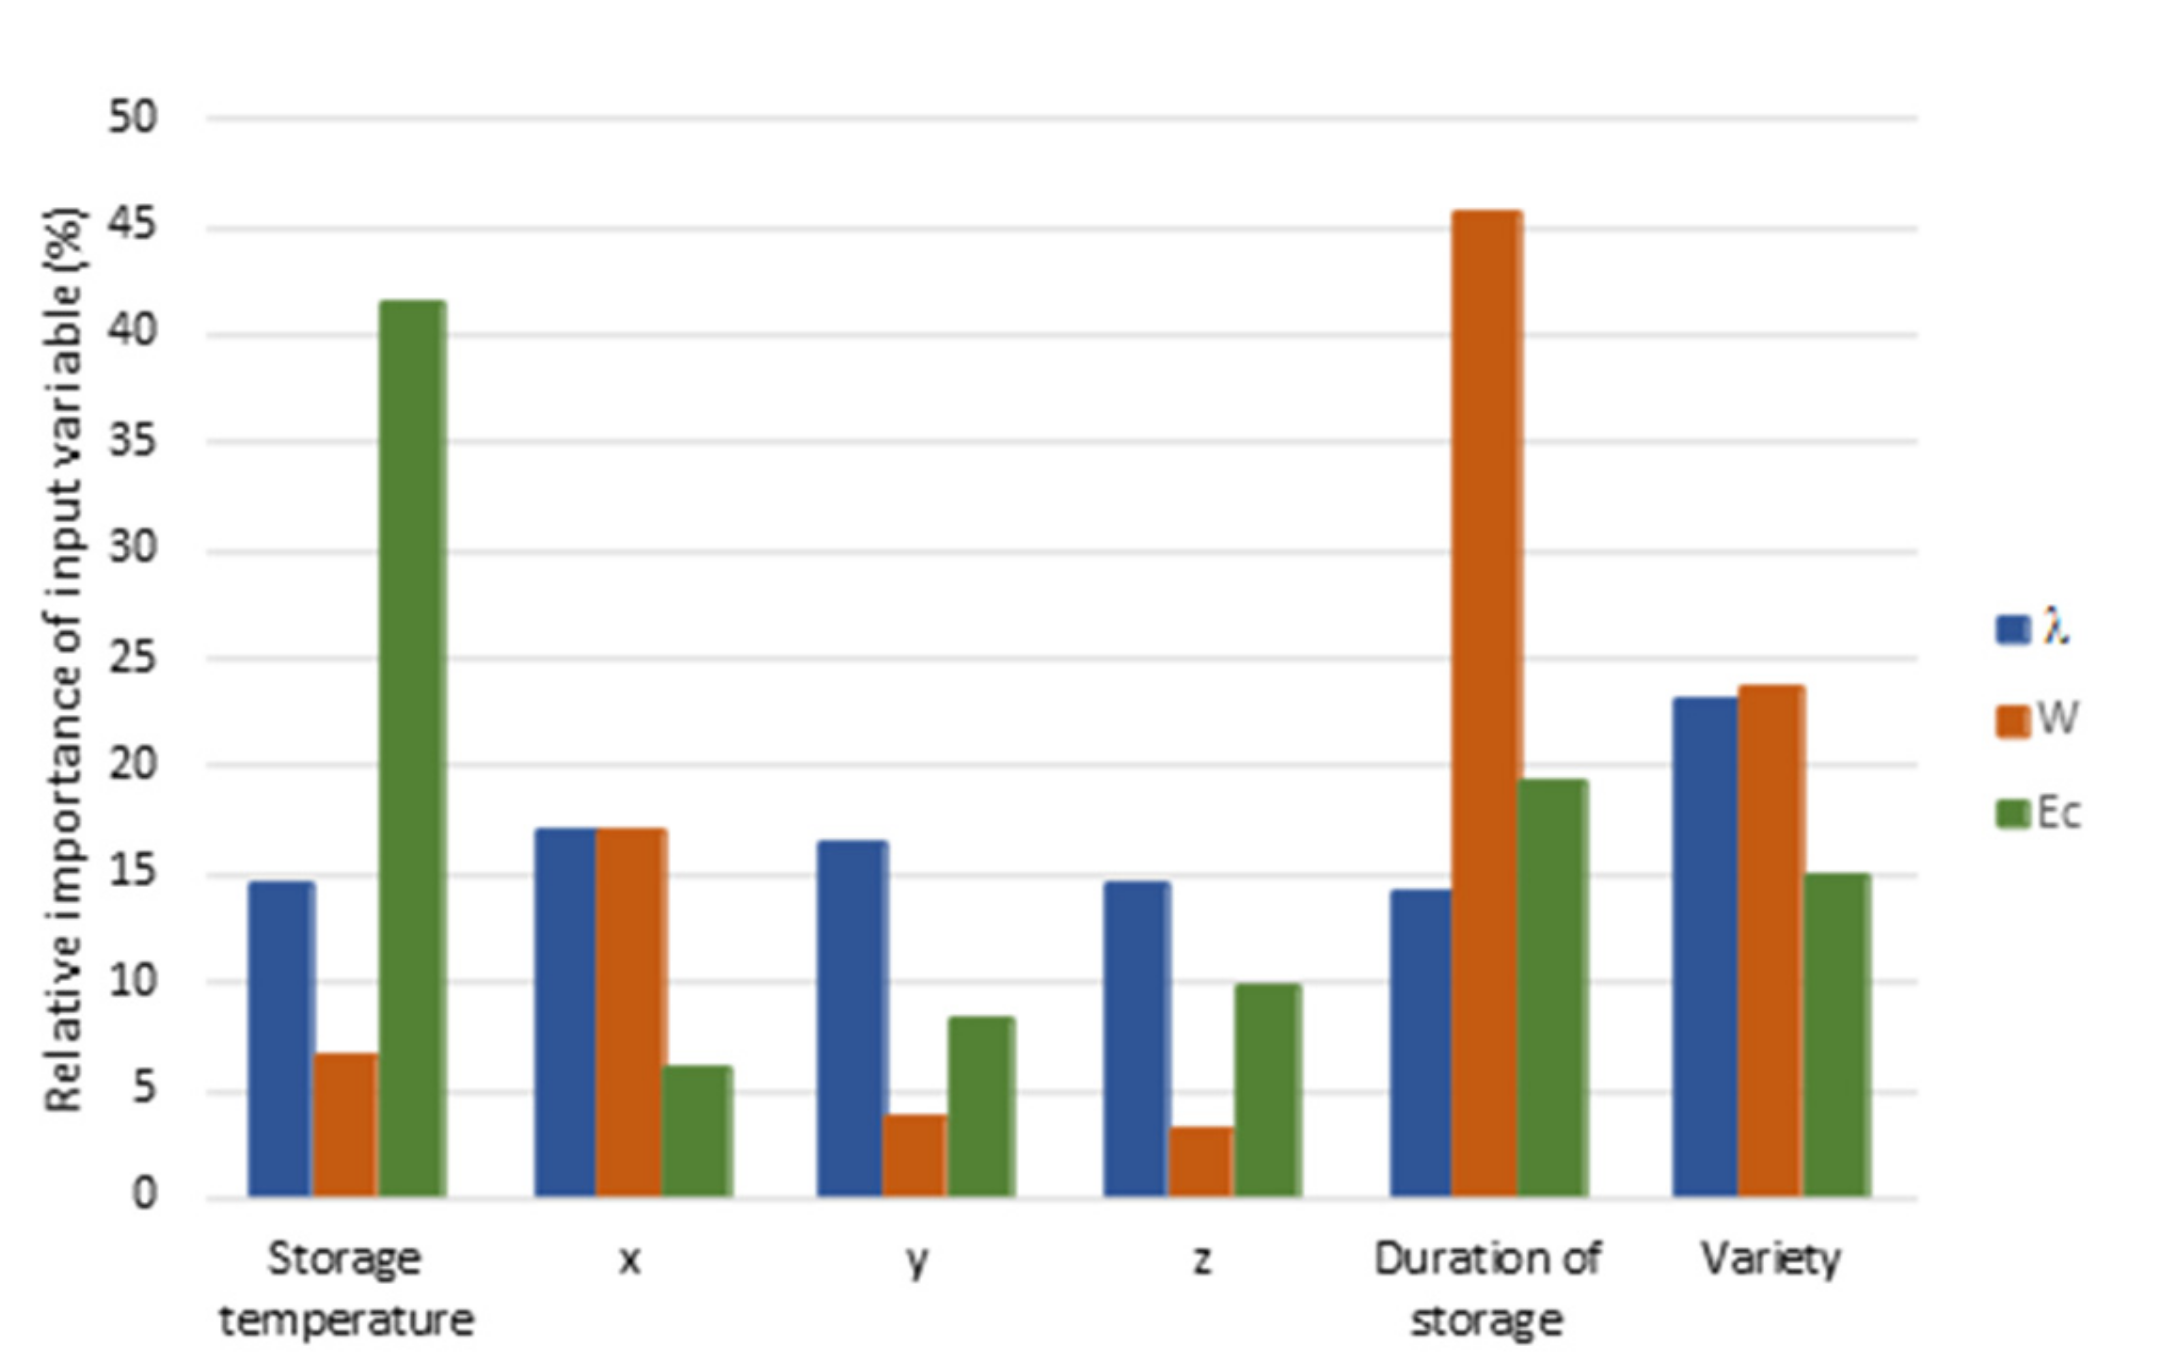
3.6. Sensitivity Analysis

The best MLP models described in Table 6 were used for sensitivity analysis. For better readability, the results are presented as a percentage influence of certain input variables on the output parameter.
As presented in Figure 1, in the case of deformation, a cranberry variety influences this parameter the most (23.04%). The geometrical dimensions, duration of storage, and storage temperature similarly affect deformation (from 14.21% to 16.97%). The parameter influencing breaking energy the most was duration of storage (45.64%). A significantly lower impact was observed for the variety and x dimensions. The influence of the y and z dimensions and storage temperature was minimal. The modulus of elasticity was affected the most by storage temperature (41.45%). Lower influence was noticed for the duration of storage (19.25%) and variety (14.96%). The impact of geometrical dimensions on Ec was very low.

3.7. Support Vector Machines

The three separate SVM models (SVMλ, SVMW and SVMEc) were developed with the same six input parameters (variety, storage temperature, duration of storage, and the x, y, and z dimensions) and different output parameters (deformation λ, breaking energy W, or modulus of elasticity Ec). Model parameters (C, ε and γ) were adjusted by trial-and-error approach. For all three models these parameters were as follows: C = 10, ε = 0.03, and γ = 0.24. Error metrics of models of the best accuracy are detailed in Table 7.
The best accuracy was obtained for the SVMW model (R = 0.76 for validation data set). A lower correlation between experimental results and model prediction was observed for the SVMλ model (0.71). The SVMEc model was low accuracy with R-value of 0.67.
In this research, the three methods of modelling were used to develop models of relationships between large cranberry variety, storage temperature, duration of storage, x, y, z dimensions of fruits, and mechanical parameters, namely deformation, breaking energy, and modulus of elasticity. The regression method produced models of very low accuracy (R = 0.578 for deformation, R = 0.579 for breaking energy, and R = 0.475 for modulus of elasticity). The better models were developed with the use of artificial intelligence techniques. The best model for deformation and breaking energy was produced with the use of the SVM method. The error metrics for the validation data set calculated for these models are significantly better than for regression models (R = 0.705, RMSE = 1.451, and R = 0.758, RMSE = 53.869, respectively). Neural networks produced slightly worse models for these mechanical parameters. In the case of the modulus of elasticity, the ANN model was found to be the most accurate model (R = 0.878, RMSE = 0.067 for validation data set). In Figure 2, Figure 3 and Figure 4, the performance of the best models of deformation λ, breaking energy W, and modulus of elasticity Ec for the validation data set is presented.

4. Discussion

Compared to fresh fruit, the most significant decrease in water content after 25 days of storage was observed in the Pilgrim variety. The fresh cranberries examined in a study by Oszmiański et al. (2017) [42] were found with varied water content, ranging from 87.21% in the Pilgrim variety and 87.52% in the Stevens variety to 89.94% in the Ben Lear variety. Similar water content in the fresh cranberries of the investigated varieties (87.0–87.5%) was reported by Oszmiański et al. (2018) [43]. Paniagua et al. [12] found a decrease in water content in blueberry fruit by 1.34% after three weeks of storage. Ruse et al. [13] reported a decrease in moisture content by 2% in cranberries stored in closed PP boxes in air ambiance for six months.
Compared to this study, a study by Teleszko [44] reported slightly higher acidity in the fresh cranberries of the Ben Lear variety amounting to 2.18 g⋅100 g−1, whereas Oszmiański et al. [42] found that total acidity in the fresh cranberries ranged from 1.95 g⋅100 g−1 in Pilgrim and 2.25 g⋅100 g−1 in the Stevens variety to 2.29 g⋅100 g−1 in the Ben Lear variety. In another study, Oszmiański et al. [43] reported slightly higher acidity in the investigated cranberry varieties, with values in the range of 2.1–2.4 g⋅100 g−1.
Modelling and the development of regression models are very common and important in many scientific fields. Model accuracy is crucial in real-life applications, and experimental data is used for model development. Therefore, besides traditional techniques, artificial intelligence algorithms are often used for modeling. In this research, ANN and SVM provided much better results for the estimation of the mechanical parameters of large cranberry when compared to the MLR technique. Similar results were reported in state of art literature, where these techniques were used to develop regression models for various relationships. Karsavran and Erdik [45] developed sea-level prediction models and revealed that the ANN and SVM models outperformed MLR. The best performance resulted from ANN model with a coefficient of correlation R = 0.76. The same techniques were used by Mohammed et al. [46] to estimate time and cost indexes to predict the site overhead cost. They reported that the ANN and SVM techniques produced more accurate models than the MLR technique. A slightly higher accuracy of the ANN model (R = 0.99) when compared to SVM (R = 0.97) was reported by Afradi and Ebrahimabadi [47] who used AI methods to predict the penetration rate of tunnel boring machine. Sabzi-Nojadeh et al. [48] compared the accuracy of ANN and MLR models used to predict the oil yield and trans-anethole yield of fennel populations; ANN performed better (R = 0.96 and R = 0.88) than MLR (R = 0.74 and R = 0.68).

5. Conclusions

Knowledge of the mechanical parameters of fruits is crucial to optimize the storage process. Especially in the case of delicate fruit such as large cranberry. Therefore, the mechanical parameters of cranberry fruits in relation to storage conditions were investigated, and mathematical models of relationships under study were developed. The results of this study revealed that the water content in the fresh fruit of the relevant large cranberry varieties ranged between 89.19 and 90.05%. After 25 days of storage, the lowest water content was found in the Pilgrim variety (87.66%), and the highest value of this parameter was identified in the Stevens variety (88.12%). The mean acidity of fresh fruit representing the selected cranberry varieties was in the range of 1.50–1.60 g⋅100 g−1. After 25 days of storage, the lowest acidity was found in the Stevens variety (1.30 g⋅100 g−1), and the highest value of this parameter was identified in the Pilgrim variety (1.50 g⋅100 g−1). It was observed that irrespective of the variety and storage conditions (4 °C, 10 °C, 20 °C), there was a relationship between the selected mechanical parameters of cranberry fruit and the duration of storage. The lowest values of the mechanical parameters were identified in fruit kept in storage for 25 days. The ANN and SVM prediction models of relationships under study outperformed MLR models. The accuracy of the ANN and SVM models was comparable. In the case of deformation and breaking energy, the best performance was observed for the SVM model (R = 0.705 and R = 0.758, respectively). ANN produced the best model for modulus of elasticity (R = 0.878).

Author Contributions

Conceptualization, K.P. and J.G.; data curation, J.G., J.B. and P.K.; formal analysis, K.P., G.N. and J.G.; investigation, K.P., J.G., J.B., P.K. and G.N.; methodology, K.P., J.G. and G.N.; writing—original draft, K.P., J.G. and G.N.; writing—review and editing, J.G. and G.N.; visualization, K.P. All authors have read and agreed to the published version of the manuscript.

Funding

Wrocław University of Environmental and Life Sciences.

Institutional Review Board Statement

Not applicable.

Informed Consent Statement

Not applicable.

Data Availability Statement

Data are available by contacting the authors.

Conflicts of Interest

The authors declare no conflict of interest.

References

  1. Krzewińska, D.; Smolarz, K. Wpływ nawożenia azotem na wzrost i plonowanie żurawiny wielkoowocowej (Vaccinium macrocarpon AIT). Zesz. Nauk. Inst. Sadow. Kwiaciarstwa 2008, 16, 135–144. [Google Scholar]
  2. FAOSTAT. Available online: https://www.fao.org/faostat/en/#data/QV (accessed on 1 December 2021).
  3. Crescent Bloom. Hierarchical Position of the Genus Oxycoccus. In The Compleat Botanica; Crescent Bloom: Sebastopol, CA, USA, 2009. [Google Scholar]
  4. Allison, D.G.; Cronin, M.A.; Hawker, J.; Freeman, S. Influence of cranberry juice on attachment of Escherichia coli to glass. J. Basic Microb. 2000, 40, 3–6. [Google Scholar] [CrossRef]
  5. Howell, A.B.; Vorsa, N.; Marderosian, A.D.; Foo, L.Y. Inhibition of the adherence of P-fimbriated Escherichia coli to uroepithelial-cell surfaces by proanthocyanidin extracts from cranberries. New Engl. J. Med. 1998, 339, 1085–1086. [Google Scholar] [CrossRef]
  6. Oszmianski, J.; Kolniak-Ostek, J.; Lachowicz, S.; Gorzelany, J.; Matlok, N. Effect of dried powder preparation process on polyphenolic content and antioxidant capacity of cranberry (Vaccinium macrocarpon L.). Ind. Crop. Prod. 2015, 77, 658–665. [Google Scholar] [CrossRef]
  7. Bonarska-Kujawa, D.; Cyboran, S.; Kleszczyńska, H.; Oszmiański, J. Aktywność przeciwutleniająca ekstraktów polifenolowych z owoców czerwonej porzeczki i żurawiny w odniesieniu do błony erytrocytów. Żywność Nauka Technol. Jakość 2015, 3, 148–159. [Google Scholar]
  8. Averill, A.; Caruso, F.; DeMoranville, C.; Jeranyama, P.; LaFleur, J.; McKenzie, K.; Rinta, L.; Sandler, H.; Wick, B. Cranberry Production Guide; Paper 8; University of Massachusetts: Amherst, MA, USA, 2008. [Google Scholar]
  9. Girard, K.K.; Sinha, N.K. Cranberry, blueberry, currant, and gooseberry. In Handbook of Fruits and Fruit Processing; John Wiley & Sons: Hoboken, NJ, USA, 2006; pp. 399–417. [Google Scholar]
  10. Sandler, H.A.; DeMoranville, C.J. Cranberry Production: A Guide for Massachusetts; CP-08; University of Massachusetts: Amherst, MA, USA, 2008. [Google Scholar]
  11. Rabcewicz, J. Perspectives of mechanical harvesting of stone and berry fruit. Informator Sadowniczy, 5 May 2013. (In Polish) [Google Scholar]
  12. Paniagua, A.C.; East, A.R.; Hindmarsh, J.P.; Heyes, J.A. Moisture loss is the major cause of firmness change during postharvest storage of blueberry. Postharvest Biol. Technol. 2013, 79, 13–19. [Google Scholar] [CrossRef]
  13. Ruse, K.; Rakcejeva, T.; Dukalska, L. Changes in Physically-Chemical Parameters of Latvian Cranberries During Storage. Proc. Latv. Univ. Agric. 2013, 30, 11–19. [Google Scholar] [CrossRef]
  14. Gorzelany, J.; Kotlicka, M.; Migut, D.; Witek, G.; Matłok, N.; Lachowicz, S. Ocena właściwości chemicznych i mechanicznych świeżych owoców wybranych odmian żurawiny wielkoowocowej. In Rolnictwo XXI Wieku—Problemy i Wyzwania; Idea Knowledge Future: Wroclaw, Poland, 2018; pp. 111–122. [Google Scholar]
  15. Bohdziewicz, J.; Czachor, G. The impact of load on deformation progress for ball-shaped vegetables. Agric. Eng. 2010, 1, 85–91. [Google Scholar]
  16. Bohdziewicz, J.; Czachor, G. The Rheological Properties of Redcurrant and Highbush Blueberry Berries. Agric. Eng. 2016, 2, 15–22. [Google Scholar] [CrossRef]
  17. Migut, D.; Gorzelany, J.; Matłok, N.; Kotlicka, M.; Kuźniar, P. Ocena wybranych właściwości mechanicznych owoców żurawiny wielkoowocowej. In Rolnictwo XXI Wieku—Problemy i Wyzwania; Idea Knowledge Future: Wroclaw, Poland, 2016; pp. 200–211. [Google Scholar]
  18. Piekutowska, M.; Niedbala, G.; Piskier, T.; Lenartowicz, T.; Pilarski, K.; Wojciechowski, T.; Pilarska, A.A.; Czechowska-Kosacka, A. The Application of Multiple Linear Regression and Artificial Neural Network Models for Yield Prediction of Very Early Potato Cultivars before Harvest. Agronomy 2021, 11, 885. [Google Scholar] [CrossRef]
  19. Hara, P.; Piekutowska, M.; Niedbala, G. Selection of Independent Variables for Crop Yield Prediction Using Artificial Neural Network Models with Remote Sensing Data. Land 2021, 10, 609. [Google Scholar] [CrossRef]
  20. Niedbala, G.; Piekutowska, M.; Weres, J.; Korzeniewicz, R.; Witaszek, K.; Adamski, M.; Pilarski, K.; Czechowska-Kosacka, A.; Krysztofiak-Kaniewska, A. Application of Artificial Neural Networks for Yield Modeling of Winter Rapeseed Based on Combined Quantitative and Qualitative Data. Agronomy 2019, 9, 781. [Google Scholar] [CrossRef] [Green Version]
  21. Wojciechowski, T.; Niedbała, G.; Czechlowski, M.; Nawrocka, J.R.; Piechnik, L.; Niemann, J. Rapeseed seeds quality classification with usage of VIS-NIR fiber optic probe and artificial neural networks. In Proceedings of the 2016 International Conference on Optoelectronics and Image Processing (ICOIP), Warsaw, Poland, 10–12 June 2016; pp. 44–48. [Google Scholar] [CrossRef]
  22. Kujawa, S.; Dach, J.; Kozłowski, R.J.; Przybył, K.; Niedbała, G.; Mueller, W.; Tomczak, R.J.; Zaborowicz, M.; Koszela, K. Maturity classification for sewage sludge composted with rapeseed straw using neural image analysis. In Proceedings of the Eighth International Conference on Digital Image Processing (ICDIP 2016), Chengu, China, 20–22 May 2016. [Google Scholar] [CrossRef]
  23. Moradi, M.; Balanian, H.; Taherian, A.; Khaneghah, A.M. Physical and mechanical properties of three varieties of cucumber: A mathematical modeling. J. Food Process Eng. 2020, 43, e13323. [Google Scholar] [CrossRef]
  24. Szwedziak, K.; Polanczyk, E.; Grzywacz, Z.; Niedbala, G.; Wojtkiewicz, W. Neural Modeling of the Distribution of Protein, Water and Gluten in Wheat Grains during Storage. Sustainability 2020, 12, 5050. [Google Scholar] [CrossRef]
  25. Xia, A.L.; Zhang, Y.; Zhao, L.Z.; Qin, P. Simultaneous, Rapid and Nondestructive Determination of Moisture, Fat Content and Storage Time in Leisure Dried Tofu Using LF-NMR. Anal. Sci. 2021, 37, 301–307. [Google Scholar] [CrossRef] [PubMed]
  26. Chen, L.; Ding, J.F. Analysis on Food Crispness Based on Time and Frequency Domain Features of Acoustic Signal. Trait. Signal 2021, 38, 231–238. [Google Scholar] [CrossRef]
  27. Gonzalez-Viveros, N.; Gomez-Gil, P.; Castro-Ramos, J.; Cerecedo-Nunez, H.H. On the estimation of sugars concentrations using Raman spectroscopy and artificial neural networks. Food Chem. 2021, 352, 129375. [Google Scholar] [CrossRef]
  28. Chauchard, F.; Cogdill, R.; Roussel, S.; Roger, J.M.; Bellon-Maurel, V. Application of LS-SVM to non-linear phenomena in NIR spectroscopy: Development of a robust and portable sensor for acidity prediction in grapes. Chemom. Intell Lab. 2004, 71, 141–150. [Google Scholar] [CrossRef] [Green Version]
  29. Dai, Q.; Cheng, J.H.; Sun, D.W.; Zeng, X.A. Potential of hyperspectral imaging for non-invasive determination of mechanical properties of prawn (Metapenaeus ensis). J. Food Eng. 2014, 136, 64–72. [Google Scholar] [CrossRef]
  30. Guo, W.C.; Shang, L.; Zhu, X.H.; Nelson, S.O. Nondestructive Detection of Soluble Solids Content of Apples from Dielectric Spectra with ANN and Chemometric Methods. Food Bioprocess Technol. 2015, 8, 1126–1138. [Google Scholar] [CrossRef]
  31. Meteomodel. Available online: https://meteomodel.pl/dane/srednie-miesieczne/?imgwid=350210585&par=tm&max_empty=2 (accessed on 5 December 2021).
  32. PN-90/A-75101-03; Fruit and Vegetable Products—Preparation of Samples and Testing Methods—Determination of Dry Matter Content By Gravimetric Method. Polish Committee for Standardization: Warsaw, Poland, 1990. Available online: http://www.ydylstandards.org.cn/static/down/pdf/PN%20A75101-03-1990_3750.pdf (accessed on 22 January 2022).
  33. PN-90/A-75101-04; Fruit and Vegetable Products—Preparation of Samples and Testing Methods—Determination of Total Acidity. Polish Committee for Standardization: Warsaw, Poland, 1990. Available online: http://www.ydylstandards.org.cn/static/down/pdf/PN%20A75101-04-1990_5000.pdf (accessed on 22 January 2022).
  34. Hadzima-Nyarko, M.; Nyarko, E.K.; Moric, D. A neural network based modelling and sensitivity analysis of damage ratio coefficient. Expert Syst. Appl. 2011, 38, 13405–13413. [Google Scholar] [CrossRef]
  35. Vapnik, V. Nature of Statistical Learning Theory; Springer: New York, NY, USA, 1995. [Google Scholar]
  36. Yu, P.S.; Chen, S.T.; Chang, I.F. Support vector regression for real-time flood stage forecasting. J. Hydrol. 2006, 328, 704–716. [Google Scholar] [CrossRef]
  37. Noori, R.; Yeh, H.D.; Abbasi, M.; Kachoosangi, F.T.; Moazami, S. Uncertainty analysis of support vector machine for online prediction of five-day biochemical oxygen demand. J. Hydrol. 2015, 527, 833–843. [Google Scholar] [CrossRef]
  38. Dibike, Y.B.; Velickov, S.; Solomatine, D.; Abbott, M.B. Model induction with support vector machines: Introduction and applications. J. Comput. Civil Eng. 2001, 15, 208–216. [Google Scholar] [CrossRef]
  39. Han, D.; Chan, L.; Zhu, N. Flood forecasting using support vector machines. J. Hydroinform. 2007, 9, 267–276. [Google Scholar] [CrossRef]
  40. Zeng, J.Y.; Tan, Z.H.; Matsunaga, T.; Shirai, T. Generalization of Parameter Selection of SVM and LS-SVM for Regression. Mach. Learn. Knowl. Extr. 2019, 1, 43. [Google Scholar] [CrossRef] [Green Version]
  41. Akbarzadeh, A.; Naseh, M.R.V.; NodeFarahani, M. Carbon Monoxide Prediction in the Atmosphere of Tehran Using Developed Support Vector Machine. Pollution 2020, 6, 43–57. [Google Scholar] [CrossRef]
  42. Oszmianski, J.; Kolniak-Ostek, J.; Lachowicz, S.; Gorzelany, J.; Matlok, N. Phytochemical Compounds and Antioxidant Activity in Different Cultivars of Cranberry (Vaccinium Macrocarpon L). J. Food Sci. 2017, 82, 2569–2575. [Google Scholar] [CrossRef]
  43. Oszmianski, J.; Lachowicz, S.; Gorzelany, J.; Matlok, N. The effect of different maturity stages on phytochemical composition and antioxidant capacity of cranberry cultivars. Eur. Food Res. Technol. 2018, 244, 705–719. [Google Scholar] [CrossRef] [Green Version]
  44. Teleszko, M. Żurawina wielkoowocowa- możliwości wykorzystania do produkcji biożywności. Żywność Nauka Technol. Jakość 2011, 6, 132–144. [Google Scholar]
  45. Karsavran, Y.; Erdik, T. Artificial Intelligence Based Prediction of Seawater Level: A Case Study for Bosphorus Strait. Int. J. Math. Eng. Manag. Sci. 2021, 6, 1242–1254. [Google Scholar] [CrossRef]
  46. Mohammed, S.J.; Abdel-Khalek, H.A.; Hafez, S.M. Predicting Performance Measurement of Residential Buildings Using Machine Intelligence Techniques (MLR, ANN and SVM). Iran. J. Sci. Technol.-Trans. Civ. Eng 2021. [Google Scholar] [CrossRef]
  47. Afradi, A.; Ebrahimabadi, A. Comparison of artificial neural networks (ANN), support vector machine (SVM) and gene expression programming (GEP) approaches for predicting TBM penetration rate. SN Appl. Sci. 2020, 2, 2004. [Google Scholar] [CrossRef]
  48. Sabzi-Nojadeh, M.; Niedbała, G.; Younessi-Hamzekhanlu, M.; Aharizad, S.; Esmaeilpour, M.; Abdipour, M.; Kujawa, S.; Niazian, M. Modeling the Essential Oil and Trans-Anethole Yield of Fennel (Foeniculum vulgare Mill. var. vulgare) by Application Artificial Neural Network and Multiple Linear Regression Methods. Agriculture 2021, 11, 1191. [Google Scholar] [CrossRef]
Figure 1. The relative importance of input variables of MLP model on deformation λ, breaking energy W, and modulus of elasticity Ec.
Agriculture 12 00200 g001
Figure 2. Predicted values versus measured values of deformation for validation data set (SVMλ model).
Agriculture 12 00200 g002
Figure 3. Predicted values versus measured values of breaking energy for validation data set (SVMW model).
Agriculture 12 00200 g003
Figure 4. Predicted values versus measured values of modulus of elasticity for validation data set (NNEc model).
Agriculture 12 00200 g004
Table 1. Weather conditions during cranberries vegetation in the year 2018.
Weather ParametersMonthsPeriod
IIIIVVVIVIIVIIIIXXIII-X
Air temperature (°C)0.614.517.519.320.620.816.210.815.0
Rainfalls (mm)32.416.541.340.2134.974.436.139.5415.3
Air relative humidity (%)73.460.663.066.673.574.475.378.070.6
Table 2. The mean water content [%] in fruit of the selected cranberry varieties, relative to duration of storage.
Cranberry VarietyDuration of Storage
0 Days14 Days25 Days
Ben Lear89.19 ± 0.7688.51 ± 0.8288.06 ± 0.66
Pilgrim90.05 ± 0.9088.92 ± 0.7987.66 ± 0.77
Stevens89.88 ± 0.6789.54 ± 0.7088.12 ± 0.65
Mean 89.71 ± 0.7888.99 ± 0.7787.95 ± 0.69
Statistical data are expressed as means ± SD.
Table 3. The mean total acidity (g⋅100 g−1) of fruit of the selected cranberry varieties, relative to duration of storage.
Cranberry VarietyDuration of Storage
0 Days14 Days25 Days
Ben Lear1.60 ± 0.131.57 ± 0.111.47 ± 0.12
Pilgrim1.57 ± 0.091.44 ± 0.111.50 ± 0.10
Stevens1.50 ± 0.141.42 ± 0.101.30 ± 0.08
Mean 1.56 ± 0.121.48 ± 0.111.42 ± 0.10
Statistical data are expressed as means ± SD.
Table 4. Mean values of the selected mechanical parameters of selected cranberry varieties in a process of uniaxial compression, relative to duration of storage.
VarietyDuration of Storageλ (mm)W (mJ)Ec (MPa)
Ben Lear0 days8.51 c ± 2.48249.02 c ± 92.870.45 b ± 0.11
Ben Lear14 days6.67 b ± 1.12154.28 b ± 49.480.29 a ± 0.07
Ben Lear25 days4.55 a ± 1.24103.15 a ± 36.940.25 a ± 0.06
Mean6.58 ± 1.61168.82 ± 59.760.33 a ± 0.08
Pilgrim0 days6.49 b ± 0.85199.50 b ± 37.980.37 b ± 0.05
Pilgrim14 days4.21 a ± 1.02102.94 a ± 42.770.32 a ± 0.05
Pilgrim25 days3.78 a ± 1.7584.06 a ± 33.320.30 a ± 0.11
Mean4.83 ± 1.21128.83 ± 38.020.33 ± 0.07
Stevens0 days8.50 b ± 1.07243.69 b ± 40.030.46 c ± 0.06
Stevens14 days7.50 b ± 0.90234.51 b ± 32.170.36 b ± 0.04
Stevens25 days4.26 a ± 1.6397.66 a ± 59.500.25 a ± 0.08
Mean6.75 ± 1.2191.95 ± 43.90.36 ± 0.06
0 days7.83 c ± 1.47230.74 c ± 56.960.43 c ± 0.07
All groups14 days6.13 b ± 1.01163.91 b ± 41.470.32 b ± 0.05
25 days4.20 a ± 1.5494.96 a ± 43.250.27 a ± 0.08
Mean6.05 ± 1.34163.20 ± 47.270.34 ± 0.07
Statistical data are expressed as means ± SD. Means in a column followed by different letters show significant differences (α = 0.05) according to the LSD test.
Table 5. Regression coefficients, standard errors, and probability levels for the developed regression models.
FactorRλ: R = 0.578
RMSE = 2.934
Free Term = 17.272
RW: R = 0.579
RMSE = 56.027
Free Term = 508.691
REc: R = 0.475
RMSE = 0.138
Free Term = 0.810
bStandard
Error b
pSignificancebStandard
Error b
pSignificancebStandard
Error b
pSignificance
Variety (Vr)0.2990.1390.033+13.2234.8570.007+0.0070.0120.551-
storage temperature (ST)0.0130.0210.522-−0.130.7210.857-−0.0010.0020.627-
duration of storage (DS)0.0020.0230.932-−1.8090.8050.026+0.0010.0020.681-
y dimension−0.1310.0440.003+−7.2731.5310+−0.010.0040.009+
x dimension−0.5860.0720+−16.3742.5140+00.0060.97-
z dimension0.0410.0380.278-3.7361.3250.005+−0.0130.0030+
Determination of the level of statistical significance: - non-significant. + significant for α = 0.05.
Table 6. Structures and error metrics of best neural models.
ModelModel StructureTrainValidation
RMSERRMSER
NNλ6-48-11.3920.6851.1760.677
NNW6-10-141.0480.80553.2810.752
NNEc6-47-10.0650.8900.0670.878
Table 7. Error metrics of best SVM models.
ModelTrainValidation
RMSERRMSER
SVMλ1.5810.5951.4510.705
SVMW51.9050.62653.8690.758
SVMEc0.1130.7020.1220.665
Publisher’s Note: MDPI stays neutral with regard to jurisdictional claims in published maps and institutional affiliations.

