
Non-Destructive Quality Evaluation of Tropical Fruit (Mango and Mangosteen) Purée Using Near-Infrared Spectroscopy Combined with Partial Least Squares Regression
 , , and
Abstract
:1. Introduction
2. Materials and Methods
2.1. Sample Collection
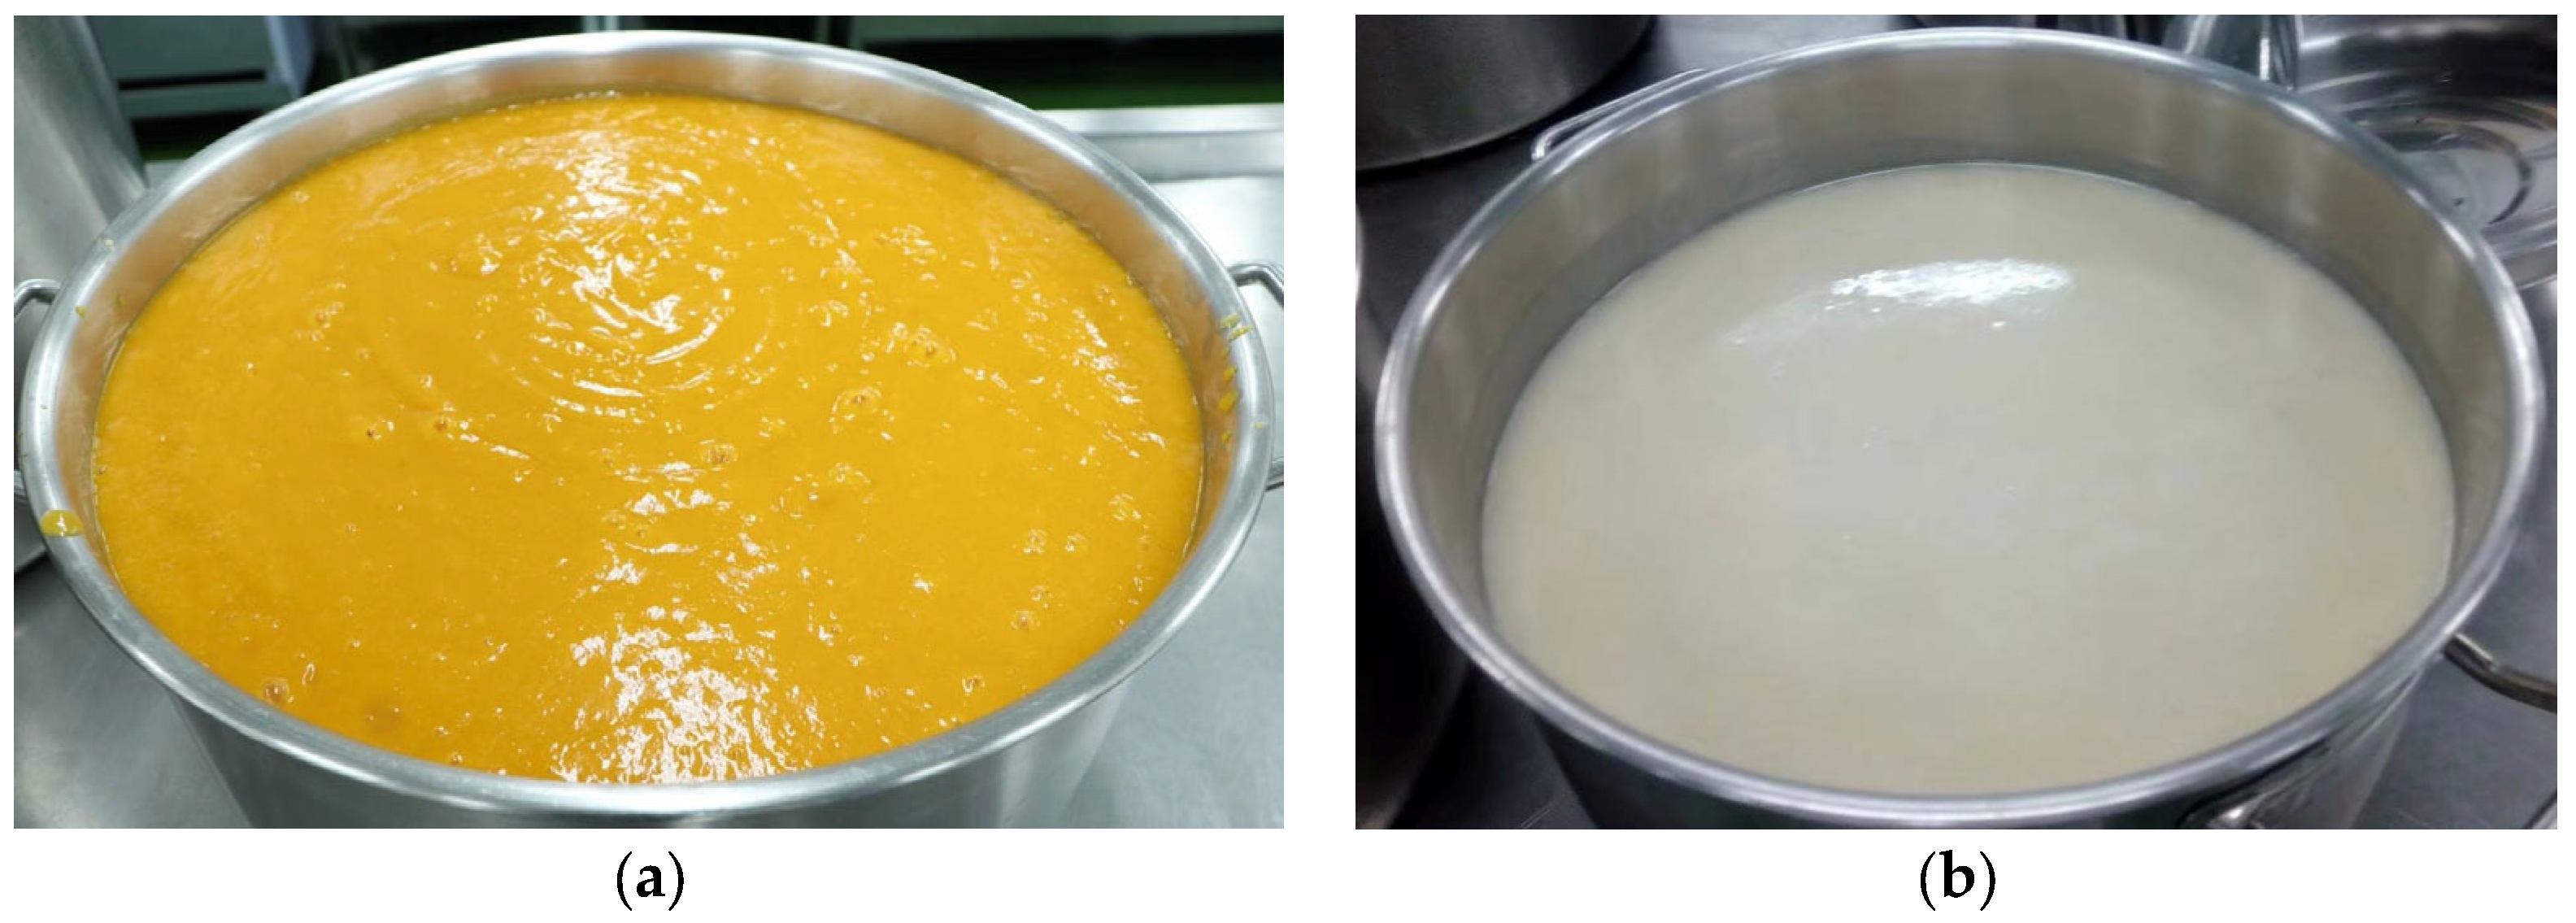
2.2. Purée Production
2.3. Spectra Acquisition
2.4. Total Soluble Solid and Titratable Acidity Measurement
2.5. Repeatability, Reproducibility, and Maximum Coefficient of Determination ()
2.6. Data Analysis and Modeling
3. Results and Discussion
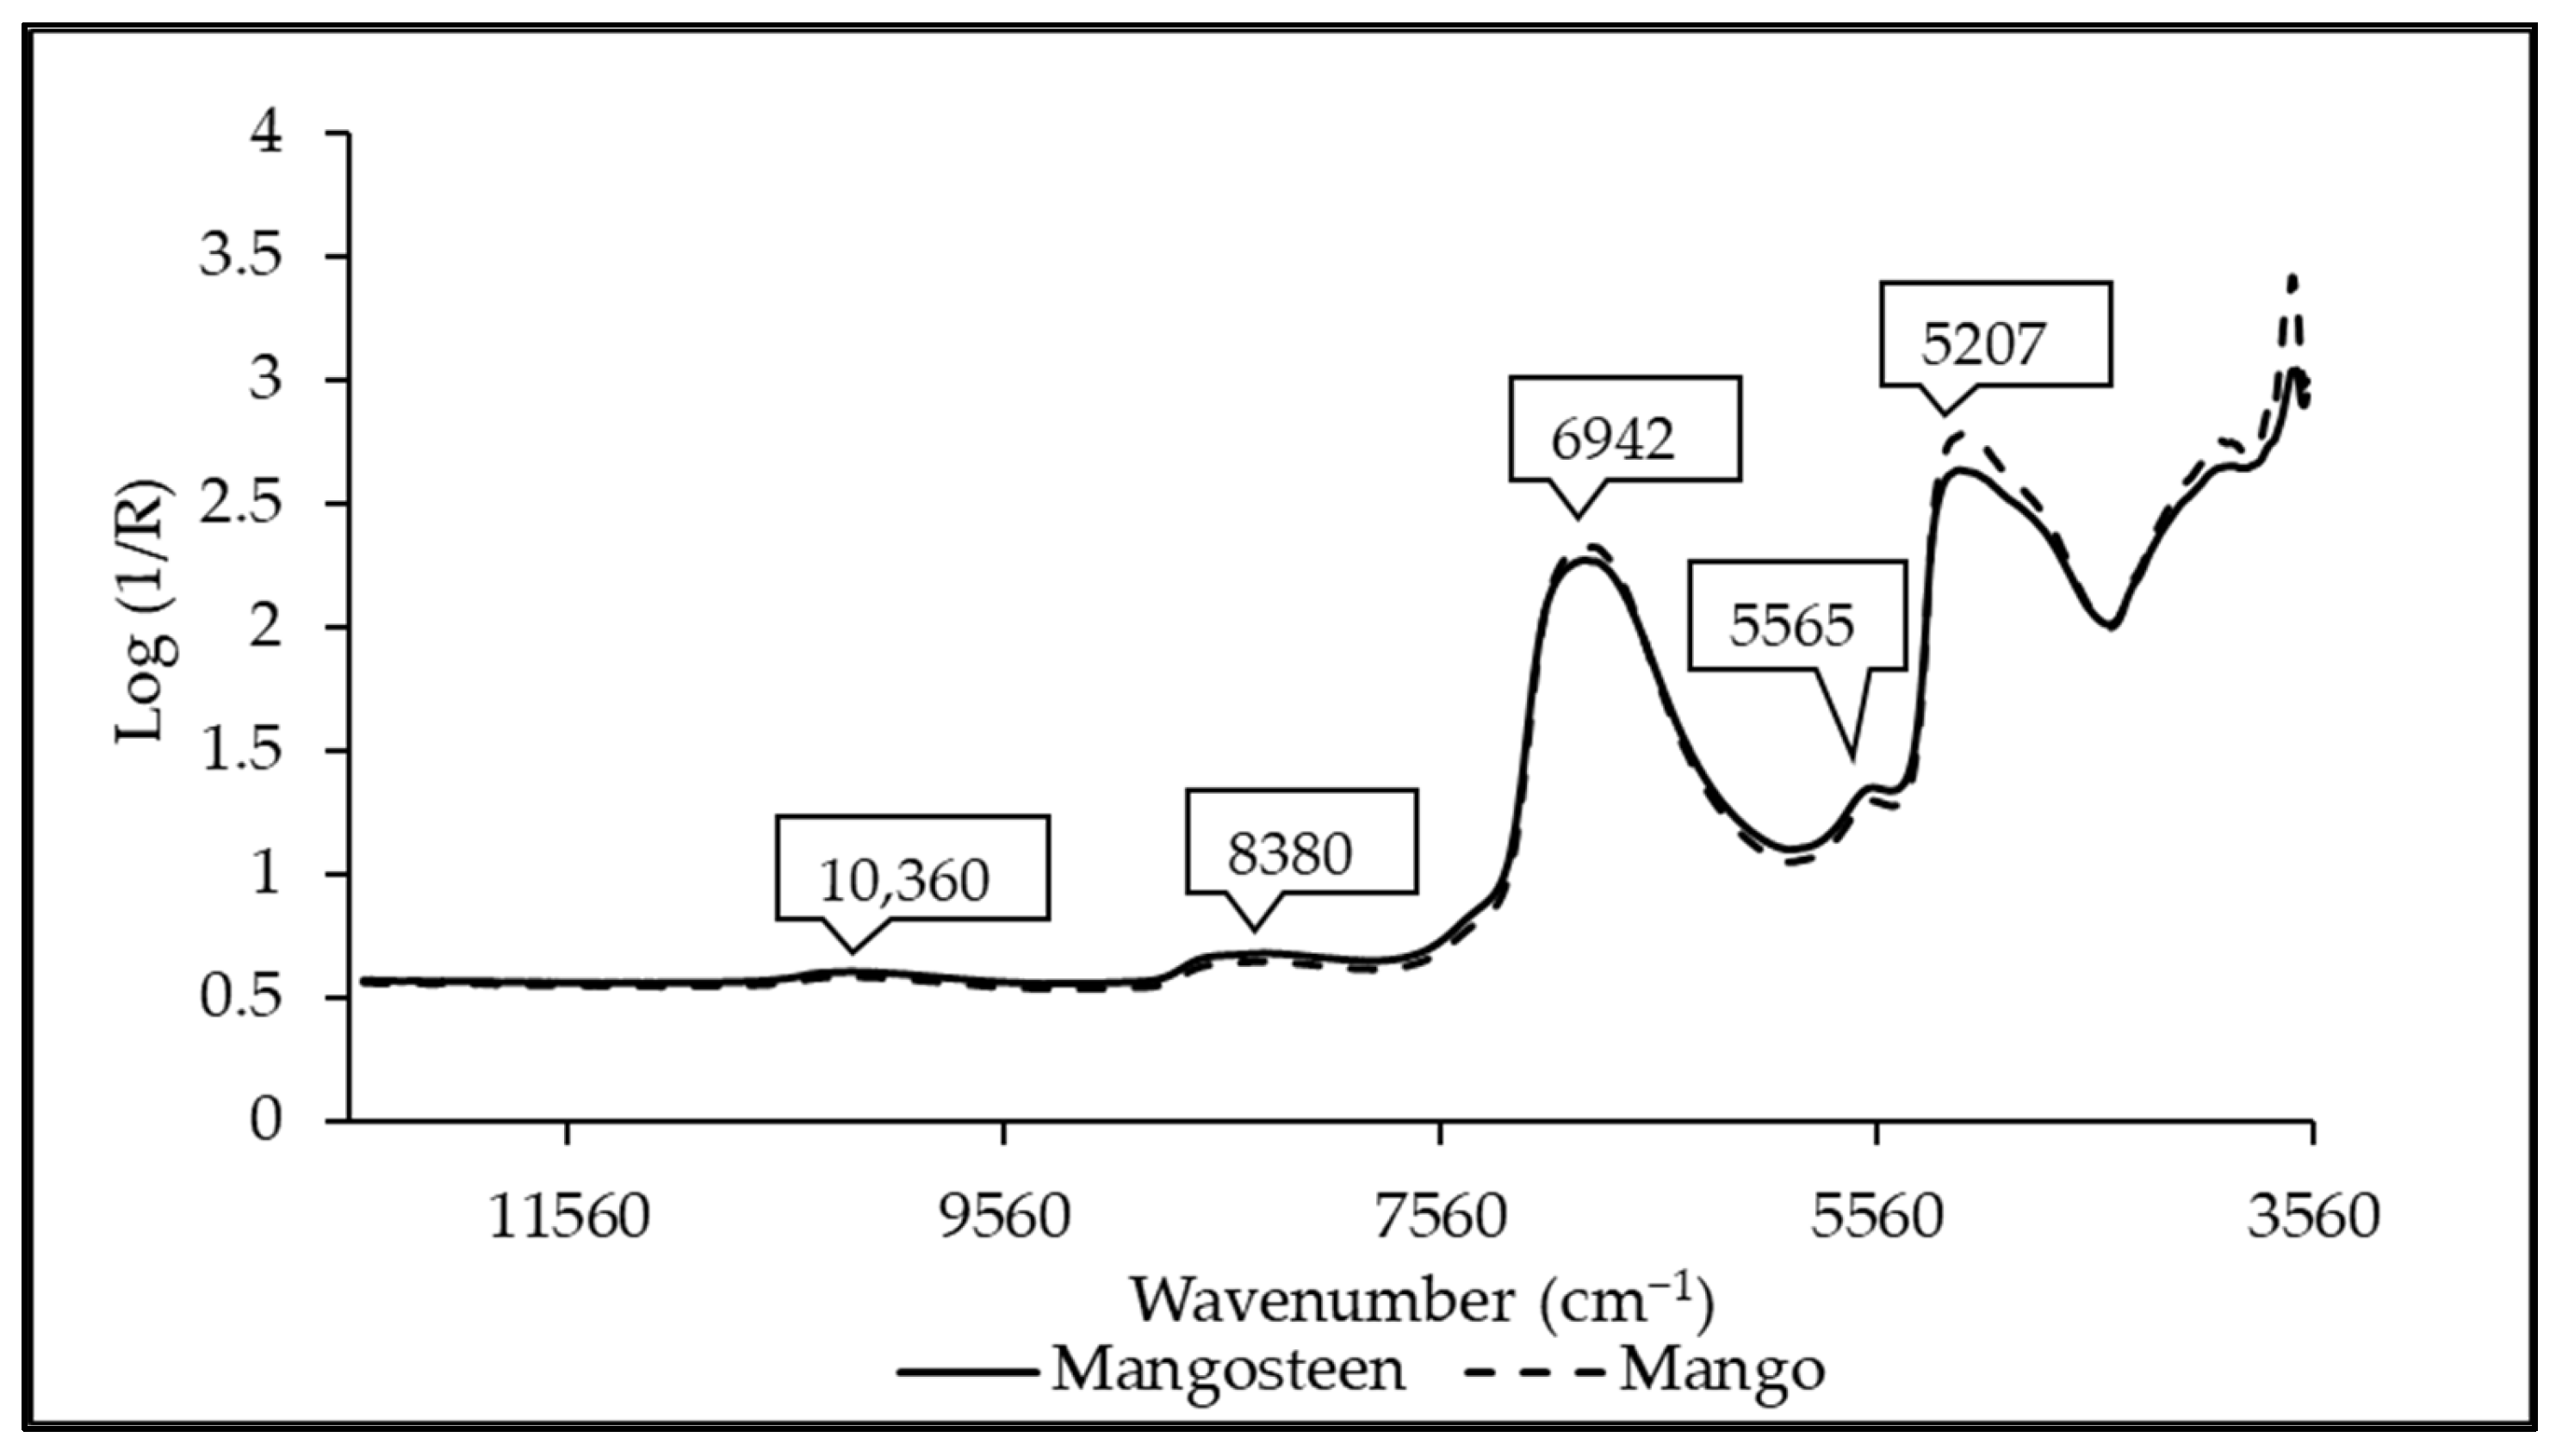
3.1. Spectral Characteristics
3.2. Overall Precision Test
3.3. Statistical Analysis
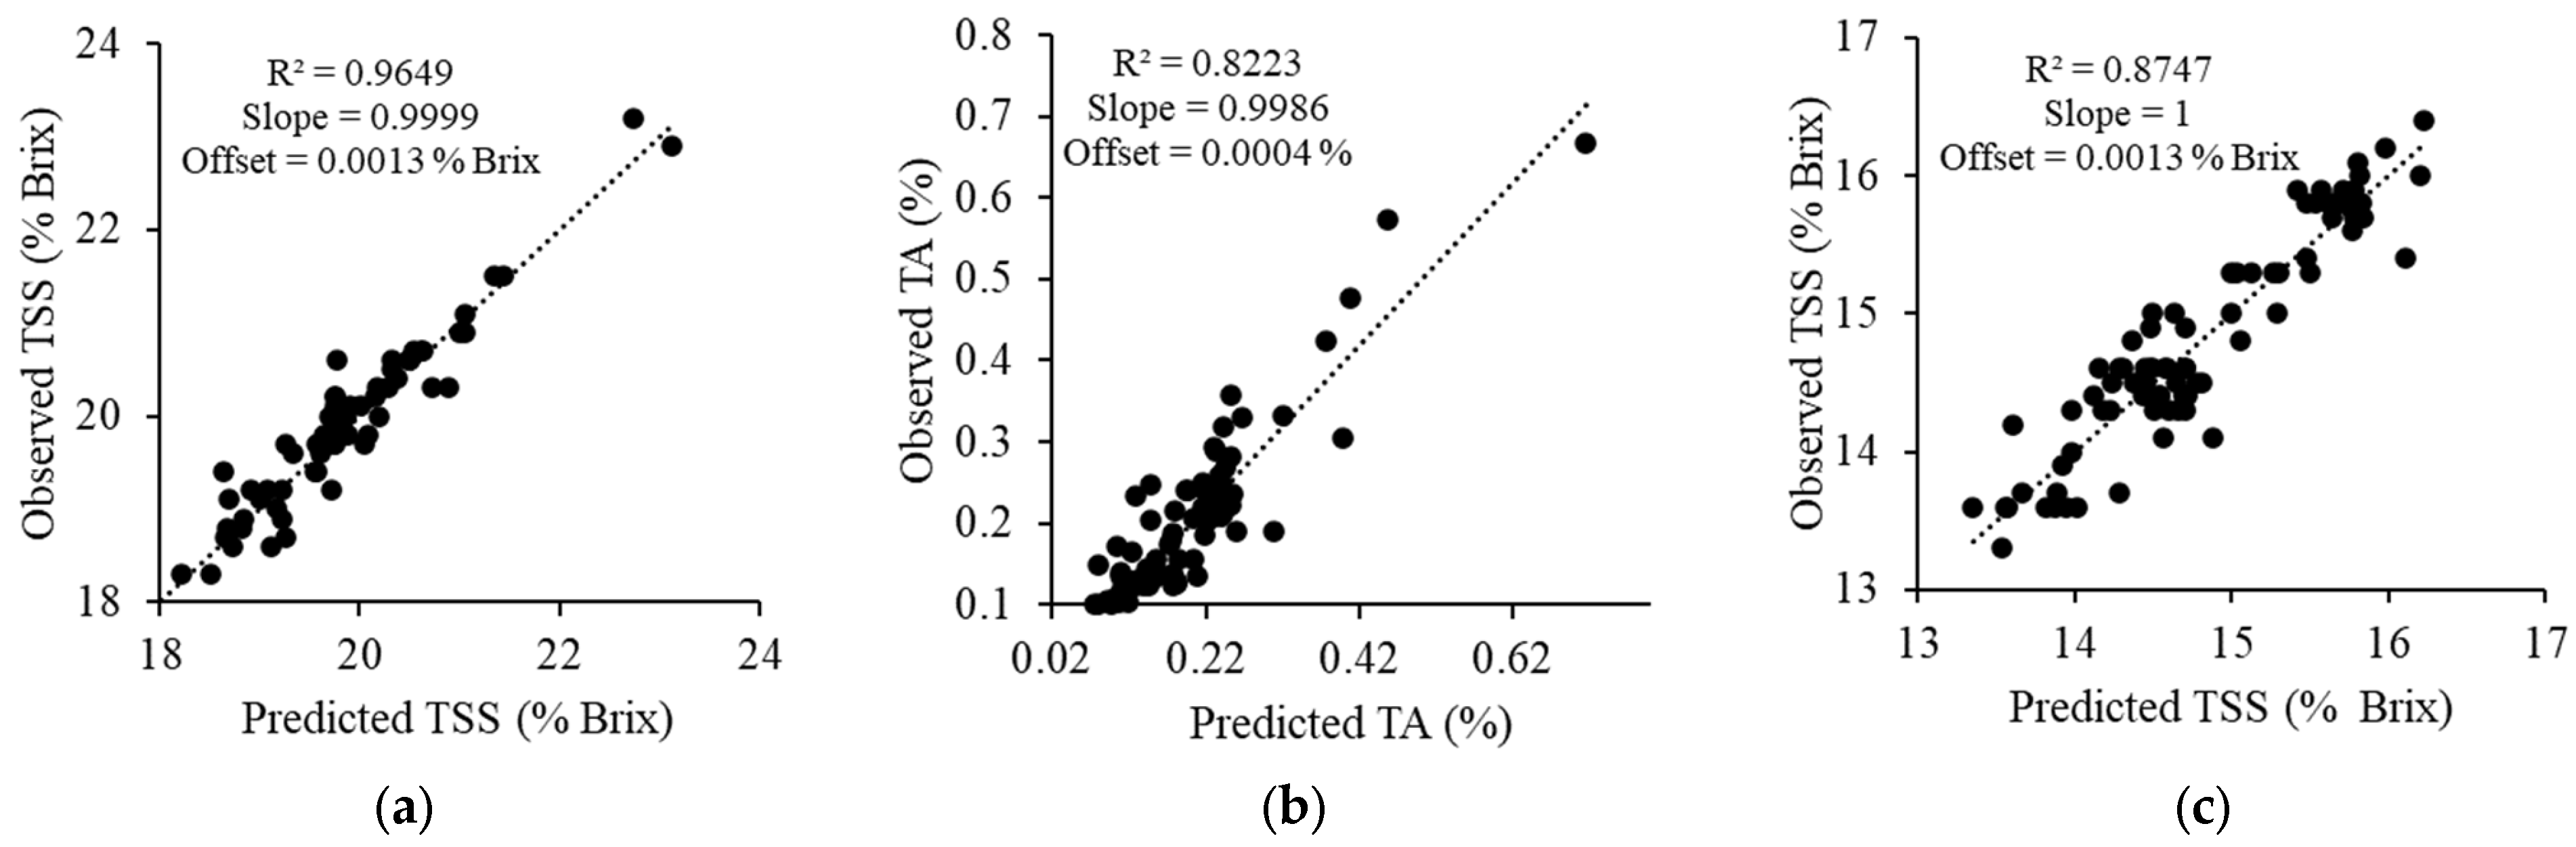
3.4. Performance of PLSR Model
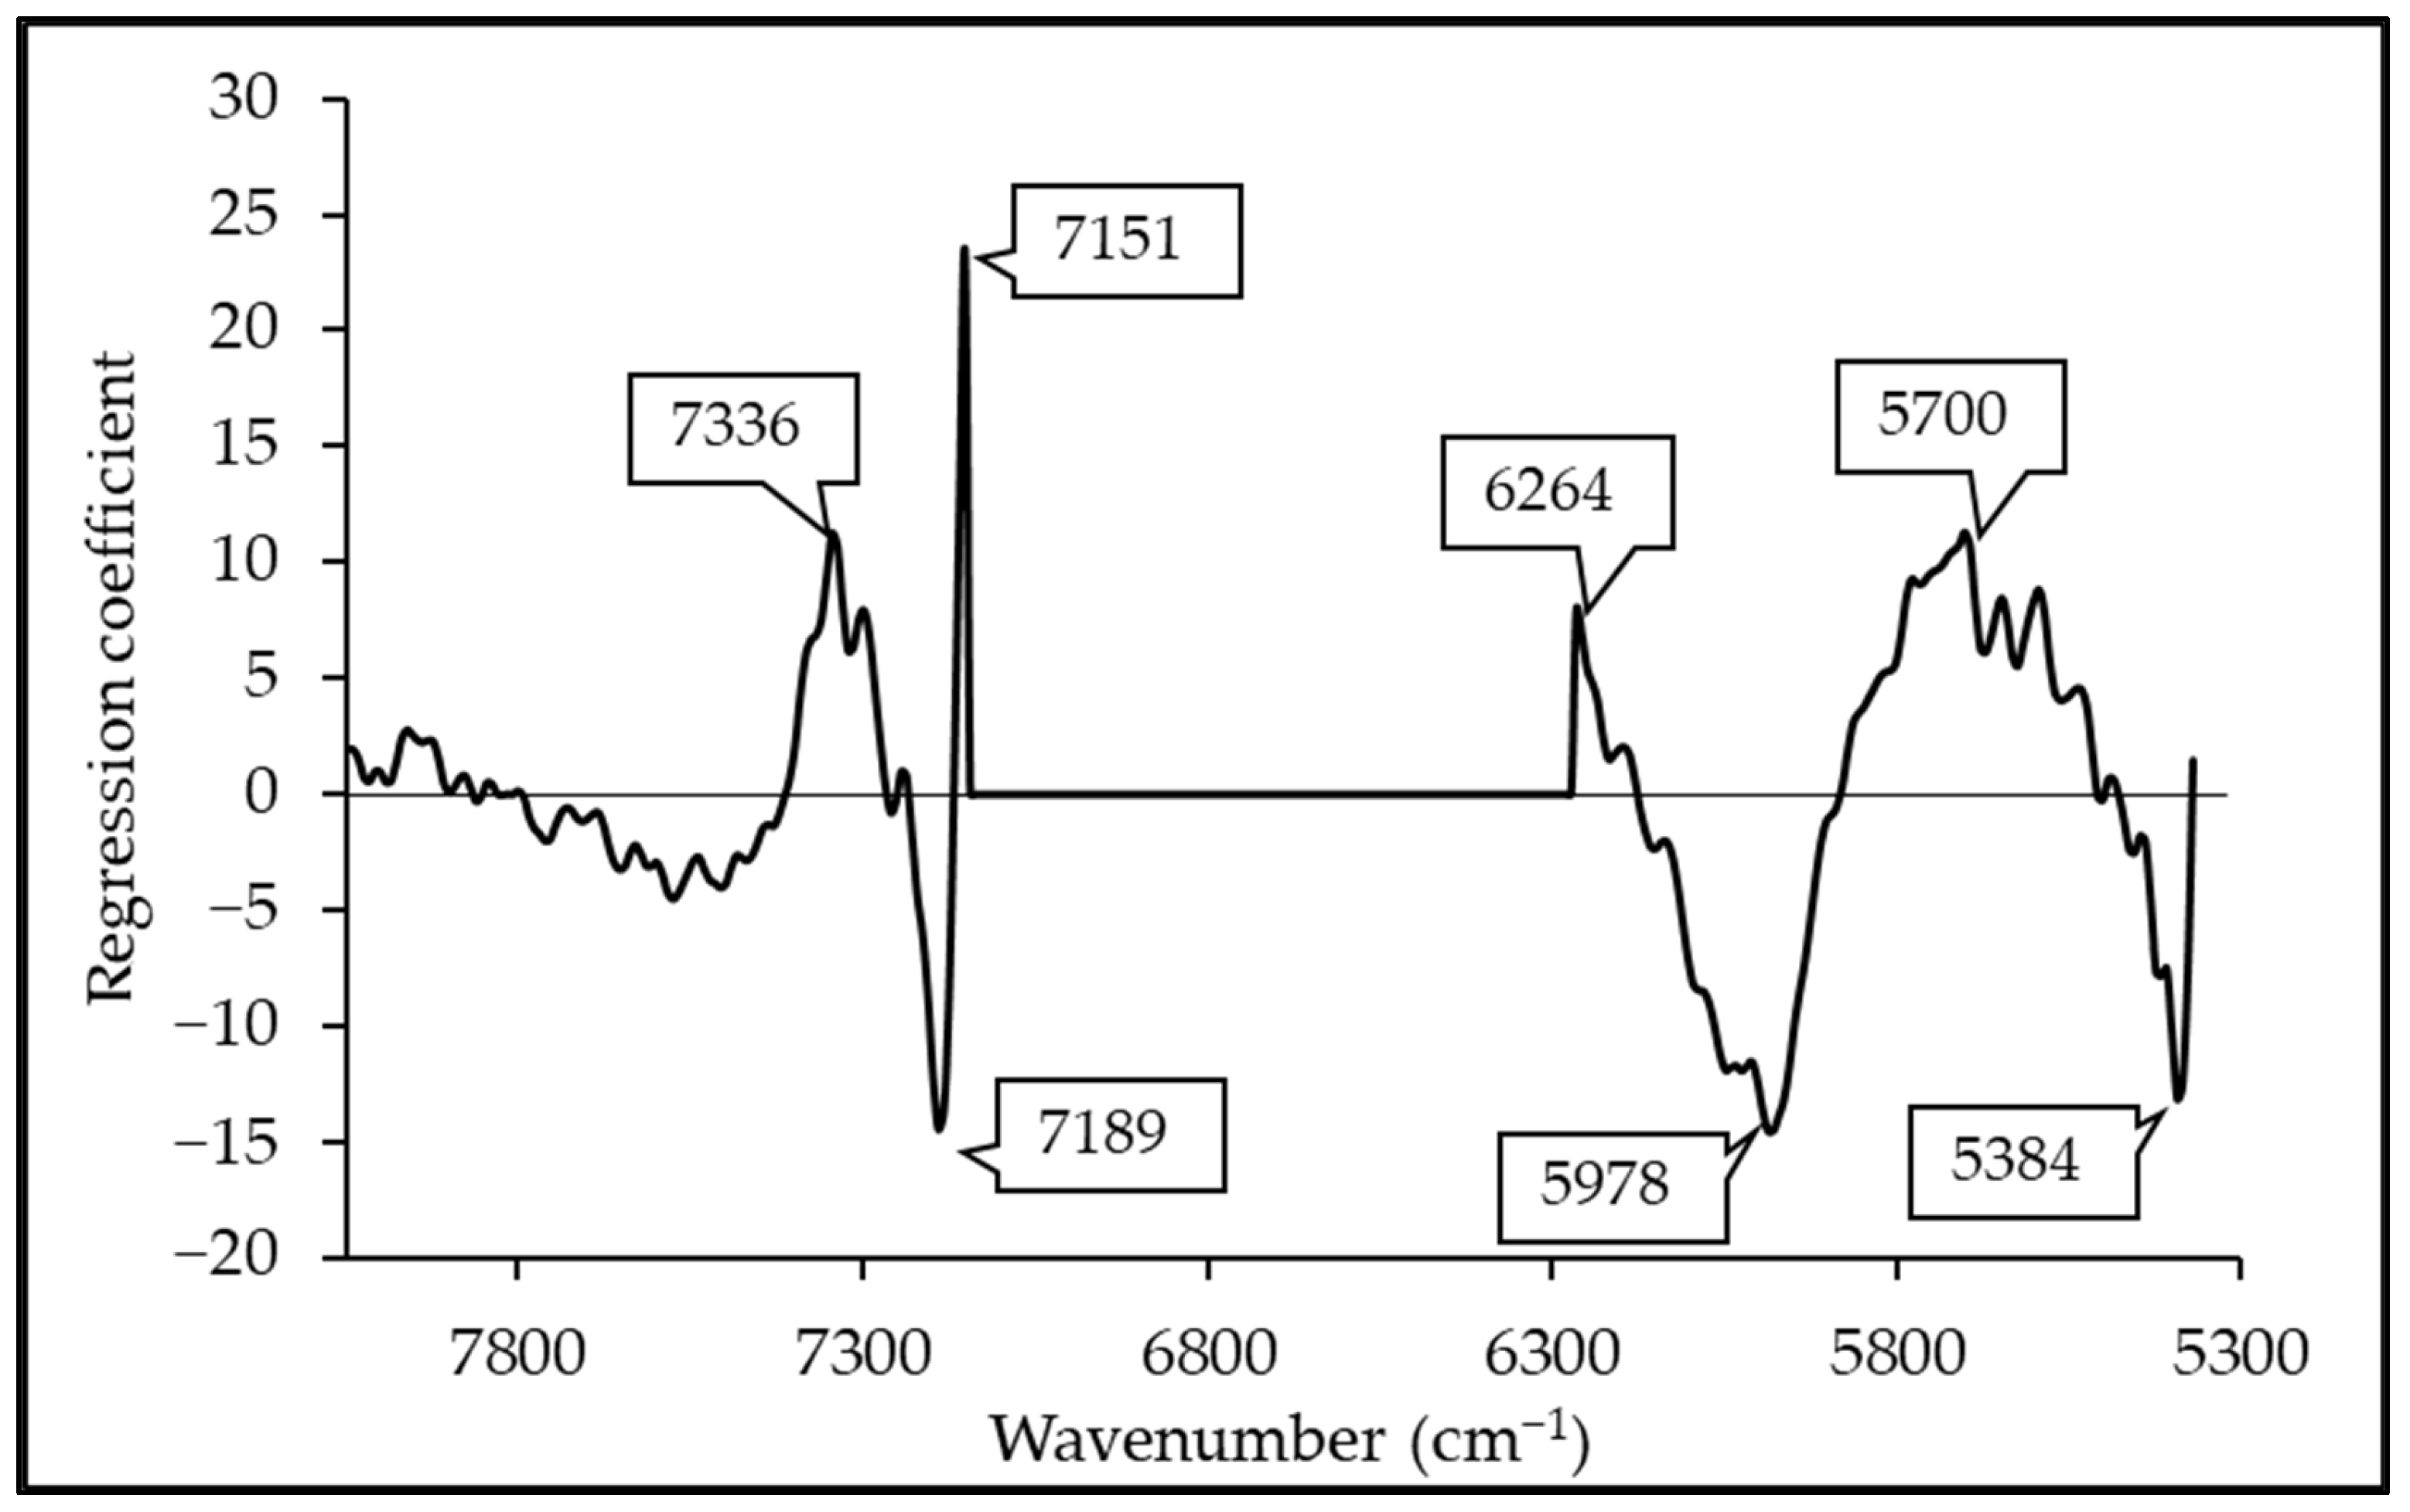
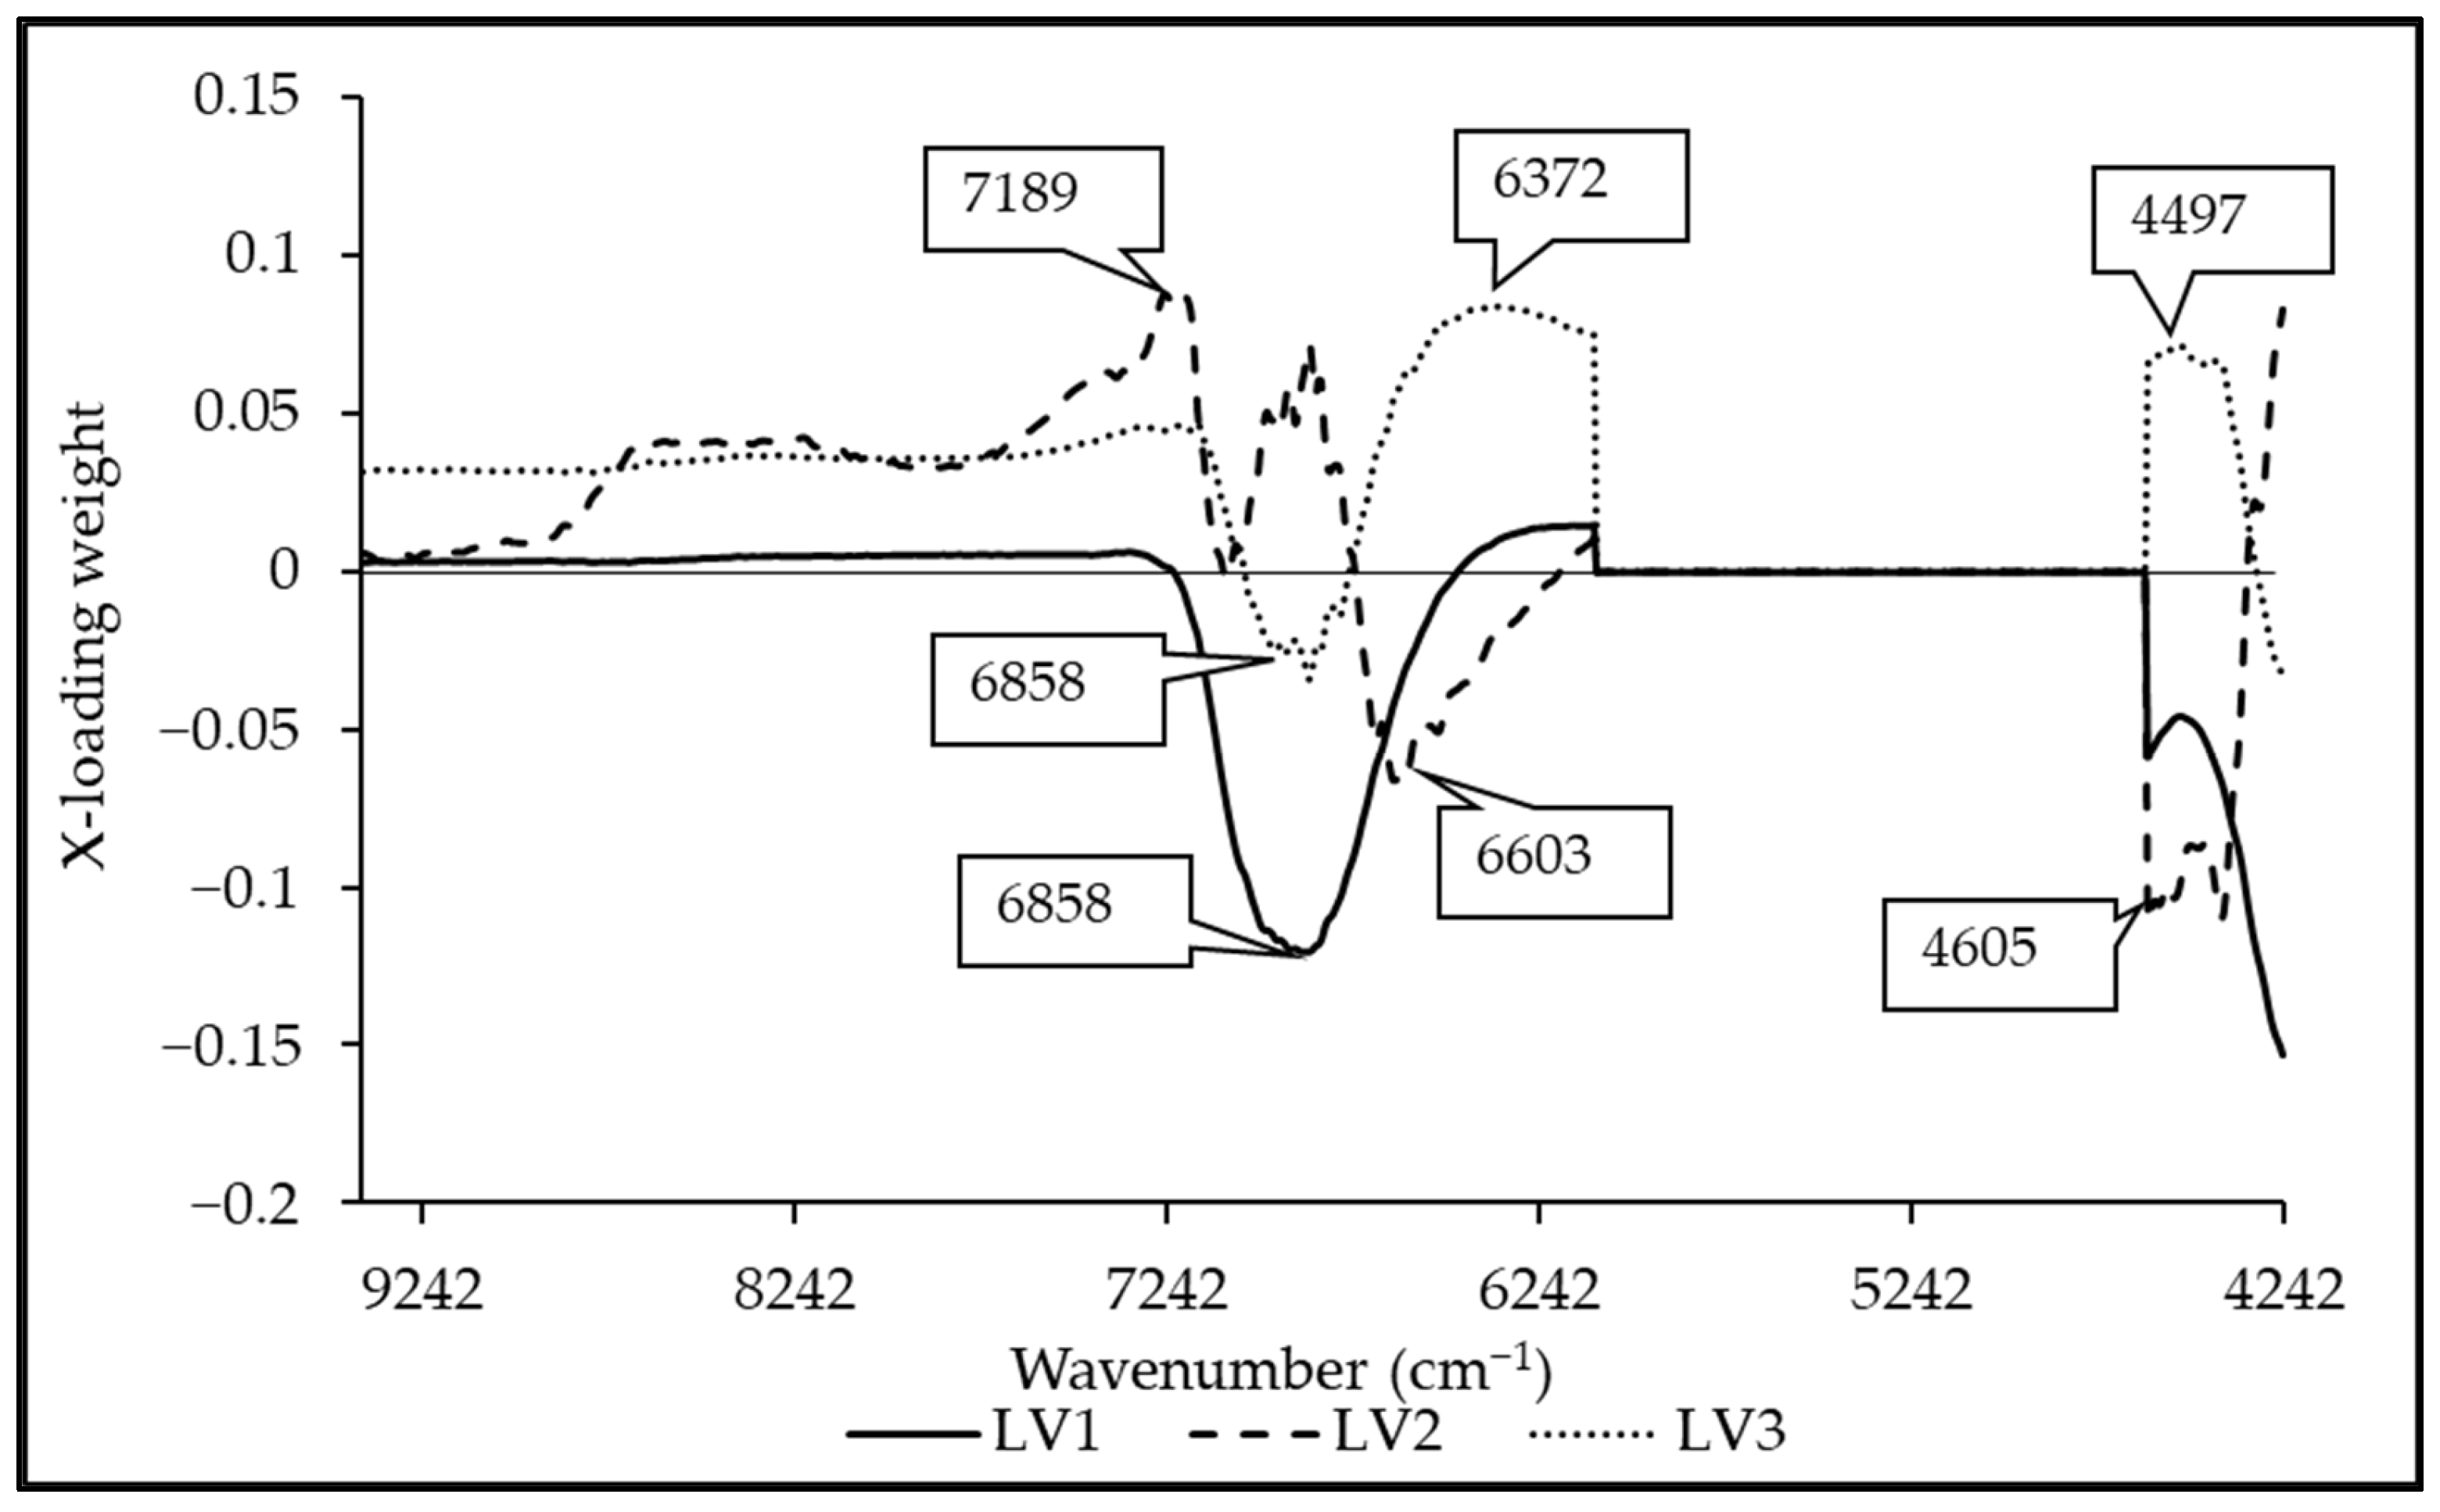
3.5. Regression Coefficient and X-Loading

| Wavenumber (cm−1) | Wavelength (nm) | Referred Wavelength (nm) | Bond Vibration/Functional Group (Structure) | Ref. |
|---|---|---|---|---|
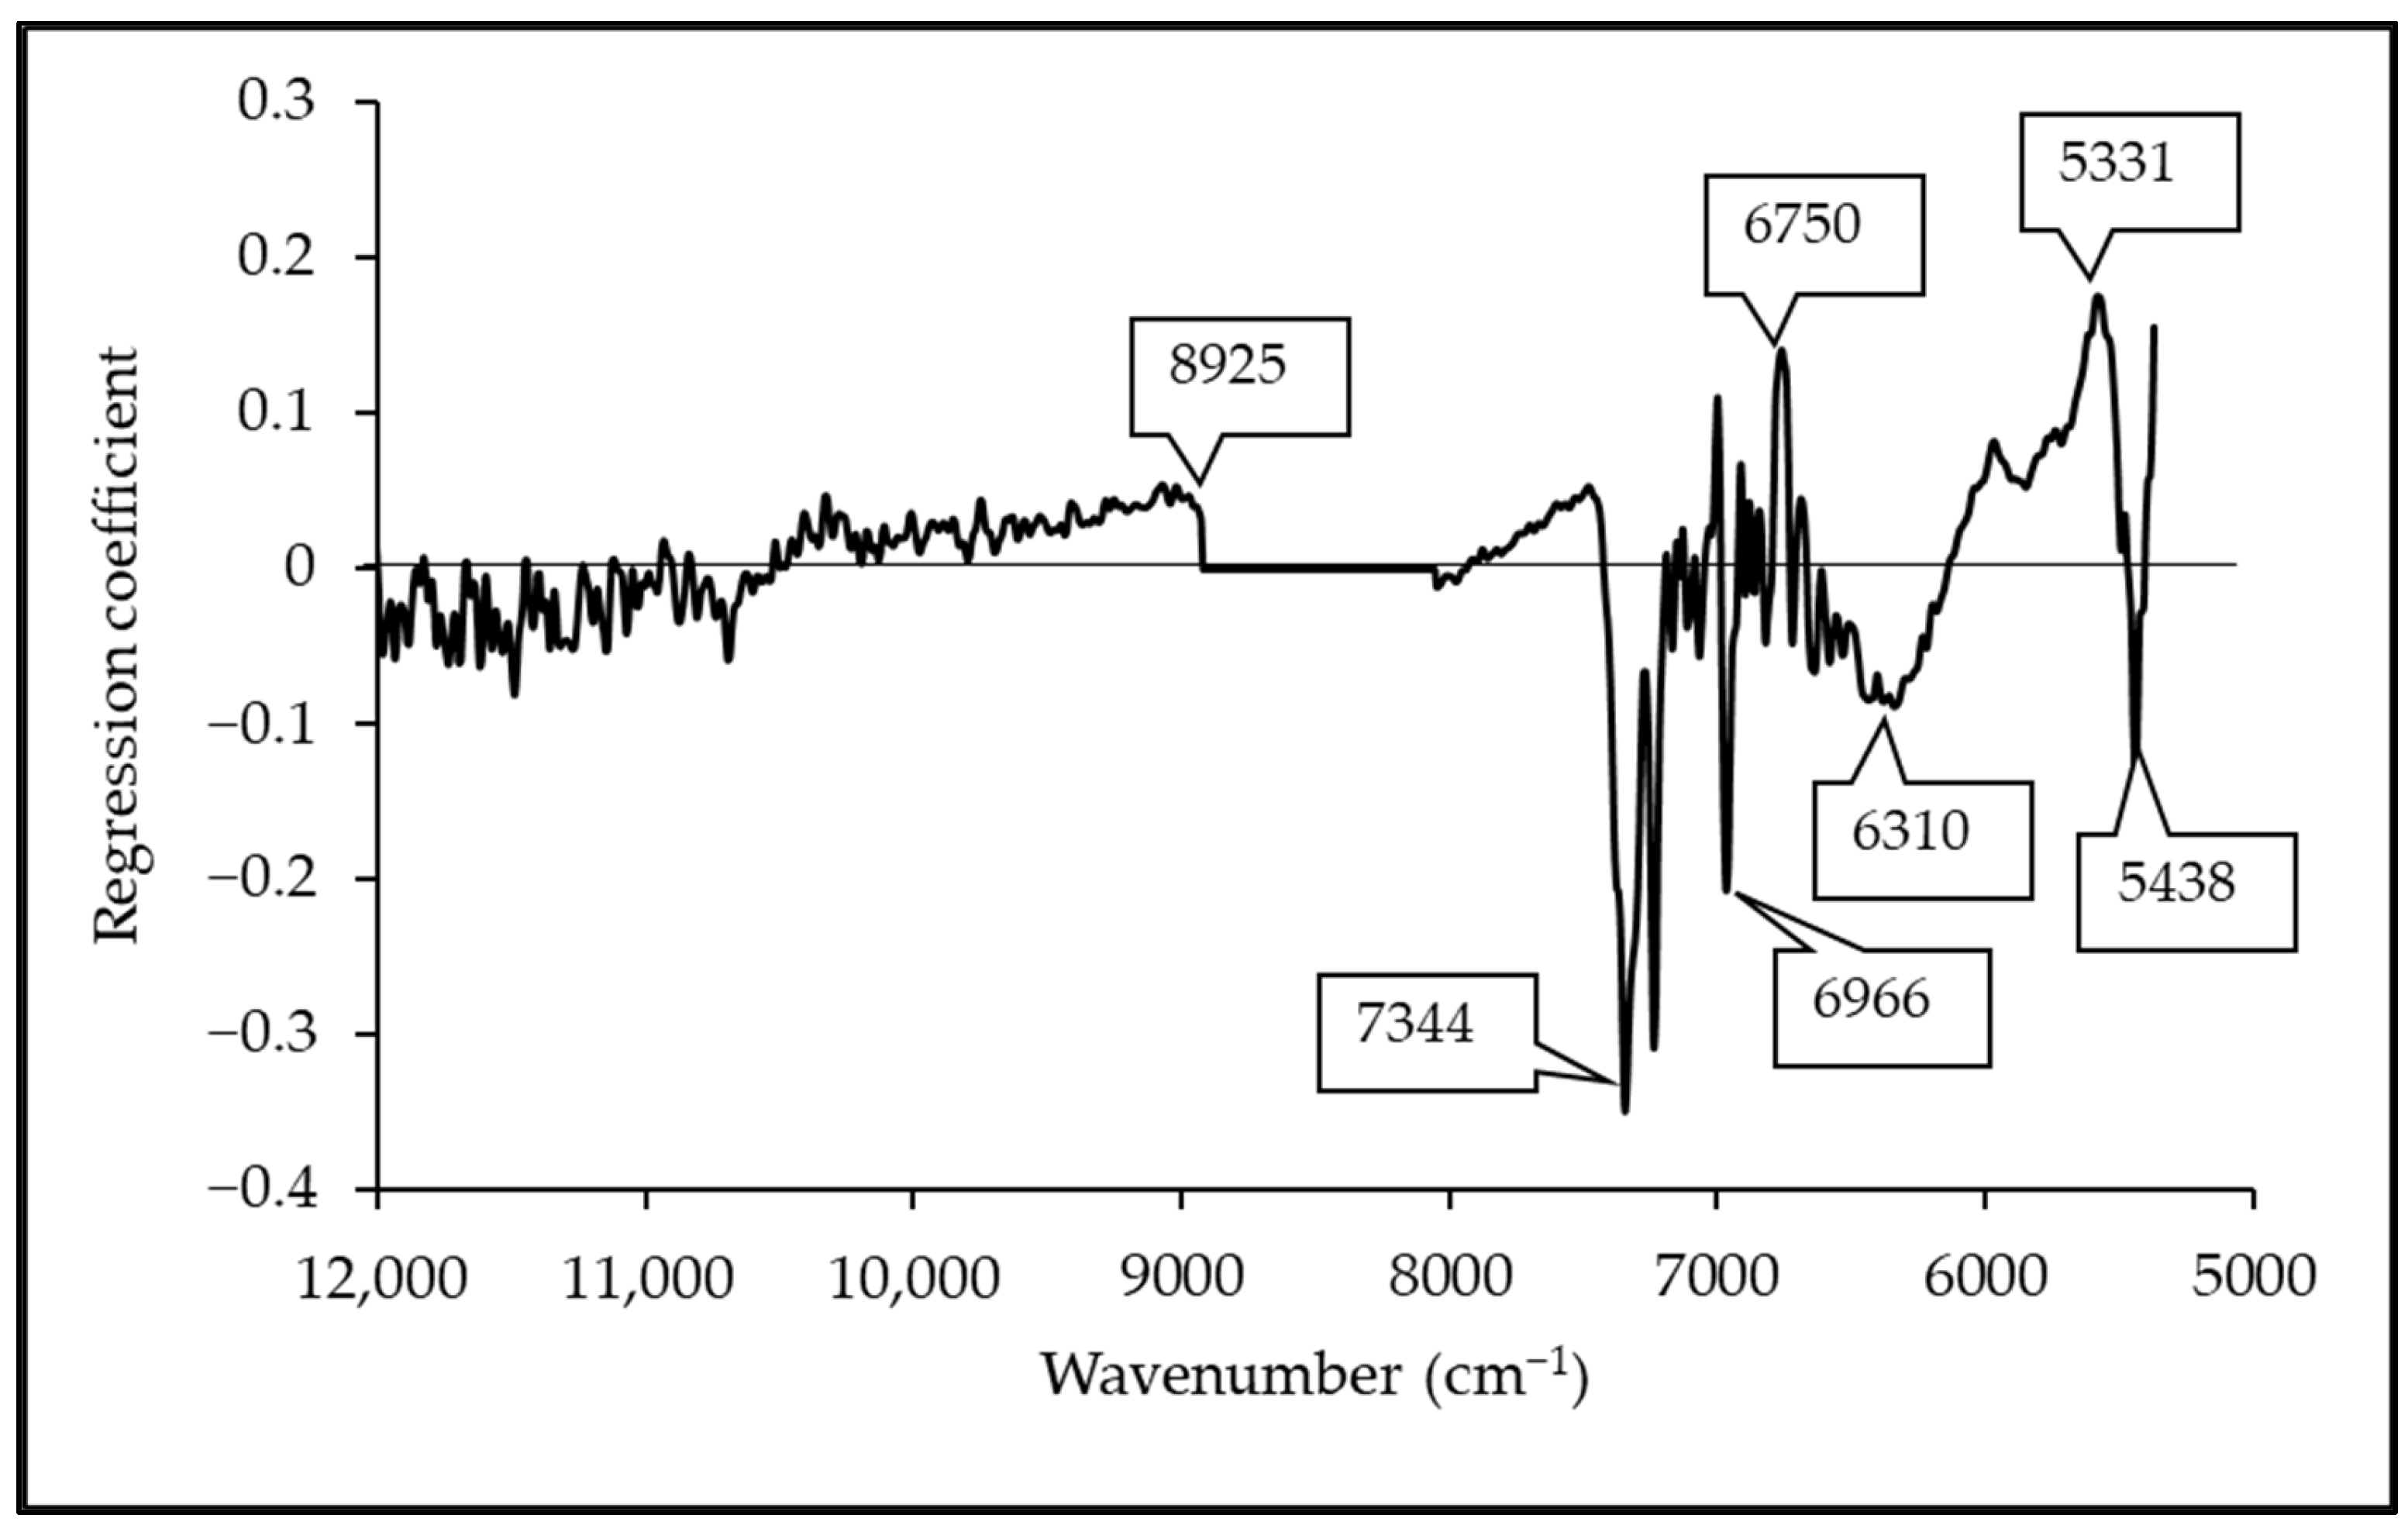
| 8925 | 1120 | 1127 | O-H from carboxyl acid | [53] |
| 7344 | 1362 | 1360 | 2 × C-H str. + C-H def. (CH3) | [51] |
| 6966 | 1436 | 1437 | C=O from saturated and unsaturated carboxyl acid | [53] |
| 6750 | 1481 | 1480 | O-H str. first overtone (glucose) | [51] |
| 6302 | 1587 | 1607 | C-O from COOH | [53] |
| 5562 | 1798 | 1780 | C-H combination of formic acid | [54] |
| 5438 | 1839 | 1850 | Acid chloride | [54] |
| Wavenumber (cm−1) | Wavelength (nm) | Referred Wavelength (nm) | LVs | Bond Vibration/Functional Group (Structure) | Ref. |
|---|---|---|---|---|---|
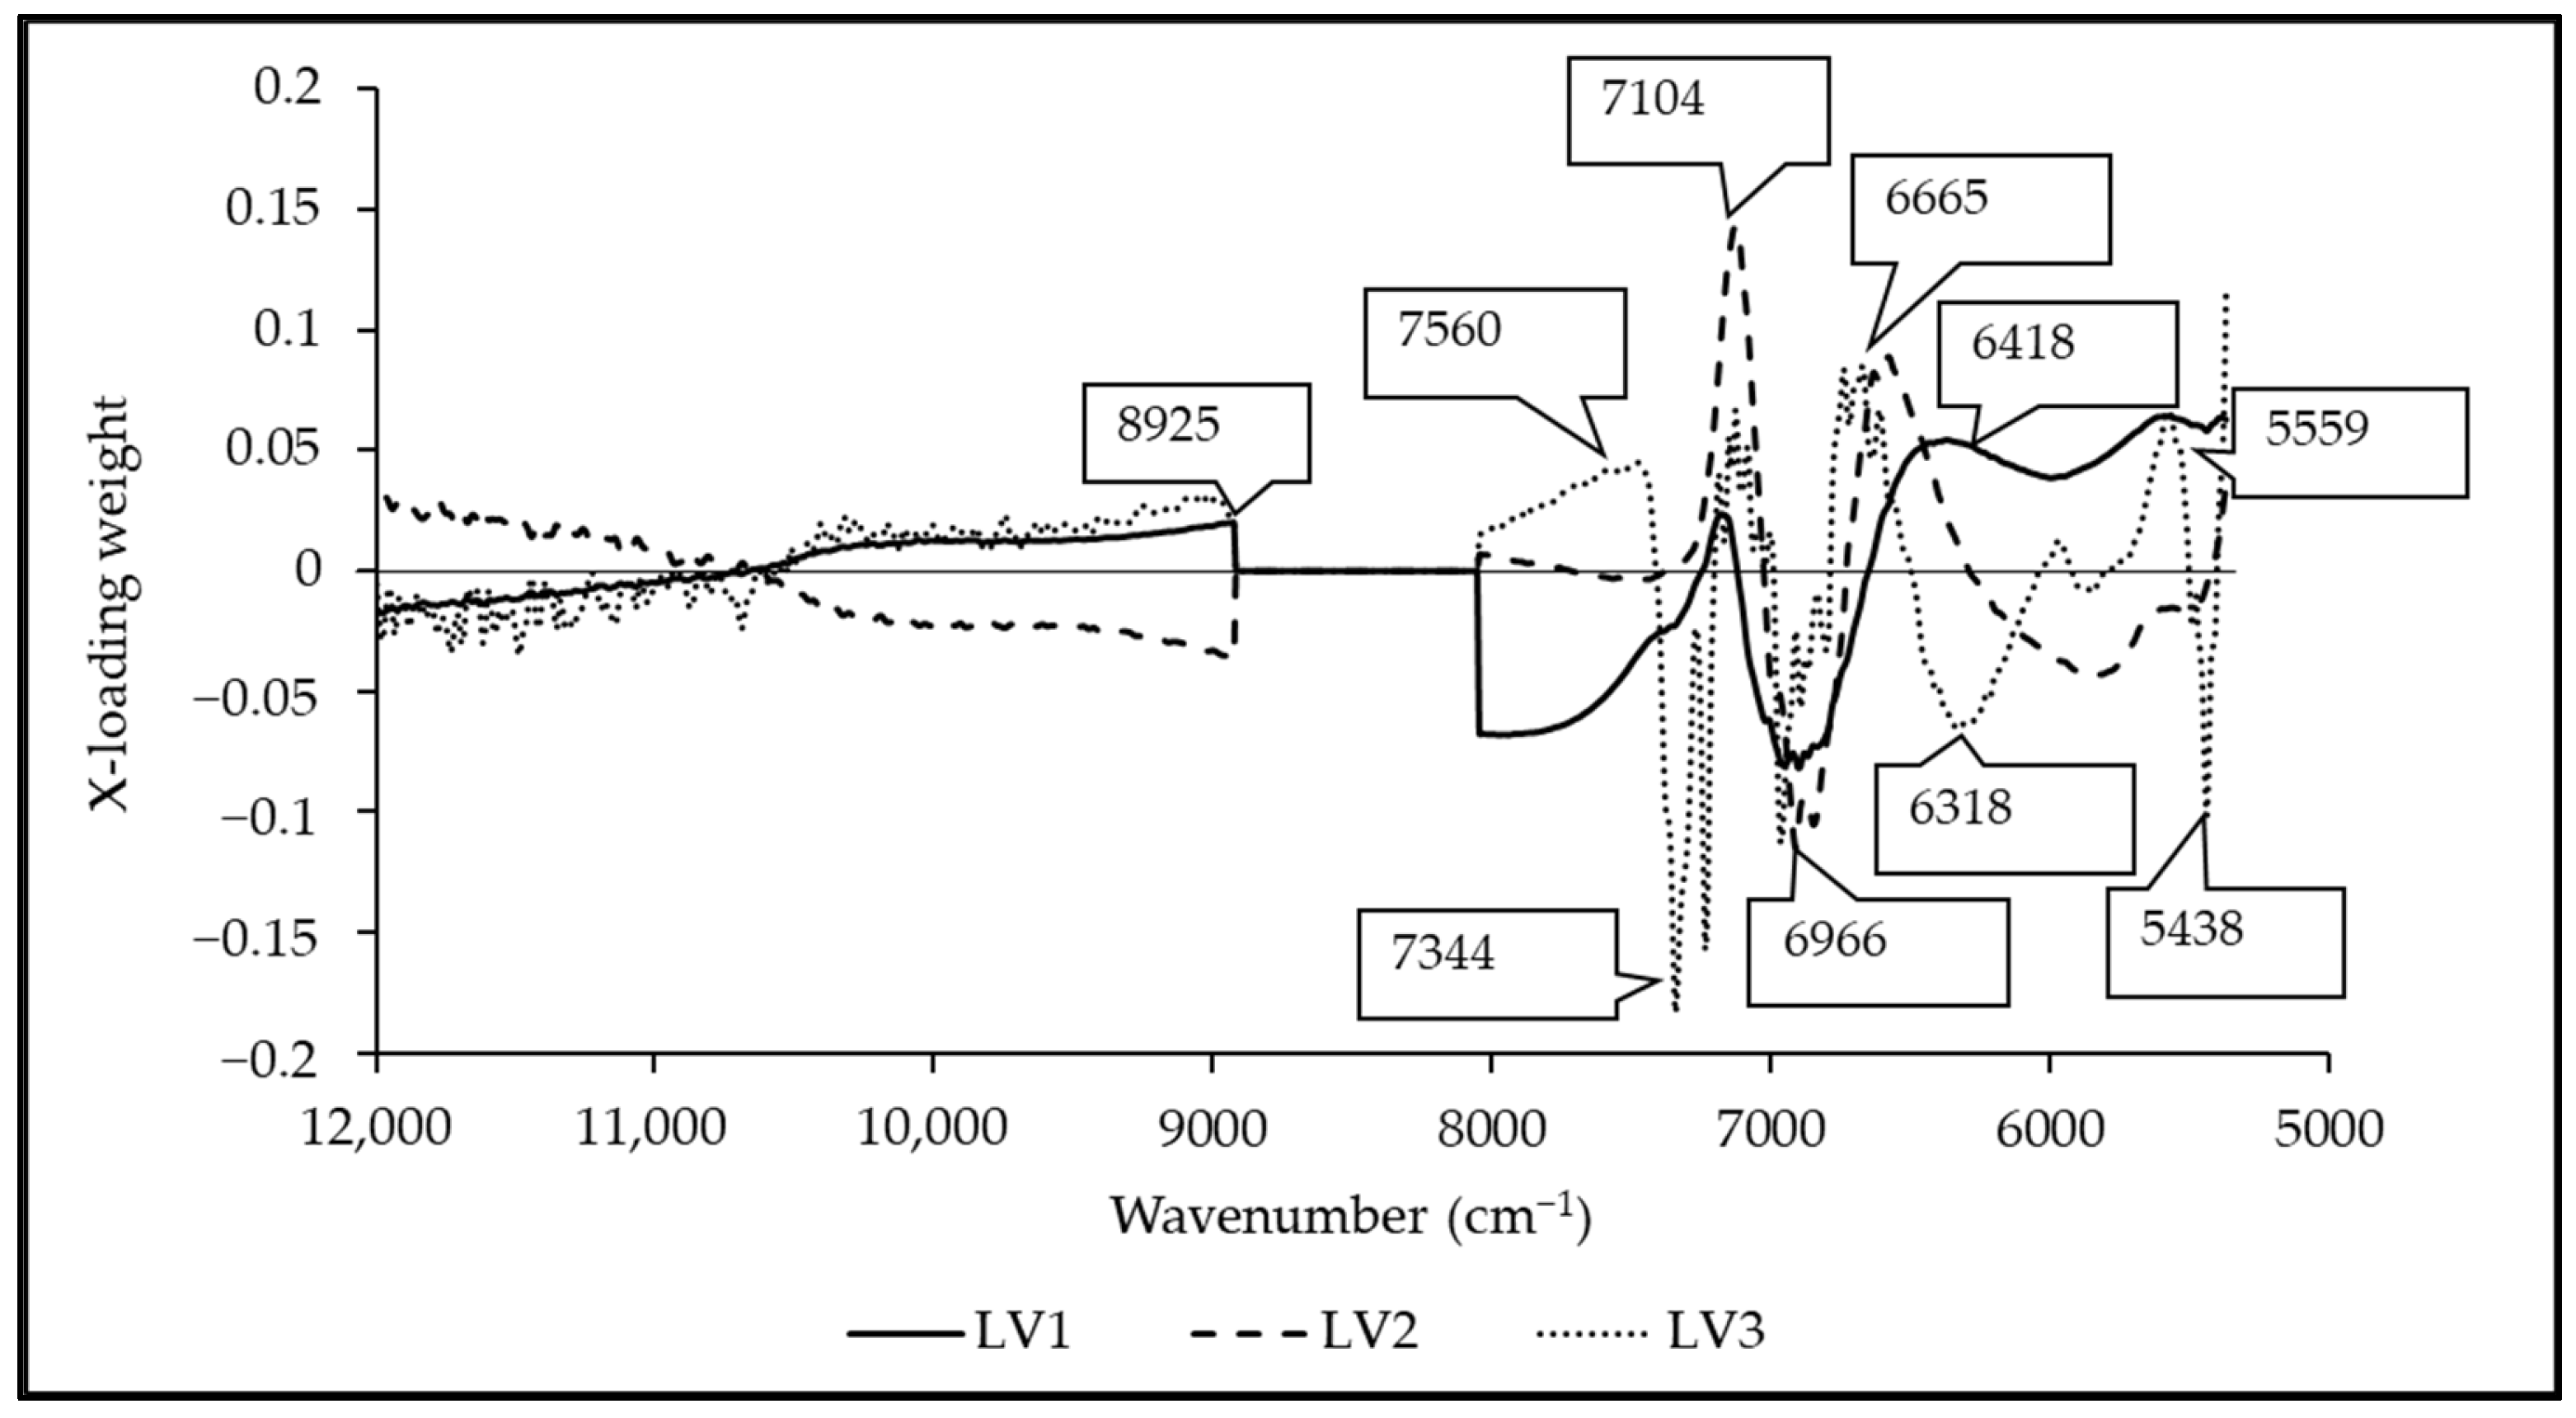
| 8925 | 1120 | 1127 | 1, 2, 3 | O-H from carboxyl acid | [53] |
| 8046 | 1243 | 1220 | 1 | O-H str. first overtone | [54] |
| 7560 | 1323 | 1315 | 3 | O-H str. first overtone | [54] |
| 7344 | 1362 | 1360 | 3 | 2 × C-H str. + C-H def. (CH3) | [51] |
| 7104 | 1408 | 1410 | 1, 2, 3 | O-H str. first overtone (ROH) | [51] |
| 6966 | 1436 | 1437 | 1, 2, 3 | C=O from saturated and unsaturated carboxyl acid | [53] |
| 6665 | 1500 | 1500 | 2, 3 | O-H str. first overtone (starch) | [44] |
| 6481 | 1543 | 1540 | 1 | O-H str. first overtone (starch) | [51] |
| 6318 | 1583 | 1580 | 3 | O-H str. first overtone (starch and glucose) | [51] |
| 5559 | 1799 | 1780 | 2 | C-H combination of formic acid | [54] |
| 5438 | 1839 | 1850 | 2 | Acid chloride | [54] |
| Wavenumber (cm−1) | Wavelength (nm) | Referred Wavelength (nm) | Bond Vibration/Functional Group (Structure) | Ref. |
|---|---|---|---|---|
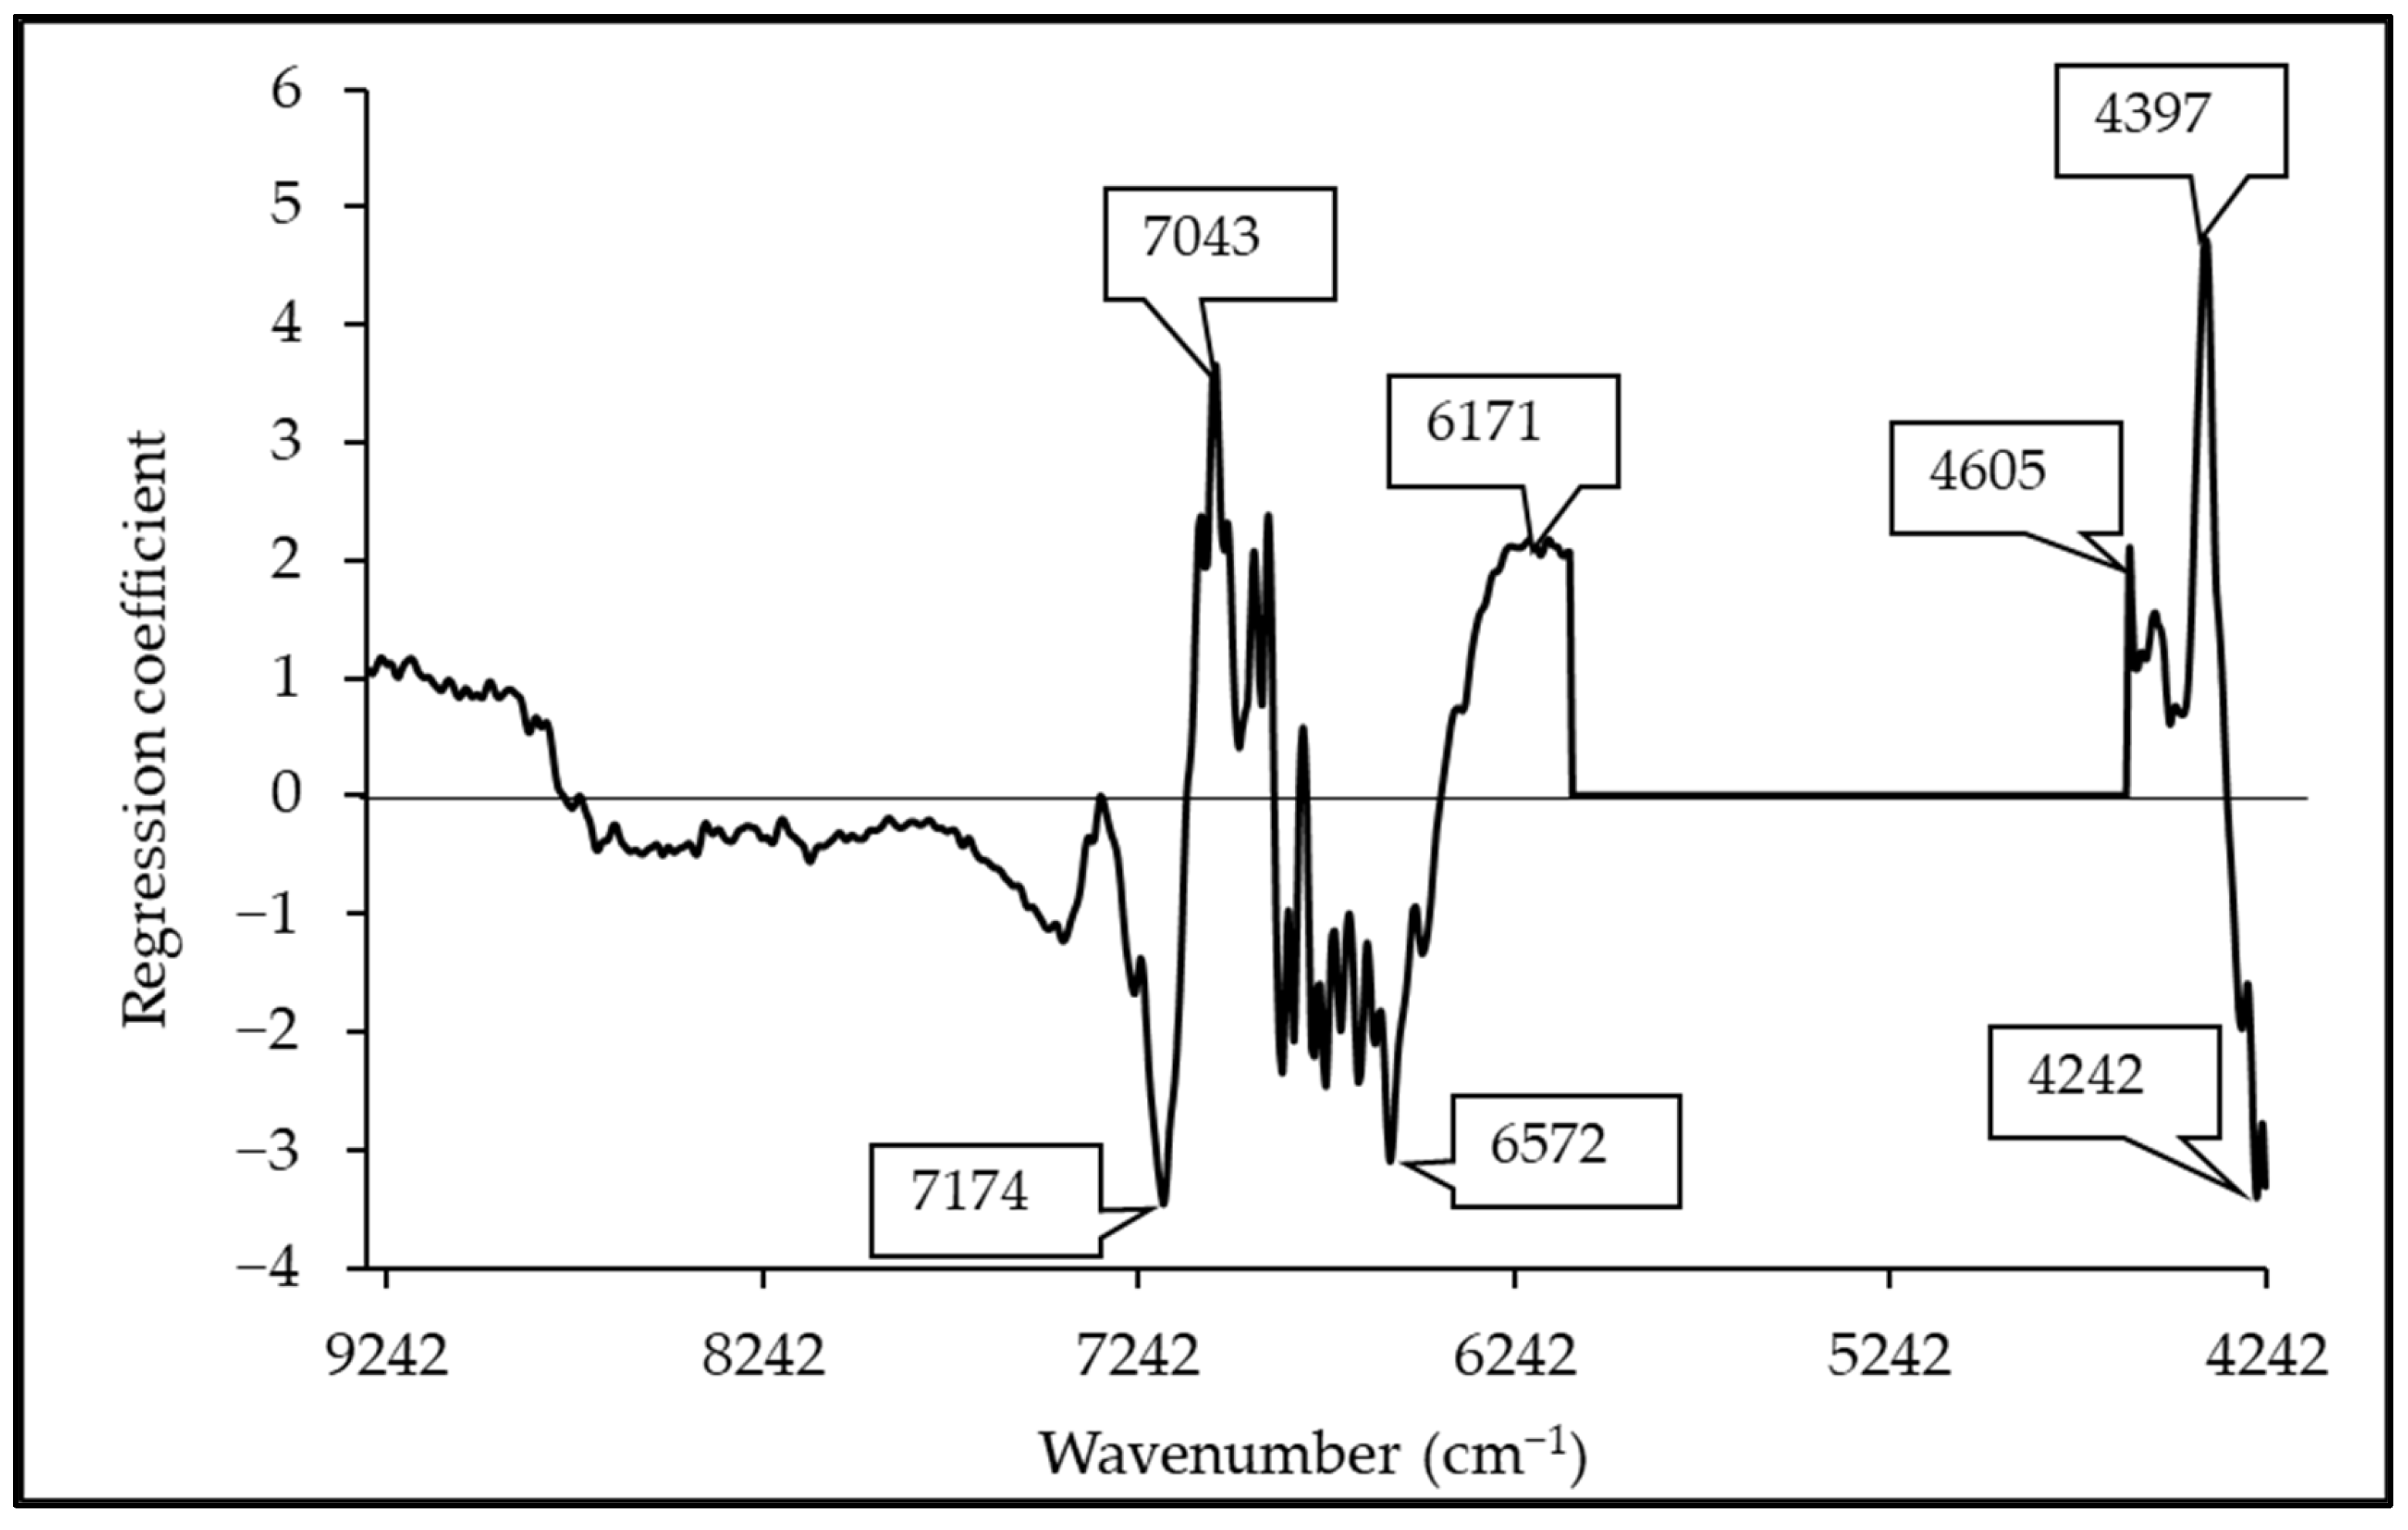
| 7174 | 1394 | 1395 | 2 × C-H str. + C-H def (CH2) | [51] |
| 7043 | 1420 | 1415 | C-H str. first overtone (CH2) | [51] |
| 6572 | 1522 | 1528 | O-H str. first overtone (starch) | [51] |
| 6171 | 1620 | 1620 | C-H str. first overtone (CH2) | [51] |
| 4605 | 2172 | 2170 | C-H combination (alkenes) | [51] |
| 4397 | 2274 | 2276 | O-H str. + C-C str. (starch) | [51] |
| 4242 | 2357 | 2352 | C-H def. second overtone (cellulose) | [51] |
| Wavenumber (cm−1) | Wavelength (nm) | Referred Wavelength (nm) | LVs | Bond Vibration/Functional Group (Structure) | Ref. |
|---|---|---|---|---|---|
| 7189 | 1391 | 1395 | 2 | 2 × C-H str. + C-H def. (CH2) | [51] |
| 6858 | 1458 | 1450 | 1, 2, 3 | O-H str. first overtone (H2O) | [51] |
| 6603 | 1514 | 1520 | 2 | O-H str. first overtone (CONH3) | [51] |
| 6372 | 1569 | 1580 | 3 | O-H str. first overtone (starch and glucose) | [51] |
| 4605 | 2172 | 2170 | 1, 2 | C-H combination (alkenes) | [51] |
| 4497 | 2224 | 2200 | 3 | C-H str. + C-O str. (carbohydrate) | [44] |
4. Conclusions
Author Contributions
Funding
Institutional Review Board Statement
Informed Consent Statement
Data Availability Statement
Acknowledgments
Conflicts of Interest
References
- Chaovanalikit, A.; Mingmuang, A.; Kitbunluewit, T.; Choldumrongkool, N.; Sondee, J.; Chupratum, S. Anthocyanin and total phenolics content of mangosteen and effect of processing on the quality of mangosteen products. Int. Food Res. J. 2012, 19, 1047–1053. [Google Scholar]
- Martin, F.W. Durian and mangosteen. In Tropical and Subtropical Fruits: Composition, Properties and Uses, 1st ed.; Nagy, S., Shaw, D.E., Eds.; AVI Publishing Co., Inc.: Westport, CT, USA, 1980; pp. 407–414. [Google Scholar]
- Lan, W.; Bureau, S.; Chen, S.; Leca, A.; Renard, C.M.G.C.; Jaillais, B. Visible, near- and mid-infrared spectroscopy coupled with an innovative chemometric strategy to control apple puree quality. Food Control 2021, 120, 107546. [Google Scholar] [CrossRef]
- Cozzolino, D.; Phan, A.; Netzel, M.; Smyth, H.; Sultanbawa, Y. Monitoring two different drying methods of Kakadu plum puree by combining infrared and chemometrics analysis. CYTA J. Food 2021, 19, 183–189. [Google Scholar] [CrossRef]
- Rattanapaskorn, S.; Rakmae, S. Study on parameters of centrifugal pulping machine for sugar apple. In Proceedings of the 54th Kasetsart University Annual Conference, Bangkok, Thailand, 2–5 February 2016. [Google Scholar]
- Jomduang, S.; Chanrittisen, T. Production of Kaew Mango Pulp and quality during storage. In Proceedings of the 37th Kasetsart University Annual Conference, Bangkok, Thailand, 3–5 February 1999. [Google Scholar]
- Manohar, B.; Ramakrishna, P.; Ramteke, R.S. Effect of pectin content on flow properties of mango pulp concentrates. J. Texture Stud. 1990, 21, 179–190. [Google Scholar] [CrossRef]
- Tansakul, A.; Kantrong, H.; Saengrayup, R.; Sura, P. Thermophysical properties of papaya puree. Int. J. Food Prop. 2012, 15, 1086–1100. [Google Scholar] [CrossRef]
- Tyl, C.; Sadler, G.D. pH and Titratable Acidity. In Food Analysis part of Food Science Text Series, 1st ed.; Nielsen, S.S., Ed.; Springer: Cham, Switzerland, 2017; pp. 389–406. [Google Scholar]
- Magwaza, L.S.; Opara, U.L. Analytical methods for determination of sugars and sweetness of horticultural products—A review. Sci. Hortic. 2015, 184, 179–192. [Google Scholar] [CrossRef]
- Dasenaki, M.E.; Thomaidis, N.S. Quality and authenticity control of fruit juices-a review. Molecules 2019, 24, 1014. [Google Scholar] [CrossRef] [Green Version]
- Rodriguez-Saona, L.E.; Fry, F.S.; McLaughlin, M.A.; Calvey, E.M. Rapid analysis of sugars in fruit juices by FT-NIR spectroscopy. Carbohydr. Res. 2001, 336, 63–74. [Google Scholar] [CrossRef]
- Masithoh, R.E.; Haff, R.; Kawano, S. Determination of soluble solids content and titratable acidity of intact fruit and juice of satsuma Mandarin using a hand-held near infrared instrument in transmittance mode. J. Near Infrared Spectrosc. 2016, 24, 83–88. [Google Scholar] [CrossRef]
- Xie, L.; Ye, X.; Liu, D.; Ying, Y. Quantification of glucose, fructose and sucrose in bayberry juice by NIR and PLS. Food Chem. 2009, 114, 1135–1140. [Google Scholar] [CrossRef]
- Włodarska, K.; Khmelinskii, I.; Sikorska, E. Evaluation of quality parameters of apple juices using near-infrared spectroscopy and chemometrics. J. Spectro. 2018, 2018, 5191283. [Google Scholar] [CrossRef]
- Caramês, E.T.S.; Alamar, P.D.; Poppi, R.J.; Pallone, J.A.L. Rapid Assessment of Total Phenolic and Anthocyanin Contents in Grape Juice Using Infrared Spectroscopy and Multivariate Calibration. Food Anal. Methods 2017, 17, 1609–1615. [Google Scholar] [CrossRef]
- Contal, L.; León, V.; Downey, G. Detection and quantification of apple adulteration in strawberry and raspberry purées using visible and near infrared spectroscopy. J. Near Infrared Spectrosc. 2002, 10, 289–299. [Google Scholar] [CrossRef]
- Davies, A.M.C.; Dennis, C.; Grant, A.; Hall, M.N.; Robertson, A. Screening of tomato purée for excessive mould content by near infrared spectroscopy: A preliminary evaluation. J. Sci. Food Agric. 1987, 39, 349–355. [Google Scholar] [CrossRef]
- Lan, W.; Jaillais, B.; Leca, A.; Renard, C.M.G.C.; Bureau, S. A new application of NIR spectroscopy to describe and predict purees quality from the non-destructive apple measurements. Food Chem. 2020, 310, 125944. [Google Scholar] [CrossRef]
- Munawar, A.A.; Suhandy, D. Fast and contactless assessment of intact mango fruit quality attributes using near infrared spectroscopy (NIRS). IOP Conf. Ser. Earth Environ. Sci. 2021, 644, 012028. [Google Scholar]
- Nghiệm, N.; Lộc, N.; Dũng, N.; Ngôn, N. A review on fruit quality assessment by non-destructive methods. TNU J. Sci. Technol. 2021, 226, 158–167. [Google Scholar] [CrossRef]
- Rungpichayapichet, P.; Mahayothee, B.; Nagle, M.; Khuwijitjaru, P.; Müller, J. Robust NIRS models for non-destructive prediction of postharvest fruit ripeness and quality in mango. Postharvest Biol. Technol. 2016, 111, 31–40. [Google Scholar] [CrossRef]
- Anderson, N.T.; Walsh, K.B.; Subedi, P.P.; Hayes, C.H. Achieving robustness across season, location and cultivar for a NIRS model for intact mango fruit dry matter content. Postharvest Biol. Technol. 2020, 168, 111202. [Google Scholar] [CrossRef]
- Mishra, P.; Woltering, E.; El, N. Improved prediction of ‘Kent’ mango firmness during ripening by near-infrared spectroscopy supported by interval partial least square regression. Infrared Phys. Technol. 2020, 110, 103459. [Google Scholar] [CrossRef]
- Taira, E.; Nakamura, S.; Hiyane, R.; Honda, H.; Ueno, M. Development of a nondestructive measurement system for mango fruit using near infrared spectroscopy. Eng. Appl. Sci. Res. 2017, 44, 189–192. Available online: https://ph01.tci-thaijo.org/index.php/easr/article/view/97562 (accessed on 22 November 2022).
- Jha, S.N.; Narsaiah, K.; Jaiswal, P.; Bhardwaj, R.; Gupta, M.; Kumar, R.; Sharma, R. Nondestructive prediction of maturity of mango using near infrared spectroscopy. J. Food Eng. 2014, 124, 152–157. [Google Scholar] [CrossRef]
- Sharma, S.; Sirisomboon, P.; Pornchaloempong, P. Application of a Vis-NIR spectroscopic technique to measure the total soluble solids content of intact mangoes in motion on a belt conveyor. Hortic. J. 2020, 89, 545–552. [Google Scholar] [CrossRef]
- Tangpao, T.; Phuangsaujai, N.; Kittiwachana, S.; George, D.R.; Krutmuang, P.; Chuttong, B.; Sommano, S.R. Evaluation of Markers Associated with Physiological and Biochemical Traits during Storage of ‘Nam Dok Mai Si Thong’ Mango Fruits. Agriculture 2022, 12, 1407. [Google Scholar] [CrossRef]
- Teerachaichayut, S.; Kil, K.Y.; Terdwongworakul, A.; Thanapase, W.; Nakanishi, Y. Non-destructive prediction of translucent flesh disorder in intact mangosteen by short wavelength near infrared spectroscopy. Postharvest Biol. Technol. 2007, 43, 202–206. [Google Scholar] [CrossRef]
- Terdwongworakul, A.; Nakawajana, N.; Teerachaichayut, S.; Janhiran, A. Determination of translucent content in mangosteen by means of near infrared transmittance. J. Food Eng. 2012, 109, 114–119. [Google Scholar] [CrossRef]
- Teerachaichayut, S.; Terdwongworakul, A.; Phonudom, J.; Uamsatianporn, W. The robustness of PLS models for soluble solids content of mangosteen using near infrared reflectance spectroscopy. Fresh Prod. 2009, 3, 60–63. [Google Scholar]
- Janhiran, A.; Thanapase, W.; Kasemsumran, S.; Teerachaichayut, S. Using near infrared spectroscopy techniques for non-destructive determination of total soluble solids in mangosteen fruits. In Proceedings of the 47. Kasetsart University Annual Conference, Bangkok, Thailand, 17–20 March 2009. [Google Scholar]
- Chang, W.H.; Chen, S.; Tsai, C.C. Development of a universal algorithm for use of nir in estimation of soluble solids in fruit juices. Trans. ASAE 1998, 41, 1739–1745. [Google Scholar] [CrossRef]
- Theanjumpol, P.; Sardsud, V.; Self, G. Determination of characteristic absorption bands for carbohydrates and organic acids in mango purée. In Proceedings of the 14th ICNIRS Conference, Bangkok, Thailand, 7–16 November 2009; Saranwong, S., Kasemsumran, S., Thanapase, W., Eds.; Williams Racing: Wantage, UK, 2009; pp. 291–294. [Google Scholar]
- Szuvandzsiev, P.; Helyes, L.; Lugasi, A.; Szántó, C.; Baranowski, P.; Pék, Z. Estimation of antioxidant components of tomato using VIS-NIR reflectance data by handheld portable spectrometer. Int. Agrophys. 2014, 28, 521–527. [Google Scholar] [CrossRef]
- Cozzolino, D. Infrared Spectroscopy as a Versatile Analytical Tool for the Quantitative Determination of Antioxidants in Agricultural Products, Foods and Plants. Antioxidants 2015, 4, 482–497. [Google Scholar] [CrossRef]
- Amodio, M.L.; Piazzolla, F.; Colantuono, F.; Colelli, G. The use of rapid FT-NIR methods to predict soluble solids, pH, titratable acidity and phenols of clingstone peaches (‘Baby Gold 9’). In Proceedings of the VIII International Postharvest Symposium: Enhancing Supply Chain and Consumer Benefits-Ethical and Technological Issues 1194, Cartagena, Spain, 21–24 June 2016; pp. 1111–1118. [Google Scholar]
- Downey, G.; Kelly, J.D. Detection and Quantification of Apple Adulteration in Diluted and Sulfited Strawberry and Raspberry Purées Using Visible and Near-Infrared Spectroscopy. J. Agric. Food Chem. 2004, 52, 204–209. [Google Scholar] [CrossRef]
- Sitorus, A.; Lapcharoensuk, R. A Comprehensive Overview Of Near Infrared And Infrared Spectroscopy For Detecting The Adulteration On Food And Agroproducts—A Critical Assessment. INMATEH-Agric. Eng. 2022, 67, 465–486. [Google Scholar] [CrossRef]
- Wold, S.; Sjöström, M.; Eriksson, L. PLS-regression: A basic tool of chemometrics. Chemom. Intell. Lab. Syst. 2001, 58, 109–130. [Google Scholar] [CrossRef]
- Huang, Y. Linear Calibration Methods. In Chemometric Methods in Analytical Spectroscopy Technology; Chu, X., Huang, Y., Yun, Y., Bian, X., Eds.; Springer: Singapore, 2022. [Google Scholar] [CrossRef]
- Romía, M.B.; Bernàrdez, M.A. Multivariate Calibration for Quantitative Analysis. In Infrared Spectroscopy for Food Quality Analysis and Control, 1st ed.; Sun, D.-W., Ed.; Academic Press: Cambridge, MA, USA, 2009. [Google Scholar]
- Cho, S.; Chung, H.; Lee, Y. Simple and fast near-infrared spectroscopic analysis of hydroxyl number of polyol using a disposable glass vial. Microchem. J. 2005, 80, 189–193. [Google Scholar] [CrossRef]
- Williams, P.; Antoniszyn, J.; Manley, M. Near-Infrared Technology: Getting the Best Out of Light; SUN PReSS: Stellenbosch, South Africa, 2019. [Google Scholar]
- Saechua, W.; Sharma, S.; Nakawajana, N.; Leepaitoon, K.; Chunsri, R.; Posom, J.; Roeksukrungrueang, C.; Siritechavong, T.; Phanomsophon, T.; Sirisomboon, P.; et al. Integrating Vis-SWNIR spectrometer in a conveyor system for in-line measurement of dry matter content and soluble solids content of durian pulp. Postharvest Biol. Technol. 2021, 181, 111640. [Google Scholar] [CrossRef]
- Posom, J.; Phuphanutada, J.; Lapcharoensuk, R. Gross calorific and ash content assessment of recycled sawdust from mushroom cultivation using near infrared spectroscopy. MATEC Web Conf. 2018, 192, 03021. [Google Scholar] [CrossRef] [Green Version]
- Dardenne, P. Some considerations about NIR Spectroscopy: Closing Speech at NIR-2009. NIR News 2010, 21, 8–14. [Google Scholar] [CrossRef]
- Sharma, S.; Sirisomboon, P. Precision test for spectral characteristic of on-line Vis-NIR versus at-line NIR spectroscopy for measuring total soluble solids of mango (Mangifera indica CV Nam Doc Mai). In Proceedings of the 10th TSAE International Conference (TSAE2017), IMPACT Exhibition and Convention Center, IMPACT FORUM 2, Bangkok, Thailand, 7–9 September 2017. [Google Scholar]
- Srisawat, K.; Sirisomboon, P.; Pun, U.K.; Krusong, W.; Rakmae, S.; Chaomuang, N.; Mawilai, P.; Pongsuttiyakorn, T.; Chookaew, C.; Pornchaloempong, P. Temperature Difference in Loading Area (Tarmac) during Handling of Air Freight Operations and Distance of Production Area Affects Quality of Fresh Mango Fruits (Mangifera indica L.‘Nam Dok Mai Si Thong’). Horticulturae 2022, 8, 1001. [Google Scholar] [CrossRef]
- Palapol, Y.; Ketsa, S.; Stevenson, D.; Cooney, J.M.; Allan, A.C.; Ferguson, I.B. Colour development and quality of mangosteen (Garcinia mangostana L.) fruit during ripening and after harvest. Postharvest Biol. Technol. 2009, 51, 349–353. [Google Scholar] [CrossRef]
- Osborne, B.G.; Fearn, T.; Hindle, P.H. Practical NIR Spectroscopy with Applications in Food and Beverage Analysis, 2nd ed.; Browning, D., Ed.; Longman Scientific and Technical: New York, NY, USA, 1993. [Google Scholar]
- Theron, M.M.; Lues, J.F.R. Organic acids and meat preservation: A review. Food Rev. Int. 2007, 23, 141–158. [Google Scholar] [CrossRef]
- Wang, H.; Peng, J.; Xie, C.; Bao, Y.; He, Y. Fruit quality evaluation using spectroscopy technology: A review. Sensors 2015, 15, 11889–11927. [Google Scholar] [CrossRef] [PubMed] [Green Version]
- Workman, J., Jr.; Weyer, L. Practical Guide to Interpretive Near-Infrared Spectroscopy, 1st ed.; CRC Press: Boston, MA, USA, 2007. [Google Scholar]
- Oliveira, G.A.; Castilhos, F.; Renard, C.M.G.C.; Bureau, S. Comparison of NIR and MIR spectroscopic methods for determination of individual sugars, organic acids and carotenoids in passion fruit. Food Res. Int. 2014, 60, 154–162. [Google Scholar] [CrossRef]
- Xie, L.; Ye, X.; Liu, D.; Ying, Y. Prediction of titratable acidity, malic acid, and citric acid in bayberry fruit by near-infrared spectroscopy. Food Res. Int. 2011, 44, 2198–2204. [Google Scholar] [CrossRef]


| Purée Sample | Scanning | Reference Laboratory | ||||
|---|---|---|---|---|---|---|
| TA (%) | TSS (% Brix) | |||||
| Repeatability | Reproducibility | Repeatability | Repeatability | |||
| Mango | 0.0095 | 0.0237 | 0.008 | 0.97 | 0.1 | 0.99 |
| Mangosteen | 0.0066 | 0.0160 | 0.001 | 0.70 | 0.2 | 0.94 |
| Sample | N | TSS (%Brix) | TA (%) | ||||||
|---|---|---|---|---|---|---|---|---|---|
| Min | Max | Mean | SD | Min | Max | Mean | SD | ||
| Mango | 96 | 14.2 | 23.2 | 18.5 | 2.2 | 0.023 | 0.668 | 0.187 | 0.104 |
| Mangosteen | 88 | 13.3 | 16.4 | 14.8 | 0.8 | 0.374 | 0.573 | 0.493 | 0.048 |
| Model | Spectral Range (cm−1) | Pretreatment | LVs | Calibration | Prediction | ||||
|---|---|---|---|---|---|---|---|---|---|
| R2 | RMSEC (%Brix) | r2 | RMSECV (%Brix) | RPD | Bias | ||||
| NIR | 9403.8–7498.3 6102–5446.3 | Frist derivative + Vector Normalization (17 pts) | 5 | 0.964 | 0.4 | 0.939 | 0.5 | 4.0 | −0.01 |
| Gen A | 8933.2–7151.2 6264–5369.2 | Vector Normalization | 8 | 0.972 | 0.4 | 0.953 | 0.5 | 4.7 | −0.01 |
| Gen B | 8046–7151.2 6264–5369.2 | Min–Max Normalization | 7 | 0.965 | 0.4 | 0.955 | 0.5 | 4.7 | −0.01 |
| Model | Spectral Range (cm−1) | Pretreatment | LVs | Calibration | Prediction | ||||
|---|---|---|---|---|---|---|---|---|---|
| R2 | RMSEC (%) | r2 | RMSECV (%) | RPD | Bias | ||||
| NIR | 9403.8–7498.3 6102–5446.3 | Vector Normalization | 7 | 0.911 | 0.032 | 0.780 | 0.048 | 2.1 | 0.001 |
| Gen A | 12,489.5–8925.5 8046–5369.2 | Multiplicative Scatter Correction | 4 | 0.824 | 0.045 | 0.817 | 0.048 | 2.2 | 0.001 |
| Gen B | 11,602.3–10,707.5 9828–7151.2 6264–5369.2 | Vector Normalization | 9 | 0.976 | 0.017 | 0.803 | 0.046 | 2.3 | 0.000 |
| Model | Spectral Range (cm−1) | Pretreatment | LVs | Calibration | Prediction | ||||
|---|---|---|---|---|---|---|---|---|---|
| R2 | RMSEC (%) | r2 | RMSECV (%) | RPD | Bias | ||||
| NIR | 9403.8–6094.3 4605.4–4242.9 | No Preprocessing | 7 | 0.875 | 0.284 | 0.799 | 0.3 | 2.2 | 0.0 |
| Gen A | 11,602.3–10,707.5 8940.9–5369.2 | Vector Normalization | 10 | 0.954 | 0.178 | 0.746 | 0.4 | 2.0 | 0.0 |
| Gen B | 10,715.2–9820.3 8940.9–7151.2 6264–5369.2 | Vector Normalization | 8 | 0.941 | 0.169 | 0.793 | 0.3 | 2.2 | 0.0 |
| Model | Spectral Range (cm−1) | Pretreatment | LVs | Calibration | Prediction | ||||
|---|---|---|---|---|---|---|---|---|---|
| R2 | RMSEC (%Brix) | r2 | RMSECV (%Brix) | RPD | Bias | ||||
| NIR | 9403.8–6094.3 4605.4–4242.9 | Frist derivative + Straight-line Subtraction (17 pts) | 9 | 0.662 | 0.03 | 0.273 | 0.048 | 1.2 | −0.001 |
| Gen A | 12,489.5–11,602.3 10,715.2–8925.5 5376.9–4482 | Constant Offset Elimination | 1 | 0.153 | 0.05 | 0.111 | 0.048 | 1.2 | 0.000 |
| Gen B | 9828–7151.2 | Vector Normalization | 7 | 0.723 | 0.03 | 0.248 | 0.046 | 1.2 | 0.000 |
| Mean (%) | Variance (%) | Pearson Correlation | p-Value (Two-Tailed) | |
|---|---|---|---|---|
| Observed TA% | 0.495 | 0.002 | 0.588 | 0.823 |
| Predicted TA% | 0.499 | 0.002 |
| Wavenumber (cm−1) | Wavelength (nm) | Referred Wavelength (nm) | Bond Vibration/Functional Group (Structure) | Ref. |
|---|---|---|---|---|
| 7336 | 1363 | 1360 | 2 × C-H str. + C-H def. (CH3) | [51] |
| 7189 | 1391 | 1395 | 2 × C-H str. + C-H def. (CH2) | [51] |
| 6264 | 1596 | 1580 | O-H str. first overtone (starch/glucose) | [51] |
| 5978 | 1673 | 1685 | C-H str. first overtone (aromatics) | [51] |
| 5700 | 1754 | 1765 | C-H str. first overtone (CH2) | [51] |
| 5384 | 1857 | 1900 | O-H str. + 2 × C-O str. (starch) | [51] |
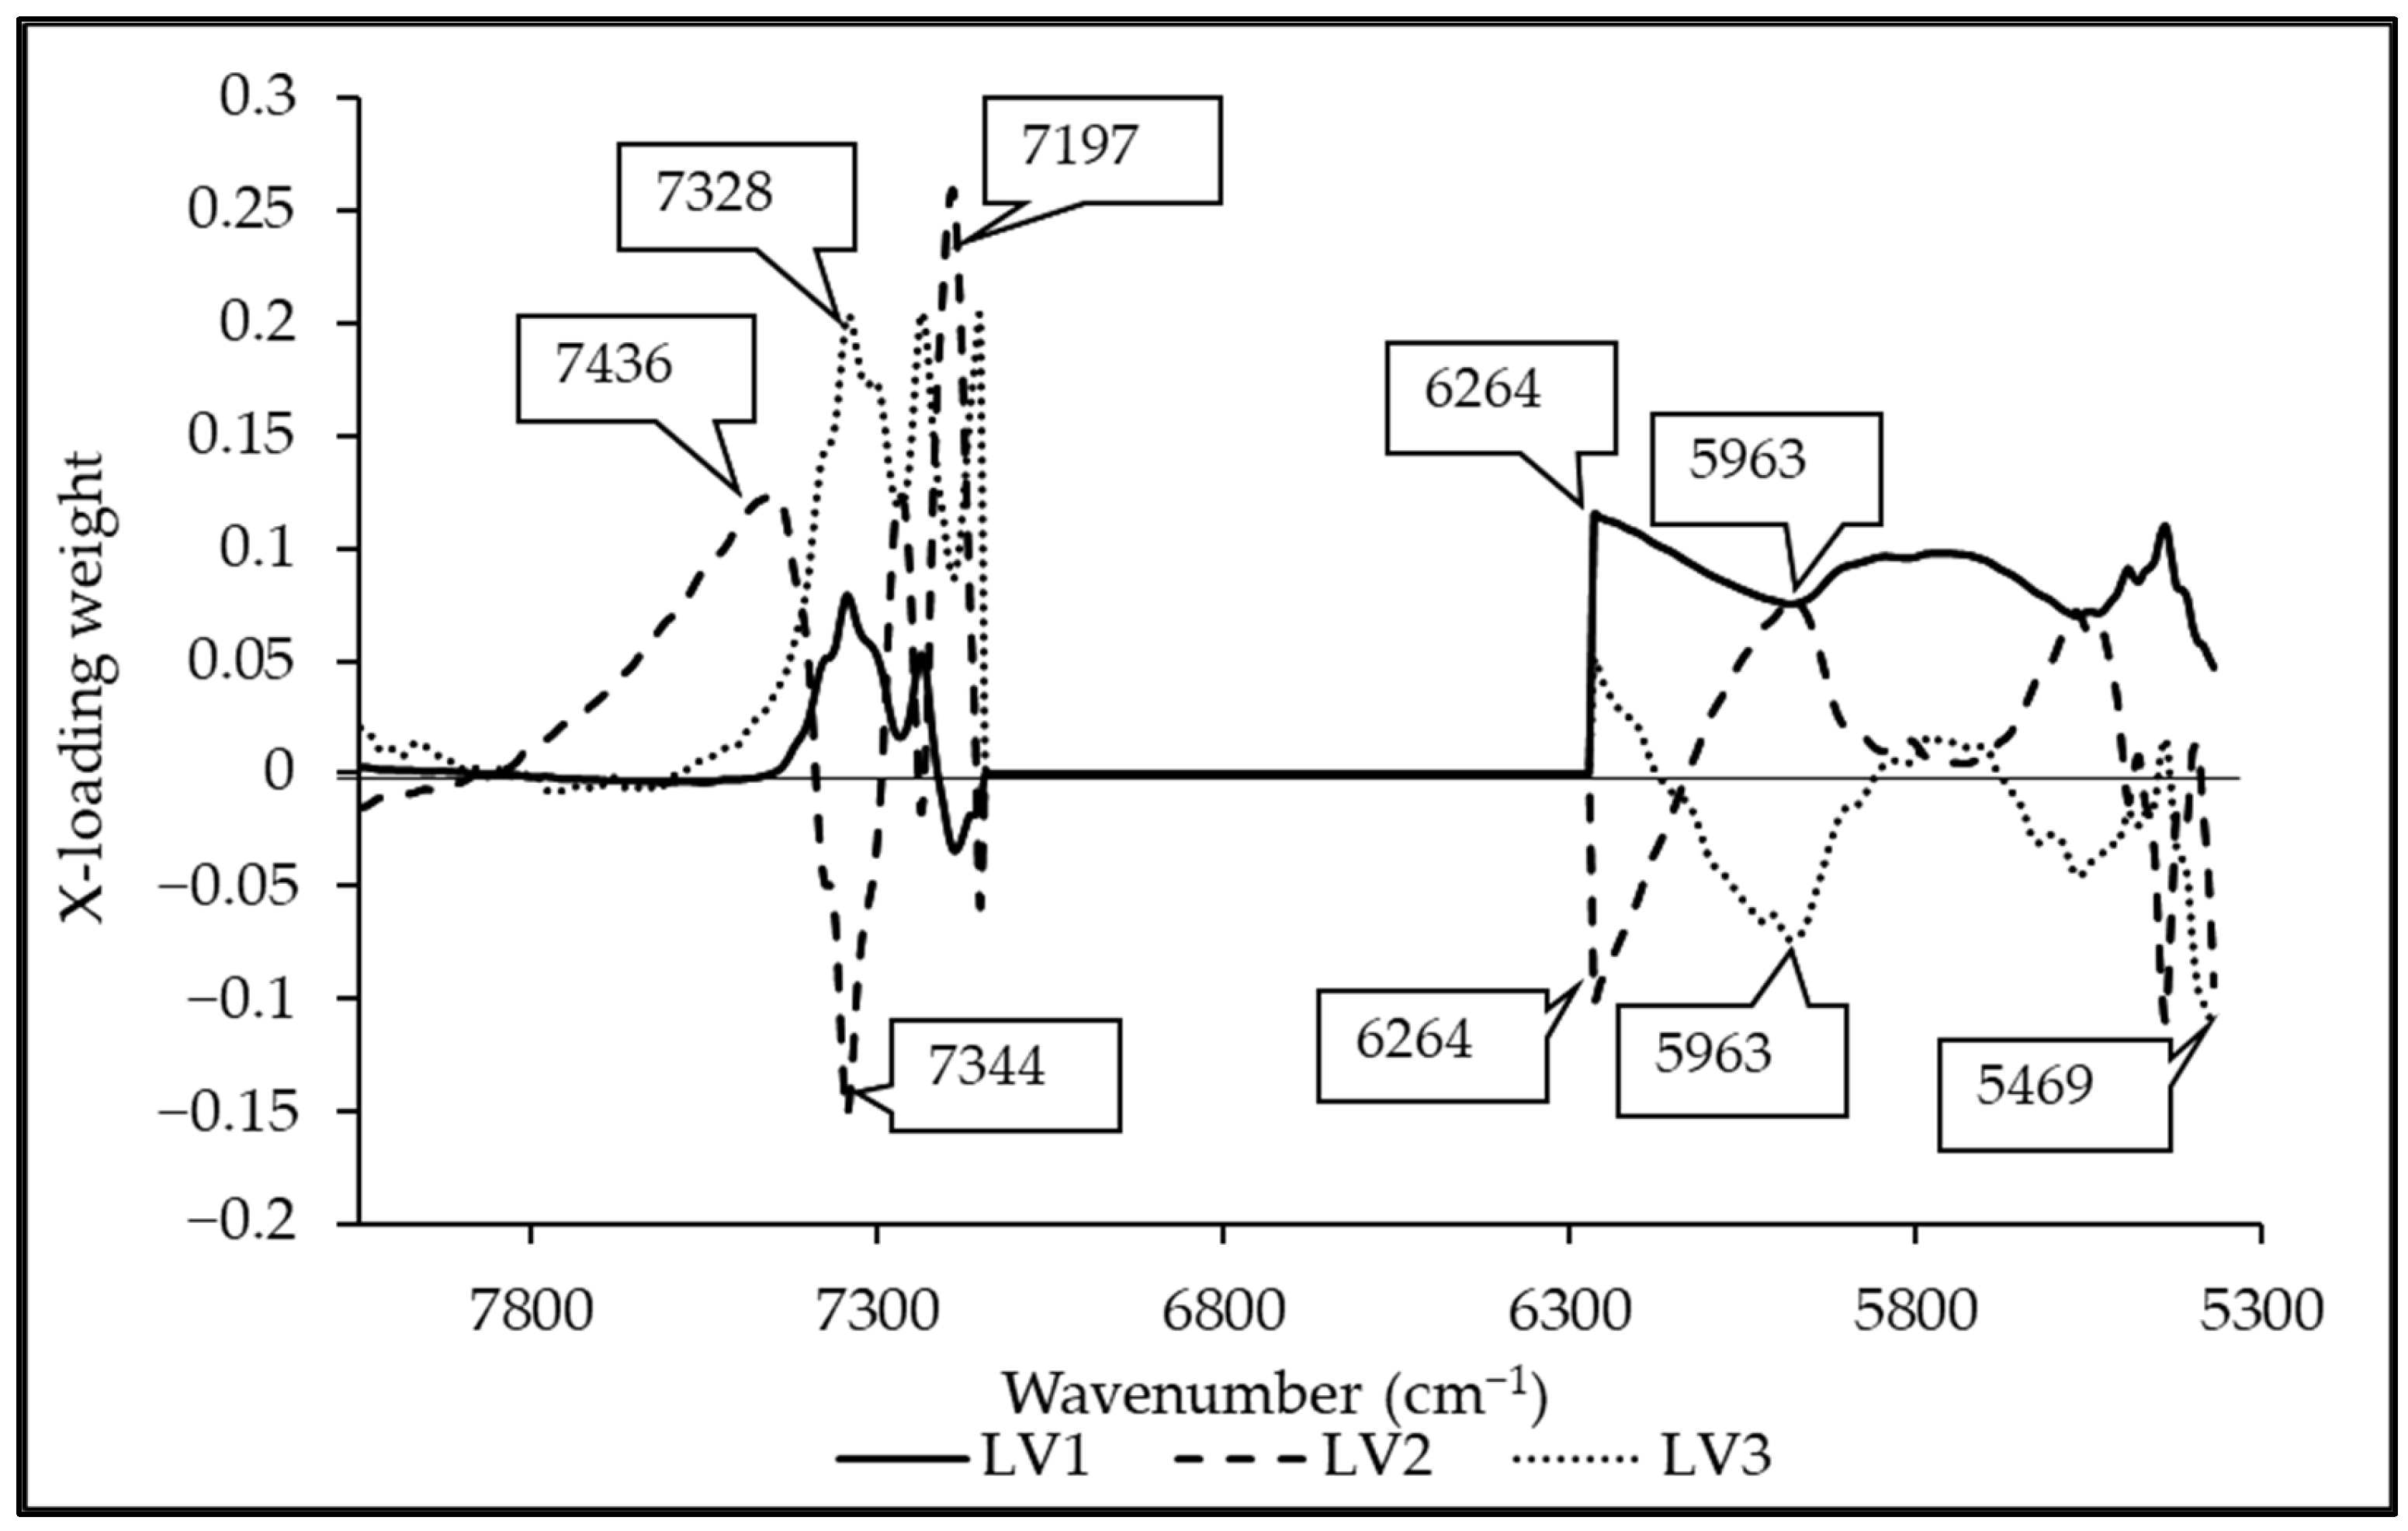
| Wavenumber (cm−1) | Wavelength (nm) | Referred Wavelength (nm) | LVs | Bond Vibration/Functional Group (Structure) | Ref. |
|---|---|---|---|---|---|
| 7436 | 1345 | 1360 | 2 | 2 × C-H str. + C-H def. (CH3) | [51] |
| 7328 | 1365 | 1360 | 2 | 2 × C-H str. + C-H def. (CH3) | [51] |
| 7344 | 1362 | 1360 | 1, 3 | 2 × C-H str. + C-H def. (CH3) | [51] |
| 7197 | 1389 | 1395 | 2 | 2 × C-H str. + C-H def. (CH2) | [51] |
| 6264 | 1596 | 1580 | 1, 2, 3 | O-H str. first overtone (starch, glucose) | [51] |
| 5963 | 1677 | 1685 | 3, 2 | C-H str. first overtone (aromatics) | [51] |
| 5469 | 1828 | 1820 | 2 | O-H str. + 2 × C=O str. (cellulose) | [51] |
| 5438 | 1839 | 1820 | 3 | O-H str. + 2 × C=O str. (cellulose) | [51] |
Publisher’s Note: MDPI stays neutral with regard to jurisdictional claims in published maps and institutional affiliations. |
© 2022 by the authors. Licensee MDPI, Basel, Switzerland. This article is an open access article distributed under the terms and conditions of the Creative Commons Attribution (CC BY) license (https://creativecommons.org/licenses/by/4.0/).
Share and Cite
Pornchaloempong, P.; Sharma, S.; Phanomsophon, T.; Srisawat, K.; Inta, W.; Sirisomboon, P.; Prinyawiwatkul, W.; Nakawajana, N.; Lapcharoensuk, R.; Teerachaichayut, S. Non-Destructive Quality Evaluation of Tropical Fruit (Mango and Mangosteen) Purée Using Near-Infrared Spectroscopy Combined with Partial Least Squares Regression. Agriculture 2022, 12, 2060. https://doi.org/10.3390/agriculture12122060
Pornchaloempong P, Sharma S, Phanomsophon T, Srisawat K, Inta W, Sirisomboon P, Prinyawiwatkul W, Nakawajana N, Lapcharoensuk R, Teerachaichayut S. Non-Destructive Quality Evaluation of Tropical Fruit (Mango and Mangosteen) Purée Using Near-Infrared Spectroscopy Combined with Partial Least Squares Regression. Agriculture. 2022; 12(12):2060. https://doi.org/10.3390/agriculture12122060
Chicago/Turabian StylePornchaloempong, Pimpen, Sneha Sharma, Thitima Phanomsophon, Kraisuwit Srisawat, Wasan Inta, Panmanas Sirisomboon, Witoon Prinyawiwatkul, Natrapee Nakawajana, Ravipat Lapcharoensuk, and Sontisuk Teerachaichayut. 2022. "Non-Destructive Quality Evaluation of Tropical Fruit (Mango and Mangosteen) Purée Using Near-Infrared Spectroscopy Combined with Partial Least Squares Regression" Agriculture 12, no. 12: 2060. https://doi.org/10.3390/agriculture12122060