Article

Analysis of HMCVT Shift Quality Based on the Engagement Characteristics of Wet Clutch

Department of Agricultural Engineering, College of Engineering, Nanjing Agricultural University, Nanjing 210031, China
*
Author to whom correspondence should be addressed.
Agriculture 2022, 12(12), 2012; https://doi.org/10.3390/agriculture12122012
Submission received: 21 October 2022 / Revised: 17 November 2022 / Accepted: 21 November 2022 / Published: 25 November 2022

Abstract

:
A wet clutch is the key shift part of the hydro-mechanical continuously variable transmission (HMCVT), and the working characteristics have an important influence on the shift quality of HMCVT. To reduce impact during the shift and improve engagement quality, this paper analyzed the influence of system oil pressure and the clutch’s working flow on the engagement characteristics of the wet clutch in terms of shift quality. Firstly, the engagement characteristics (including oil pressure variation characteristics and dynamic torque characteristics) of the wet clutch were tested with different working flows and system oil pressures based on the HMCVT shift clutch bench. Then, the shift impact and sliding friction work were used to evaluate the shift quality. An evaluation function was established based on the maximum shift impact and the maximum sliding friction work to obtain the optimal shift quality. Finally, a shift model was built using Simulation X to simulate the shift quality of nine groups of engagement characteristics. The results showed that increasing the working flow can reduce the wet clutch engagement time by 1.7 s at most, and increasing the system oil pressure can only reduce this by 0.1 s. The higher working flow and system oil pressure can increase the shift impact and reduce the sliding friction work. The combination of the working flow and system oil pressure with the minimum evaluation function value is (10 L/min, 2.0 MPa), and the shift quality is the best. The research can provide a reference for the design, shift control, and shift quality improvement of an HMCVT wet clutch.

1. Introduction

Hydro-Mechanical Continuously Variable Transmission (HMCVT) combines the characteristics of hydraulic transmission and mechanical transmission to achieve continuous speed regulation [1,2], which can adapt to a wide variety of working conditions of tractors and has advantages of low-impact, high work efficiency, and large transmission power [3,4]. Shifting in HMCVT is similar to that of step transmission, and the power needs to be transferred from one wet clutch to another [5,6]. Therefore, shift quality problems will occur in the shift in HMCVT, such as impact and power interruption. The shift quality problems will reduce the friction efficiency of the wet clutch [7,8,9] and increase the wear of friction plates [10], which greatly affects the wet clutch life and the driver’s comfort.
As one of the key components of HMCVT, the performance of the wet clutch is very important to the shift quality. Some experts improved the HMCVT shift quality by improving the control accuracy of the wet clutch [11,12,13,14], but there are few reports on the successful application of the HMCVT shifting clutch. Therefore, experts studied the influence of wet clutch working parameters to improve the shift quality. Ni et al. [15] found that the influence of the clutch working oil pressure on HMCVT shift quality is greater than that of working flow according to an orthogonal test. Lu et al. [16] established a physical model of HMCVT based on Simulation X and discussed the influence of wet clutch working oil pressure and working flow on shift quality using a single-factor test. Wei et al. [17] made the two brakes overlap, thus reducing the impact of the change section and improving the quality of the shift. Cao et al. [18] optimized the wet clutch switching timing of the dual-mode hydraulic mechanical transmission device using an orthogonal test and improved the quality of the shift. Zhu et al. [19] established a dynamic model of HMCVT and formulated the control strategy of the wet clutch to improve the shift quality. However, these studies did not consider the engagement characteristics of the wet clutch when analyzing the working parameters, and it is difficult to reflect the actual engagement law of the wet clutch.
At present, scholars mostly study the engagement characteristics of wet clutches using the mechanism of torque generation. For example, Zhang et al. [20], Wang et al. [21], and Bao et al. [22], respectively, established a mathematical model of the wet clutch engagement process based on the elastic contact theory of the rough surface of the friction material and analyzed the influence of engagement pressure, lubricating oil viscosity, dynamic and static friction coefficients on the torque characteristics of the wet clutch. Huang et al. [23] and Zhang et al. [24] used the finite-element method to simulate the friction torque in the wet clutch engagement process and verified this using an SAE #2 test bench. Lingesten et al. [25] designed a wet clutch wear measurement bench, analyzed the wear mechanism based on the surface temperature of the friction material, and tested the influence of the number of engagements, torque, and friction coefficient on the clutch wear. These studies require detailed wet clutch design data and tedious theoretical derivations, which are often difficult to obtain, require a huge amount of work, and are more difficult to apply to HMCVT shift quality. Consequently, some scholars use a wet clutch physical model instead of a mathematical model and successfully apply this to their shift quality research. For instance, Chen et al. [26] established a model of an HMCVT wet clutch based on AMEsim, simulating the oil pressure increase characteristics of wet clutches. Zhao et al. [27] established the dynamic model of HMCVT based on Simulation X, introduced the friction coefficient into the wet clutch model, and analyzed the influence of control oil pressure on the sliding friction power and peak torque of wet clutches during HMCVT shifting. However, establishing a physical model in the software is too idealistic, and will result in a large deviation between the results and the actual problem.
To solve the above problems, we built an HMCVT shift clutch bench to test the oil pressure variation characteristics of wet clutches. We obtained 18 groups of working flow and system oil pressure combinations and tested the dynamic torque characteristics of the wet clutch during engagement. We developed a simulation model for HMCVT shift quality using the software, Simulation X. On this basis, we conducted nine groups of shift quality tests based on the engagement characteristics and obtained the influence of the two parameters of working flow and system oil pressure on shift quality. In addition, we formulated a shift-quality evaluation function and obtained the evaluation function value of the smallest combination of workflow and system oil pressure for a wet clutch control. This study provides valuable reference information for the research on wet clutch engagement characteristics and HMCVT shift quality.

2. Materials and Methods

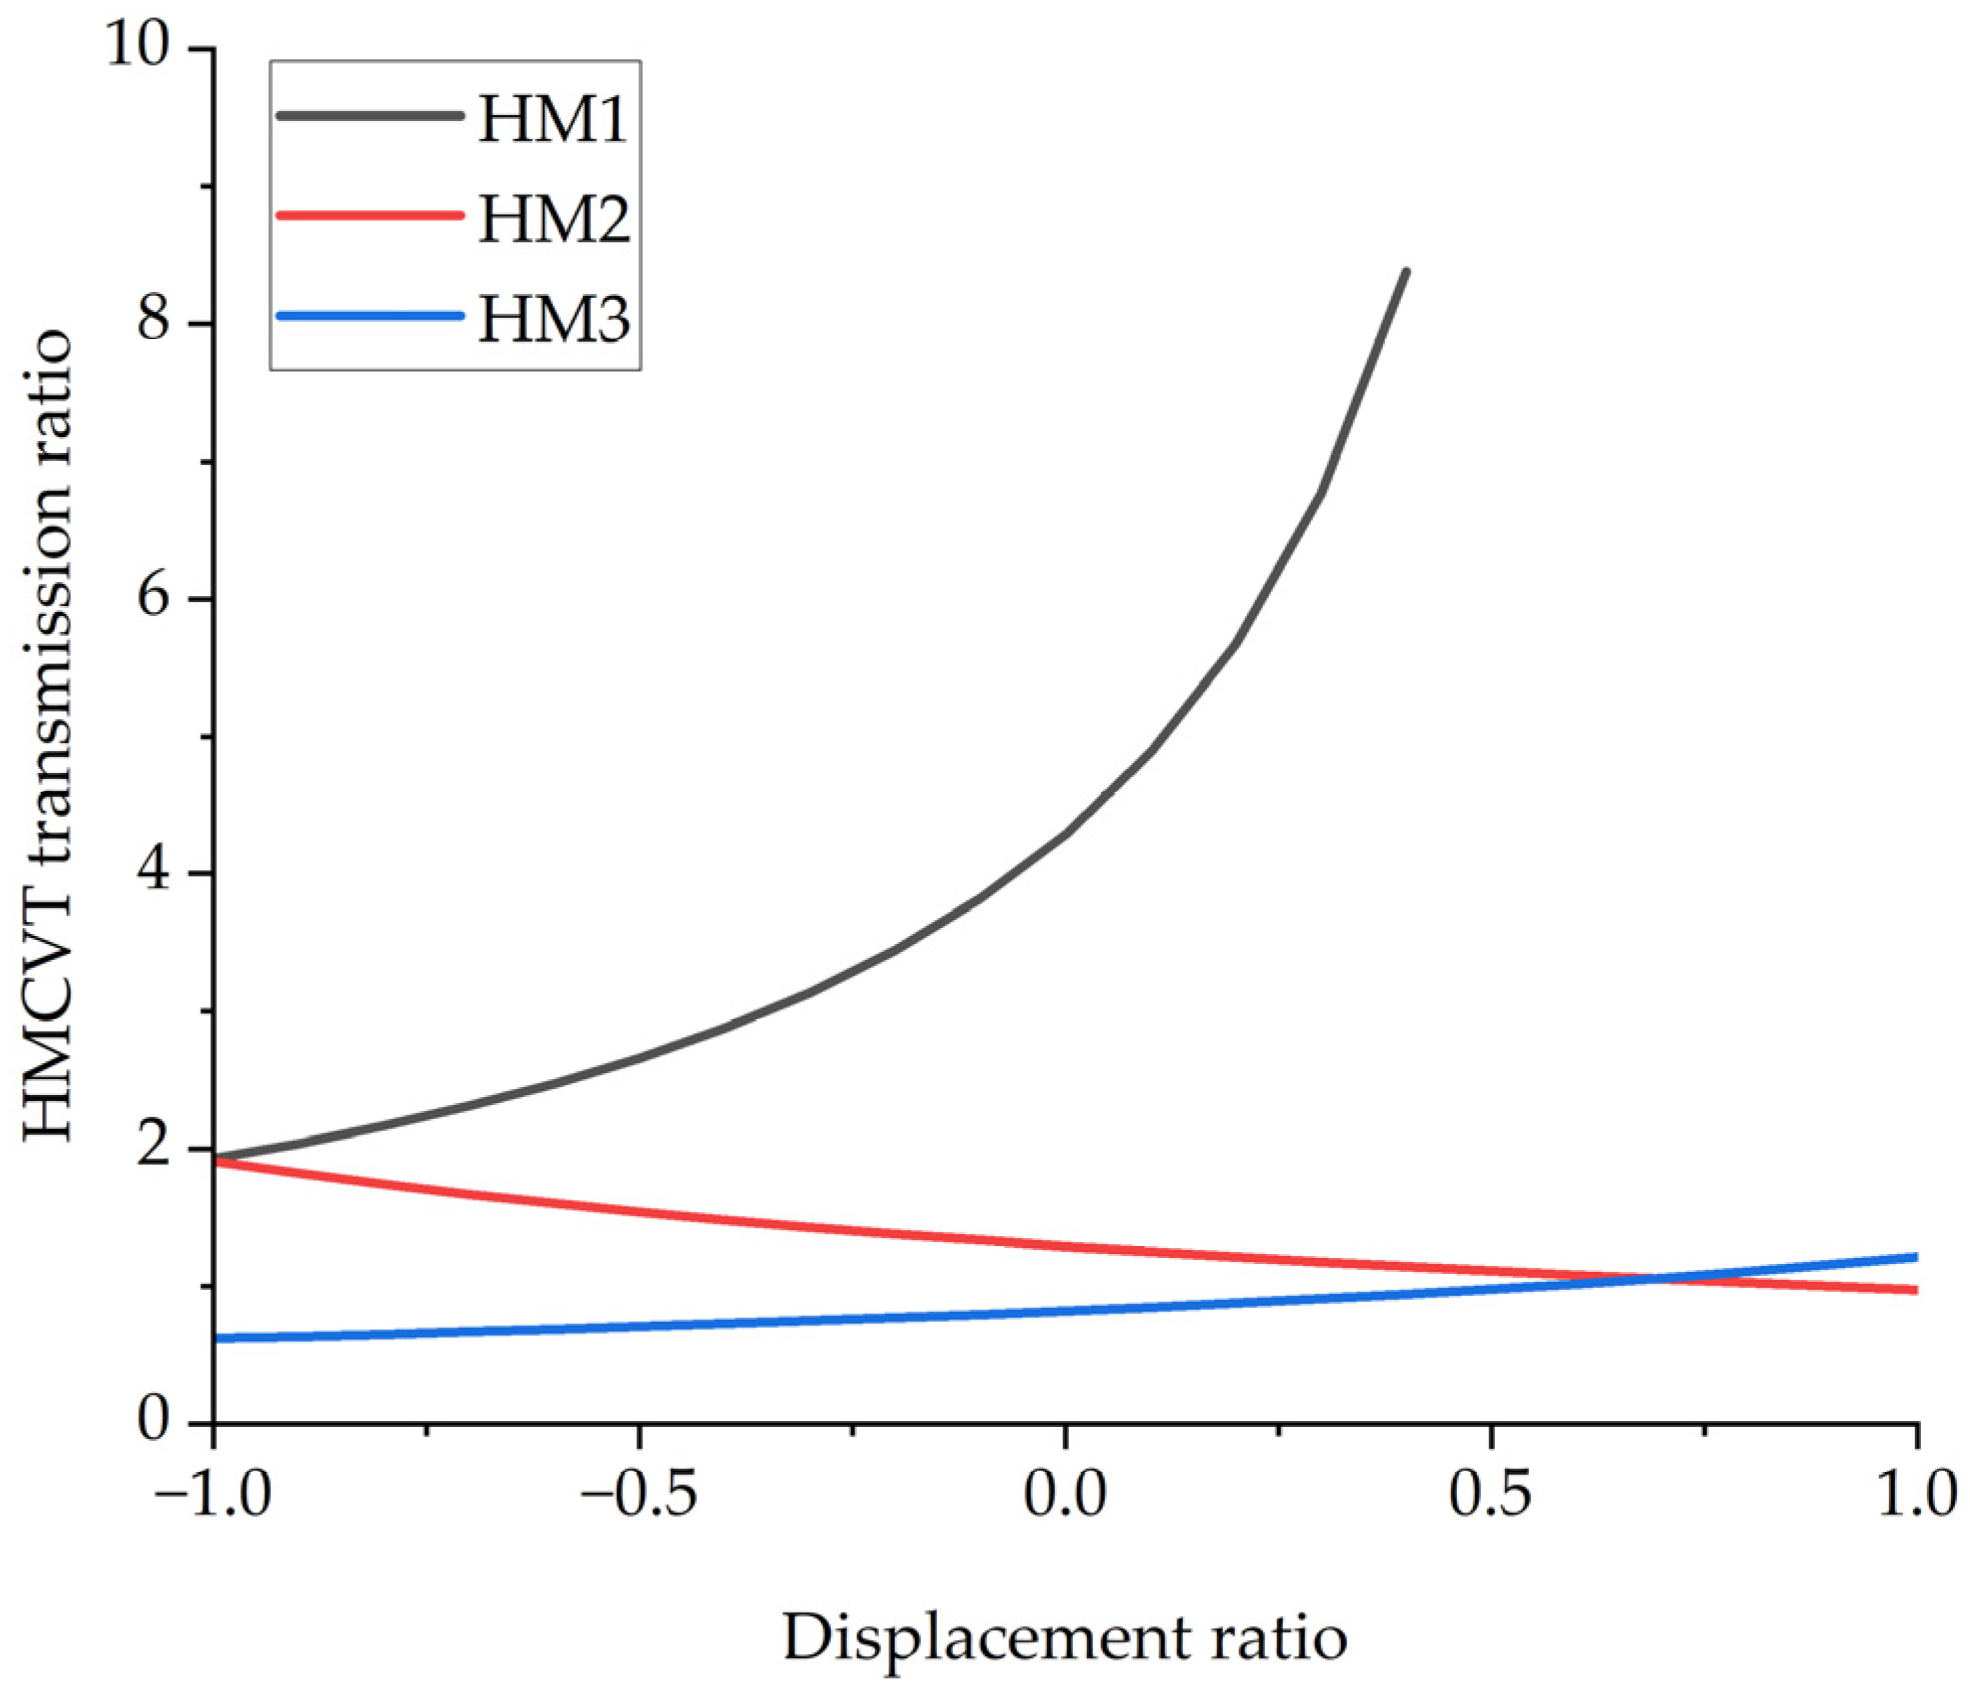
2.1. Three-Stage HMCVT Transmission Principle

This paper was based on a three-stage HMCVT composed of a constant motor, a variable pump, planetary gears, wet clutches, and fixed shaft gears. The three-stage HMCVT had three hydraulic mechanical working stages, namely, HM1, HM2, and HM3, and the transmission ratios of two adjacent stages were mutually contained, which enabled the HMCVT to shift at the same transmission ratio. The stepless changing in the working stages was completed by adjusting the displacement of the variable pump. The stage switching was realized by controlling the state of the wet clutches. By controlling the displacement ratio and wet clutches, HMCVT could achieve the desired transmission capability. The three-stage HMCVT transmission diagram is shown in Figure 1.
In Figure 1, i1~i8 shows the transmission ratios of the gear pairs; P1, P2, and P3 are planetary gears; C1, C2, and C3 are shift clutches; CV and CR are forward and backward clutches, respectively, which can make the tractor move forward and backward. The forward and backward clutches have the same three stages but opposite directions of rotation. The design parameters of the transmission system are shown in Table 1.
The transmission route of power in each stage is:
  • HM1: C1 is engaged, C2 and C3 are separated, and P1, P2, and P3 work simultaneously. The power is output from the gear ring of P3 to C1 and then through the clutch shaft to the output shaft.
  • HM2: C2 is engaged, C1 and C3 are separated, P1 and P2 work at the same time, and P3 does not work. The power is output from the sun gear of P2 to C2 and then through the clutch shaft to the output shaft.
  • HM3: C3 is engaged, C1 and C2 are separated, P1 works, P2 and P3 do not work, and the power is output from the P1 planet carrier to the C3 and then through the clutch shaft to the output shaft.
The state of the wet clutch in different stages is shown in Table 2.

2.2. Wet Clutch Engagement Characteristics Test Bench

In order to obtain the engagement characteristics of the wet clutch, we built the HMCVT shift clutch test bench as shown in Figure 2.
The test bench was driven by a WNM YXVE315L2–4 variable frequency motor; the rated torque was 1286 Nm, the speed range was 0–1450 r/min, the frequency adjustment range was 0–50 Hz, and the output power of the motor was adjusted by a Delixi frequency converter. The speed and torque sensor was a Jiangsu Lanmec ZJ-2000A, the rated torque was 2000 Nm, the speed range was 0–3000 r/min, and the accuracy was ±0.2% F.S. The equivalent moment of inertia at the output was 1.96 kgm2. The loading device used an eddy current brake of Jiangsu Lanmec (Jiangsu Lanmec Electromechanical Technology Co., Ltd., Hai’an, China), model CWC2000, with a rated absorption power of 350 kW, and an integrated speed sensor and torque sensor. The wet clutch oil pressure sensor was JPL131, the rated range was 0–10 MPa, and the accuracy was ±0.2% F.S. Data acquisition used an NI usb-6353 data acquisition card, and LABVIEW software was used to write the program; the sampling frequency was 200 Hz, and the timing accuracy was 50 ppm of the sample rate.
The working principle of the wet clutch and its hydraulic control device in the test bench is shown in Figure 3.
The oil is pumped out of the tank by the hydraulic pump and enters the relief valve (setting the system oil pressure) and the one-way throttle valve (setting the wet clutch working flow), and then enters the solenoid valve and waits. After the controller issues the engagement command, the solenoid valve inlet is opened, and the oil pushes the clutch piston to overcome the return spring resistance, the piston seal ring resistance, and the hydraulic centrifugal force. When the piston reaches the maximum stroke, the engagement is completed. After the controller issues the separation command, the solenoid valve return port opens, and the oil in the wet clutch cylinder and the pipeline flows back to the tank. The piston force balance equation in the engagement process of a wet clutch is:
m x ¨ p + c p x ˙ p + k p ( x p + x p 0 ) = P c l A c l F s e a l + F w F c l
in Formula (1), F s e a l = 2 μ s b P c l ( R 1 + R 2 ) , F w = π ρ 4 ω 2 ( R 1 2 R 2 2 ) 2 , F c l = 3 ( r 1 3 r 2 3 ) T c l 2 ( r 1 2 r 2 2 ) z μ f , where m is piston mass, kg; cp is the viscous resistance coefficient, Ns/m; kp is the return spring stiffness, N/m; xp is the piston displacement, m; xp0 is the initial compression of return spring, m; Pcl is the oil pressure of clutch cylinder, Pa; Acl is the clutch piston area, m2; Fseal is the piston seal ring resistance, N; Fw is the hydraulic centrifugal force, N; Fcl is the positive force on friction pair, N; μs is the friction coefficient of the sealing ring; b is the width of the sealing ring, m; R1 is the piston outer radius, m; R2 is the piston inner radius, m; ρ is oil density, kg / m3; ω is clutch rotation angular velocity, rad/s; r1 is the friction plate outer radius; r2 is the friction plate inner radius; Tcl is the clutch torque, Nm; z is the number of friction pairs; μf is the friction coefficient of the friction plate.
Ignoring the leakage of the clutch piston seal ring and the rotary tube joint, the flow continuity equation entering the clutch is:
Q c l A c l x ˙ p = A c l x p + V c 0 E P ˙ c l
where Qcl is the clutch working flow, m3/s; E is the equivalent bulk modulus, Pa; Vc0 is the initial volume of the clutch cylinder, m3.
The main parameters of the wet clutch are shown in Table 3.

2.3. Shift Quality Evaluation Index

The shift impact is defined as the change rate of the longitudinal acceleration of the tractor, which is used to evaluate the smoothness of the stage change. The smaller the impact is, the better the smoothness of the stage change; conversely, the larger the impact, the worse the stage change. The sliding friction work is defined as the friction work of the wet clutch during the sliding friction time, which is used to evaluate the friction heat during shifting. If the sliding friction work is large, it will affect the efficiency and service life of the wet clutch. Therefore, we use shift impact and sliding friction work as indicators to evaluate the quality of the shift. The shift impact expression is:
j = d 2 v d t 2 = r w i w i 0 I o d T o d t
where j is the shift impact, m/s3; v is the tractor speed, m/s; Io is the equivalent rotational inertia of the output shaft, kgm2; rw is the radius of the driving wheel, m; iw is the reduction ratio of the wheel-side reducer; i0 is the main reducer reduction ratio; To is the output shaft torque, Nm; t is the time, s.
The sliding friction work expression is:
W = t 0 t f T c l ( ω i ω d ) d t
where W is the sliding friction work, J; t0 is the start time of sliding, s; tf is the end time of sliding, s; ωi is the angular velocity of the clutch active end, rad/s; ωd is the angular velocity of the clutch-driven end, rad/s.

2.4. HMCVT Shift Quality Simulation Model Based on Simulation X

Simulation X is a mature multidisciplinary co-simulation software which is developed and operated by ITI company in German. Its modular modeling method has universal applicability and is suitable for HMCVT development research [27,28]. In this paper, a three-stage HMCVT simulation model for shift quality under forward conditions was established by using the built-in model of Simulation X (version 3.8), including the planetary gear, fixed shaft gear, wet clutch, hydraulic pipeline, variable pump, constant motor, speed and torque sensor, rotational inertia, and controller, as shown in Figure 4.
In the model, we used the pump controller to control the variable pump swash plate angle, the curve function to control the oil pressure of wet clutches, and the speed and torque sensor to measure the output shaft speed and torque. The dynamic equation of the HMCVT input shaft in the model is:
( I e + I p i 1 2 + I r 1 + I c 2 ) ω ˙ e = T e T p i 1 T r 1 T c 2 ( B e + B p i 1 2 + B c 2 ) ω e
where Ie is the equivalent rotational inertia of the input shaft, kgm2; Ip is the equivalent rotational inertia of the variable pump shaft, kgm2; Ir1 is the equivalent rotational inertia of the P1 gear ring, kgm2; Ic2 is the equivalent rotational inertia of the P2 planet carrier, kgm2; ωe is the input angular velocity, rad/s; Te is the output shaft torque, Nm; Tp is the torque of the variable pump; Tr1 is the torque of the P1 gear ring, Nm; Tc2 is the torque of the P2 planet carrier, Nm; Be is the equivalent rotational damping of the input shaft, Nms/rad; Bp is the equivalent rotational damping of the variable pump shaft, Nms/rad; Bc2 is the equivalent rotational damping of the P3 planet carrier, Nms/rad.
The dynamic equation of P1 sun gear is:
( I s 1 + i 2 2 I m ) ω ˙ s 1 = i 2 T m T s 1 ( B s 1 + i 2 2 B m ) ω s 1
where Is1 is the equivalent rotational inertia of the P1 sun gear, kgm2; Im is the equivalent rotational inertia of the constant motor shaft, kgm2; ωs1 is the angular velocity of the P1 sun gear, rad/s; Tm is the torque of the constant motor shaft, Nm; Ts1 is the torque of the P1 sun gear, Nm; Bs1 is the equivalent rotational damping of the P1 sun gear, Nms/rad; Bm is the equivalent rotational damping of the constant motor shaft, Nms/rad.
The sun gears of P2 and P3 are connected, and the dynamic equation is:
( I s 2 + I s 3 ) ω ˙ s 2 = T s 2 + T s 3 T C 2 i 4 ( B s 2 + B s 3 ) ω s 2
where Is2 is the equivalent rotational inertia of the P2 sun gear, kgm2; Is3 is the equivalent rotational inertia of the P3 sun gear, kgm2; ωs2 is the angular velocity of the P2 sun gear, rad/s; Ts2 is the torque of the P2 sun gear, Nm; Ts3 is the torque of the P3 sun gear, Nm; TC2 is the C2 clutch torque, Nm; Bs2 is the equivalent rotational damping of the P2 sun gear, Nms/rad; Bs3 is the equivalent rotational damping of the P3 sun gear, Nms/rad.
The P1 planet carrier, P2 ring gear, and P3 planet carrier are connected, and the dynamic equation is:
( I c 1 + I r 2 + I c 3 ) ω ˙ c 1 = T c 1 + T r 2 + T c 3 T C 3 i 5 ( B c 1 + B r 2 + B c 3 ) ω c 1
where Ic1 is the equivalent rotational inertia of the P1 planet carrier, kgm2; Ir2 is the equivalent rotational inertia of the P2 gear ring, kgm2; Ic3 is the equivalent rotational inertia of the P3 planet carrier, kgm2; ωc1 is the angular velocity of the P1 planet carrier, rad/s; Tc1 is the torque of the P1 planet carrier, Nm; Tr2 is the torque of the P2 ring gear, Nm; Tc3 is the torque of the P3 planet carrier, Nm; TC3 is the torque of the C3 clutch, Nm; Bc1 is the equivalent rotational damping of the P1 planet carrier, Nms/rad; Br2 is the equivalent rotational damping of the P2 ring gear, Nms/rad; Bc3 is the equivalent rotational damping of the P3 planet carrier, Nms/rad.
The dynamic equation of the HMCVT output shaft is:
I o ω ˙ o = ( T C 1 + T C 2 + T C 3 ) i 6 i 7 T o B o ω o
where Io is the equivalent rotational inertia of the output shaft, kgm2; ωo is the output angular velocity, rad/s; TC1 is the torque of the C1 clutch, Nm; TC2 is the torque of the C2 clutch, Nm; TC3 is the torque of the C3 clutch, Nm; To is the torque of the output shaft, Nm; Bo is the equivalent rotational damping of the output shaft, Nms/rad.
The dynamic equation of the planetary gear mechanism is:
{ T s x : T r x : T c x = 1 : k x : ( 1 + k x ) ω s x + k x ω r x ( 1 + k x ) ω c x = 0
where Tsx, Trx, and Tcx are the torque of the sun gear, ring gear, and planet carrier of the x-th planetary gear mechanism, respectively, Nm; kx is the characteristic parameter of the x-th planetary gear mechanism; ωsx, ωrx, and ωcx are the angular velocity of the sun gear, ring gear, and plant carrier of the x-th planetary gear mechanism, respectively, rad/s.
The dynamic equations of the pump shaft and motor shaft are:
{ I p ω ˙ p = T p B p ω p D p Δ P ε I m ω ˙ m = D m Δ P T m B m ω m
where ωp is the variable pump shaft angular velocity, rad/s; Dp is the variable pump displacement, m3; ΔP is the pressure difference between the high-pressure and low-pressure sides of the hydraulic circuit, Pa; ε is the displacement ratio of the variable pump to the constant motor; Dm is the constant motor displacement, m3; ωm is the constant motor shaft angular velocity, rad/s;
The simulated oil pressure and torque relationship of Simulation X’s built-in wet clutch model is:
T c l = n c l P c l
n c l = π ( R 1 2 R 2 2 ) ( r 1 r 2 ) 2 μ f z
where ncl = 1306 m3.
HMCVT adopted the strategy of an equal transmission ratio; that is, when the displacement ratio was adjusted to make the current stage transmission ratio equal to the target stage, the wet clutch was controlled to switch to the target stage. The relationship between the HMCVT transmission ratio and displacement ratio is shown in Figure 5.
In Figure 5, the displacement ratio is −1 when the transmission ratio of HM1 and HM2 are equal, and the displacement ratio is 0.6884 when the transmission ratio of HM2 and HM3 are equal.

3. Results and Discussion

3.1. Oil Pressure Variation Characteristics of Wet Clutch

The engagement process of a wet clutch is divided into three stages [29]: the prefilling phase, the compressing phase, and the engagement phase. In the prefilling phase, the hydraulic oil quickly enters the wet clutch cylinder; however, the oil pressure is less than the return spring preload force, and the piston does not move. The oil pressure exceeds the preload force in the compressing phase, and the piston moves to eliminate the clearance of the friction pair, reaching the kisspoint (the position at which the clutch friction plate is almost in contact with the steel plate). In the engagement phase, the piston compacts the friction plate and steel after crossing the kisspoint; then, the wet clutch cylinder oil pressure quickly increases to the system oil pressure.
From Formulas (1) and (2), the working flow of the wet clutch and the oil pressure of the control system are the two main factors affecting the oil pressure variation characteristics. Therefore, we designed a two-factor experiment to test the oil pressure variation characteristics of the wet clutch. According to the design parameters of the clutch (the maximum continuous bearing capacity of the friction plate was 2.75 MPa) and the performance limit of the test bench (the maximum stable working flow was 12 L/min), the working flow level range of the test was 2, 4, 6, …, 12 L/min, a total of six levels. The system oil pressure level range was 1.5, 2.0, and 2.5 MPa. The test results are shown in Figure 6.
According to Figure 6, at the same working flow, the characteristics of the prefilling phase and the compressing phase remain unchanged. The system oil pressure only affects the maximum oil pressure in the engagement phase and has little effect on the oil pressure growth time (only at 4, 6, and 12 L/min; 2.5 MPa is reduced by 0.1 s compared with 1.5 MPa). At the same system oil pressure, the larger working flow can significantly shorten the oil pressure growth time (the growth time is 2.8 s in 2 L/min, which is 0.9 s in 12 L/min). Otherwise, the oil pressure distinguishing the prefilling phase and the compressing phase is 0.73 MPa, and 0.88 MPa distinguishes the compressing phase and the engagement phase. Moreover, the two pressures are not affected by the working flow and the system oil pressure.

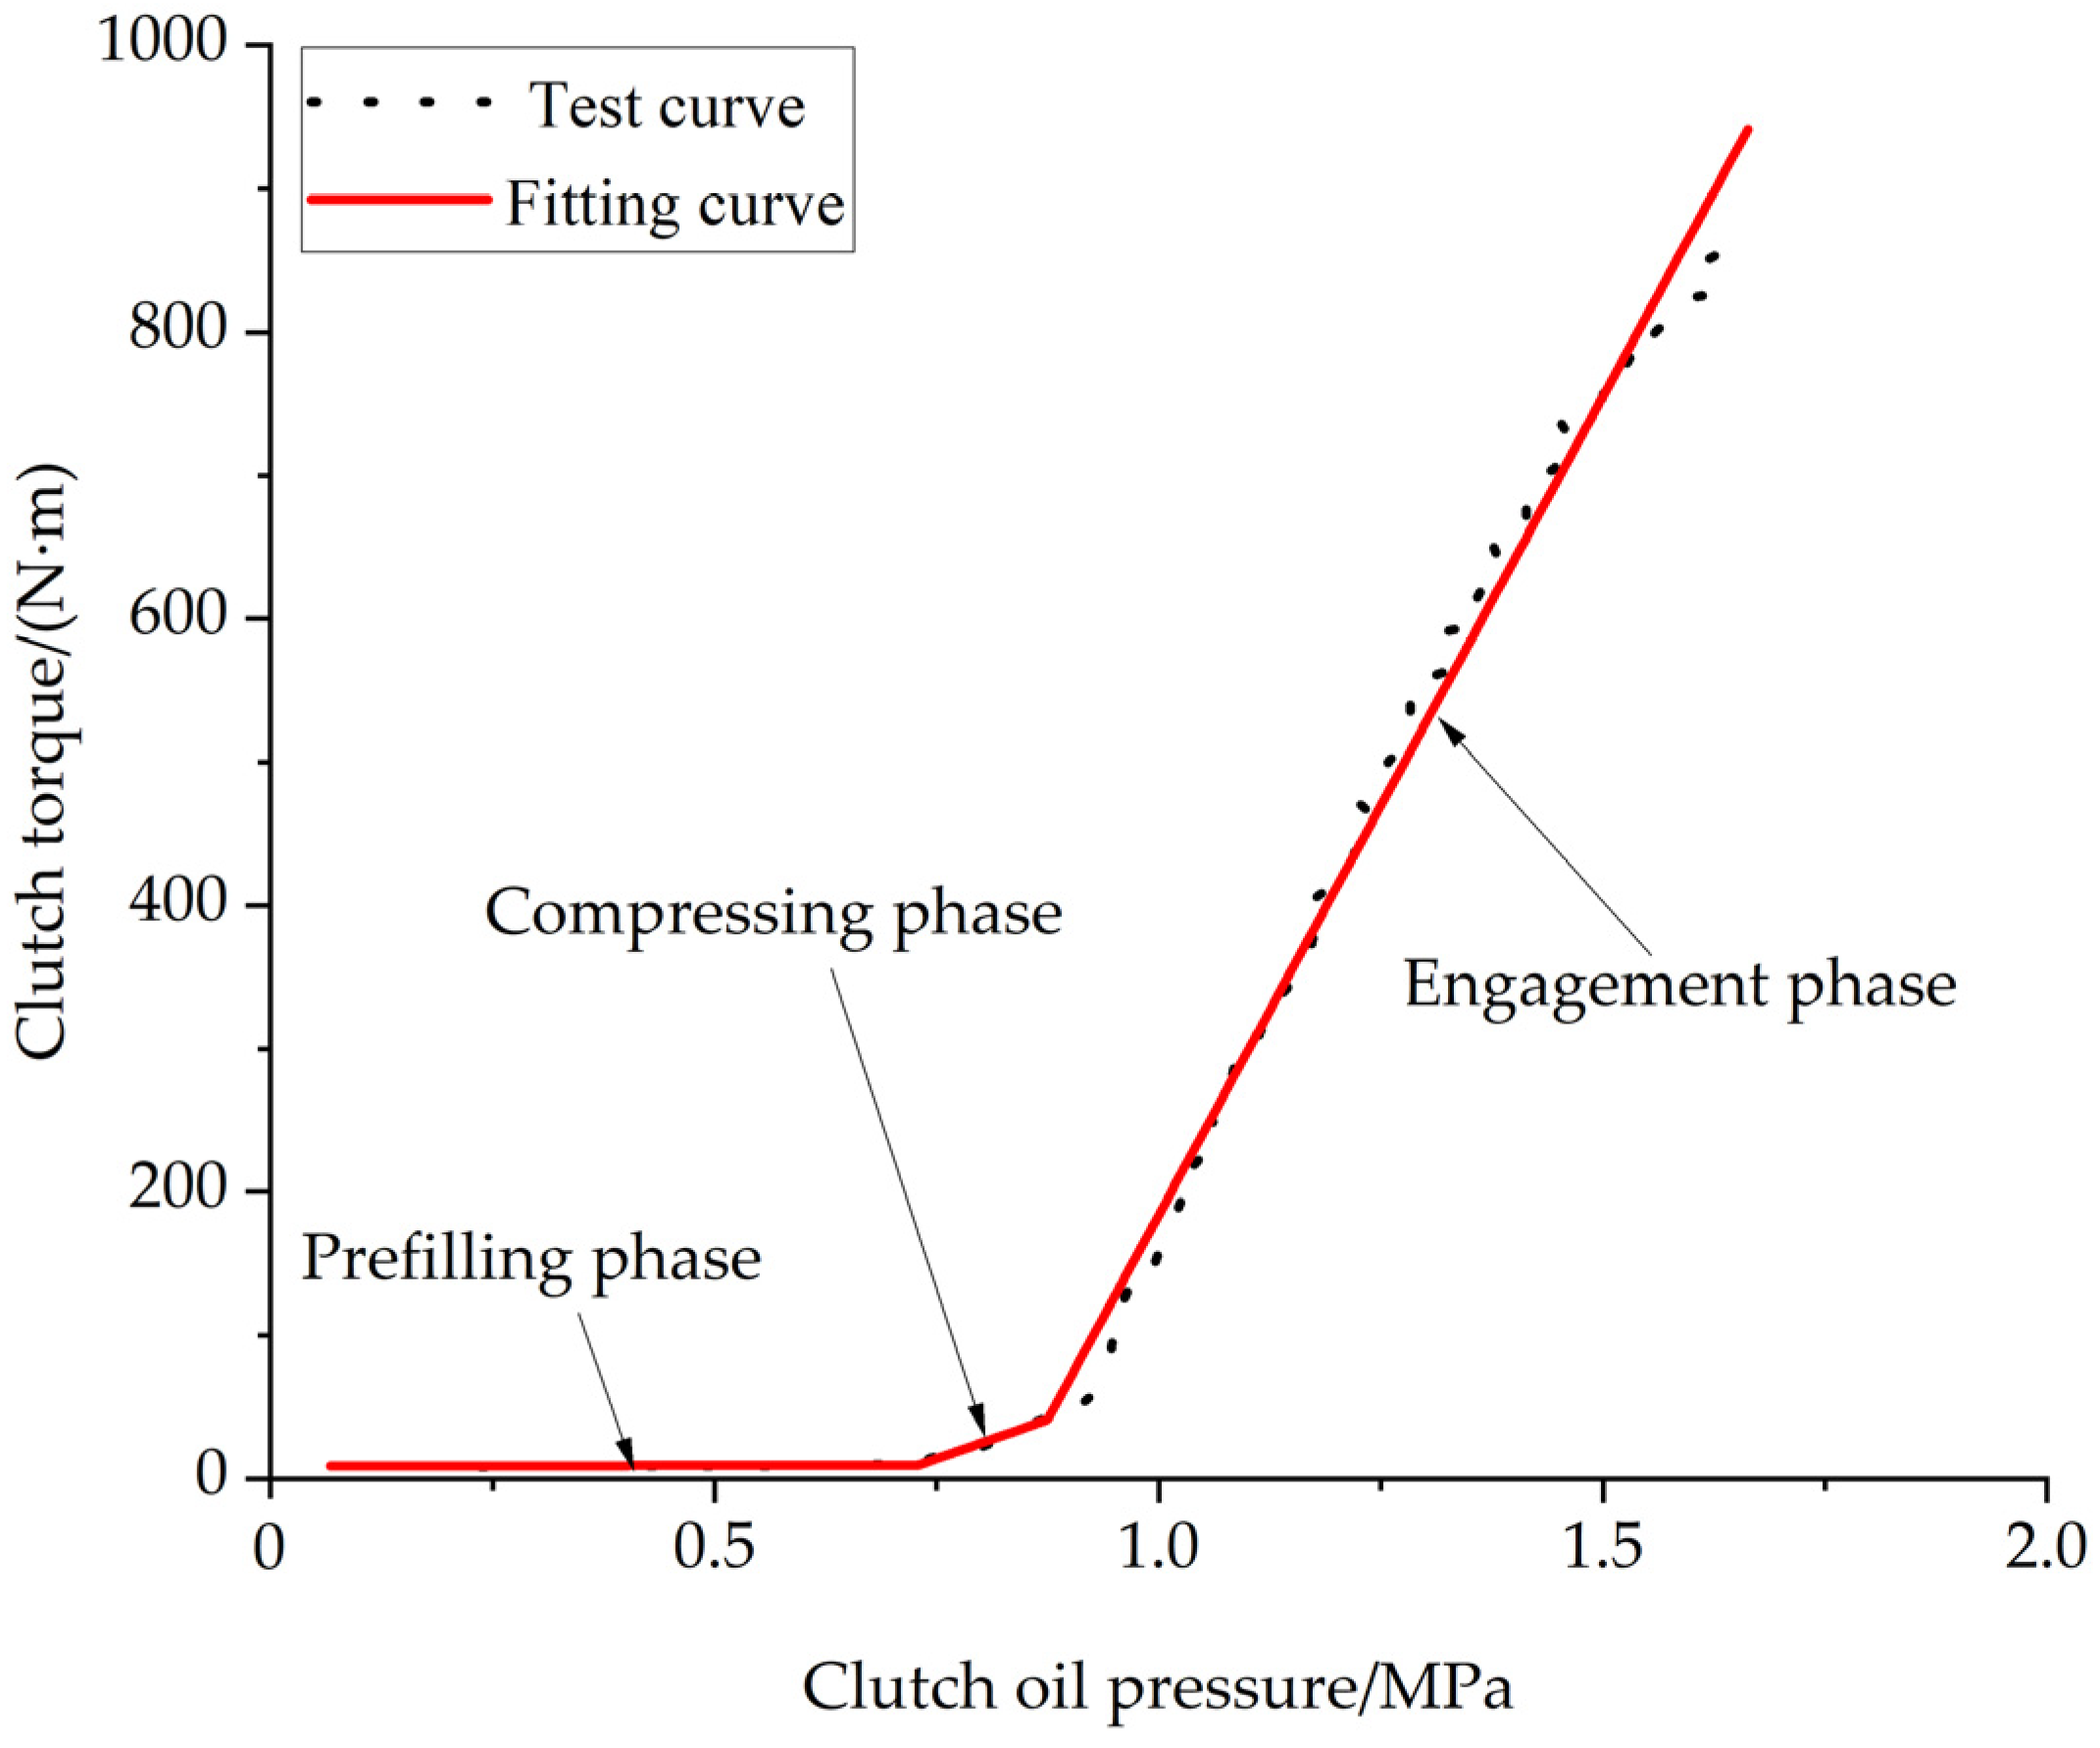
3.2. Dynamic Torque Characteristics of Wet Clutch

The wet clutch transmits the torque in different ways at different phases. Zhou et al. [30] showed that the wet clutch had a drag torque in the prefilling phase. Reference [14] showed that there was a viscous torque in the compressing phase. The drag torque and viscous torque can provide the wet clutch with the ability to transmit torque before engagement, which are very important torque characteristics of the wet clutch. In the engagement phase, the friction torque is the main way for the wet clutch to transfer torque, which can be calculated by Formula (13). However, the calculation of drag torque and viscous torque is complex and the accuracy is difficult to guarantee [23,30]. Therefore, the dynamic torque characteristics of the wet clutch are obtained by experiments.
In the test, the wet clutch was completely separated, and then the motor was set to a constant torque state with a speed of 1000 r/min. To protect the wet clutch, we controlled the eddy current dynamometer to provide a maximum load of 900 Nm. Finally, the clutch was controlled to slowly engage, and the pressure of the clutch cylinder and the torque at the input shaft were recorded. The measurement results are shown in Figure 7.
The measured data in Figure 7 show that the dynamic torque characteristics of the wet clutch have obvious three-phase characteristics, which echo the oil pressure variation characteristics in Section 3.1. Therefore, 0.73 MPa and 0.88 MPa are used as piecewise points to fit the dynamic torque. The relationship between oil pressure and drag torque in the prefilling phase is fitted as:
y 1 = a 1 + b 1 x   ,   0 x < x 1
The relationship between oil pressure and viscous torque in the compressing phase is fitted as:
y 2 = y 1 + b 2 ( x x 1 )   ,   x 1 x < x 2
The relationship between oil pressure and friction torque in the engagement phase is fitted as:
y 3 = y 2 + b 3 ( x x 2 )   ,   x 2 x
where y1, y2, and y3 are the measured torque of the wet clutch in the prefilling phase, compressing phase, and engagement phase, respectively, Nm; a1, b1, b2, and b3 are constants; x is the measured pressure of the wet clutch cylinder, Mpa; x1 is 0.73 MPa; x2 is 0.88 MPa. The R2 of the piecewise function fitting is 0.9965. The parameter values in Formulas (14)–(16) are shown in Table 4.

3.3. Simulation Analysis of Shift Quality Based on Engagement Characteristics

To make the engagement characteristics of the wet clutch in Simulation X consistent with the test, we regulated the input oil pressure of the model. The relationship between the adjusted input oil pressure of the model and the measured is:
P c l = { a 1 + b 1 n c l x ,   0 x < x 1 y 1 + b 2 ( x x 1 ) n c l   ,   x 1 x < x 2 y 2 + b 3 ( x x 2 )   n c l ,   x 2 x
At present, the expected wet clutch engagement time is 1–1.5 s. The slow engagement will aggravate the sliding and prolong the shift time, resulting in damage to the wet clutch. Engaging too fast will have a greater impact and lead to higher requirements for the hydraulic system. Therefore, we used 6, 8, and 10 L/min, three levels of working flow, and 1.5, 2.0, and 2.5 MPa, three levels of system oil pressure to carry out nine groups of full-level shift tests. Other simulation conditions were set as follows: the input shaft speed was 1000 r/min, the output shaft load was 500 Nm, and the displacement ratio was 0.6684, shifting from HM2 to HM3 at a simulation time of 3.5 s.

3.3.1. Speed and Torque of the HMCVT Output Shaft

In the nine groups of tests, the changes in the speed and torque of the HMCVT output shaft are shown in Figure 8.
According to Figure 8a, the output shaft speed decreases first and then increases. This is because, when the C2 clutch cannot transmit torque after separation, at the same time, the C3 clutch does not produce enough torque transmission capacity due to insufficient oil pressure in the prefilling and compressing phase, or even the early engagement phase. Due to the influence of the load, the output shaft speed begins to decline. As the oil pressure increases enough to enable C3 to transmit the torque exceeding the load, the output shaft speed stops decreasing. Furthermore, the C3 clutch requires additional torque to increase the output shaft speed until the level before the shift. When the speed is stable, the C3 torque is quickly reduced to the load torque, as shown in Figure 8b.
Moreover, the higher working flow and system oil pressure can shorten the recovery time of the output shaft speed; however, at the level of 10 L/min, the recovery time of 2.5 MPa is only 0.1 s shorter than that 2.0 MPa. The peak torque of the output shaft depends on the system oil pressure. The higher the system oil pressure, the larger the peak torque, which is independent of the working flow.

3.3.2. Shift Quality Analysis

The simulation results of the HMCVT shift quality in the nine groups of tests are shown in Figure 9.
According to Figure 9, with the increase in working flow and system oil pressure, the shift impact increases, and the sliding friction work decreases. This is because a larger system oil pressure can provide the clutch with the ability to transmit the load torque earlier and produce a larger peak torque with the same working flow to advance and accelerate the increase in the output shaft speed and produce a greater impact. However, the advance and accelerated increase in the output shaft speed reduces the sliding friction time of the wet clutch, thus reducing the sliding friction work. Secondly, increasing the working flow with the same system oil pressure shortens the engagement time of the clutch, accelerates the change speed of the clutch torque at the same time, and then increases the impact to a certain extent. At the same time, increasing the working flow shortens the wet clutch sliding time and reduces the sliding friction work.
In addition, the influence of system oil pressure on the shift impact is significantly greater than that of the working flow (at three working flow levels, the system oil pressure at 2.5 MPa increases by 187.8%, 218.4%, and 146.9%, respectively, compared with 1.5 MPa, with an average of 184.4%; at three system oil pressure levels, the working flow at 10 L/min increased by 25.3%, 29.1%, and 7.5%, respectively, compared with 6 L/min, with an average of 20.6%). The influence of system oil pressure on sliding friction work is slightly greater than that of working flow (at three working flow levels, the oil pressure of 2.5 MPa system is reduced by 58.8%, 63.9%, and 66.8%, respectively, compared with 1.5 MPa, with an average of 63.2%; at three system oil pressure levels, the working flow at 10 L/min is reduced by 52.3%, 62.2%, and 61.5%, respectively, compared with that at 6 L/min, with an average of 58.7%).
In sum, HCMVT should use a larger working flow to accelerate the transition and reduce the sliding friction work. In the meantime, the large system oil pressure should be avoided to prevent a bigger impact.

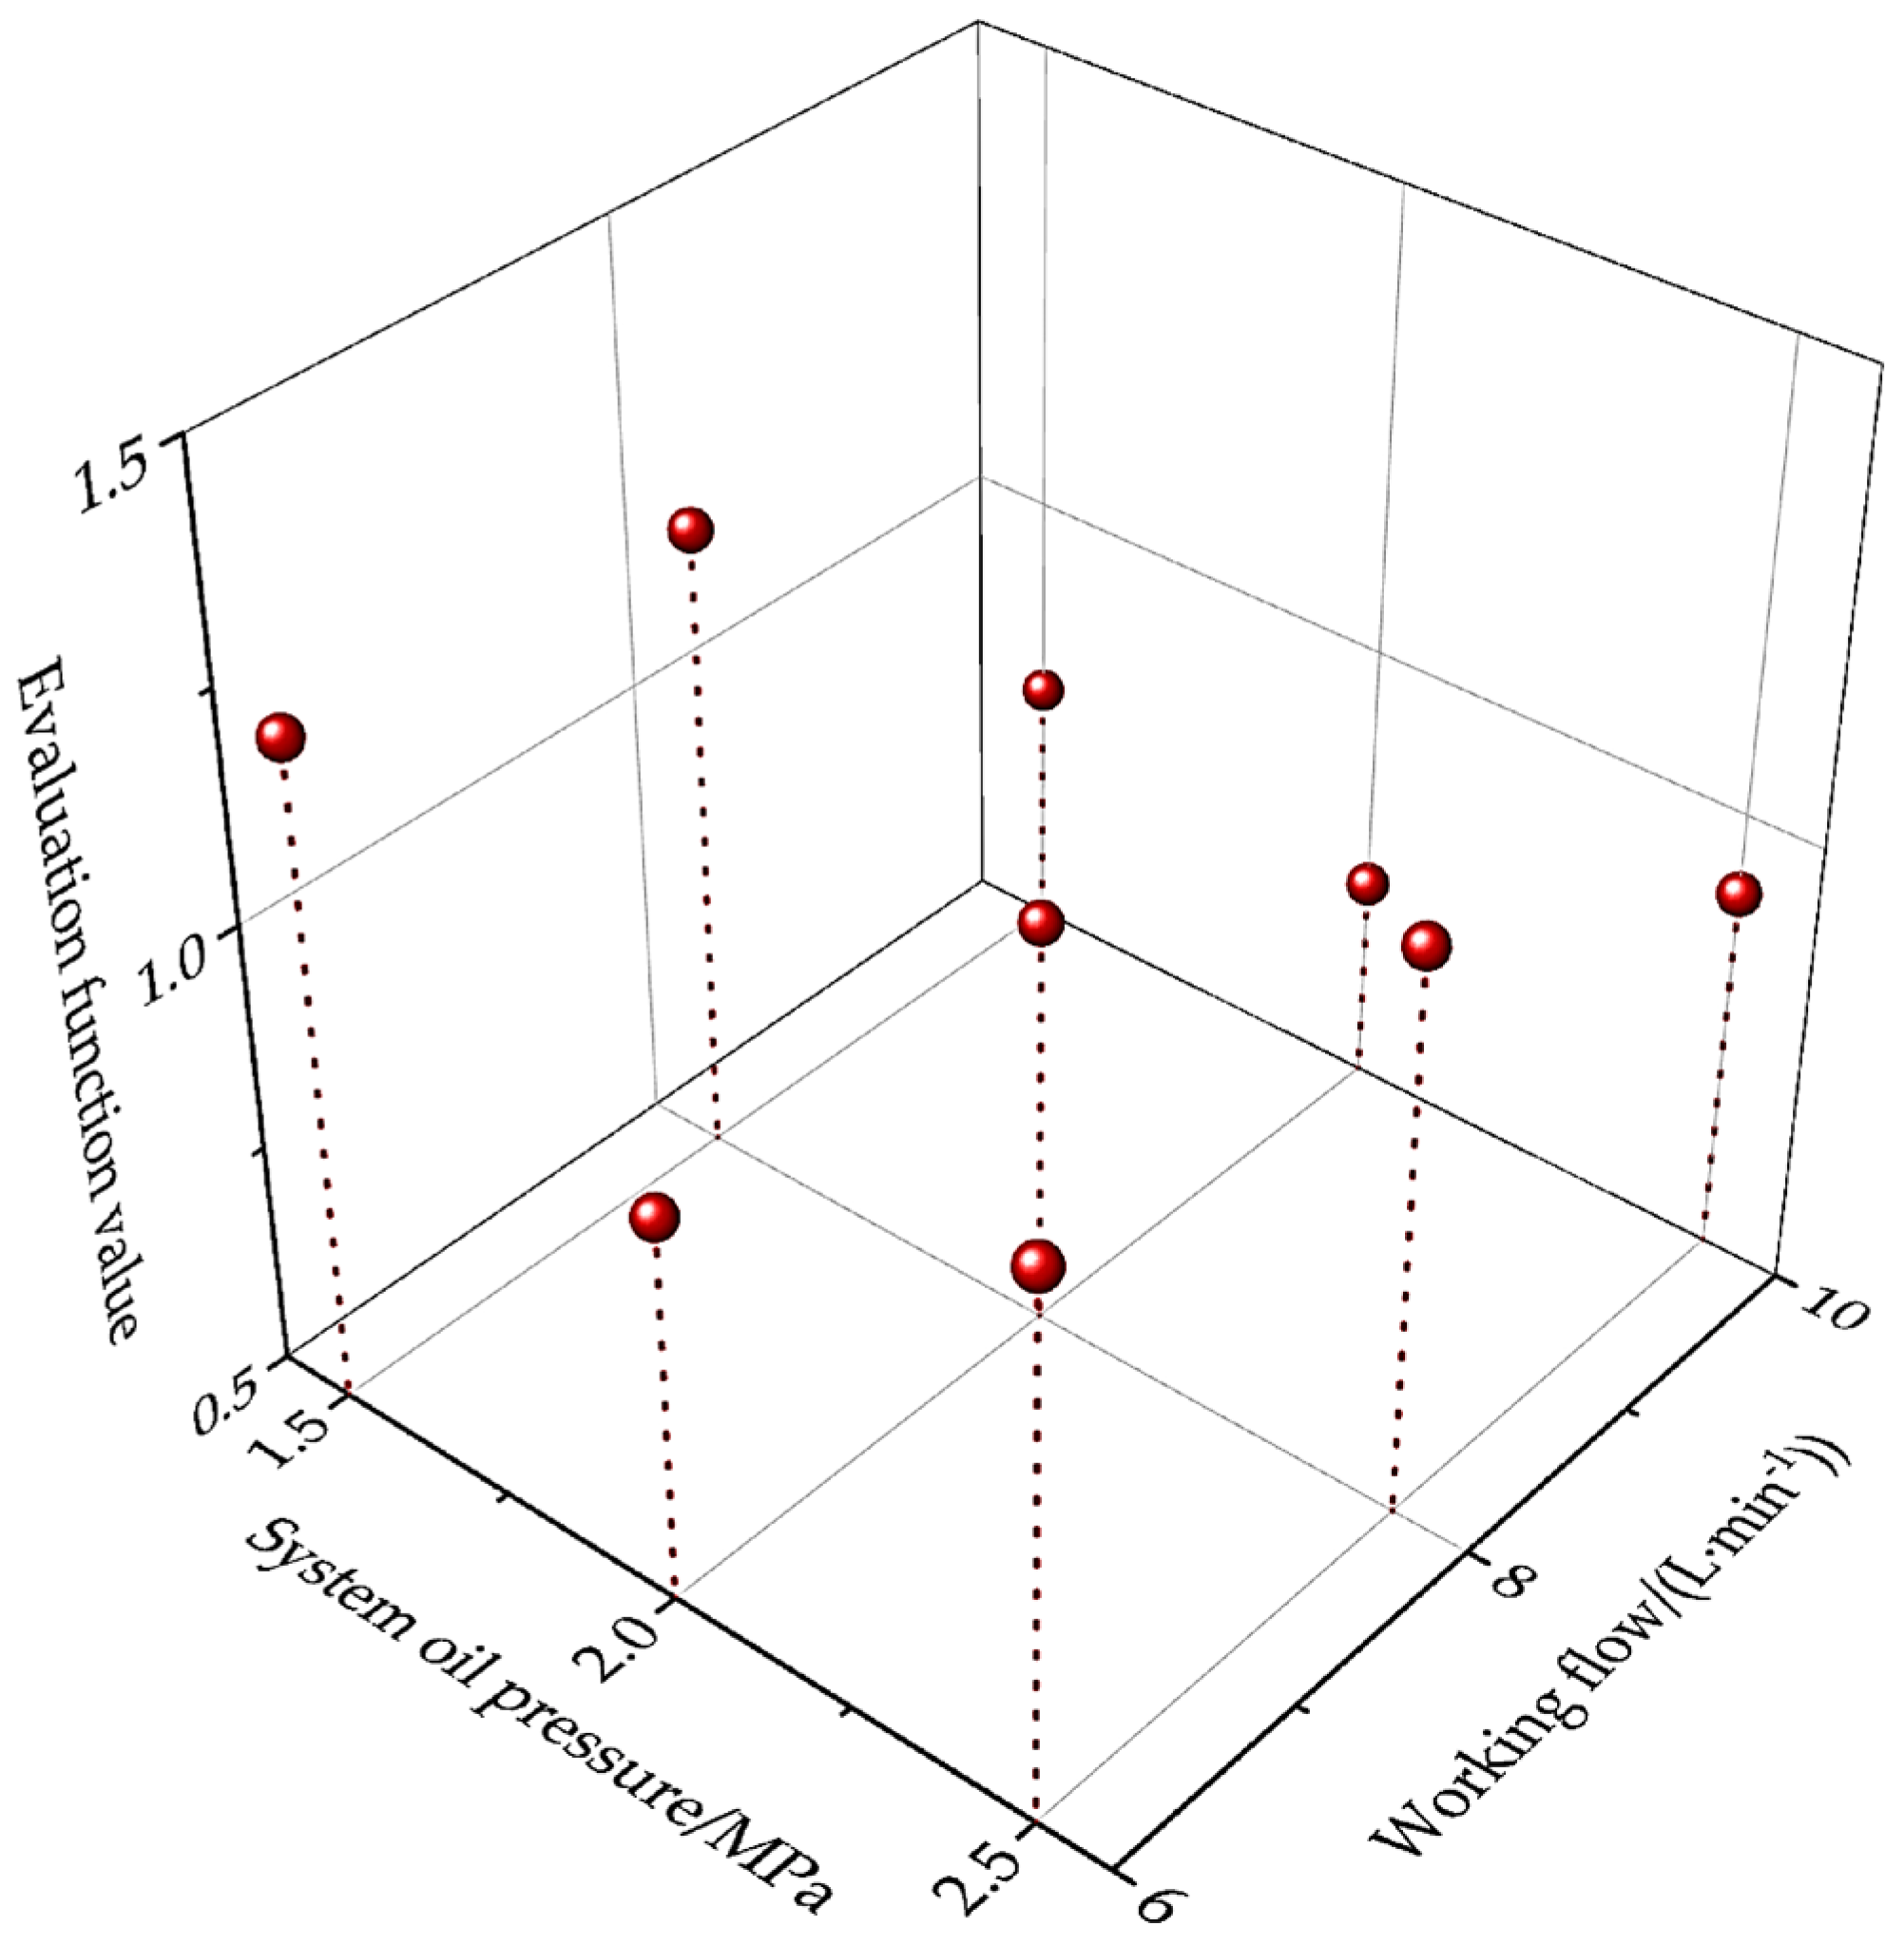
3.3.3. Optimal Combination of Working Flow and System Oil Pressure

In the shift, the smaller impact of the working flow and system oil pressure combination would produce a larger sliding friction work, and vice versa. To ensure the shift impact and sliding friction work are both relatively small, we normalized the maximum values of impact and sliding friction work in nine groups of tests (the normalization method was divided by the average value) and established the quality evaluation function of the shift. The quality evaluation function as shown:
f = λ 1 j n o r + λ 2 W n o r
where λ1 and λ2 are the weight values; both of them are 0.5; jnor is the normalized value of the maximum impact; Wnor is the normalized value of the maximum frictional work.
The smallest evaluation function value indicates the best shift quality, and the combination of the working flow and the system oil pressure corresponding to the value is the best. The evaluation function values of the nine groups of working flow and system oil pressure combination conditions are shown in Figure 10.
In Figure 10, the combination of working flow and system oil pressure that minimizes the evaluation function is (10 L/min, 2.0 MPa), and the evaluation function value is 0.73. The shift impact of this combination is 28.9 m/s3, and the sliding friction work is 10.1 kJ. Therefore, the working flow of the wet clutch during the shift in the HMCVT used in this study should be 10 L/min, and the system oil pressure should be 2.0 MPa. Moreover, the HMCVT can have a smaller impact during the shift, while the generation of sliding friction work is also limited.

4. Conclusions

We carried out 19 groups of tests on the HMCVT shift clutch test bench, including 18 groups of oil pressure variation characteristics tests (six working flow levels and three system oil pressure levels) and 1 group of dynamic torque characteristics tests. The oil pressure variation characteristics test showed that the increase in working flow can shorten the clutch oil pressure growth time, while the system oil pressure is very low at this time. According to the dynamic torque test data, the relationship between oil pressure and torque for three phases is obtained by piecewise function fitting, and the fitting R2 is 0.9965.
Moreover, a simulation model of HMCVT shifting was built based on Simulation X software. Nine groups of working flow and system oil pressure combinations with wet clutch engagement times of 1–1.5 s were selected for the shift test on the simulation model. The results showed that the output shaft speed first decreases and then increases, and the higher working flow and system oil pressure could shorten the recovery time of the output shaft speed. The system oil pressure’s effect on the shift impact was obviously greater than that of the working flow, while the influence on the sliding friction work was slightly greater than that of the working flow. The shift quality evaluation function based on the maximum shift impact value and the maximum sliding friction work value achieved a minimum value of 0.73 at (10 L/min, 2.5 MPa). Under this combination, the shift impact is 28.9 m/s3 and the sliding friction work is 10.1 kJ.
According to the research in this study, the engagement characteristics of the wet clutch need to be considered during the HMCVT shift to improve the shift quality. Particularly, research on the influence of engagement characteristics on HMCVT shift quality can provide a reference for the design and shift control of wet clutches.

Author Contributions

Conceptualization, K.L. and Z.L.; methodology, K.L.; software, K.L.; validation, K.L.; investigation, K.L. and Z.L.; resources, K.L. and Z.L.; writing—original draft preparation, K.L.; writing—review and editing, K.L. and Z.L.; visualization, K.L.; supervision, Z.L.; project administration, K.L. and Z.L. All authors have read and agreed to the published version of the manuscript.

Funding

This research was funded by the National Key Research and Development Plan (grant number: 2016YFD0701103) and the Fundamental Research Funds for the Central Universities (grant number: XUEKEN2022001).

Institutional Review Board Statement

Not applicable.

Informed Consent Statement

Not applicable.

Data Availability Statement

The data presented in this study are available on demand from the corresponding authors at (luzx@njau.edu.cn or 2019212001@stu.njau.edu.cn).

Acknowledgments

The authors thank the National Key Research and Development Plan (grant number: 2016YFD0701103) and the Fundamental Research Funds for the Central Universities (grant number: XUEKEN2022001) for funding. We also thank the anonymous reviewers for providing critical comments and suggestions that improved the manuscript.

Conflicts of Interest

The authors declare no conflict of interest.

References

  1. Linares, P.; Méndez, V.; Catalán, H. Design parameters for c ontinuously variable power-split transmissions using planetaries with 3 active shafts. J. Terramech. 2010, 47, 325–335. [Google Scholar] [CrossRef] [Green Version]
  2. Xie, B.; Wu, Z.B.; Mao, E.R. Development and prospect of key technologies on agricultural tractor. Trans. Chin. Soc. Agric. Mach. 2018, 49, 1–17. [Google Scholar]
  3. Cheng, Z.; Lu, Z.X. Research on Dynamic Load Characteristics of AdvancedVariable Speed Drive System for Agricultural Machineryduring Engagement. Agriculture 2022, 12, 161. [Google Scholar] [CrossRef]
  4. Gao, X.; Zhu, Z.; Zhu, Y. Analysis of transmission characteristics of HMCVT. J. Chongqing Jiaotong Univ. Nat. Sci. 2013, 32, 712–716. [Google Scholar]
  5. Zhong, Z.M.; Kong, G.L.; Yu, Z.P.; Kong, G.P. Review on torque interruption and its solution of automated mechanical transmission. J. Tongji Univ. Nat. Sci. 2011, 39, 1850–1855. [Google Scholar]
  6. Raikwar, S.; Tewari, V.K.; Mukhopadhyay, S.; Verma, C.R.B.; Sreenivasulu Rao, M. Simulation of components of a power shuttle transmission system for an agricultural tractor. Comput. Electron. Agric. 2015, 114, 114–124. [Google Scholar] [CrossRef]
  7. Zhao, E.H.; Ma, B.; Li, H.Y.; Du, Q.; Li, H.Z.; Ma, C.N. Influence of rotating speed on local lubrication and friction characteristics of wet clutch. Acta Armamentarii 2017, 38, 625–633. [Google Scholar]
  8. Zhao, E.H.; Ma, B.; Li, H.Y.; Du, Q.; WU, J.P.; Ma, C.N. Effect of non-uniform contact on friction characteristices of wet clutches. J. Jilin Univ. Eng. Technol. Ed. 2018, 48, 661–669. [Google Scholar]
  9. Ma, B.; Yu, L.; Chen, M.; Li, H.Y.; Zheng, L.J. Numerical and experimental studies on the thermal characteristics of the clutch hydraulic system with provision for oil flow. Ind. Lubr. Tribol. 2019, 71, 733–740. [Google Scholar] [CrossRef]
  10. Wang, Q.; Ma, B.; Yu, L.; Wang, L.Y.; Li, H.Z.; Chen, X.B. Effect of rotational speed on the friction-wear characteristics of a wet multi-disc clutch during the running-in process. Tribology 2019, in press.
  11. Ouyang, T.C.; Li, S.Y.; Huang, G.C.; Zhou, F.; Chen, N. Mathematical modeling and performance prediction of a clutch actuator for heavy-duty automatic transmission vehicles. Mech. Mach. Theory 2019, 136, 190–205. [Google Scholar] [CrossRef]
  12. Zhou, B.; Zhang, J.W.; Gao, J.; Yu, H.S.; Liu, D. Clutch pressure estimation for a power-split hybrid transmission using nonlinear robust observer. Mech. Syst. Sig. Pr. 2018, 106, 249–264. [Google Scholar] [CrossRef]
  13. Oh, J.Y.; Park, J.Y.; Cho, J.W.; Kim, J.G.; Kim, J.H.; Lee, G.H. Influence of a clutch control current profile to improve shift quality for a wheel loader automatic transmission. Int. J. Precis. Eng. Manuf. 2017, 18, 211–219. [Google Scholar] [CrossRef]
  14. Mishra, K.D.; Srinivasan, K. Robust control and estimation of clutch-to-clutch shifts. Control Eng. Pract. 2017, 65, 100–114. [Google Scholar] [CrossRef]
  15. Ni, X.D.; Zhu, S.H.; Zhang, H.J.; Chang, Y.L.; Ouyang, D.Y.; Wang, G.M. Experiment of shift quality factors for hydro-mechanical CVT. Trans. Chin. Soc. Agric. Mach. 2013, 44, 29–34. [Google Scholar]
  16. Lu, K.; Lu, Z.X.; Cheng, Z.; Zheng, S.Q. Study on Influence Rules of Clutch Parameters on HMCVT Shift Performance. Mech. Sci. Technol. Aerosp. Eng. 2019, 38, 1695–1701. [Google Scholar]
  17. Wei, C.; Ma, Z.Y.; Yin, X.F.; Zhao, J.; Li, X.Y. Research on the Influencing Factors of the Range-Shifting Impact on HMT. Trans. Beijing Inst. Technol. 2015, 35, 1122–1127. [Google Scholar]
  18. Cao, F.Y.; Feng, Q.; Yang, C.J.; Xu, L.Y. Clutch Switching Timing Optimization of Dual-Mode Hydro-mechanical Transmission Device. J. Xi’an Jiaotong Univ. 2021, 55, 86–93. [Google Scholar]
  19. Zhu, Z.; Gao, X.; Cao, L.L.; Cai, Y.M.; Pan, D.Y. Research on the shift strategy of HMCVT based on the physical parameters and shift time. Appl. Math. Model. 2016, 40, 6889–6907. [Google Scholar] [CrossRef]
  20. Zhang, Z.G.; Zhou, X.J.; Shen, L.; Li, Y.J. Simulation and Experiment on Dynamic Engagement Characteristics of Wet Clutch. Chin. J. Highw. Transp. 2010, 23, 115–120. [Google Scholar]
  21. Wang, C.; Qin, D.T.; Wu, B.Z.; Fang, H.S.; Cheng, K. Simulation and analysis of wet clutch engagement characteristics. J. Chongqing Univ. 2020, 43, 38–51. [Google Scholar]
  22. Bao, H.Y.; Huang, W.; Lu, F.X. Investigation of engagement characteristics of a multi-disc wet friction clutch. Tribol. Int. 2021, 159, 106940. [Google Scholar]
  23. Huang, W.; Bao, H.Y.; Zhu, C.; Zhu, R.P. Analysis of squeeze process and engagement characteristics of wet clutch. J. Aerosp. Power 2021, in press.
  24. Zhang, Z.; Zhu, L.C.; Zheng, X.D. Simulations versus tests for dynamic engagement characteristics of wet clutch. Cogn. Robot. 2021, 1, 125–133. [Google Scholar] [CrossRef]
  25. Lingesten, N.; Marklund, P.; Höglund, E.; Lund, M.; Lundin, J.; Mäki, R. Apparatus for continuous wear measurements during wet clutch durability tests. Wear 2012, 288, 54–61. [Google Scholar] [CrossRef]
  26. Chen, Y.; Qian, Y.; Lu, Z.X.; Zhou, S.; Xiao, M.H.; Bartos, P.; Xiong, Y.P.; Jin, G.H.; Zhang, W. Dynamic Characteristic Analysis and Clutch Engagement Test of HMCVT in the High-Power Tractor. Complexity 2021, 2021, 8891127. [Google Scholar] [CrossRef]
  27. Zhao, J.; Xiao, M.H.; Bartos, P.; Bohata, A. Dynamic engagement characteristics of wet clutch based on hydro-mechanical continuously variable transmission. J. Cent. South Univ. 2021, 28, 1377–1389. [Google Scholar] [CrossRef]
  28. Cheng, Z.; Chen, Y.T.; Li, W.J.; Liu, J.H.; Li, L.; Zhou, P.F.; Chang, W.J.; Lu, Z.X. Full Factorial Simulation Test Analysis and I-GA Based Piecewise Model Comparison for Efficiency Characteristics of Hydro Mechanical CVT. Machines 2022, 10, 358. [Google Scholar] [CrossRef]
  29. Laukenmann, M.A.; Sawodny, O. Model-based control of a clutch actuator used in hybrid dual-clutch transmissions. Mechatronics 2021, 77, 102585. [Google Scholar] [CrossRef]
  30. Zhou, X.J.; Wu, P.H.; Ynag, Z.L.; Xu, J.; Shang, X.B.; Wang, Z.S. Simulation and Experimental Study on the Drag Torque Characteristics of Wet Clutches in High Speed Condition. Automot. Eng. 2019, 41, 1056–1064. [Google Scholar]
Figure 1. The diagram of the three-stage HMCVT.
Agriculture 12 02012 g001
Figure 2. The HMCVT shift clutch test bench.
Agriculture 12 02012 g002
Figure 3. The working principle of the wet clutch and its hydraulic control device. Note: 1: active component; 2: support bearing; 3: driven member; 4: friction element; 5: solenoid valve; 6: one-way throttle valve; 7: hydraulic pump; 8: relief valve; 9: piston sealing ring; 10: piston; 11: return spring.
Agriculture 12 02012 g003
Figure 4. A three-stage HMCVT model for shift quality based on Simulation X.
Agriculture 12 02012 g004
Figure 5. The relationship between the transmission ratio and displacement ratio of three-stage HMCVT.
Agriculture 12 02012 g005
Figure 6. The oil pressure variation characteristics. (a) Data of test with 1.5–2.5 MPa, and 2, 4 L/min; (b) Data of test with 1.5–2.5 MPa, and 6, 8 L/min; (c) Data of test with 1.5–2.5 MPa, and 10, 12 L/min.
Agriculture 12 02012 g006
Figure 7. Dynamic torque characteristics of wet clutch.
Agriculture 12 02012 g007
Figure 8. Changes in HMCVT output shaft speed and torque in the nine groups of tests. (a) Changes in speed in the nine groups of tests; (b) Changes in torque in the nine groups of tests.
Agriculture 12 02012 g008
Figure 9. Simulation results of HMCVT shift quality. (a) Simulation results of shift impact; (b) Simulation results of sliding friction work.
Agriculture 12 02012 g009
Figure 10. The evaluation function values of nine groups of combinations.
Agriculture 12 02012 g010
Table 1. The design parameters of the transmission system.
Parameterk1k2k3i1i2i3i4i5i6 i7i8
Value2.722.152.720.781.451.51.70.51.21.2
k1, k2 and k3 are characteristic parameters of P1, P2, and P3, respectively.
Table 2. The state of the wet clutch at different stages.
Working StageC1C2C3
HM1+
HM2+
HM3+
+ indicates wet clutch engagement; − indicates wet clutch separation.
Table 3. Main parameters of the wet clutch.
ParametersValue
Oil density ρ/(kg/m3)860
Equivalent bulk elastic modulus E/Pa1.7 × 109
Clutch piston area Acl/mm210,293
Number of friction pairs z14
Friction plate outer radius r1/mm159
Friction plate inner radius r2/mm122.3
Piston outer radius R1/mm141.8
Piston inner radius R2/mm80.1
Return spring stiffness kp/(N/mm)573.7
Friction coefficient μf0.14
Initial volume of clutch cylinder Vc0/mm361,904
Table 4. Parameter values of the piecewise fitting function.
Parametera1/(Nm)b1/(Nm/Mpa)b2/(Nm/Mpa)b3/(Nm/Mpa)
Value8.6161.43217.271142.22
Publisher’s Note: MDPI stays neutral with regard to jurisdictional claims in published maps and institutional affiliations.

