
R&D Performance Evaluation in the Chinese Food Manufacturing Industry Based on Dynamic DEA in the COVID-19 Era
 , ,
, ,  and
and
Abstract
:1. Introduction
1.1. Evaluation of R&D Performance
1.2. Dynamic DEA
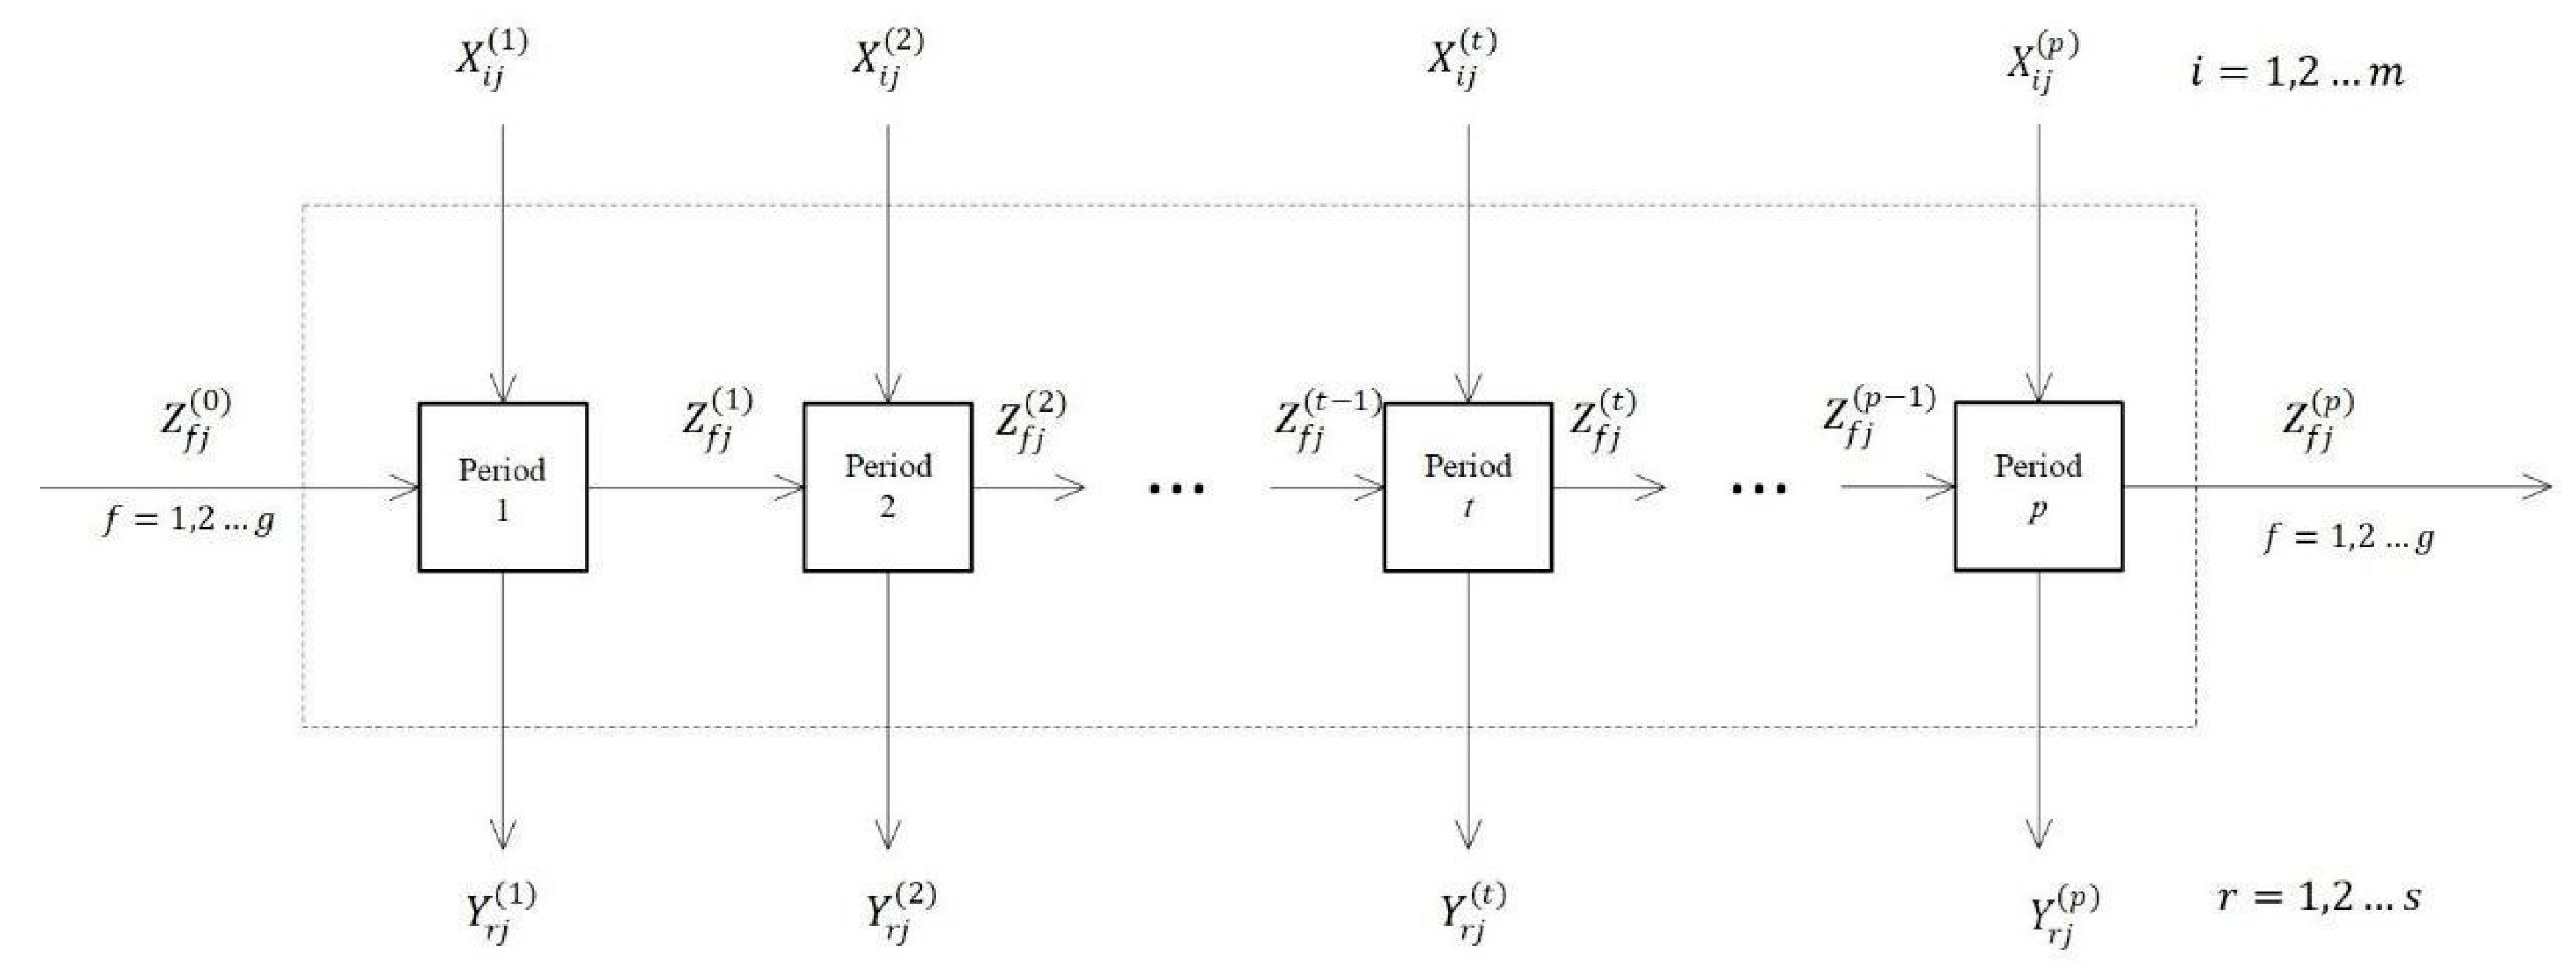
2. Methodology
2.1. Model Specification
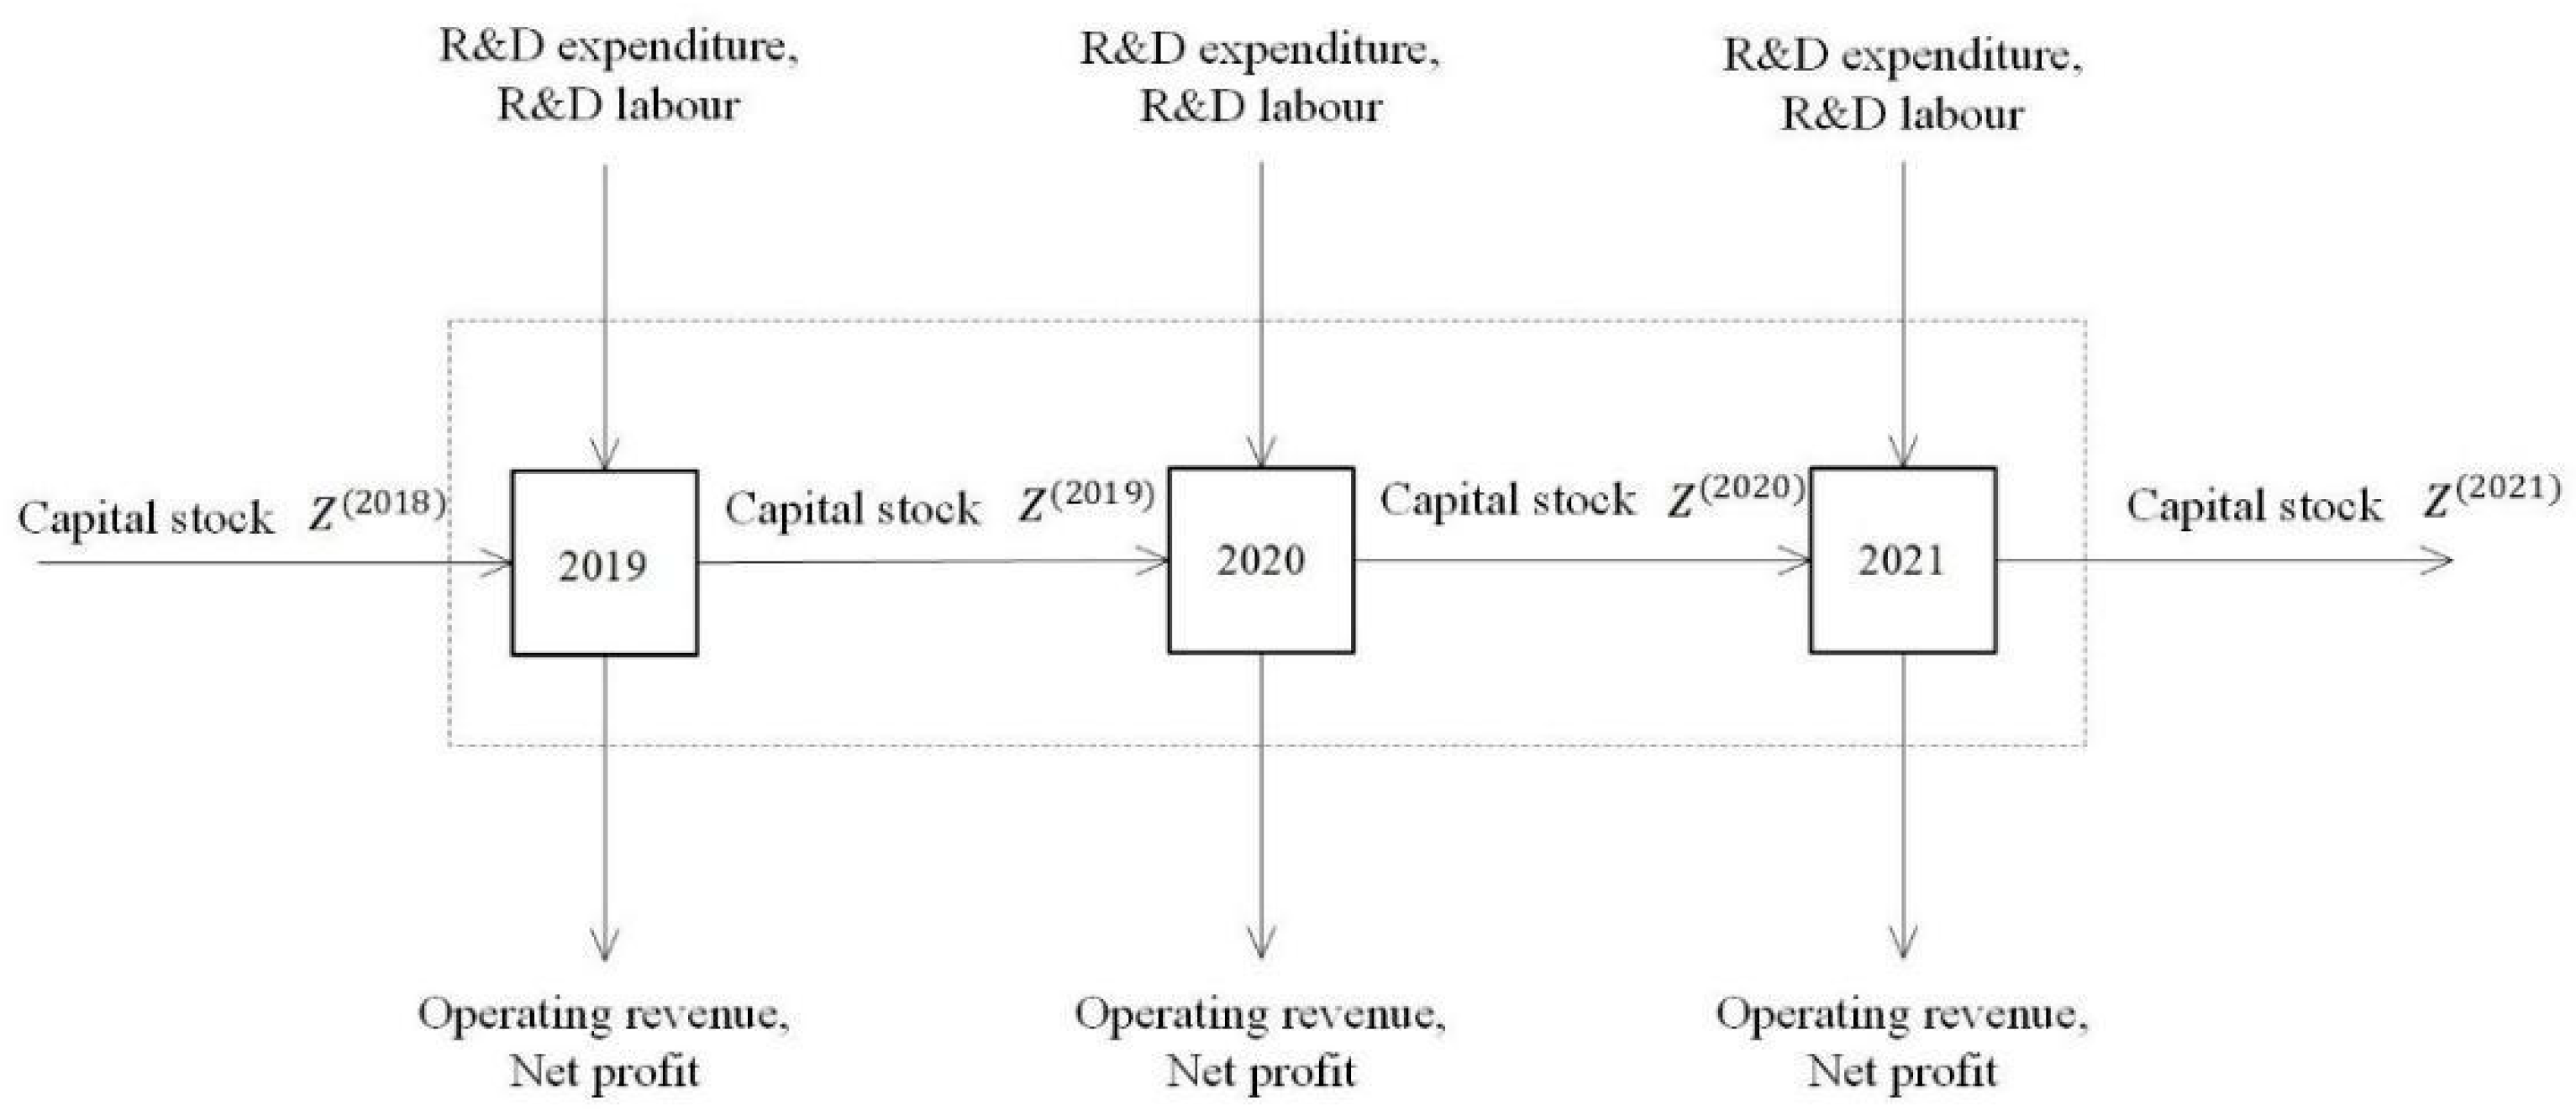
2.2. Selection of Operational Factors
2.3. Data Collection
2.4. Results Analysis
3. Findings
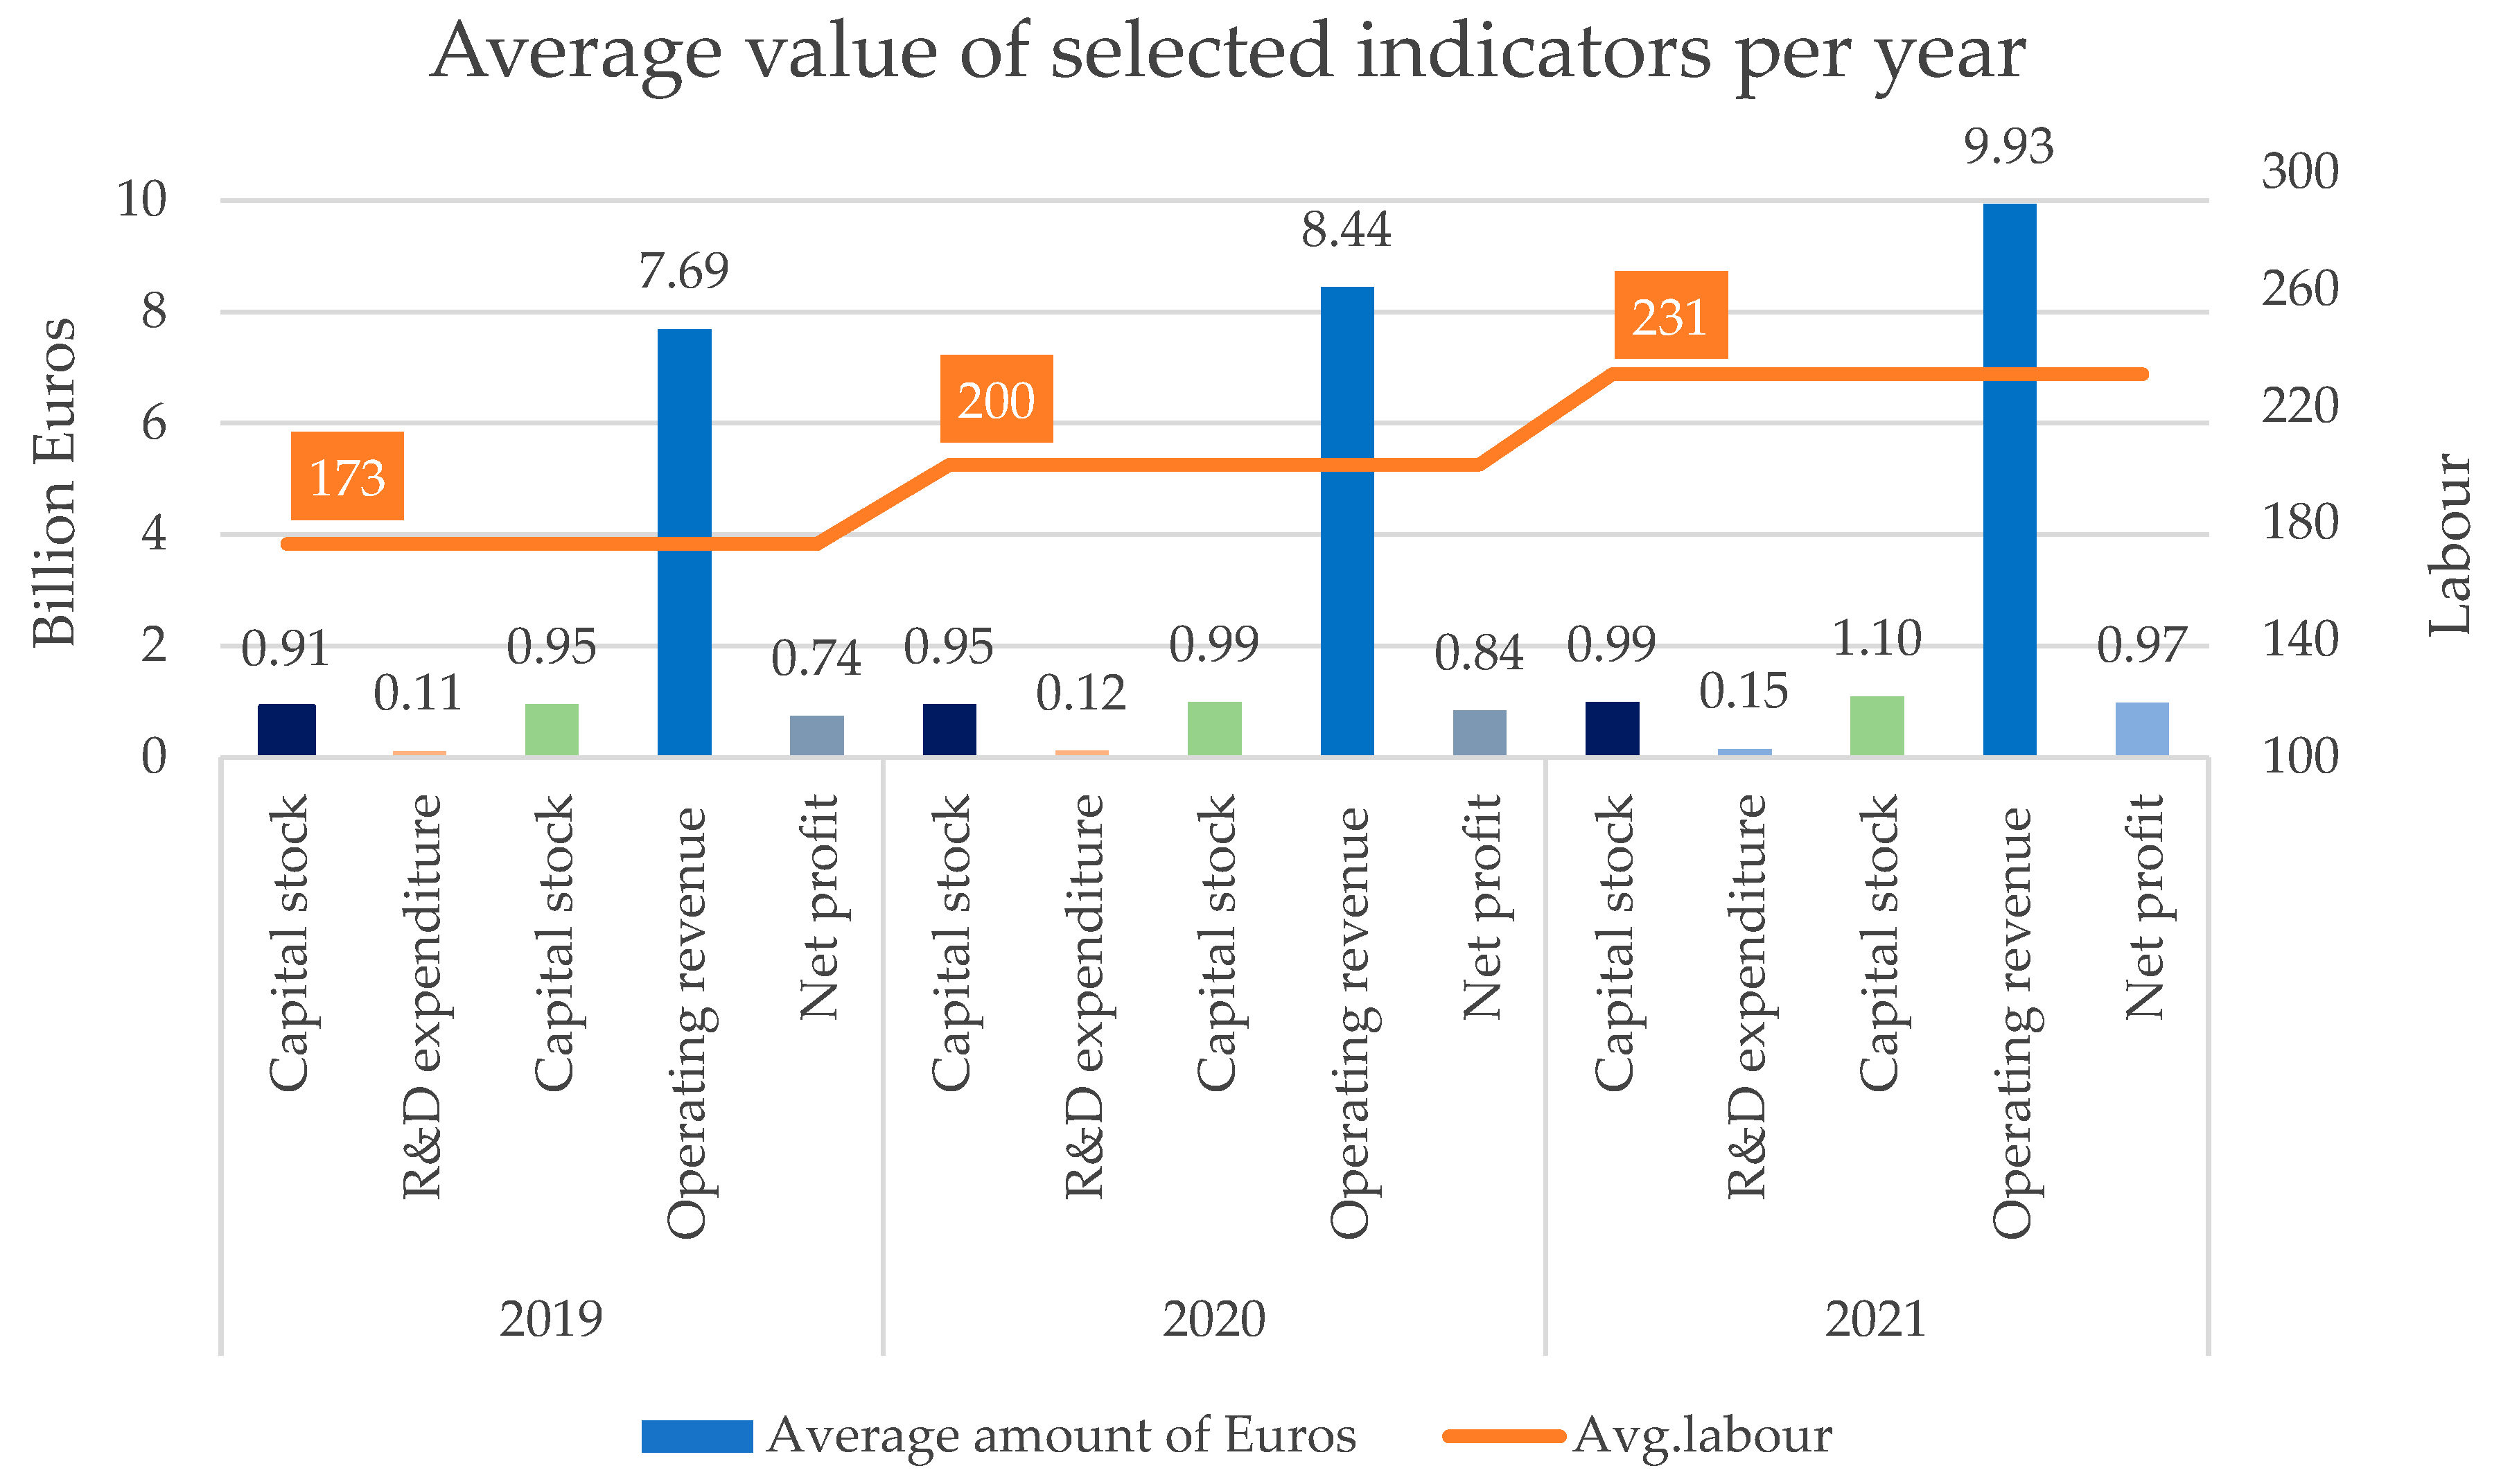
3.1. Descriptive Statistics
3.2. Correlation Analysis
3.3. Empirical Results
4. Discussion
5. Conclusions
5.1. Contributions & Practical Applications
5.2. Future Research Directions
Author Contributions
Funding
Institutional Review Board Statement
Informed Consent Statement
Data Availability Statement
Conflicts of Interest
Appendix A

| Inputs | Outputs | Carry-Over | |||||
|---|---|---|---|---|---|---|---|
| Company | Stock Code | Year | R&D Staff | R&D Expenditure | Operating Income | Net Profit | Capital Stock |
| 1 | 002053 | 2018 | 558,329,336 | ||||
| 002053 | 2019 | 48 | 9,068,433 | 1,933,137,924 | 286,313,835 | 760,978,566 | |
| 002053 | 2020 | 220 | 11,284,582 | 1,990,278,508 | 259,553,422 | 760,978,566 | |
| 002053 | 2021 | 217 | 5,823,097 | 2,258,831,335 | 270,439,271 | 760,978,566 | |
| 2 | 002216 | 2018 | 809,664,717 | ||||
| 002216 | 2019 | 109 | 149,926,685 | 5,985,722,254 | 219,150,712 | 799,258,226 | |
| 002216 | 2020 | 106 | 118,442,081 | 6,926,082,823 | 767,687,663 | 799,258,226 | |
| 002216 | 2021 | 151 | 96,269,725 | 6,943,439,865 | 639,942,313 | 879,184,048 | |
| 3 | 002507 | 2018 | 789,357,241 | ||||
| 002507 | 2019 | 21 | 25,962,179 | 1,989,593,123 | 605,141,874 | 789,357,241 | |
| 002507 | 2020 | 21 | 21,494,619 | 2,272,746,599 | 777,105,783 | 789,357,241 | |
| 002507 | 2021 | 22 | 25,048,460 | 2,518,647,389 | 741,958,457 | 887,630,022 | |
| 4 | 002597 | 2018 | 558,768,374 | ||||
| 002597 | 2019 | 434 | 136,639,529 | 3,971,856,106 | 808,356,014 | 558,771,351 | |
| 002597 | 2020 | 488 | 120,403,962 | 3,666,246,520 | 718,521,570 | 560,903,311 | |
| 002597 | 2021 | 516 | 182,871,407 | 5,845,322,601 | 1,176,448,711 | 560,913,735 | |
| 5 | 002661 | 2018 | 331,930,298 | ||||
| 002661 | 2019 | 99 | 41,854,132 | 3,033,973,309 | 206,668,169 | 328,808,450 | |
| 002661 | 2020 | 94 | 27,400,192 | 3,957,752,136 | 292,756,153 | 334,760,450 | |
| 002661 | 2021 | 95 | 28,467,594 | 4,326,648,257 | 67,367,507 | 337,010,083 | |
| 6 | 002847 | 2018 | 124,000,000 | ||||
| 002847 | 2019 | 68 | 26,900,715 | 1,399,275,041 | 127,613,274 | 128,400,000 | |
| 002847 | 2020 | 173 | 51,500,758 | 1,958,851,487 | 242,120,751 | 129,360,000 | |
| 002847 | 2021 | 169 | 55,190,165 | 2,281,504,302 | 154,363,226 | 129,360,000 | |
| 7 | 002910 | 2018 | 187,340,000 | ||||
| 002910 | 2019 | 35 | 9,461,944 | 813,554,461 | 51,321,172 | 190,680,600 | |
| 002910 | 2020 | 15 | 9,103,148 | 739,820,698 | 10,453,468 | 233,680,600 | |
| 002910 | 2021 | 16 | 9,246,922 | 1,021,431,542 | 53,533,056 | 232,381,032 | |
| 8 | 002946 | 2018 | 768,339,599 | ||||
| 002946 | 2019 | 123 | 69,754,667 | 5,674,953,670 | 251,445,167 | 853,710,666 | |
| 002946 | 2020 | 150 | 74,966,721 | 6,748,631,857 | 289,434,618 | 853,710,666 | |
| 002946 | 2021 | 146 | 90,797,649 | 8,966,872,398 | 341,261,734 | 867,271,477 | |
| 9 | 300401 | 2018 | 479,288,315 | ||||
| 300401 | 2019 | 97 | 42,757,359 | 718,384,536 | 343,706,533 | 479,288,315 | |
| 300401 | 2020 | 99 | 29,736,199 | 614,894,441 | 272,264,656 | 551,007,557 | |
| 300401 | 2021 | 137 | 68,545,827 | 1,117,099,893 | 510,007,726 | 551,007,557 | |
| 10 | 600298 | 2018 | 824,080,943 | ||||
| 600298 | 2019 | 591 | 333,462,090 | 7,652,754,552 | 939,880,334 | 824,080,943 | |
| 600298 | 2020 | 640 | 386,191,432 | 8,933,035,778 | 1,422,132,783 | 824,080,943 | |
| 600298 | 2021 | 730 | 475,198,936 | 10,675,333,008 | 1,321,484,377 | 832,860,943 | |
| 11 | 600305 | 2018 | 783,559,400 | ||||
| 600305 | 2019 | 124 | 52,943,612 | 1,832,193,611 | 330,267,318 | 783,559,400 | |
| 600305 | 2020 | 124 | 57,769,207 | 2,014,309,859 | 320,078,453 | 1,002,956,032 | |
| 600305 | 2021 | 151 | 78,542,779 | 1,893,347,830 | 118,332,057 | 1,002,956,032 | |
| 12 | 600419 | 2018 | 207,114,418 | ||||
| 600419 | 2019 | 10 | 3,182,198 | 1,626,592,714 | 142,028,807 | 207,114,418 | |
| 600419 | 2020 | 13 | 5,223,872 | 1,767,673,596 | 153,602,820 | 268,599,337 | |
| 600419 | 2021 | 18 | 6,498,985 | 2,109,258,101 | 160,959,099 | 320,190,246 | |
| 13 | 600429 | 2018 | 1,497,557,426 | ||||
| 600429 | 2019 | 60 | 20,355,603 | 8,150,710,057 | 159,042,286 | 1,497,557,426 | |
| 600429 | 2020 | 71 | 35,327,399 | 7,353,344,572 | 15,400,349 | 1,497,557,426 | |
| 600429 | 2021 | 73 | 117,654,695 | 7,730,723,573 | 208,678,748 | 1,497,557,426 | |
| 14 | 600597 | 2018 | 1,224,487,509 | ||||
| 600597 | 2019 | 100 | 68,140,427 | 22,563,236,819 | 682,452,363 | 1,224,487,509 | |
| 600597 | 2020 | 94 | 72,844,897 | 25,222,715,966 | 785,141,962 | 1,224,487,509 | |
| 600597 | 2021 | 101 | 89,259,433 | 29,205,992,515 | 566,893,573 | 1,378,640,863 | |
| 15 | 600866 | 2018 | 645,393,465 | ||||
| 600866 | 2019 | 284 | 53,550,926 | 1,049,609,531 | 149,552,368 | 739,019,166 | |
| 600866 | 2020 | 312 | 58,679,169 | 1,116,277,268 | 148,710,264 | 739,019,166 | |
| 600866 | 2021 | 356 | 68,877,956 | 1,235,046,858 | 106,469,881 | 739,019,166 | |
| 16 | 600873 | 2018 | 3,108,175,038 | ||||
| 600873 | 2019 | 98 | 434,643,905 | 14,553,547,455 | 1,003,557,478 | 3,104,289,638 | |
| 600873 | 2020 | 115 | 468,201,631 | 17,049,514,475 | 1,005,432,475 | 3,100,021,848 | |
| 600873 | 2021 | 219 | 649,213,308 | 22,836,890,325 | 2,376,147,704 | 3,098,619,928 | |
| 17 | 600882 | 2018 | 409,762,045 | ||||
| 600882 | 2019 | 46 | 22,304,115 | 1,744,349,052 | 19,229,864 | 409,357,045 | |
| 600882 | 2020 | 60 | 38,860,661 | 2,846,807,171 | 73,984,474 | 409,309,045 | |
| 600882 | 2021 | 76 | 40,090,274 | 4,478,305,562 | 193,769,127 | 516,210,147 | |
| 18 | 600887 | 2018 | 6,078,127,608 | ||||
| 600887 | 2019 | 411 | 541,803,036 | 90,009,132,852 | 6,950,726,155 | 6,096,378,858 | |
| 600887 | 2020 | 453 | 487,099,849 | 96,523,963,250 | 7,098,938,695 | 6,082,624,833 | |
| 600887 | 2021 | 461 | 601,017,082 | 110,143,986,386 | 8,732,025,624 | 6,400,130,918 | |
| 19 | 600929 | 2018 | 917,751,148 | ||||
| 600929 | 2019 | 453 | 87,867,120 | 2,272,012,599 | 163,294,814 | 917,751,148 | |
| 600929 | 2020 | 480 | 85,470,249 | 2,164,477,645 | 156,301,166 | 917,751,148 | |
| 600929 | 2021 | 772 | 193,944,936 | 4,780,264,152 | 441,029,995 | 1,350,168,875 | |
| 20 | 603020 | 2018 | 320,000,000 | ||||
| 603020 | 2019 | 124 | 33,018,395 | 2,474,657,721 | 170,251,807 | 320,000,000 | |
| 603020 | 2020 | 130 | 34,034,181 | 2,668,255,090 | 192,710,292 | 320,000,000 | |
| 603020 | 2021 | 140 | 39,910,113 | 3,344,556,763 | 232,993,957 | 383,237,774 | |
| 21 | 603027 | 2018 | 326,202,714 | ||||
| 603027 | 2019 | 37 | 39,482,609 | 1,355,147,204 | 198,253,971 | 465,850,722 | |
| 603027 | 2020 | 45 | 45,221,539 | 1,693,273,982 | 205,801,040 | 665,675,318 | |
| 603027 | 2021 | 45 | 55,389,753 | 1,925,286,294 | 221,401,595 | 798,782,158 | |
| 22 | 603043 | 2018 | 403,996,184 | ||||
| 603043 | 2019 | 292 | 61,337,012 | 3,028,699,726 | 383,438,304 | 403,996,184 | |
| 603043 | 2020 | 397 | 77,382,774 | 3,287,486,223 | 464,237,089 | 403,996,184 | |
| 603043 | 2021 | 346 | 77,446,242 | 3,889,924,382 | 564,886,983 | 565,594,658 | |
| 23 | 603079 | 2018 | 112,000,000 | ||||
| 603079 | 2019 | 137 | 27,901,281 | 519,149,812 | 37,759,207 | 112,000,000 | |
| 603079 | 2020 | 135 | 35,685,966 | 867,314,753 | 189,972,212 | 171,188,958 | |
| 603079 | 2021 | 145 | 39,643,033 | 789,732,755 | 71,822,072 | 171,188,958 | |
| 24 | 603288 | 2018 | 2,700,369,340 | ||||
| 603288 | 2019 | 426 | 587,425,291 | 19,796,889,800 | 5,356,242,595 | 2,700,369,340 | |
| 603288 | 2020 | 513 | 711,748,663 | 22,791,873,936 | 6,409,030,014 | 3,240,443,208 | |
| 603288 | 2021 | 599 | 771,919,702 | 25,004,031,043 | 6,671,470,526 | 4,212,576,170 | |
| 25 | 603299 | 2018 | 559,440,000 | ||||
| 603299 | 2019 | 368 | 89,000,000 | 4,190,385,022 | 260,205,816 | 775,730,854 | |
| 603299 | 2020 | 368 | 89,230,000 | 3,937,297,486 | 152,027,531 | 774,379,748 | |
| 603299 | 2021 | 392 | 115,736,800 | 4,761,367,450 | 340,989,147 | 772,926,545 | |
| 26 | 603696 | 2018 | 168,000,000 | ||||
| 603696 | 2019 | 33 | 13,180,385 | 421,296,739 | 42,797,000 | 235,200,000 | |
| 603696 | 2020 | 37 | 10,572,417 | 420,400,962 | 52,817,550 | 235,200,000 | |
| 603696 | 2021 | 33 | 13,775,589 | 548,965,239 | 45,392,683 | 235,200,000 | |
| 27 | 603739 | 2018 | 116,000,000 | ||||
| 603739 | 2019 | 196 | 74,997,960 | 846,777,963 | 89,391,435 | 154,667,000 | |
| 603739 | 2020 | 216 | 79,913,467 | 960,249,354 | 122,304,777 | 154,667,000 | |
| 603739 | 2021 | 264 | 100,936,653 | 1,150,823,565 | 150,097,268 | 252,084,840 | |
| 28 | 603866 | 2018 | 470,626,000 | ||||
| 603866 | 2019 | 24 | 8,842,772 | 5,643,709,760 | 683,358,392 | 658,876,400 | |
| 603866 | 2020 | 34 | 11,295,700 | 5,963,004,181 | 882,839,002 | 680,152,702 | |
| 603866 | 2021 | 89 | 20,645,747 | 6,335,381,672 | 763,265,674 | 952,213,783 | |
| Period | Role | Indicator | Year | Average | St.Dev. | Max. | Min. |
|---|---|---|---|---|---|---|---|
| 2019 | Carry-over | Capital stock | 2018 | 909,987,897 | 1,233,167,228 | 6,078,127,608 | 112,000,000 |
| Input | R&D expenditure | 2019 | 109,491,585 | 160,342,599 | 587,425,291 | 3,182,198 | |
| Input | R&D labour | 2019 | 173 | 164 | 591 | 10 | |
| Carry-over | Capital stock | 2019 | 947,126,410 | 1,224,655,656 | 6,096,378,858 | 112,000,000 | |
| Output | Operating revenue | 2019 | 7,687,546,550 | 17,074,535,941 | 90,009,132,852 | 421,296,739 | |
| Output | Net profit | 2019 | 737,908,824 | 1,569,025,767 | 6,950,726,155 | 19,229,864 | |
| 2020 | Carry-over | Capital stock | 2019 | 947,126,410 | 1,224,655,656 | 6,096,378,858 | 112,000,000 |
| Input | R&D expenditure | 2020 | 116,253,048 | 174,284,845 | 711,748,663 | 5,223,872 | |
| Input | R&D labour | 2020 | 200 | 180 | 640 | 13 | |
| Carry-over | Capital stock | 2020 | 990,183,108 | 1,246,656,935 | 6,082,624,833 | 129,360,000 | |
| Output | Operating revenue | 2020 | 8,444,877,879 | 18,390,488,392 | 96,523,963,250 | 420,400,962 | |
| Output | Net profit | 2020 | 838,620,037 | 1,708,771,917 | 7,098,938,695 | 10,453,468 | |
| 2021 | Carry-over | Capital stock | 2020 | 990,183,108 | 1,246,656,935 | 6,082,624,833 | 129,360,000 |
| Input | R&D expenditure | 2021 | 147,070,102 | 207,936,664 | 771,919,702 | 5,823,097 | |
| Input | R&D labour | 2021 | 231 | 213 | 772 | 16 | |
| Carry-over | Capital stock | 2021 | 1,095,924,855 | 1,356,906,255 | 6,400,130,918 | 129,360,000 | |
| Output | Operating revenue | 2021 | 9,932,821,966 | 20,985,555,792 | 110,143,986,386 | 548,965,239 | |
| Output | Net profit | 2021 | 972,979,718 | 1,983,880,346 | 8,732,025,624 | 45,392,683 |
References
- Katy, A. Population Growth ‘a Threat to Food Quality’. Available online: https://www.foodnavigator.com/Article/2017/11/10/Population-growth-a-threat-to-food-quality (accessed on 13 October 2022).
- Forecast: Industry Revenue of “Manufacture of Foods“ in China 2012–2025|Statista. Available online: https://www-statista-com.bris.idm.oclc.org/forecasts/1053832/manufacture-of-foods-revenue-in-china (accessed on 13 October 2022).
- Franko, L.G. Global Corporate Competition: Who’s Winning, Who’s Losing, and the R&D Factor as One Reason Why. Strateg. Manag. J. 1989, 10, 449–474. [Google Scholar]
- China—Research and Development (R&D) Projects by Industry|Statista. Available online: https://www-statista-com.bris.idm.oclc.org/statistics/234736/research-and-development-projects-in-china-by-industry/ (accessed on 13 October 2022).
- China: R&D Spending by Industry|Statista. Available online: https://www-statista-com.bris.idm.oclc.org/statistics/234726/research-and-development-spending-in-china-by-industry/ (accessed on 13 October 2022).
- Pölönen, J.; Engels, T.; Guns, R. Ambiguity in Identification of Peer-Reviewed Publications in the Finnish and Flemish Performance-Based Research Funding Systems. Sci. Public Policy 2020, 47, 1–15. [Google Scholar] [CrossRef]
- You, T.; Jung, W.-S. A System Dynamics Analysis of National R&D Performance Measurement System in Korea. arXiv 2019, arXiv:1901.05447. [Google Scholar]
- Ding, Z.-Q.; Ge, J.-P.; Wu, X.-M.; Zheng, X.-N. Bibliometrics Evaluation of Research Performance in Pharmacology/Pharmacy: China Relative to Ten Representative Countries. Scientometrics 2013, 96, 829–844. [Google Scholar] [CrossRef]
- Zou, Y. A Bibliometric Study on the R&D Funding and Academic Research Performance in Shenzhen. Sci. Public Policy 2022, 49, 460–473. [Google Scholar]
- Wang, K.; Wang, C.K.; Hu, C. Analytic Hierarchy Process with Fuzzy Scoring in Evaluating Multidisciplinary R&D Projects in China. IEEE Trans. Eng. Manag. 2005, 52, 119–129. [Google Scholar]
- Shin, C.-O.; Yoo, S.-H.; Kwak, S.-J. Applying the Analytic Hierarchy Process to Evaluation of the National Nuclear R&D Projects: The Case of Korea. Prog. Nucl. Energy 2007, 49, 375–384. [Google Scholar]
- Bigliardi, B.; Dormio, A.I. A Balanced Scorecard Approach for R&D: Evidence from a Case Study. Facilities 2010, 28, 278–289. [Google Scholar]
- Guo, Y.; Yang, X. Evaluation of Technological Innovation Capability of Sichuan Province High-Tech Enterprises Based on Factor Analysis. In Proceedings of the International Conference on Power Engineering & Energy, Environment (PEEE 2016), Singapore, 18–19 January 2016. [Google Scholar]
- Chachuli, F.S.M.; Mat, S.; Ludin, N.A.; Sopian, K. Performance Evaluation of Renewable Energy R&D Activities in Malaysia. Renew. Energy 2021, 163, 544–560. [Google Scholar]
- Chen, K.; Kou, M.; Fu, X. Evaluation of Multi-Period Regional R&D Efficiency: An Application of Dynamic DEA to China’s Regional R&D Systems. Omega 2018, 74, 103–114. [Google Scholar]
- Wang, E.C. R&D Efficiency and Economic Performance: A Cross-Country Analysis Using the Stochastic Frontier Approach. J. Policy Model. 2007, 29, 345–360. [Google Scholar]
- Matricano, D.; Candelo, E.; Sorrentino, M. Start-Ups’ Innovation Processes and Performance in the Food Industry: A Stochastic Frontier Analysis. Br. Food J. 2021, 124, 936–950. [Google Scholar] [CrossRef]
- Yu, A.; Shi, Y.; You, J.; Zhu, J. Innovation Performance Evaluation for High-Tech Companies Using a Dynamic Network Data Envelopment Analysis Approach. Eur. J. Oper. Res. 2021, 292, 199–212. [Google Scholar] [CrossRef]
- Xiong, X.; Yang, G.; Guan, Z. Assessing R&D Efficiency Using a Two-Stage Dynamic DEA Model: A Case Study of Research Institutes in the Chinese Academy of Sciences. J. Inf. 2018, 12, 784–805. [Google Scholar]
- Kao, C. Dynamic Data Envelopment Analysis: A Relational Analysis. Eur. J. Oper. Res. 2013, 227, 325–330. [Google Scholar] [CrossRef]
- Lee, H.; Park, Y.; Choi, H. Comparative Evaluation of Performance of National R&D Programs with Heterogeneous Objectives: A DEA Approach. Eur. J. Oper. Res. 2009, 196, 847–855. [Google Scholar]
- Cho, S.; Park, S.; Park, G.; Lee, W.; Song, W. Comparative Analysis on the Performance Evaluation of National R&D Projects. Asian J. Technol. Innov. 2009, 17, 121–142. [Google Scholar]
- Czarnitzki, D.; Lopes Bento, C. Evaluation of Public R&D Policies: A Cross-Country Comparison. World Rev. Sci. Technol. Sustain. Dev. 2012, 9, 254–282. [Google Scholar]
- Sinimole, K.R.; Saini, K.M. Performance Evaluation of R&D Organisations: An Asian Perspective. Int. J. Econ. Bus. 2021, 28, 179–196. [Google Scholar]
- Delvaux, P.A.G.; Hockmann, H.; Voigt, P.; Ciaian, P.; y Paloma, S.G. The Impact of Private R&D on the Performance of Food-Processing Firms: Evidence from Europe, Japan and North America; Joint Research Centre (Seville Site): Ispra, Italy, 2018. [Google Scholar]
- Martinez, M.G.; Briz, J. Innovation in the Spanish Food & Drink Industry. Int. Food Agribus. Manag. Rev. 2000, 3, 155–176. [Google Scholar]
- Gopinath, M.; Vasavada, U. Patents, R&D, and Market Structure in the US Food Processing Industry. J. Agric. Resour. Econ. 1999, 24, 127–139. [Google Scholar]
- Klopp, G.A. The analysis of the efficiency of productive systems with multiple inputs and outputs. Eng. Ind. 1985. Available online: https://www.proquest.com/openview/9ca8cb33d17f4203576cac7589bfdf40/1?pq-origsite=gscholar&cbl=18750&diss=y (accessed on 23 October 2022).
- Malmquist, S. Index Numbers and Indifference Surfaces. Trab. Estadística 1953, 4, 209–242. [Google Scholar] [CrossRef]
- Tone, K.; Tsutsui, M. Dynamic DEA: A Slacks-Based Measure Approach. Omega 2010, 38, 145–156. [Google Scholar] [CrossRef] [Green Version]
- Färe, R.; Grosskopf, S. Intertemporal Production Frontiers: With Dynamic DEA. J. Oper. Res. Soc. 1997, 48, 656. [Google Scholar] [CrossRef]
- Mariz, F.B.A.R.; Almeida, M.R.; Aloise, D. A Review of Dynamic Data Envelopment Analysis: State of the Art and Applications. Int. Trans. Oper. Res. 2018, 25, 469–505. [Google Scholar] [CrossRef] [Green Version]
- Chen, C.-M. A Network-DEA Model with New Efficiency Measures to Incorporate the Dynamic Effect in Production Networks. Eur. J. Oper. Res. 2009, 194, 687–699. [Google Scholar] [CrossRef]
- Tone, K.; Tsutsui, M. Dynamic DEA with Network Structure: A Slacks-Based Measure Approach. Omega 2014, 42, 124–131. [Google Scholar] [CrossRef] [Green Version]
- Jafarian-Moghaddam, A.R.; Ghoseiri, K. Fuzzy Dynamic Multi-Objective Data Envelopment Analysis Model. Expert Syst. Appl. 2011, 38, 850–855. [Google Scholar] [CrossRef]
- Omrani, H.; Soltanzadeh, E. Dynamic DEA Models with Network Structure: An Application for Iranian Airlines. J. Air Transp. Manag. 2016, 57, 52–61. [Google Scholar] [CrossRef]
- Rostamzadeh, R.; Akbarian, O.; Banaitis, A.; Soltani, Z. Application of DEA in Benchmarking: A Systematic Literature Review from 2003–2020. Technol. Econ. Dev. Econ. 2021, 27, 175–222. [Google Scholar] [CrossRef]
- Nemoto, J.; Goto, M. Measurement of Dynamic Efficiency in Production: An Application of Data Envelopment Analysis to Japanese Electric Utilities. J. Product. Anal. 2003, 19, 191–210. [Google Scholar] [CrossRef]
- Kao, C.; Hwang, S.-N. Efficiency Measurement for Network Systems: IT Impact on Firm Performance. Decis. Support. Syst. 2010, 48, 437–446. [Google Scholar] [CrossRef]
- Cook, W.D.; Tone, K.; Zhu, J. Data Envelopment Analysis: Prior to Choosing a Model. Omega 2014, 44, 1–4. [Google Scholar] [CrossRef]
- Earle, M.D.; Earle, R.L. Food Industry Research and Development. In Government and the Food Industry: Economic and Political Effects of Conflict and Co-Operation; Springer: Berlin/Heidelberg, Germany, 1997; pp. 125–140. [Google Scholar]
- Charnes, A.; Cooper, W.W.; Rhodes, E. Measuring the Efficiency of Decision Making Units. Eur. J. Oper. Res. 1978, 2, 429–444. [Google Scholar] [CrossRef]
- Wang, Q.; Hang, Y.; Sun, L.; Zhao, Z. Two-Stage Innovation Efficiency of New Energy Enterprises in China: A Non-Radial DEA Approach. Technol. Soc. Change 2016, 112, 254–261. [Google Scholar] [CrossRef]
- Liu, H.; Yang, G.; Liu, X.; Song, Y. R&D Performance Assessment of Industrial Enterprises in China: A Two-Stage DEA Approach. Socioecon. Plann. Sci. 2020, 71, 100753. [Google Scholar]
- Zhong, W.; Yuan, W.; Li, S.X.; Huang, Z. The Performance Evaluation of Regional R&D Investments in China: An Application of DEA Based on the First Official China Economic Census Data. Omega 2011, 39, 447–455. [Google Scholar]
- Hashimoto, A.; Haneda, S. Measuring the Change in R&D Efficiency of the Japanese Pharmaceutical Industry. Res. Policy 2008, 37, 1829–1836. [Google Scholar]
- Schmidt-Ehmcke, J.; Zloczysti, P. Research Efficiency in Manufacturing: An Application of DEA at the Industry Level. SSRN Electron. J. 2009. Available online: https://papers.ssrn.com/sol3/papers.cfm?abstract_id=1460765 (accessed on 20 October 2022). [CrossRef]
- Li, Y.; Wang, Y.; Cui, Q. Energy Efficiency Measures for Airlines: An Application of Virtual Frontier Dynamic Range Adjusted Measure. J. Renew. Sustain. Energy 2016, 8, 015901. [Google Scholar] [CrossRef]
- Chai, Y.; Pardey, P.G.; Chan-Kang, C.; Huang, J.; Lee, K.; Dong, W. Passing the Food and Agricultural R&D Buck? The United States and China. Food Policy 2019, 86, 101729. [Google Scholar] [CrossRef]
- China Securities Regulatory Commission CSRC Announcement [2012] No.31. Available online: http://www.csrc.gov.cn/csrc_en/c102034/c1371375/content.shtml (accessed on 9 July 2022).
- Golany, B.; Roll, Y. An Application Procedure for DEA. Omega 1989, 17, 237–250. [Google Scholar] [CrossRef]
- Zhou, L. Predicting the Removal of Special Treatment or Delisting Risk Warning for Listed Company in China with Adaboost. Procedia Comput. Sci. 2013, 17, 633–640. [Google Scholar] [CrossRef] [Green Version]
- Lin, R.; Chen, Z. A Directional Distance Based Super-Efficiency DEA Model Handling Negative Data. J. Oper. Res. Soc. 2017, 68, 1312–1322. [Google Scholar] [CrossRef] [Green Version]
- Puth, M.-T.; Neuhäuser, M.; Ruxton, G.D. Effective Use of Spearman’s and Kendall’s Correlation Coefficients for Association between Two Measured Traits. Anim Behav. 2015, 102, 77–84. [Google Scholar] [CrossRef] [Green Version]
- Halaskova, M.; Gavurova, B.; Kocisova, K. Research and Development Efficiency in Public and Private Sectors: An Empirical Analysis of EU Countries by Using DEA Methodology. Sustainability 2020, 12, 7050. [Google Scholar] [CrossRef]
- Kao, C. Network Data Envelopment Analysis: A Review. Eur. J. Oper. Res. 2014, 239, 1–16. [Google Scholar] [CrossRef]
- Lyu, J.C. A Comparative Study of Crisis Communication Strategies between Mainland China and Taiwan: The Melamine-Tainted Milk Powder Crisis in the Chinese Context. Public Relat. Rev. 2012, 38, 779–791. [Google Scholar] [CrossRef]
- Wu, X.; Lu, Y.; Xu, H.; Lv, M.; Hu, D.; He, Z.; Liu, L.; Wang, Z.; Feng, Y. Challenges to Improve the Safety of Dairy Products in China. Trends Food Sci. Technol. 2018, 76, 6–14. [Google Scholar] [CrossRef]
- Yili Innovation|Drive Healthy Food Innovations Using Global Networks. Available online: https://www.yili-innovation.com/ (accessed on 13 October 2022).
- Linton, K.; Stone, P.; Wise, J. Patenting Trends & Innovation in Industrial Biotechnology. Ind. Biotechnol. 2008, 4, 367–390. [Google Scholar] [CrossRef]
- Fu, X. China’s Path to Innovation; Cambridge University Press: Cambridge, UK, 2015; ISBN 1316240215. [Google Scholar]
- Wang, L.; Chen, F.; Knell, M. Patterns of Technology Upgrading–the Case of Biotechnology in China. Asian J. Technol. Innov. 2019, 27, 152–171. [Google Scholar] [CrossRef] [Green Version]
- Djordjević, B.; Mane, A.S.; Krmac, E. Analysis of Dependency and Importance of Key Indicators for Railway Sustainability Monitoring: A New Integrated Approach with DEA and Pearson Correlation. Res. Transp. Bus. Manag. 2021, 41, 100650. [Google Scholar] [CrossRef]
- AlKhars, M.A.; Alnasser, A.H.; AlFaraj, T. A Survey of DEA Window Analysis Applications. Processes 2022, 10, 1836. [Google Scholar] [CrossRef]
- Yi, X.; Sheng, K.; Yu, T.; Wang, Y.; Wang, S. R&D Investment and Financing Efficiency in Chinese Environmental Protection Enterprises: Perspectives of COVID-19 and Supply Chain Financial Regulation. Int. J. Logist. Res. Appl. 2022, 25, 569–590. [Google Scholar] [CrossRef]
- Jin, G.; Xu, J.; Liu, F.; Haris, M.; Weqar, F. Does R&D Investment Moderate the Relationship between the COVID-19 Pandemic and Firm Performance in China’s High-Tech Industries? Based on DuPont Components. Technol. Anal. Strat. Manag. 2021, 34, 1464–1478. [Google Scholar] [CrossRef]
- Biswas, S. Can R&D Investment Reduce the Impact of COVID-19 on Firm Performance?—Evidence from India. J. Public Aff. 2021, e2773, in press. [Google Scholar] [CrossRef]
- Corchuelo Martínez-Azúa, B.; López-Salazar, P.E.; Sama-Berrocal, C. Impact of the COVID-19 Pandemic on Agri-Food Companies in the Region of Extremadura (Spain). Agronomy 2021, 11, 971. [Google Scholar] [CrossRef]
- R&D Tax Incentives: Continuous Encouragement and Enhanced Supervision|International Tax Review. Available online: https://www.internationaltaxreview.com/article/2a6a47b905qo4rw7jcdts/r-d-tax-incentives-continuous-encouragement-and-enhanced-supervision (accessed on 13 October 2022).
- Kremantzis, M.D.; Beullens, P.; Kyrgiakos, L.S.; Klein, J. Measurement and Evaluation of Multi-Function Parallel Network Hierarchical DEA Systems. Socioecon. Plann. Sci. 2022, in press. [Google Scholar] [CrossRef]


| Methods | Sources |
|---|---|
| Peer review | Pölönen et al. [6]; You and Jung [7] |
| Bibliometric methods | Ding et al. [8]; Zou [9] |
| Analytic hierarchy process (AHP) | Wang et al. [10]; Shin et al. [11] |
| Balanced scorecard (BSC) | Bigliardi and Ivo Dormio [12] |
| Factor analysis | Guo and Yang [13] |
| Data envelopment analysis (DEA) | Chachuli et al. [14]; Chen et al. [15] |
| Stochastic frontier analysis (SFA) | Wang [16]; Matricano et al. [17] |
| Author & Year | Area Identified | Techniques |
|---|---|---|
| Chen [33] | Production network | Dynamic Network—DEA model (DNDEA) |
| Tone and Tsutsui [30] | Electric utilities in US and Japan | Slacks-based dynamic DEA model (DSBM) |
| Tone and Tsutsui [34] | Electric power companies | Dynamic Slacks-based model with network structure (DNSBM) |
| Jafarian-Moghaddam and Ghoseiri [35] | World’s railways | Fuzzy dynamic multi-objective DEA model |
| Kao [20] | Taiwanese forests | Dynamic relational analysis model |
| Omrani and Soltanzadeh [36] | Airlines in Iran | Dynamic network DEA model |
| Related Literature | Industry | Input | Output |
|---|---|---|---|
| Liu et al. [44] | Industrial enterprises | R&D expenditure | Sales revenue of new products |
| R&D personnel | Revenue from principal business | ||
| Delvaux et al. [25] | Food-processing firms | Total cost of goods sold | Revenue |
| Physical capital | |||
| Labour | |||
| Chachuli et al. [14] | Renewable energy industry | Publication | Installed capacity |
| Human capital | |||
| Patent | |||
| Xiong et al. [19] | Research institutes | R&D expenditure | Income |
| R&D personnel | |||
| Yu et al. [18] | High-tech industry | R&D expenditure | New product revenue |
| R&D labour | Revenue | ||
| Wang et al. [43] | New energy enterprises | Fixed assets | Total profits |
| Staff wages | Market value | ||
| R&D costs | |||
| Hashimoto and Haneda [46] | Pharmaceutical industry | R&D expenditure | Patents |
| Pharmaceutical sales | |||
| Operating profit | |||
| Schmidt-Ehmcke and Zloczysti [47] | Manufacturing industry | R&D investments | Patent applications |
| Role | Indicator | Description | Data Source |
|---|---|---|---|
| Input | R&D expenditure | Direct expenses related to the company’s efforts to develop, design, and enhance its products or technologies | Annual reports and financial statements |
| Input | R&D labour | The number of full-time R&D personnel in the given year | |
| Carry-over | Capital stock | The total share capital issued by a company | |
| Output | Operating revenue | Revenue generated from the company’s primary business activities | |
| Output | Net profit | Total profit of the enterprise for the period after deduction of income tax |
| R&D Expenditure | R&D Labour | Operating Revenue | Net Profit | |
|---|---|---|---|---|
| R&D expenditure | 1 | |||
| R&D labour | 0.610 ** | 1 | ||
| Operating revenue | 0.638 ** | 0.313 ** | 1 | |
| Net profit | 0.839 ** | 0.467 ** | 0.858 ** | 1 |
| DMU | Company | Sector | System | Rank | 2019 | Rank | 2020 | Rank | 2021 | Rank |
|---|---|---|---|---|---|---|---|---|---|---|
| 1 | Yunnan Energy Investment | Organic food | 0.6449 | 5 | 0.969 | 3 | 0.73 | 8 | 0.851 | 4 |
| 2 | Sanquan Food | General foods | 0.2351 | 12 | 0.437 | 12 | 0.455 | 12 | 0.397 | 13 |
| 3 | Fuling Preserved Pickles | General foods | 0.9387 | 2 | 0.865 | 4 | 1 | 1 | 0.995 | 3 |
| 4 | Anhui Jinhe Industrial | Additives | 0.0729 | 24 | 0.071 | 27 | 0.072 | 27 | 0.077 | 26 |
| 5 | Ke Ming Food | General foods | 0.1798 | 17 | 0.114 | 24 | 0.226 | 22 | 0.236 | 20 |
| 6 | YanKershop | General foods | 0.0557 | 27 | 0.082 | 26 | 0.06 | 28 | 0.065 | 27 |
| 7 | Zhuangyuan Pasture | Dairy | 0.3199 | 10 | 0.398 | 13 | 0.741 | 7 | 0.636 | 7 |
| 8 | New Hope Dairy | Dairy | 0.2127 | 16 | 0.283 | 18 | 0.256 | 19 | 0.308 | 16 |
| 9 | Garden Biochem | Food medicine | 0.159 | 18 | 0.35 | 16 | 0.396 | 15 | 0.306 | 17 |
| 10 | Angel Yeast | Fermented products | 0.0635 | 26 | 0.057 | 28 | 0.072 | 26 | 0.064 | 28 |
| 11 | Hengshun Vinegar | Condiments | 0.2128 | 15 | 0.383 | 14 | 0.488 | 11 | 0.392 | 14 |
| 12 | Terun | Dairy | 0.6072 | 6 | 0.754 | 6 | 0.831 | 5 | 0.776 | 5 |
| 13 | Sanyuan Food | Dairy | 0.4724 | 9 | 0.658 | 9 | 0.565 | 10 | 0.567 | 8 |
| 14 | Bright Dairy | Dairy | 0.9254 | 3 | 0.823 | 5 | 0.955 | 4 | 1 | 1 |
| 15 | Star Lake Bioscience | Additives | 0.1398 | 20 | 0.36 | 15 | 0.324 | 16 | 0.29 | 18 |
| 16 | MeiHua Holdings Group | Amino acids | 0.5062 | 8 | 0.695 | 7 | 0.674 | 9 | 0.503 | 9 |
| 17 | Milkland | Dairy | 0.2698 | 11 | 0.5 | 11 | 0.439 | 13 | 0.485 | 10 |
| 18 | Yili Dairy | Dairy | 0.9993 | 1 | 1 | 1 | 1 | 1 | 1 | 1 |
| 19 | Snowy Sky | Condiments | 0.1183 | 21 | 0.256 | 20 | 0.261 | 18 | 0.2 | 23 |
| 20 | Apple Flavor & Fragrance Group | Spice and additives | 0.1444 | 19 | 0.295 | 17 | 0.29 | 17 | 0.309 | 15 |
| 21 | Qianhe Condiment and Food | Condiments | 0.5267 | 7 | 0.685 | 8 | 0.742 | 6 | 0.73 | 6 |
| 22 | Guangzhou Restaurant Group | General foods | 0.1067 | 22 | 0.214 | 22 | 0.178 | 24 | 0.247 | 19 |
| 23 | Shengda Bio-Pharm | Additives | 0.0716 | 25 | 0.151 | 23 | 0.188 | 23 | 0.162 | 24 |
| 24 | Haitian Flavouring | Condiments | 0.2157 | 14 | 0.235 | 21 | 0.229 | 21 | 0.216 | 21 |
| 25 | Jingshen Salt & Chemical Industry | Condiments | 0.1029 | 23 | 0.27 | 19 | 0.25 | 20 | 0.206 | 22 |
| 26 | AnKee | Condiments | 0.2295 | 13 | 0.528 | 10 | 0.431 | 14 | 0.46 | 12 |
| 27 | Vland Biotech | Fermented products | 0.0443 | 28 | 0.088 | 25 | 0.079 | 25 | 0.106 | 25 |
| 28 | Toly Bread | Bakery | 0.7294 | 4 | 1 | 1 | 0.971 | 3 | 0.485 | 10 |
| Average | 0.3323 | 0.4471 | 0.4607 | 0.4309 | ||||||
| System | 2019 | 2020 | 2021 | |
|---|---|---|---|---|
| System | 1 | |||
| 2019 | 0.940 ** | 1 | ||
| 2020 | 0.945 ** | 0.963 ** | 1 | |
| 2021 | 0.952 ** | 0.942 ** | 0.948 ** | 1 |
| χ2 | df | P | ε2 | |
|---|---|---|---|---|
| a Between years | ||||
| Eff. scores | 0.0696 | 2 | 0.966 | 8.38 × 10⁻⁴ |
| b Between years by sector | ||||
| 2019 | 7.29 | 5 | 0.210 | 0.270 |
| 2020 | 7.58 | 5 | 0.810 | 0.281 |
| 2021 | 11.06 | 5 | 0.070 | 0.409 |
Publisher’s Note: MDPI stays neutral with regard to jurisdictional claims in published maps and institutional affiliations. |
© 2022 by the authors. Licensee MDPI, Basel, Switzerland. This article is an open access article distributed under the terms and conditions of the Creative Commons Attribution (CC BY) license (https://creativecommons.org/licenses/by/4.0/).
Share and Cite
Mao, S.; Kremantzis, M.D.; Kyrgiakos, L.S.; Vlontzos, G. R&D Performance Evaluation in the Chinese Food Manufacturing Industry Based on Dynamic DEA in the COVID-19 Era. Agriculture 2022, 12, 1938. https://doi.org/10.3390/agriculture12111938
Mao S, Kremantzis MD, Kyrgiakos LS, Vlontzos G. R&D Performance Evaluation in the Chinese Food Manufacturing Industry Based on Dynamic DEA in the COVID-19 Era. Agriculture. 2022; 12(11):1938. https://doi.org/10.3390/agriculture12111938
Chicago/Turabian StyleMao, Shiping, Marios Dominikos Kremantzis, Leonidas Sotirios Kyrgiakos, and George Vlontzos. 2022. "R&D Performance Evaluation in the Chinese Food Manufacturing Industry Based on Dynamic DEA in the COVID-19 Era" Agriculture 12, no. 11: 1938. https://doi.org/10.3390/agriculture12111938