

Identifying Working Trajectories of the Wheat Harvester In-Field Based on K-Means Algorithm
Abstract
:1. Introduction
- (1)
- Reclassification of trajectories based on trajectory segments using three distance algorithms.
- (2)
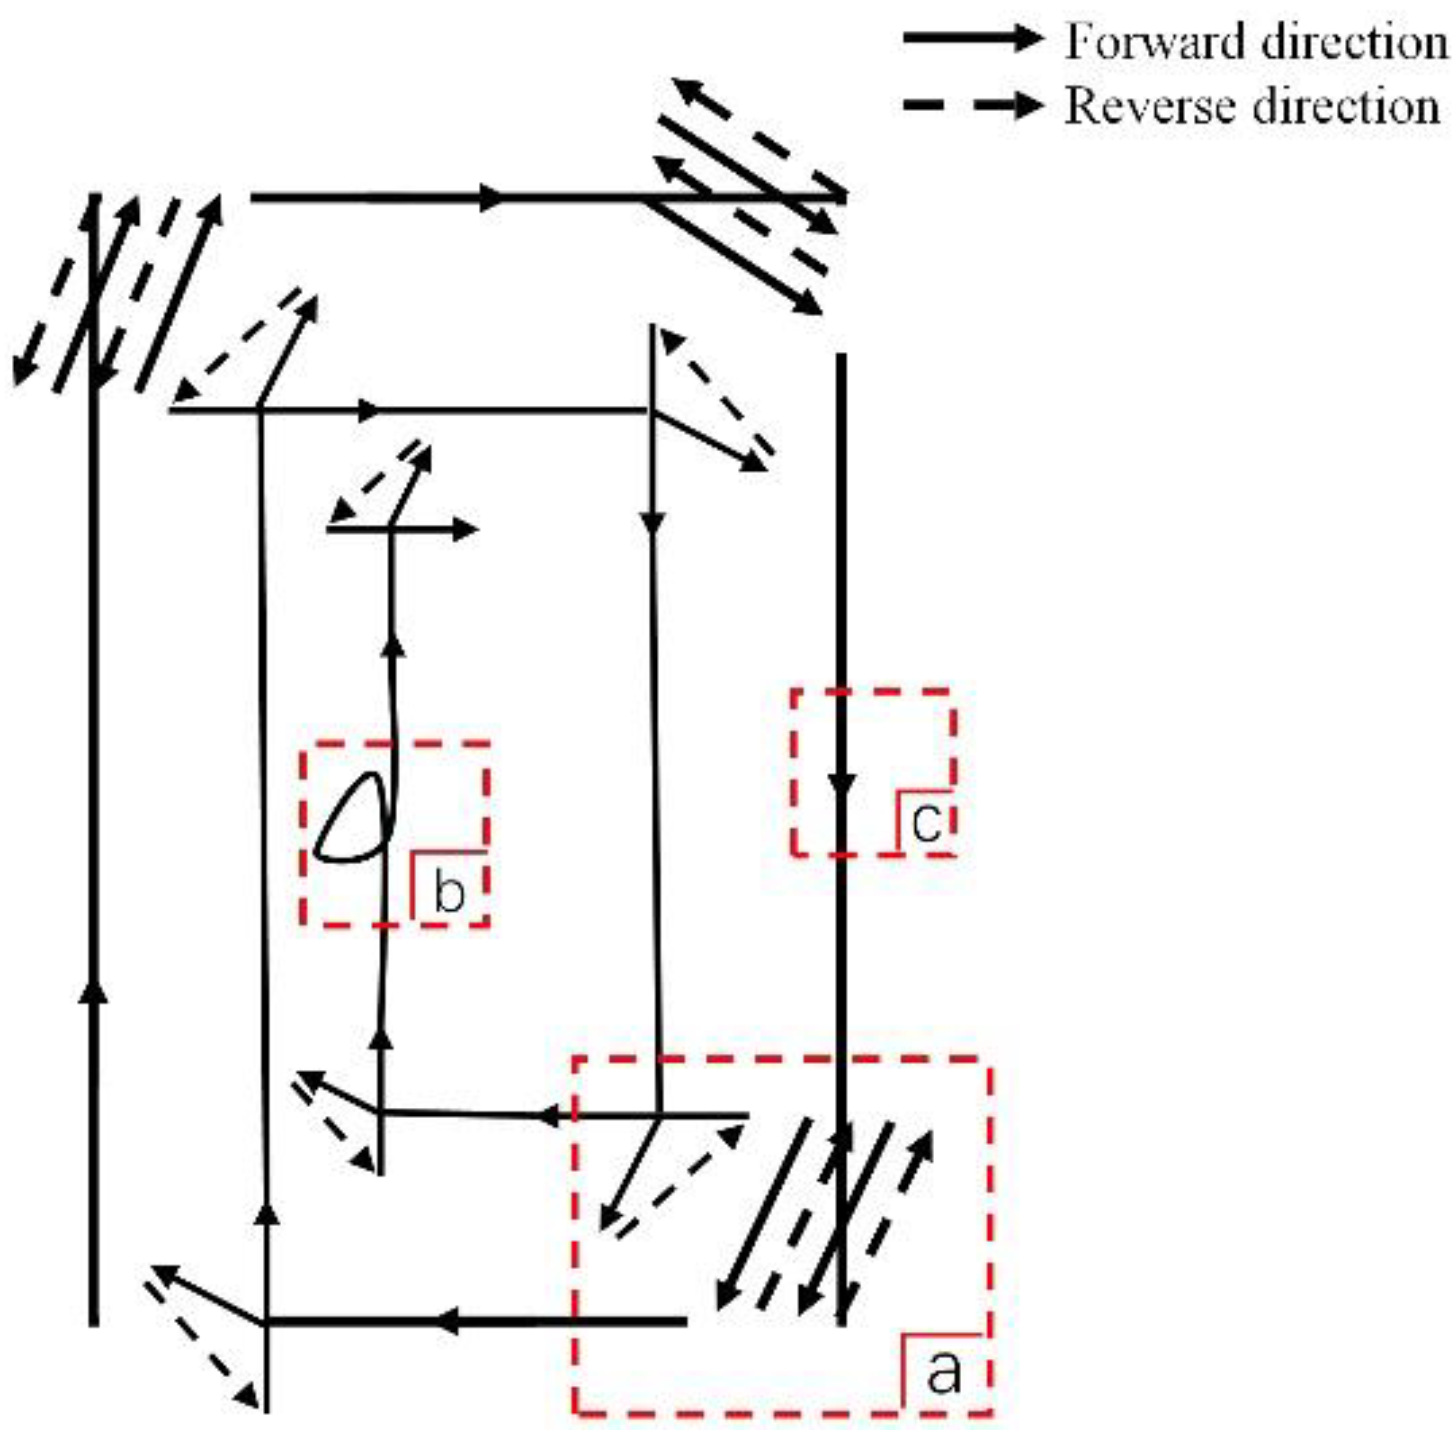
- Identifying the “abnormal working” trajectory based on the change of direction before and after the agricultural machine’s turning trajectory.
- (3)
- Correction of the “turning” trajectory boundary based on the operating characteristics of the harvester.
2. Materials and Methods
2.1. Overview
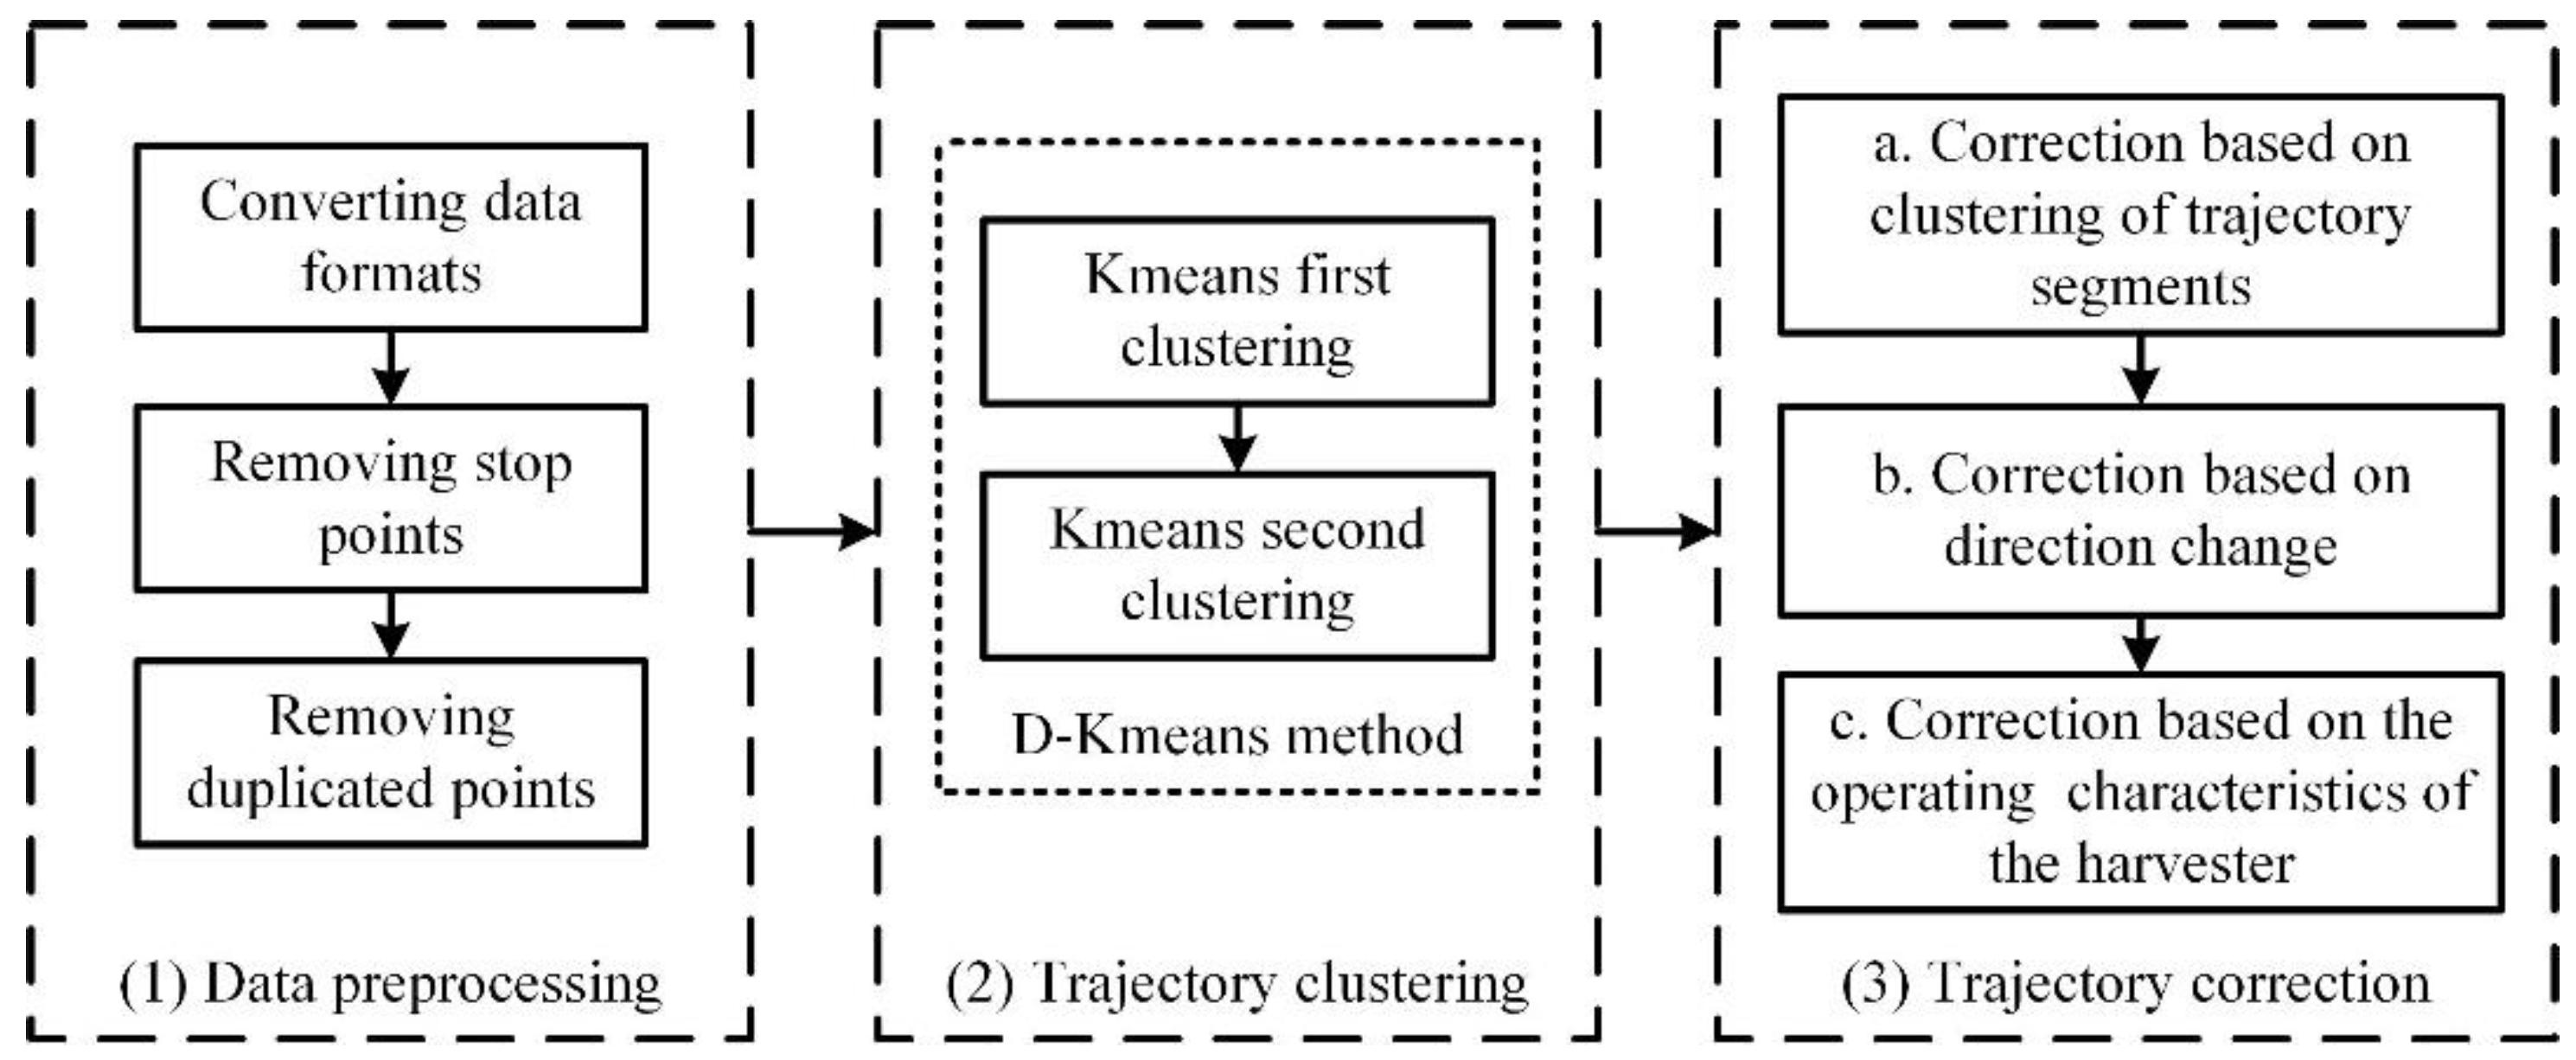
- (1)
- Data preprocessing. It includes three operations: converting data formats, removing stop points, and removing duplicated points.
- (2)
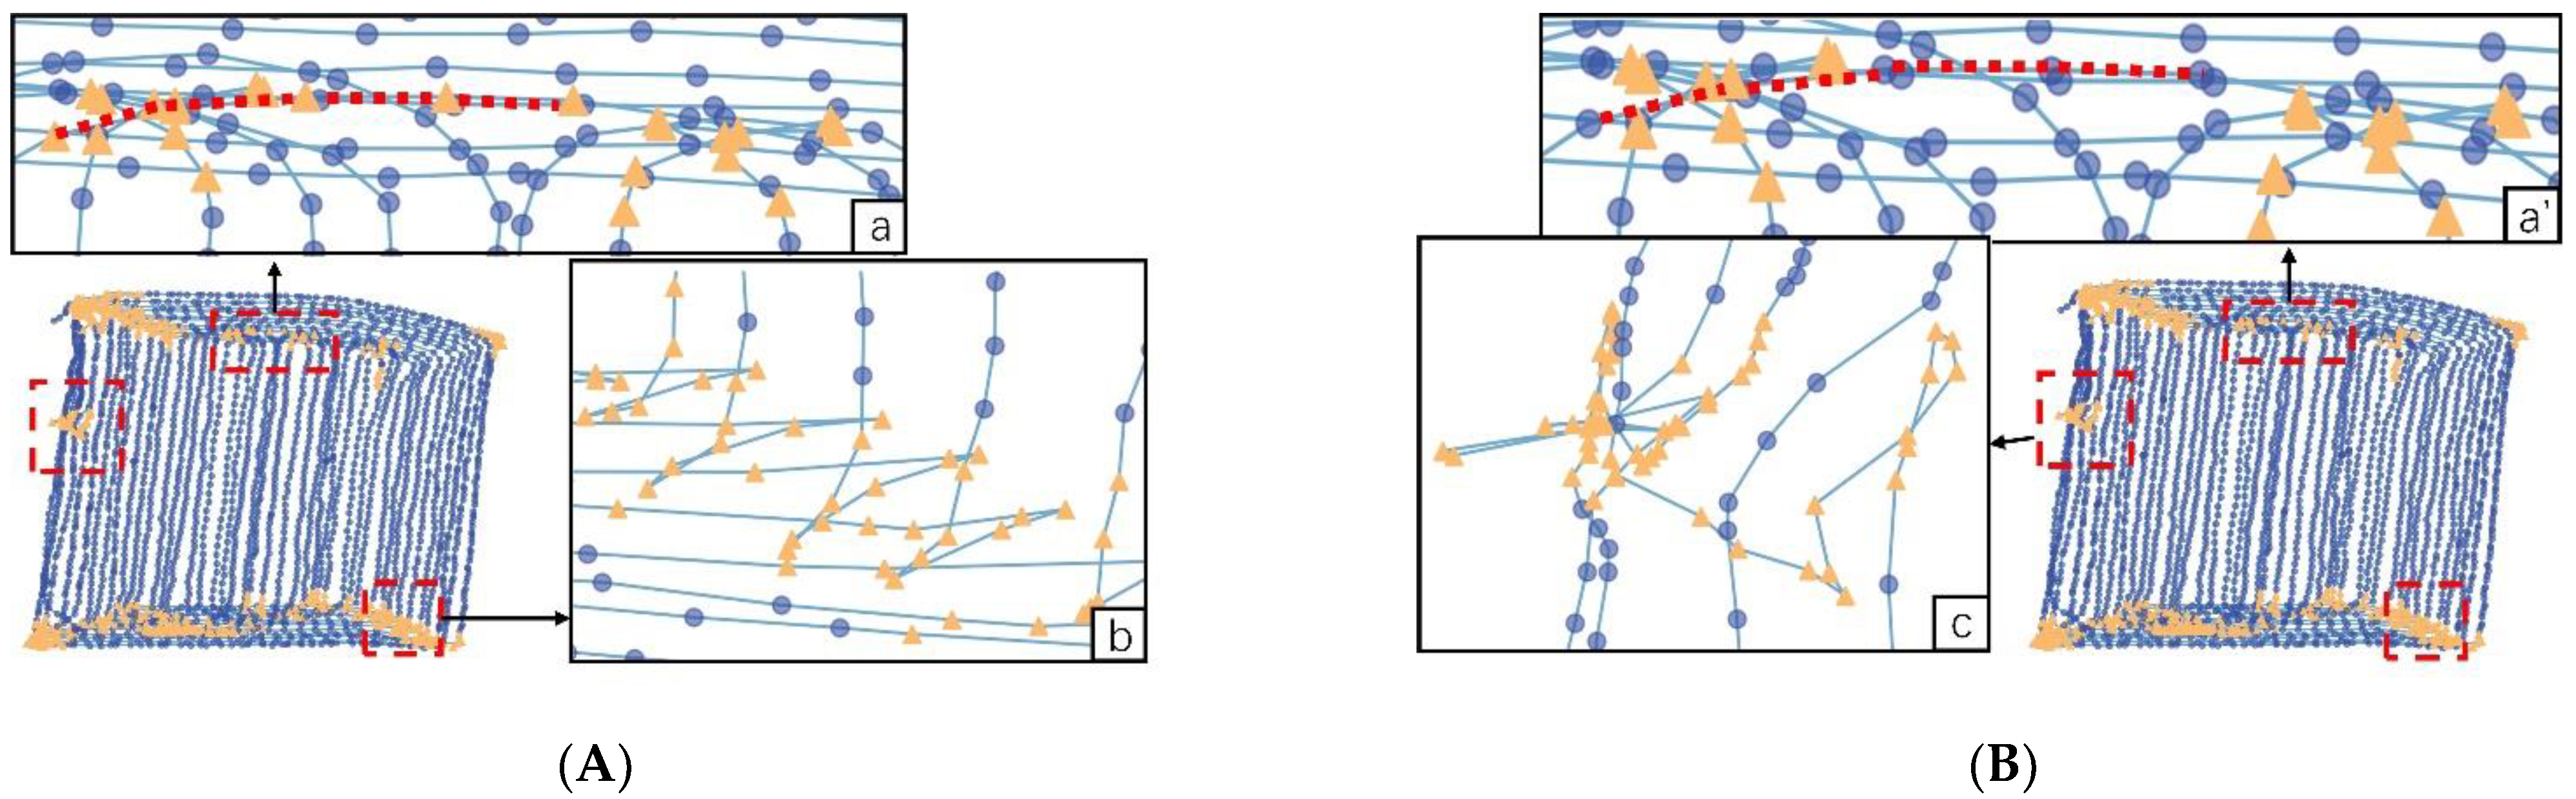
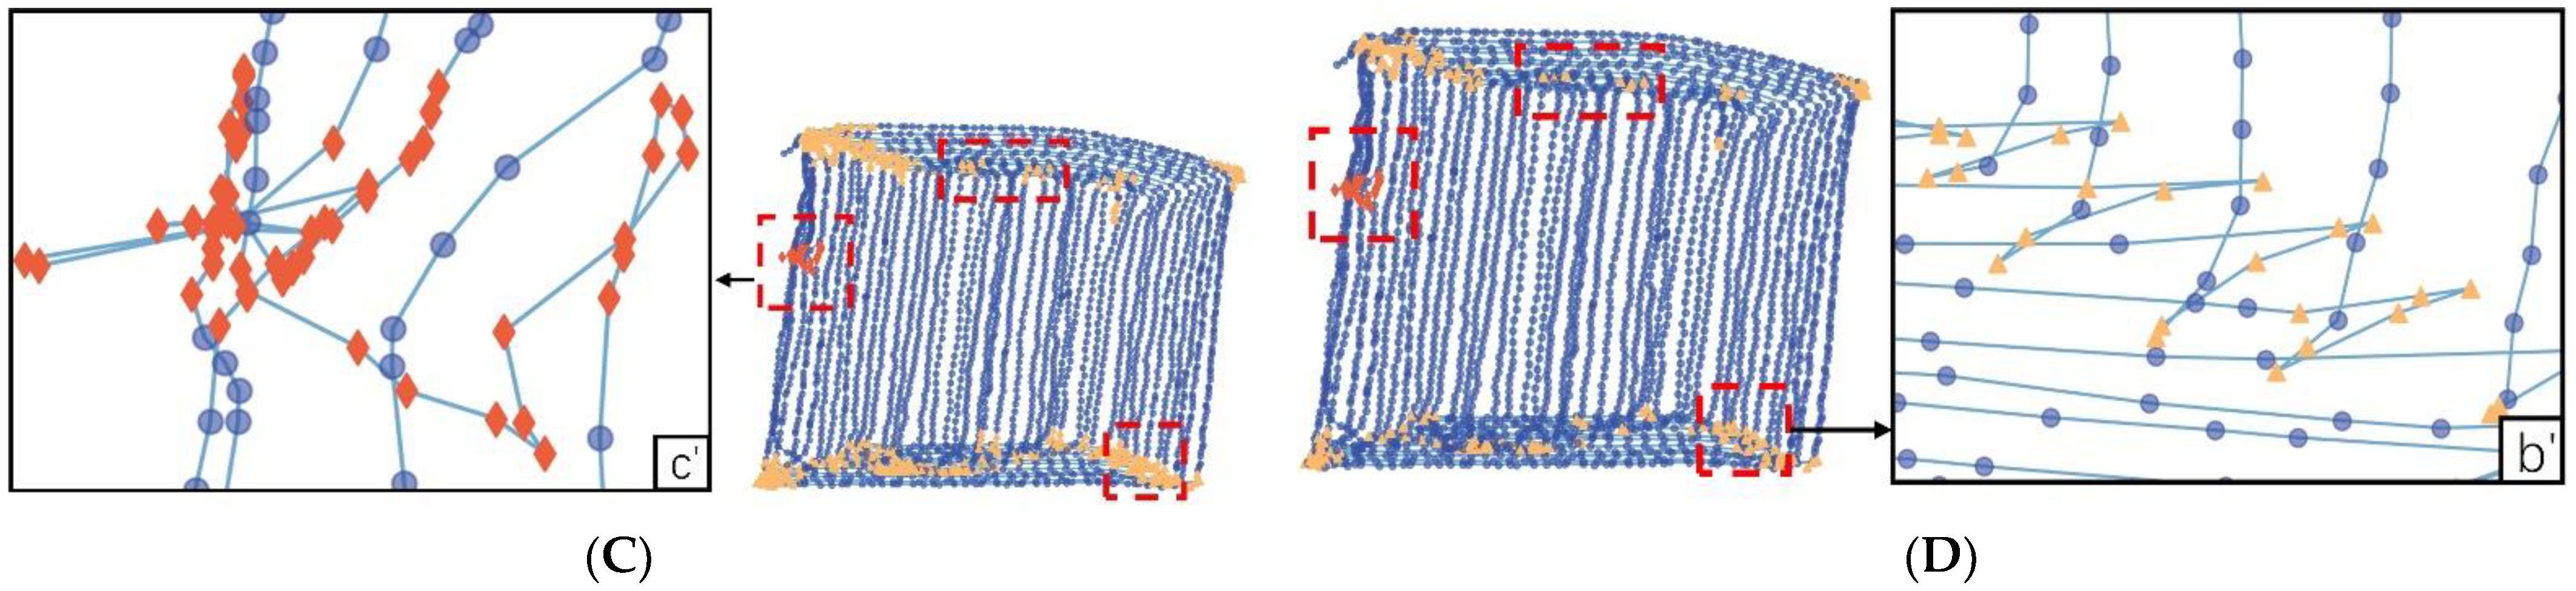
- Trajectory clustering. The D-K-means clustering algorithm is used; that is, it is clustered after two K-means iterations. Iterative clustering means using the original data features for the first clustering and later constructing new data features for the second clustering based on the first clustering results. In this paper, this method is named as D-K-means. After iterative clustering, we initially obtain the “working” trajectories and “turning” trajectories, and the results are not good and do not obtain the “abnormal working” trajectories, so further corrections are needed.
- (3)
- Trajectory correction. It consists of three steps to realize three functions, respectively:
- a.
- Reclassify the current clustering results based on the trajectory fragment using three distance algorithms to correct the situation that the “working” trajectory is mistakenly recognized as the “turning” trajectory;
- b.
- Distinguish the “abnormal working” trajectory from the “turning” trajectory based on the change of the driving direction of the agricultural machine to correct the “abnormal working” trajectory mistakenly recognized as the “turning” trajectory;
- c.
- Define the beginning and ending positions of each “turning” trajectory according to the operating characteristics of the harvester.
2.2. Datasets and Data Preprocessing
- (1)
- Data format conversion: The time format is converted to (YYYYMMDDhhmmss); the latitude and longitude of each trajectory point are converted to the coordinates in the geodetic coordinate system using UTM projection (Universal Transverse Mercator Projection), which is recorded as x, y.
- (2)
- Remove the stopping points. A set of stopping points is considered to be any continuous trajectory point with a speed less than 0.5 m/s [9]. Only one trajectory point is kept once the halting point has been removed. The speed is set to zero, and the longitude and latitude of this trajectory point are equal to the average values for this group of stopping locations’ longitude and latitude.
- (3)
- Remove duplicate points. When consecutive trajectory points have the same latitude and longitude, the first trajectory point is kept and the other trajectory points are removed.
2.3. D-K-means-Based Clustering
2.4. Correction Method
2.4.1. M1 Correction Based on Trajectory Segments Cluster
- (1)
- Trajectory fragmentation: The trajectory points belonging to the same trajectory category (label0 or label1) and adjacent in the time series are treated as a set of trajectory fragments.
- (2)
- Feature construction of trajectory segments: Calculate the standard deviation, mean, and maximum of the angle at which each group of trajectory segments’ trajectory points, and recorded as ( is the standard deviation of of the ith segment, is the mean of of the ith segment, is the maximum of angle of the ith segment), is the feature set of the ith trajectory segment.
- (3)
- Finding the cluster class center: The cluster class center of each category is obtained by calculating the average of the feature set of that category, where the cluster class center of label 0 is denoted as , and the cluster class center of label 1 is denoted as .
- (4)
- Trajectory fragment reclassification: Taking the trajectory fragment as the basic unit calculate the distance from each trajectory fragment to the cluster class center and , and the distance is calculated by Euclidean distance, Chebyshev distance, and Manhattan distance, which are calculated by Formula (3), Formula (4), and Formula (5). In order to decide which sort of trajectory the group of trajectory belongs to, the voting choice [24] is taken to choose the closest cluster center of each trajectory segment from the calculation results of the three distance methods.
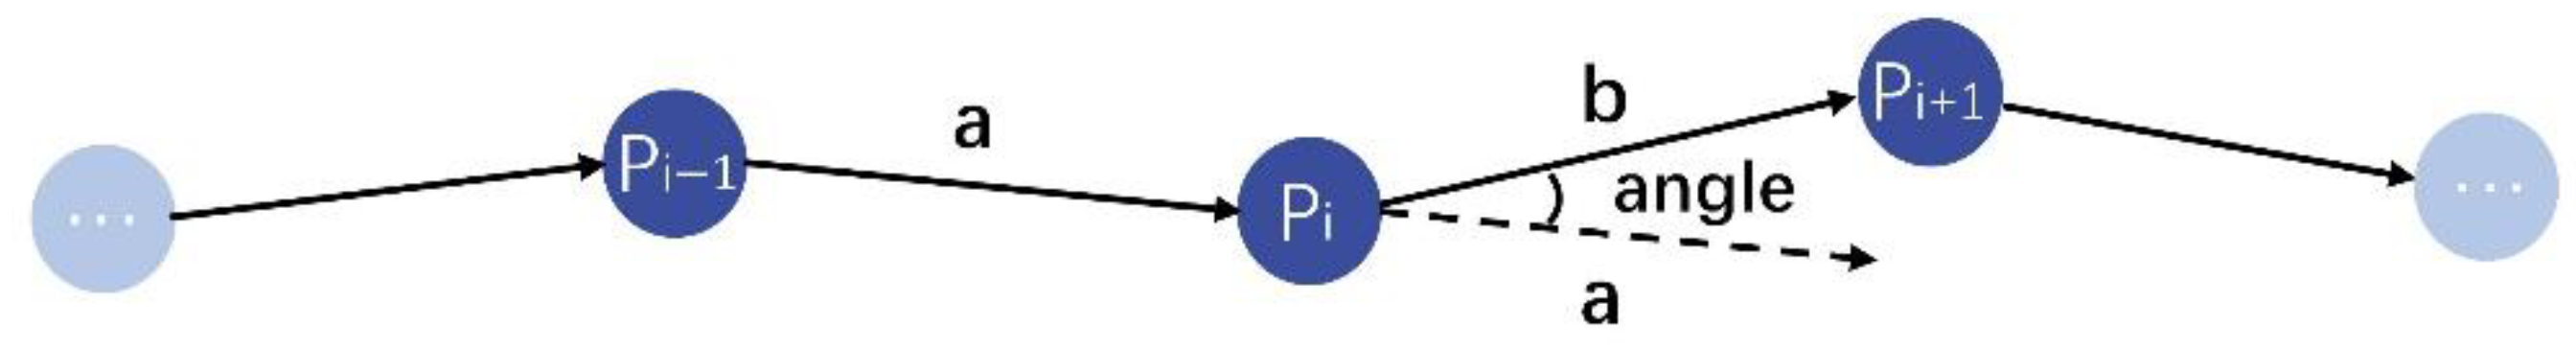
2.4.2. M2 Correction Based on Orientation Change
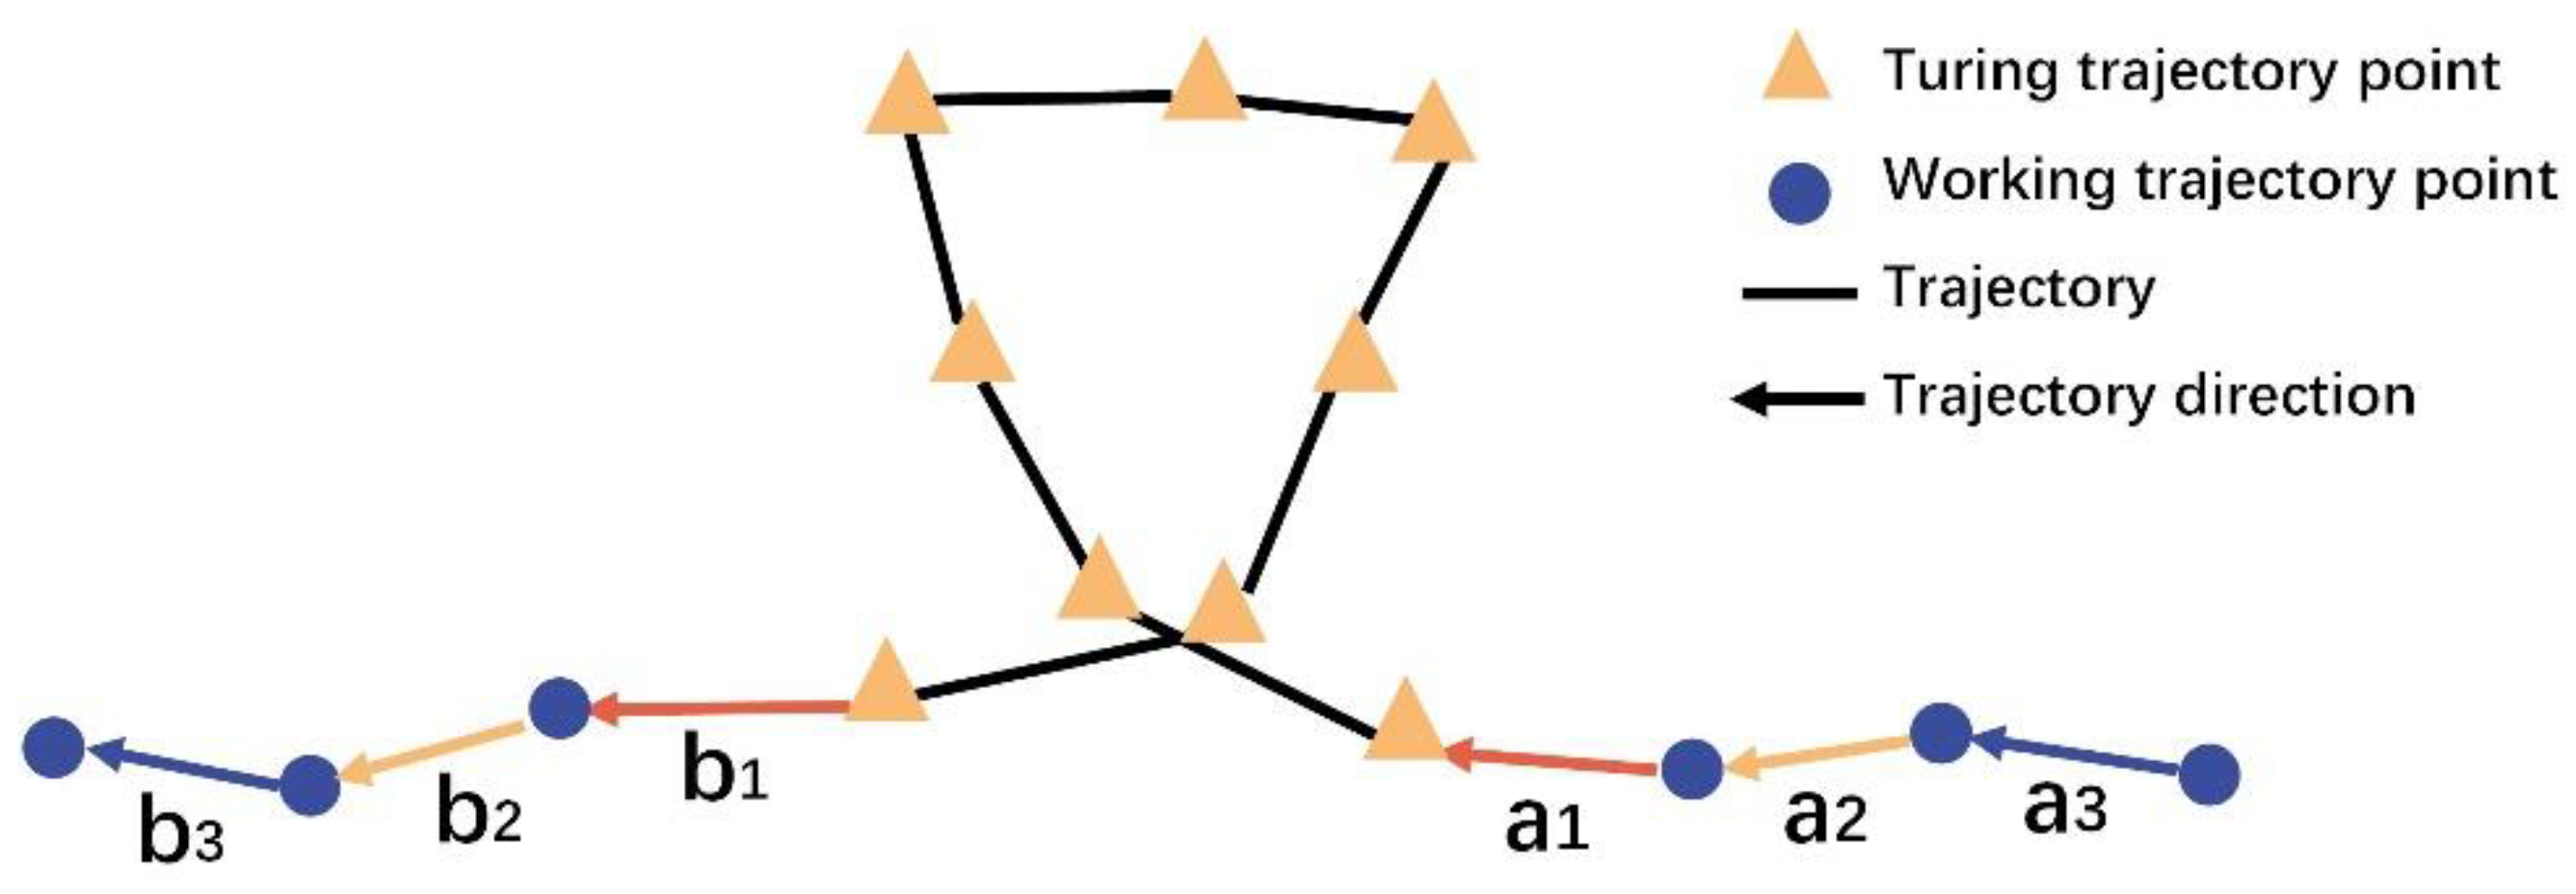
2.4.3. M3 Correction Based on the Working Characteristics of the Harvester
- (1)
- Trajectory fragmentation: The trajectory points that are consecutive in the time series and all belong to “turning” are divided into a set of trajectory fragments.
- (2)
- Constructing features: Features are constructed with and (Euclidean distance between each trajectory point and its previous trajectory point on the time series) as attributes for each trajectory point.
- (3)
- Locating the inflection points: Search for the inflection points in each “turning” trajectory that belong to the first clustering result and find the inflection points that appear for the first time and the last time in each “turning” trajectory segment.
- (4)
- Correction of “turning” trajectory point: The trajectory point between 3.4 m before the first turning point and 3.4 m after the last turning point is determined as the “turning” trajectory point according to the property. For the trajectory containing multiple trajectory points, the length of the trajectory is calculated as the sum of the Euclidean distance of two adjacent trajectory points. In this case, the data structure of the trajectory points is .
3. Results and Discussion
3.1. Performance Metrics
3.2. Comparisons
3.2.1. Method Comparisons
3.2.2. Data Comparisons
3.3. Application and Extension
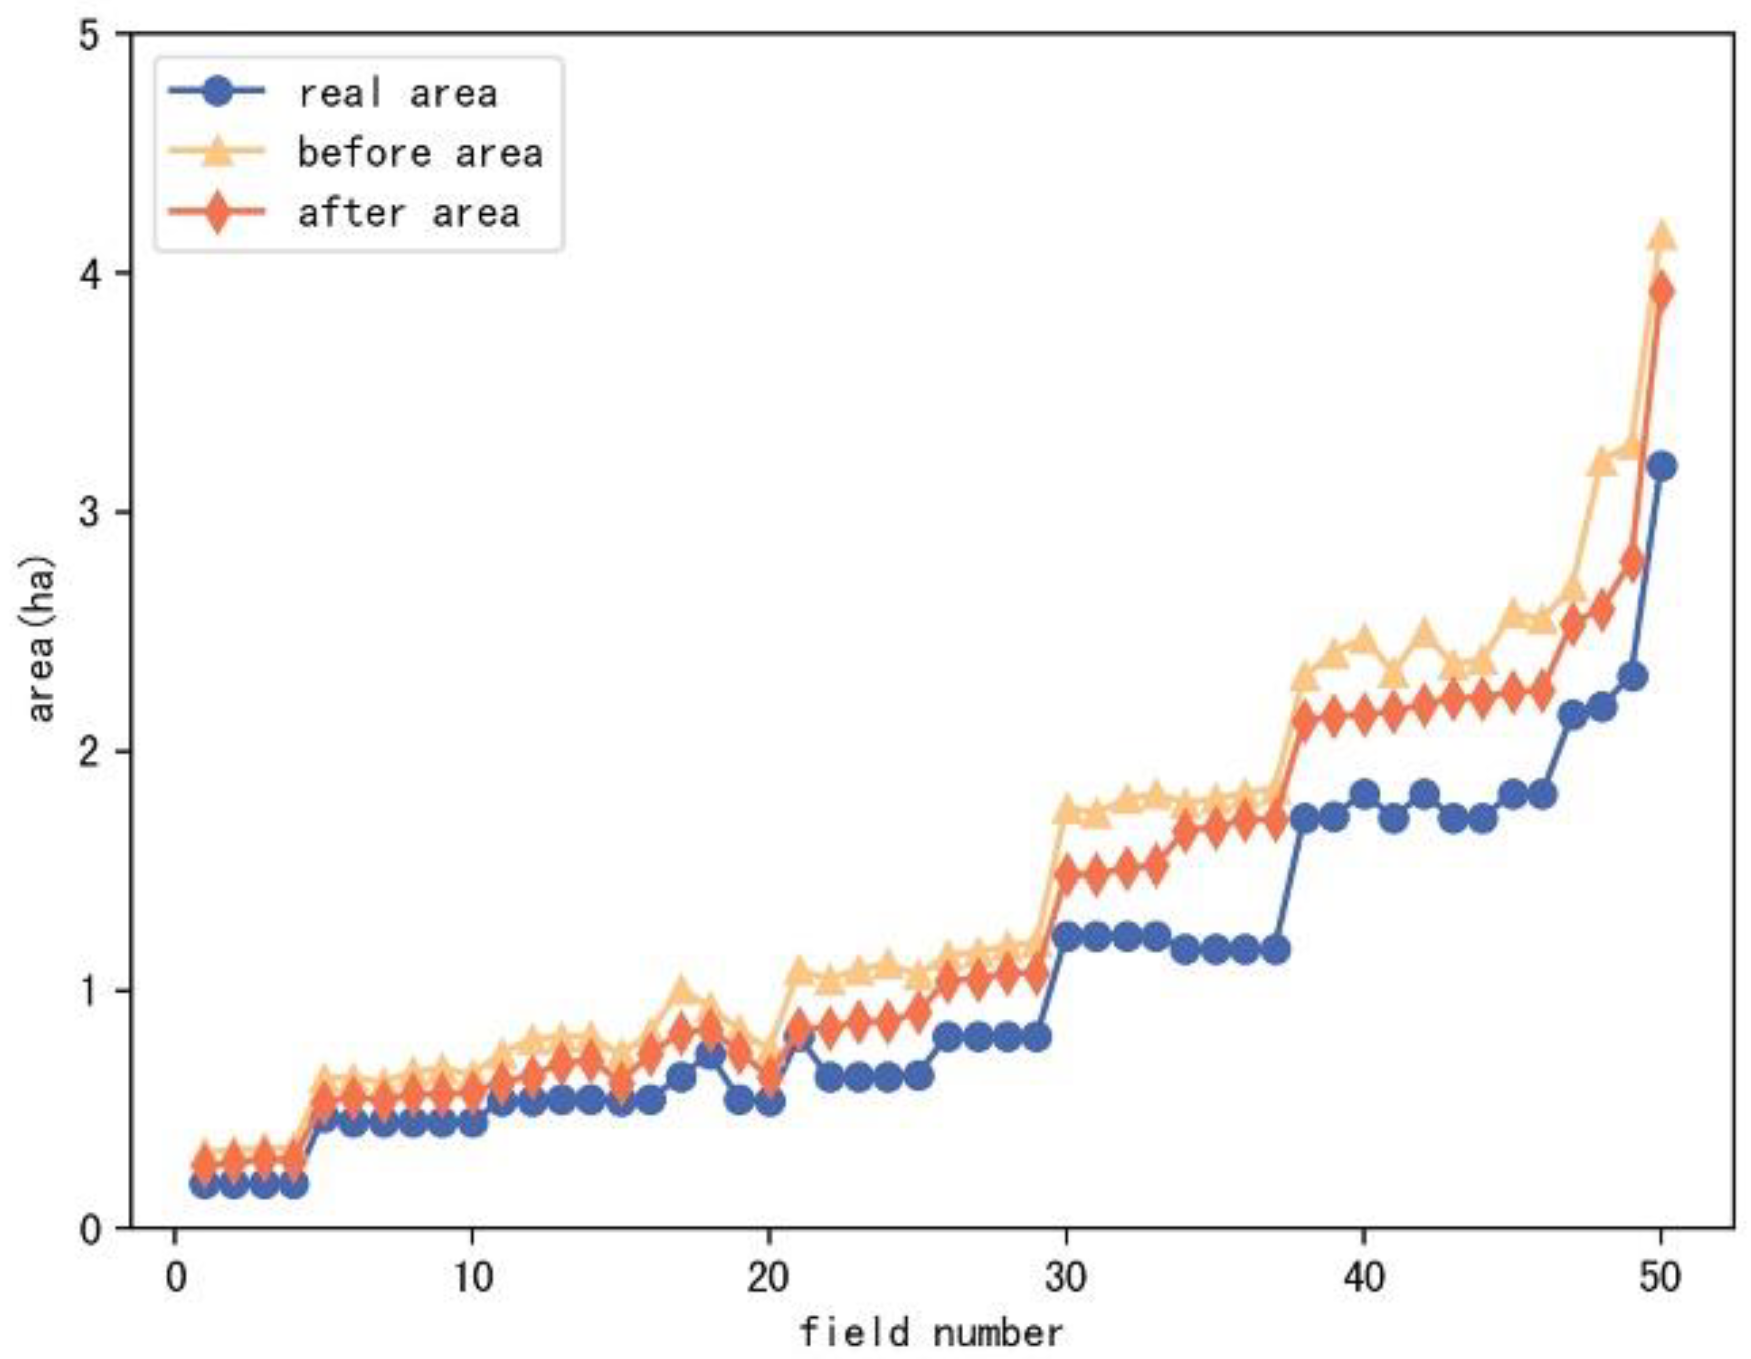
3.3.1. Area calculation Application
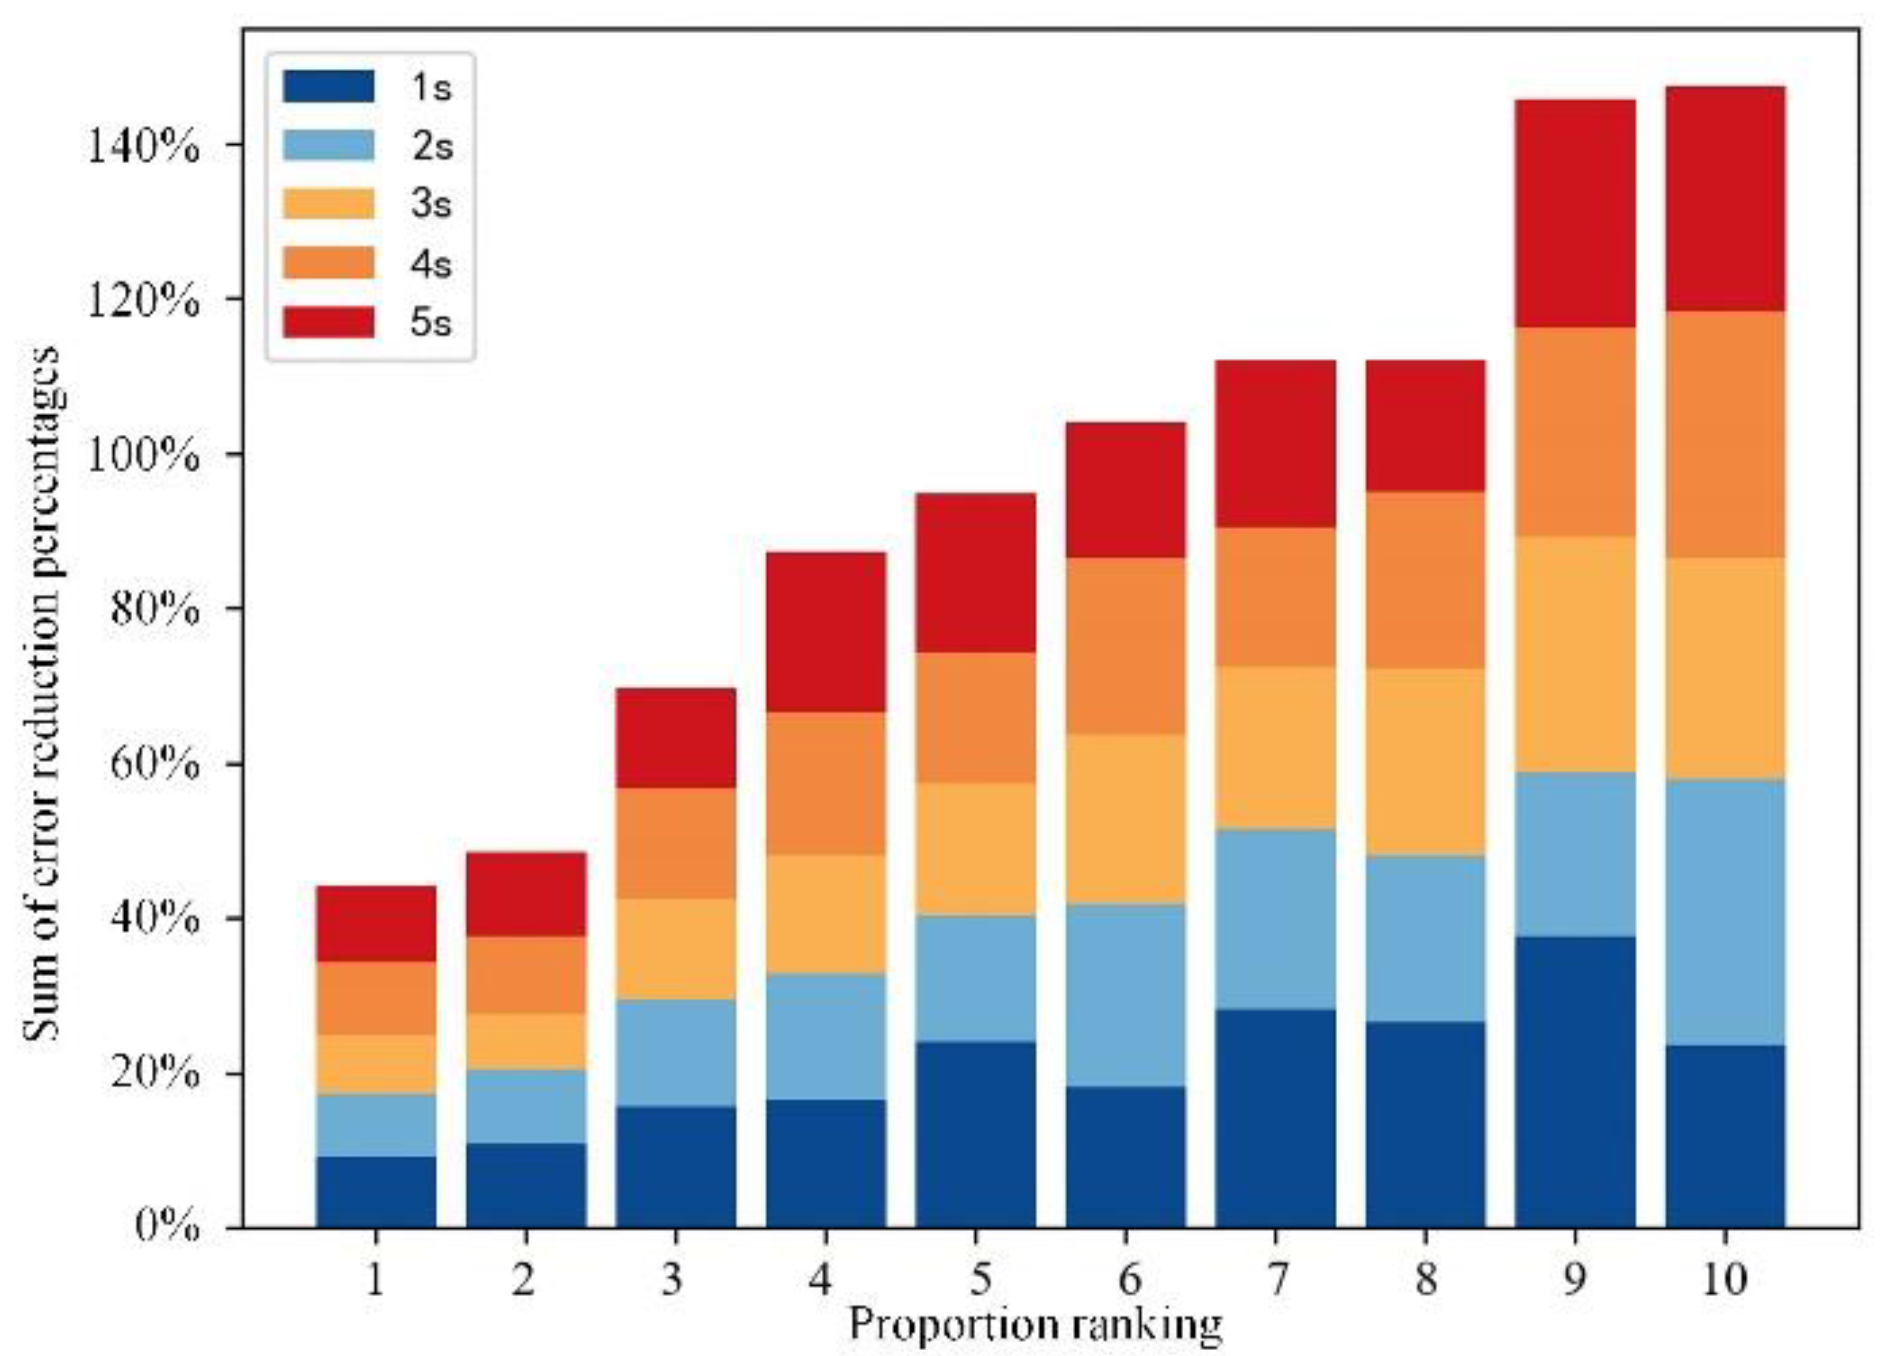
3.3.2. Data Extension
4. Conclusions
Author Contributions
Funding
Institutional Review Board Statement
Data Availability Statement
Conflicts of Interest
References
- Reith, S.; Frisch, J.; Winkler, B. Revision of the Working Time Classification to Optimize Work Processes in Modern Agriculture. Chem. Eng. Trans. 2017, 58, 121–126. [Google Scholar]
- Michael, F. Kocher Viacheslav Robert D Grisso, Field Efficiency Determination Using Traffic Pattern Indices. Biol. Syst. Eng. 2004, 20, 563. [Google Scholar]
- Duttmann, R.; Brunotte, J.; Bach, M. Spatial Analyses of Field Traffic Intensity and Modeling of Changes in Wheel Load and Ground Contact Pressure in Individual Fields During a Silage Maize Harvest. Soil Tillage Res. 2013, 126, 100–111. [Google Scholar] [CrossRef]
- Kong, Q.; Maimaiti, T.; Zhao, M. Recognition of tractor working condition based on convolutional neural network. China Agric. Mach. Chem. News 2021, 42, 144–150. [Google Scholar]
- Chen, Y.; Zhang, X.; Wu, C.; Li, G. Field-Road Trajectory Segmentation for Agricultural Machinery Based On Direction Distribution. Comput. Electron. Agric. 2021, 186, 106180. [Google Scholar] [CrossRef]
- Zhang, X.; Chen, Y.; Jia, J.; Kuang, K.; Lan, Y.; Wu, C. Multi-View Density-Based Field-Road Classification for Agricultural Machinery: DBSCAN and Object Detection. Comput. Electron. Agric. 2022, 200, 107263. [Google Scholar] [CrossRef]
- Poteko, J.; Eder, D.; Noack, P.O. Identifying Operation Modes of Agricultural Vehicles Based On GNSS Measurements. Comput. Electron. Agric. 2021, 185, 106105. [Google Scholar] [CrossRef]
- Chen, Y.; Li, G.; Zhang, X.; Jia, J.; Zhou, K.; Wu, C. Identifying Field and Road Modes of Agricultural Machinery Based On GNSS Recordings: A Graph Convolutional Neural Network Approach. Comput. Electron. Agric. 2022, 198, 107082. [Google Scholar] [CrossRef]
- Jensen, M.A.F.; Bochtis, D. Automatic Recognition of Operation Modes of Combines and Transport Units Based On GNSS Trajectories. IFAC Proc. Vol. 2013, 46, 213–218. [Google Scholar] [CrossRef]
- LiYang, l.; Tian, W.; Zhai, W.; Wang, X.; Chen, Z.; Wen, L.; Xu, Y.; Wu, C. Behavior Recognition and Fuel Consumption Prediction of Tractor Sowing Operations Using Smartphone. Int. J. Agric. Biol. Eng. 2022, 15, 154–162. [Google Scholar]
- Wang, P.; Meng, Z.; Yin, Y.; Fu, W.; Chen, J.; Wei, X. Automatic recognition algorithm of field operation status based on spatial track of agricultural machinery and corresponding experiment. J. Agric. Eng. 2015, 31, 56–61. [Google Scholar]
- Taylor, R.K.; Schrock, M.D.; Staggenborg, S.A. Extracting Machinery Management Information From GPS Data; American Society of Agricultural and Biological Engineers: St. Joseph, MI, USA, 2002. [Google Scholar]
- Li, Y. Research on Lean Operation and Key Problems of Field Crop Mechanized Collection and Transportation System. Doctor’s Thesis, Chongqing University, Chongqing, China, 2015. [Google Scholar]
- Tian, W. Study on Driving Conditions and Fuel Consumption of Agricultural Machinery Based on Machine Learning. Master’s Thesis, China Agricultural University, Beijing, China, 2022. [Google Scholar]
- Shen, Y.; Mercatoris, B.; Cao, Z.; Kwan, P.; Guo, L.; Yao, H.; Cheng, Q. Improving Wheat Yield Prediction Accuracy Using LSTM-RF Framework Based on UAV Thermal Infrared and Multispectral Imagery. Agriculture 2022, 12, 892. [Google Scholar] [CrossRef]
- Nehrey, M.; Zomchak, L. Digital Technology: Emerging Issue for Agriculture. In The International Conference on Artificial Intelligence and Logistics Engineering; Springer: Cham, Switzerland, 2022; pp. 146–156. [Google Scholar]
- Qing, Y.; Li, Y.; Yang, Y.; Xu, L.; Ma, Z. Development and experiments on reel with improved tine trajectory for harvesting oilseed rape. Biosyst. Eng. 2021, 206, 19–31. [Google Scholar] [CrossRef]
- Ding, Q.; Ding, W.; Yang, W.; Li, Y.; Tian, Y.; Zhu, Y. Mechanization characteristics of farmland fragmentation conditions—Investigation on field operation behavior of small harvesters. Zhejiang Agric. J. 2013, 25, 1397–1403. [Google Scholar]
- Lovor Heavy Industries Co. Lovol Gushen Self-Propelled Grain Combine Harvester Manual; Lovor Heavy Industries Co.: Shandong, China, 2017. [Google Scholar]
- Lu, W.; Su, H.; Yang, X.; Yan, X. Subsurface Temperature Estimation From Remote Sensing Data Using a Clustering-Neural Network Method. Remote Sens. Environ. 2019, 229, 213–222. [Google Scholar] [CrossRef]
- Sinaga, K.P.; Yang, M. Unsupervised K-Means Clustering Algorithm. IEEE Access 2020, 8, 80716–80727. [Google Scholar] [CrossRef]
- Gu, C.; Qi, J.; Zhao, Y.; Yin, W.; Zhu, S. Estimation of the Mixed Layer Depth in the Indian Ocean from Surface Parameters: A Clustering-Neural Network Method. Sensors 2022, 22, 5600. [Google Scholar] [CrossRef] [PubMed]
- Zhang, Z. Trajectory data mining research based on K-Means and DBSCAN. China’s Strateg. Emerg. Ind. 2017, 44, 113–114. [Google Scholar]
- Zhou, X. Research on Big Data Reduction Based on Voting Mechanism and Open Source Framework. Master’s Thesis, Hebei University, Baoding, China, 2021. [Google Scholar]
- Liu, H.; Meng, Z.; Wang, P.; Wei, X.; Han, Y. Buffer area algorithm based on agricultural machinery space trajectory. J. Agric. Eng. 2015, 31, 180–184. [Google Scholar]
- Wu, C.; Chen, Y.; Yang, W. Construction of big data system of agricultural machinery based on BeiDou. J. Agric. Eng. 2022, 38, 1–8. [Google Scholar]


| Method | Precision | Recall | F1-Score |
|---|---|---|---|
| D-K-means | 0.53 | 0.62 | 0.55 |
| D-K-means + M1 | 0.53 | 0.63 | 0.56 |
| D-K-means + M1 + M2 | 0.85 | 0.94 | 0.88 |
| D-K-means + M1 + M2 + M3 | 0.93 | 0.96 | 0.95 |
| Time Interval | Turing | Working | Abnormal Working | ||||||
|---|---|---|---|---|---|---|---|---|---|
| Precision | Recall | f1-Score | Precision | Recall | f1-Score | Precision | Recall | f1-Score | |
| 1 s | 0.84 | 0.98 | 0.90 | 1.00 | 0.96 | 0.98 | 0.92 | 0.97 | 0.94 |
| 2 s | 0.94 | 0.95 | 0.95 | 0.99 | 0.99 | 0.99 | 0.90 | 0.94 | 0.92 |
| 3 s | 0.94 | 0.93 | 0.93 | 0.98 | 0.98 | 0.98 | 0.84 | 0.98 | 0.90 |
| 4 s | 0.94 | 0.96 | 0.95 | 0.99 | 0.98 | 0.99 | 0.90 | 0.96 | 0.93 |
| 5 s | 0.92 | 0.97 | 0.94 | 0.99 | 0.98 | 0.99 | 0.90 | 0.94 | 0.91 |
Publisher’s Note: MDPI stays neutral with regard to jurisdictional claims in published maps and institutional affiliations. |
© 2022 by the authors. Licensee MDPI, Basel, Switzerland. This article is an open access article distributed under the terms and conditions of the Creative Commons Attribution (CC BY) license (https://creativecommons.org/licenses/by/4.0/).
Share and Cite
Yang, L.; Wang, X.; Li, Y.; Xie, Z.; Xu, Y.; Han, R.; Wu, C. Identifying Working Trajectories of the Wheat Harvester In-Field Based on K-Means Algorithm. Agriculture 2022, 12, 1837. https://doi.org/10.3390/agriculture12111837
Yang L, Wang X, Li Y, Xie Z, Xu Y, Han R, Wu C. Identifying Working Trajectories of the Wheat Harvester In-Field Based on K-Means Algorithm. Agriculture. 2022; 12(11):1837. https://doi.org/10.3390/agriculture12111837
Chicago/Turabian StyleYang, Lili, Xinxin Wang, Yuanbo Li, Zhongxiang Xie, Yuanyuan Xu, Rongxin Han, and Caicong Wu. 2022. "Identifying Working Trajectories of the Wheat Harvester In-Field Based on K-Means Algorithm" Agriculture 12, no. 11: 1837. https://doi.org/10.3390/agriculture12111837