Article

Phenology Based Variability of Tissue Nutrient Content in Mature Muscadine Vines (Vitis rotundifolia cv. Carlos)

by
Kyle Austin Freedman
1,
Tekan Singh Rana
2 and
Mark Hoffmann
1,*
1
Department of Horticultural Science, North Carolina State University, 2721 Founders Drive, Raleigh, NC 27695, USA
2
Department of Applied Science and Technology, North Carolina A&T State University, 1601 E Market Street, Greensboro, NC 27411, USA
*
Author to whom correspondence should be addressed.
Agriculture 2022, 12(11), 1805; https://doi.org/10.3390/agriculture12111805
Submission received: 18 October 2022 / Accepted: 26 October 2022 / Published: 29 October 2022

Abstract

:
Muscadine (Vitis rotundifolia) is a grape species that is native to the Southeastern US, where several cultivars are grown commercially for processing or direct consumption. Phenology based tissue analysis to determine the nutritional status of a vine is a critical tool for growers to understand fertilizer demands in a vineyard. For European-style wine grapes, tissue sampling for nutrient content is well researched. However, current tissue sampling recommendations for muscadines are solely based on anecdotal knowledge. It is currently unknown if the type of tissue collected has an impact on variability and content of nutrients. Questions also remain as to whether or not seasonal vine phenology impacts tissue nutrient content. Without this knowledge it is difficult for a muscadine grower to make informed decisions on the nutritional status of a muscadine vine. Therefore, we investigated the impact of the phenological vine stage (bloom, fruit set, véraison) on nutrient content in two different tissue types (mature leaf vs. petiole), sampled at two different positions on a muscadine vine (opposite of cluster vs. shoot). The study was conducted over two growing seasons (2019 and 2020) in a commercial mature muscadine vineyard (‘Carlos’). Our results show that over both study years, the highest variability in nutrient content was found during bloom (May–June), while nutrient variability was lower during fruit-set and veraison. We also found fully mature leaf samples showed a lower variability in nutrient tissue content. Based on our results, sampling fully mature leafs from shoots remains the best practice. However, our results also indicate that tissue sampling later in the season might be a better practice, compared to the current practice of taking samples during June.

1. Introduction

Muscadine grapes (Vitis rotundifolia Michx.) are native to the Southern US [1] and have been utilized for processing or fresh-consumption for several centuries. Today, more than 30 muscadine cultivars are commonly grown for either fresh-market or processing purposes [1,2,3]. Optimal nutrition of grapevines is important for vineyards as it positively affects vine growth, yield, disease tolerance and quality [4,5,6,7]. For example, an excess of available nitrogen (N) increases plant vigor, reduces fruit/wine/juice quality, delays fruit ripening and increases disease incidence. Insufficient N supply however reduces vigor, leads to leaf chlorosis and reduced berry size. Similarly, optimal potassium (K) supply can increase cluster weight, whereas an excess can lead to unwanted pH in grape juice, adversely affecting wine quality, while low K supply reduces berry sugar and color compounds [4,6,7]. Excessive nutrition (fertilizer application) negatively affects farm economy and causes environmental pollution [3,4]. Thus, nutrient management is one of the most critical factors for sustainability of a vineyard.
Plant tissue analysis is a reliable and widely used method to assess grapevine nutritional status and serves as one of the foundations to manage fertilizer regimes in vineyards [4,5,6,7,8,9]. In wine grapes, both leaf blades and petioles are used to assess leaf nutrient concentration [4,5,7,8,9]. Current recommendations for leaf tissue sampling to assess the nutrient status of grapevines advise to sample at least two times per year, during bloom from the opposite of the first or second basal fruit cluster, and the youngest fully mature leaf from a primary shoot 80–90 days later, often around véraison [5,10,11]. In wine grapes, seasonal variation in tissue nutrient concentration is known [5,8,12,13], as are nutrient levels related to tissue type [12], leaf position on a shoot [10,14], cultivar [7,15,16], and local growing conditions [4]. Thus, tissue-sampling methods for wine grapes have been widely studied [4,5,6,7,8,9,10,11,12,13,14,15,16,17].
In muscadines, however, there is a significant lack of standardization of tissue sampling methods and timing for the assessment of vineyard nutrition status [18,19,20,21,22]. Consequently, current recommendations of nutrient sufficiency ranges and tissue sampling time are based primarily on anecdotal knowledge [23,24,25,26], recommending whole leaf tissue sampling based on calendar month (June or early July), rather than on phenological stage of the vine [3,24]. Research to develop nutrient sufficiency ranges for muscadine production is mostly based on those of Jones and Mills from 1996 [3,27]. These are limited to macro and micronutrient ranges during bloom only. The need for additional research to establish tissue nutrient concentration thresholds for fertilizer application timing has been suggested (27). Here, we hypothesize that nutrient concentrations in muscadine leaf tissue are highly dependent on vine phenology and tissue type. Therefore, we investigated the dynamics of tissue nutrient concentration related to the tissue type and sample position of mature muscadine vines (V. rotundifolia cv. ‘Carlos’) over different phenological growth stages. The two objectives of this study were: (i) To assess the variability of the tissue nutrient concentration over three vine phenological growth stages (bloom, fruit set, and véraison). (ii) To investigate differences in tissue nutrient concentration between full leaf and petiole samples from two sample positions on a shoot.

2. Materials and Methods

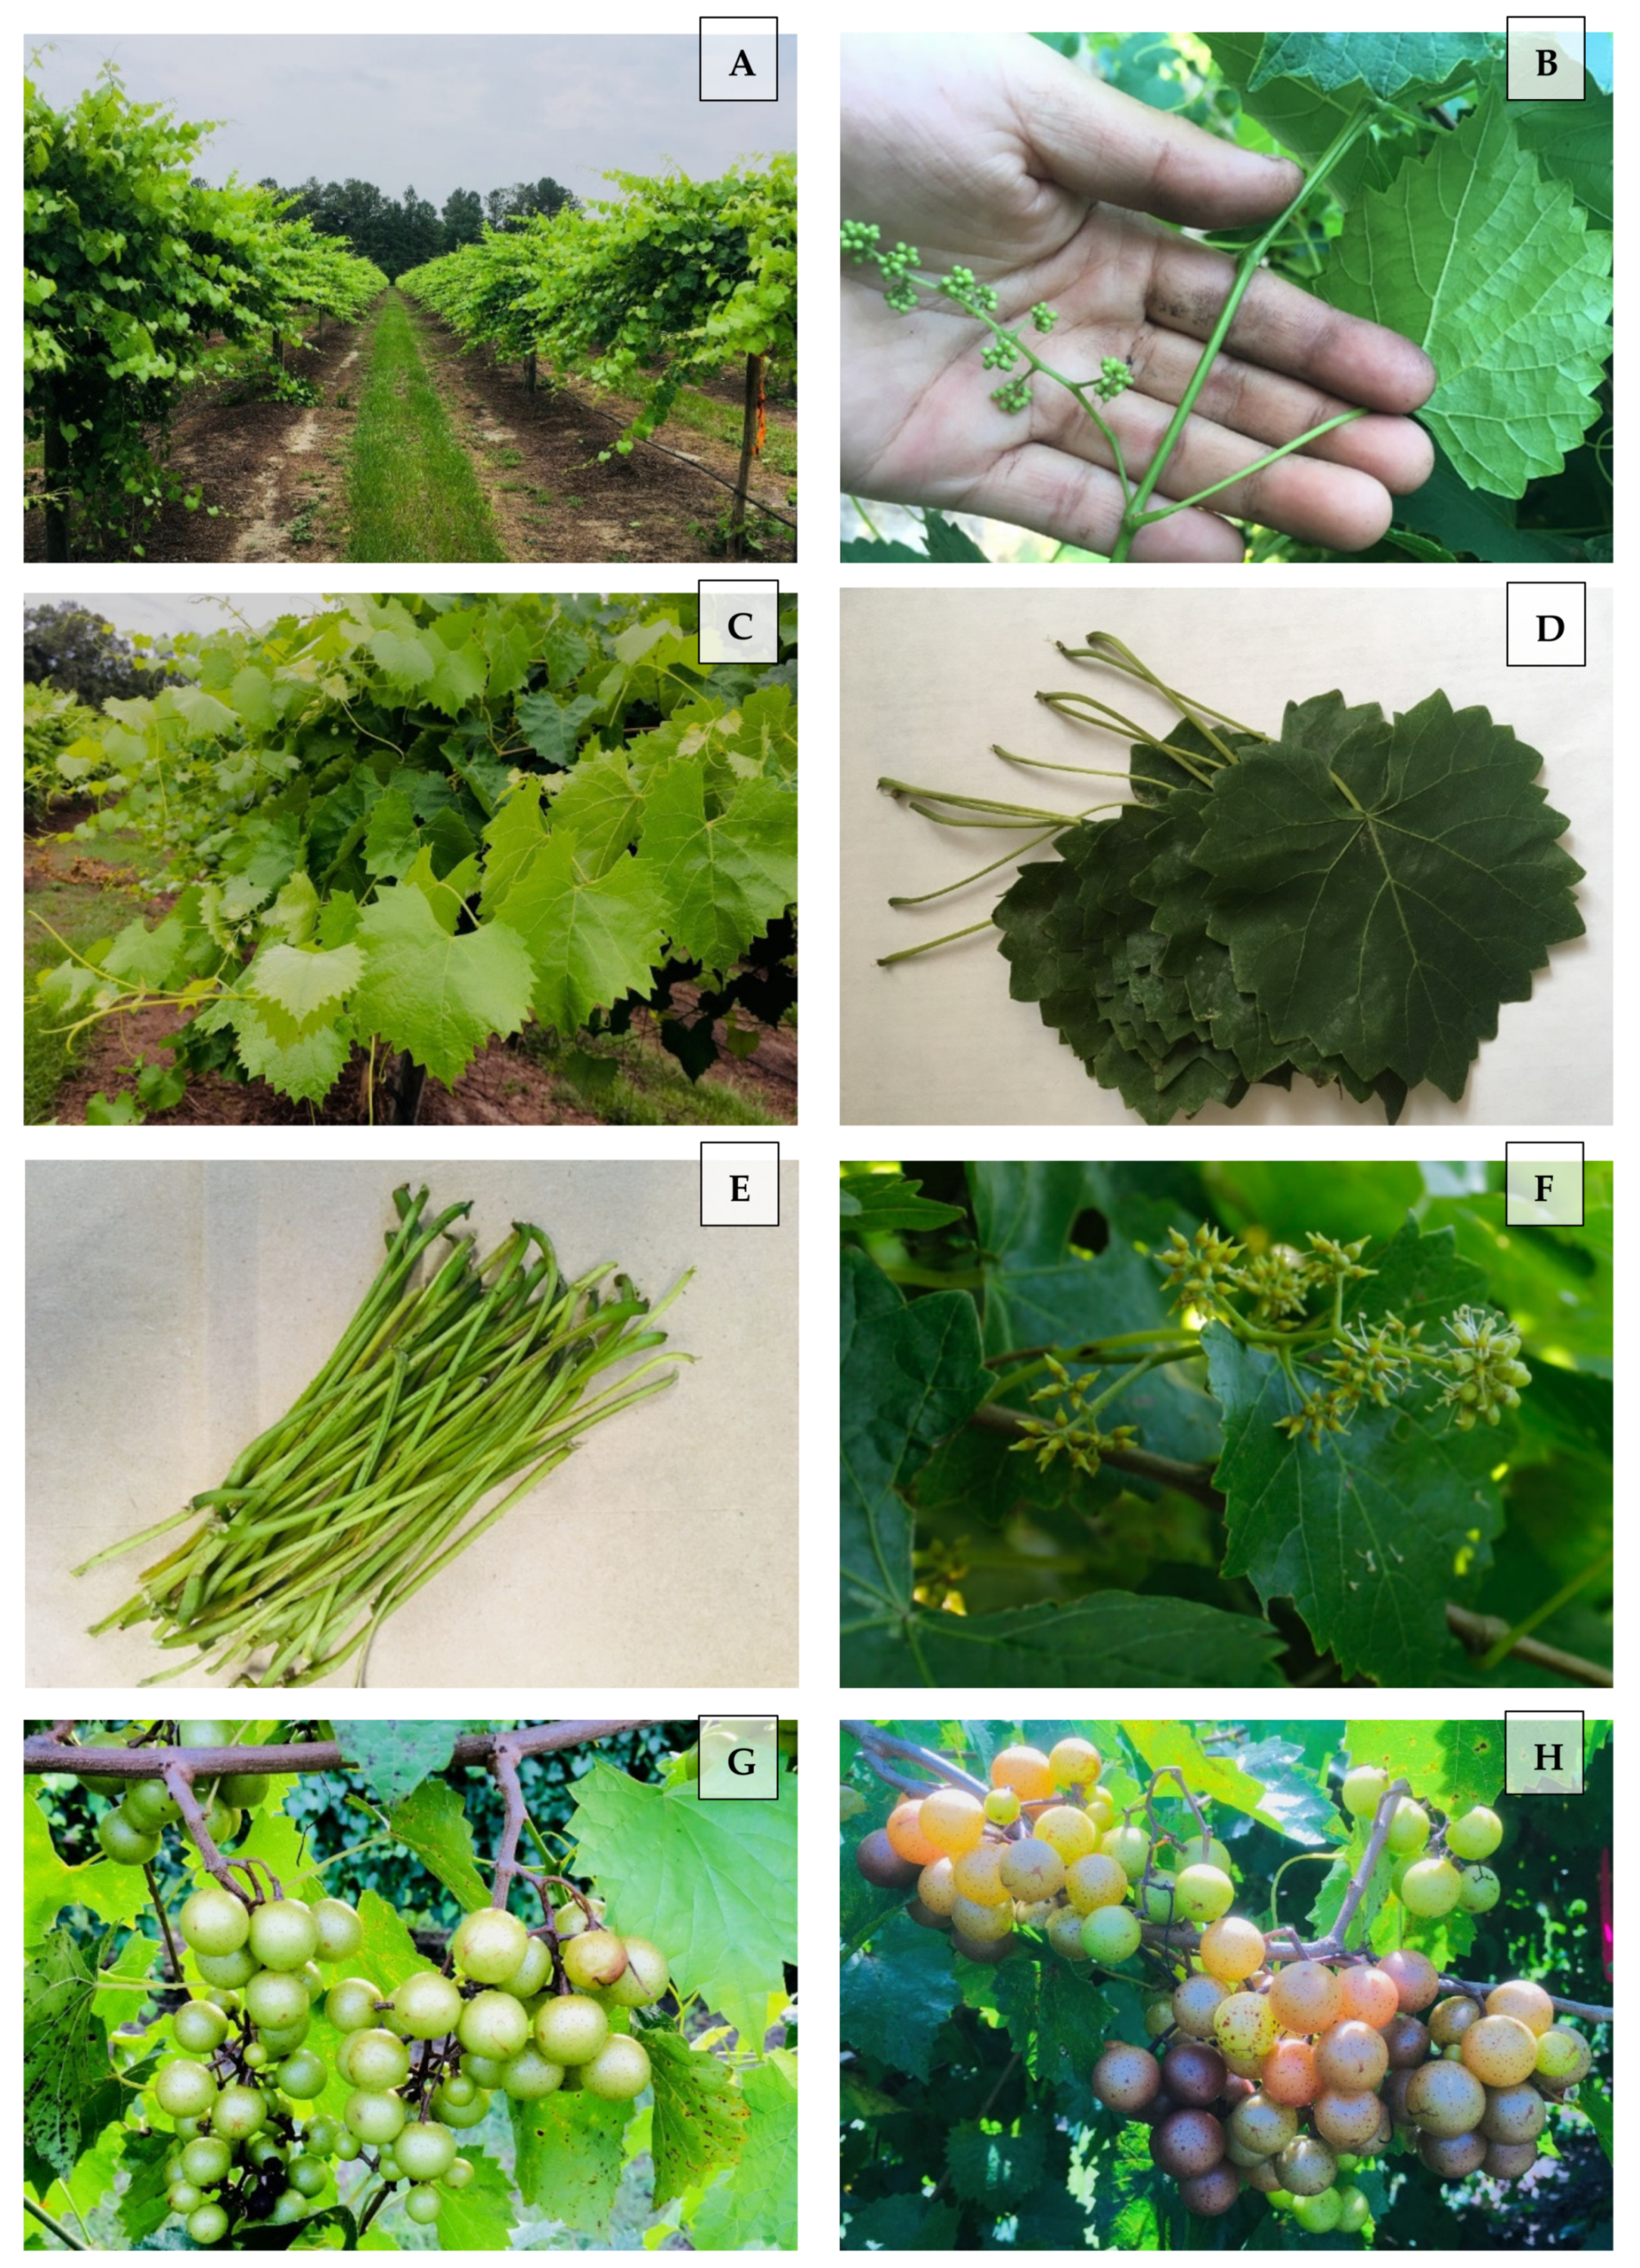
2.1. Field Conditions

A two-year field trial was established in 2019–2020 in a mature (15 year old) muscadine vineyard cv. Carlos in Wagram, North Carolina (34°51′21.7″ N 79°20′46.4″ W, elev. 210 ft) (Figure 1A). The vines were trained in a single high-wire bilateral system 1.8 m above the ground and spur pruned with 100 buds per meter of cordon in the last of week of January to first week of February in 2019 and 2020. Vines were spaced 6.6 m apart, and each cordon had a length of approx. 3.3 m.

2.2. Experimental Design and Tissue Sampling

Two treatments over three phenology stages were developed: sampling positions (opposite of the cluster vs. shoot) (Figure 1B,C) and tissue types (full leaf vs. petiole) (Figure 1D,E). The experimental design was a completely randomized nested design: tissue types were nested inside the sampling positions treatment. Tissues were collected from two sample positions on three growth stages (bloom, fruit set, and véraison) (Figure 1F–H) on 6 June, 26 July, and 30 August of 2019 and on 22 June, 27 July, and 2 September of 2020, respectively. For each phenology stage, 28 samples for each tissue type and sample position were taken from 56 plants. Each sample contained 40 full leaves and 50 petioles. Tissue samples for first mature full leaves were collected from the 5th to 7th leaves or petioles from the tip of the shoot and samples for opposite of cluster were collected from opposite of basal clusters (1st–4th from the base).

2.3. Measurement of Tissue Nutrient Concentration

The collected tissues were cleaned and stored at room temperature overnight and sent to the North Carolina Department of Agriculture & Consumer Services, Raleigh, NC, USA for nutrient content analysis. Upon receipt, samples were examined for condition (mold, inadequate mass for analysis) and correct plant part. Prior to homogenization of plant material by grinding, samples were dried overnight (12–24 h) at 80 °C. Each sample was then processed through a stainless-steel grinder with a 20-mesh (1 mm) screen (Campbell and Plank 1992). Samples were ground on a cutting-grinding mill (IKA Works, Inc.; Wilmington, NC, USA). The dried, ground plant material was stored at room temperature in a 7-dram plastic snap cap vial (~26 cm3) until analysis. Tissue samples were analyzed for content of macronutrients: nitrogen (N), phosphorous (P), potassium (K), Calcium (Ca), Sulfur (S) and Magensium (Mg). Content is displayed as percent of dry mass. Tissue samples were also analyzed for content of micronutrients: Iron (Fe), Manganese (Mn), Zinc (Zn), Copper (Cu) and Boron (B), displayed in parts per million (ppm). Nutrient analysis methods are described in detail in [28].

2.4. Statistical Analysis

Data were analyzed with an multivariate ANOVA with PROC GLLIMMIX in SAS (SAS Institute, Cary, NC, USA), followed by a Tukey (p < 0.05) post hoc test. Data visualization was performed using Sigma Plot 14.0 (Sigma-Aldrich, St. Louis, MO, USA).

3. Results

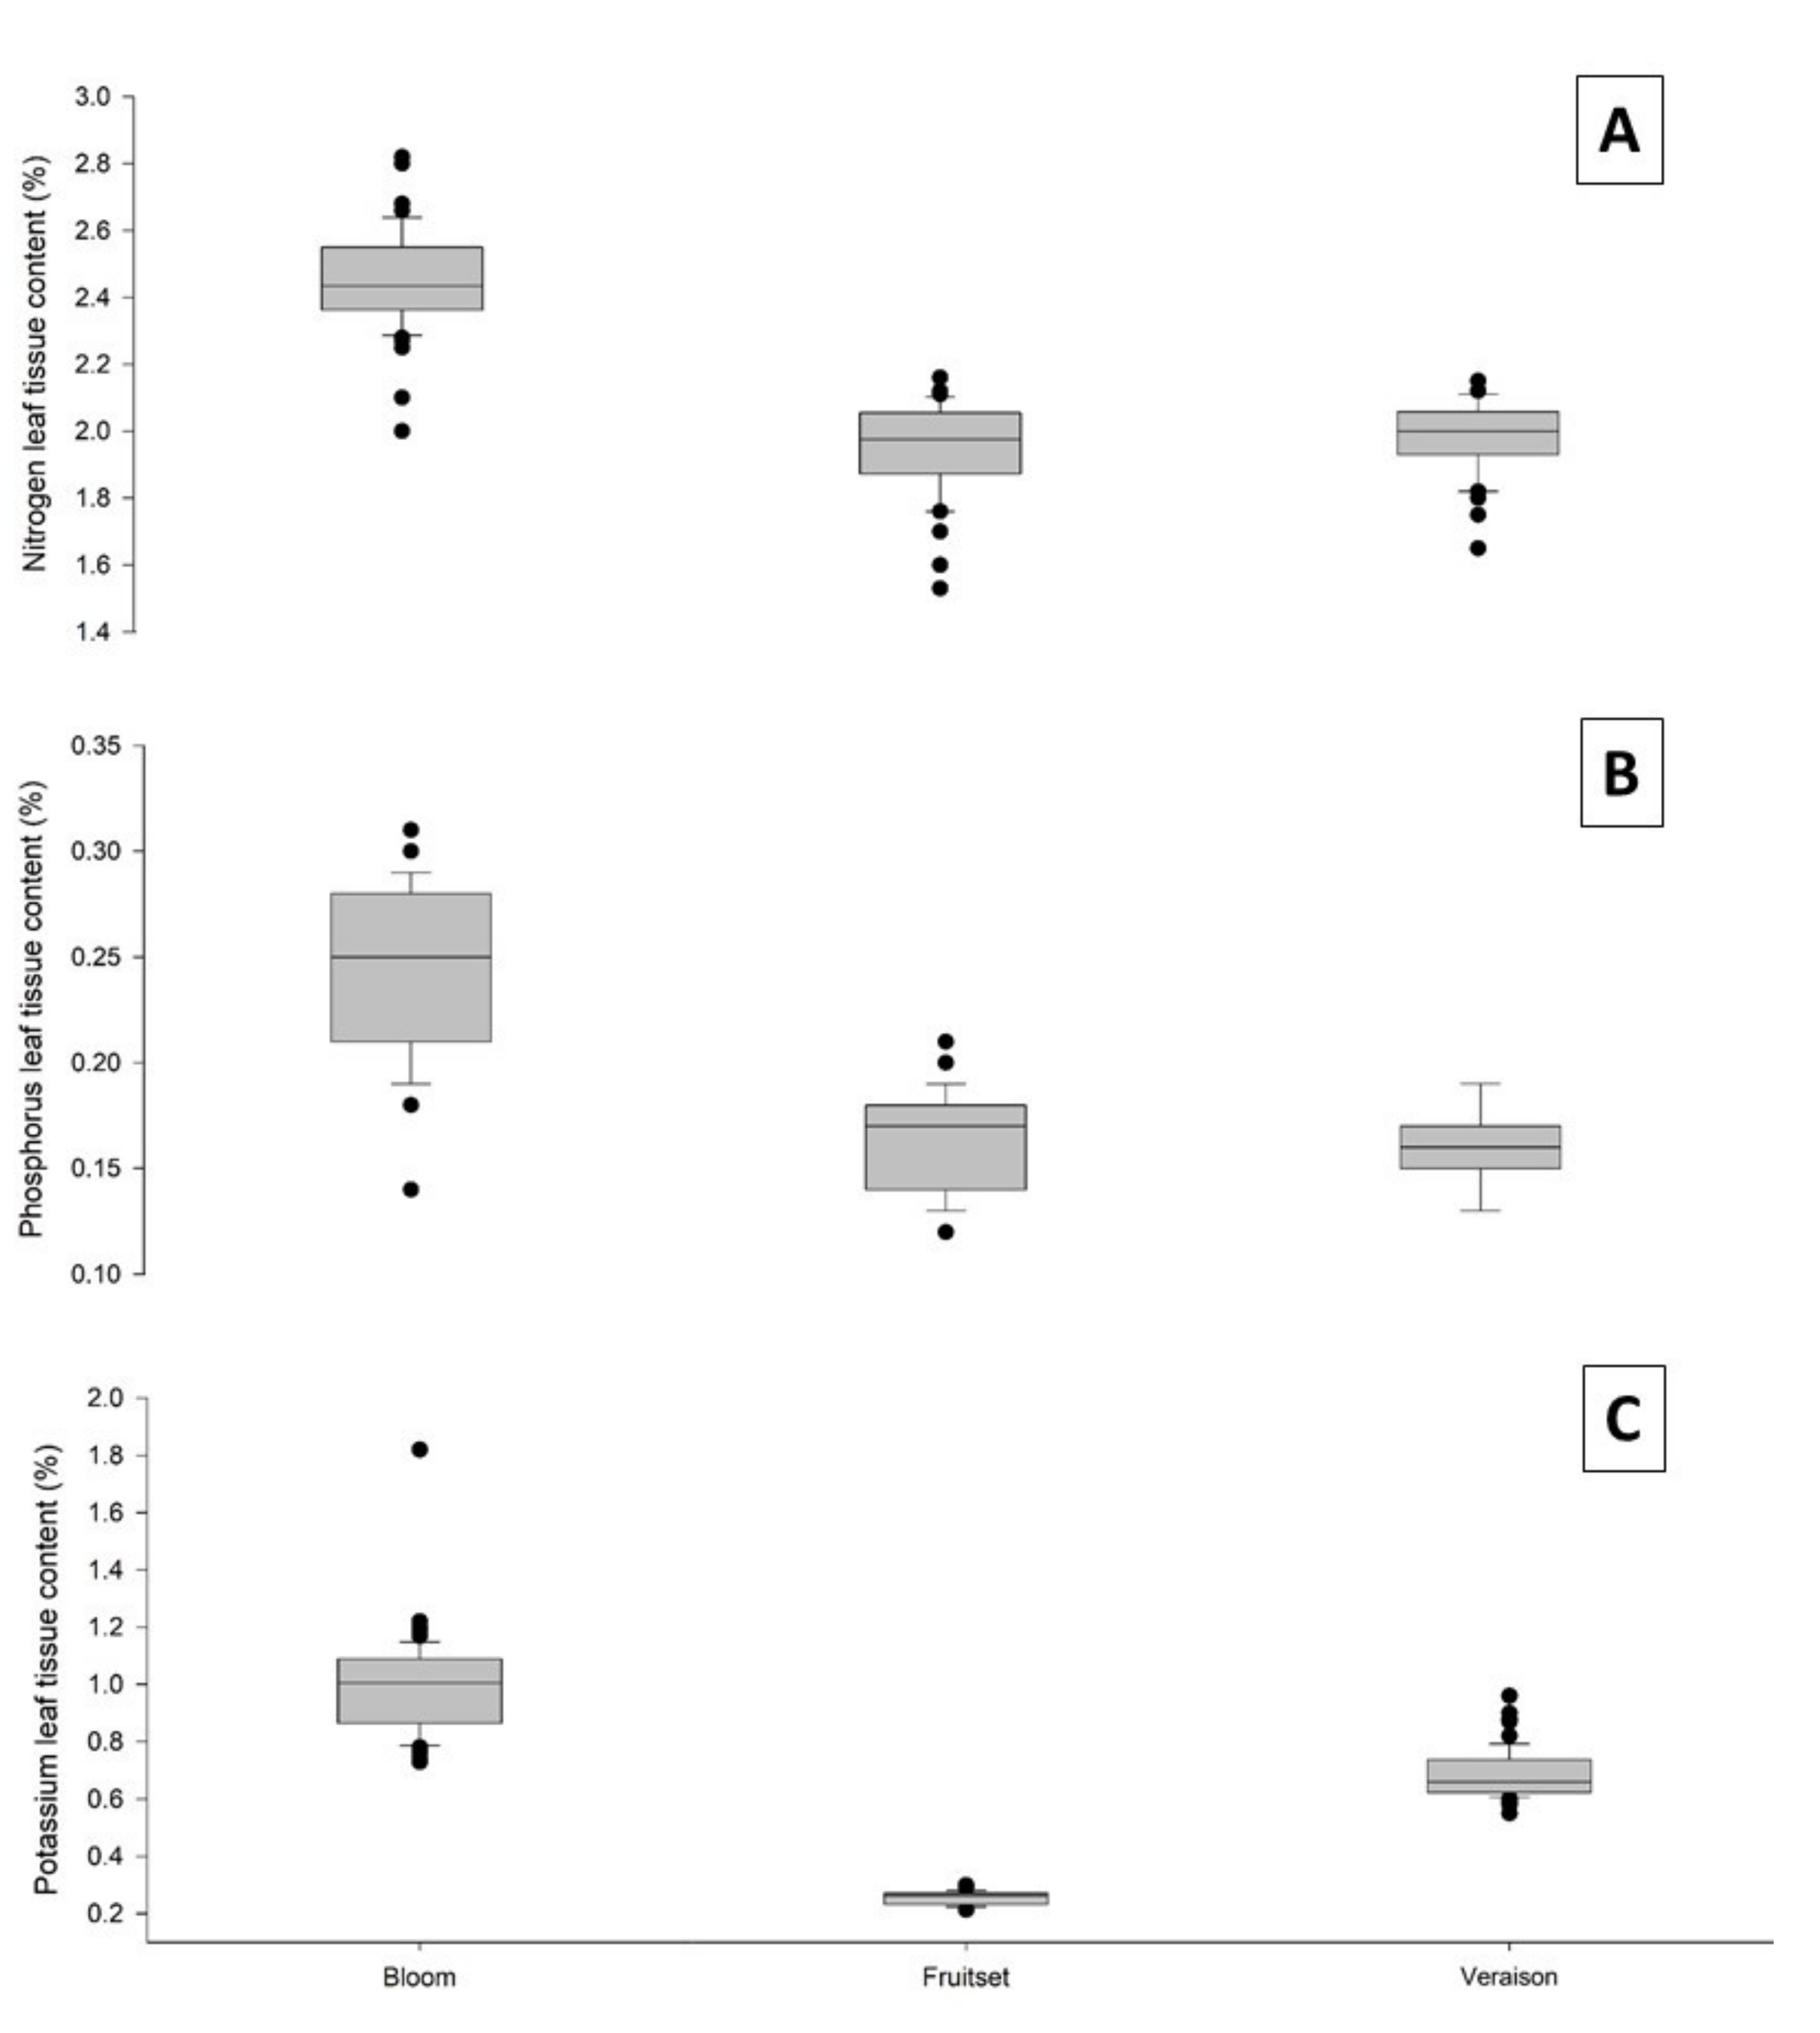
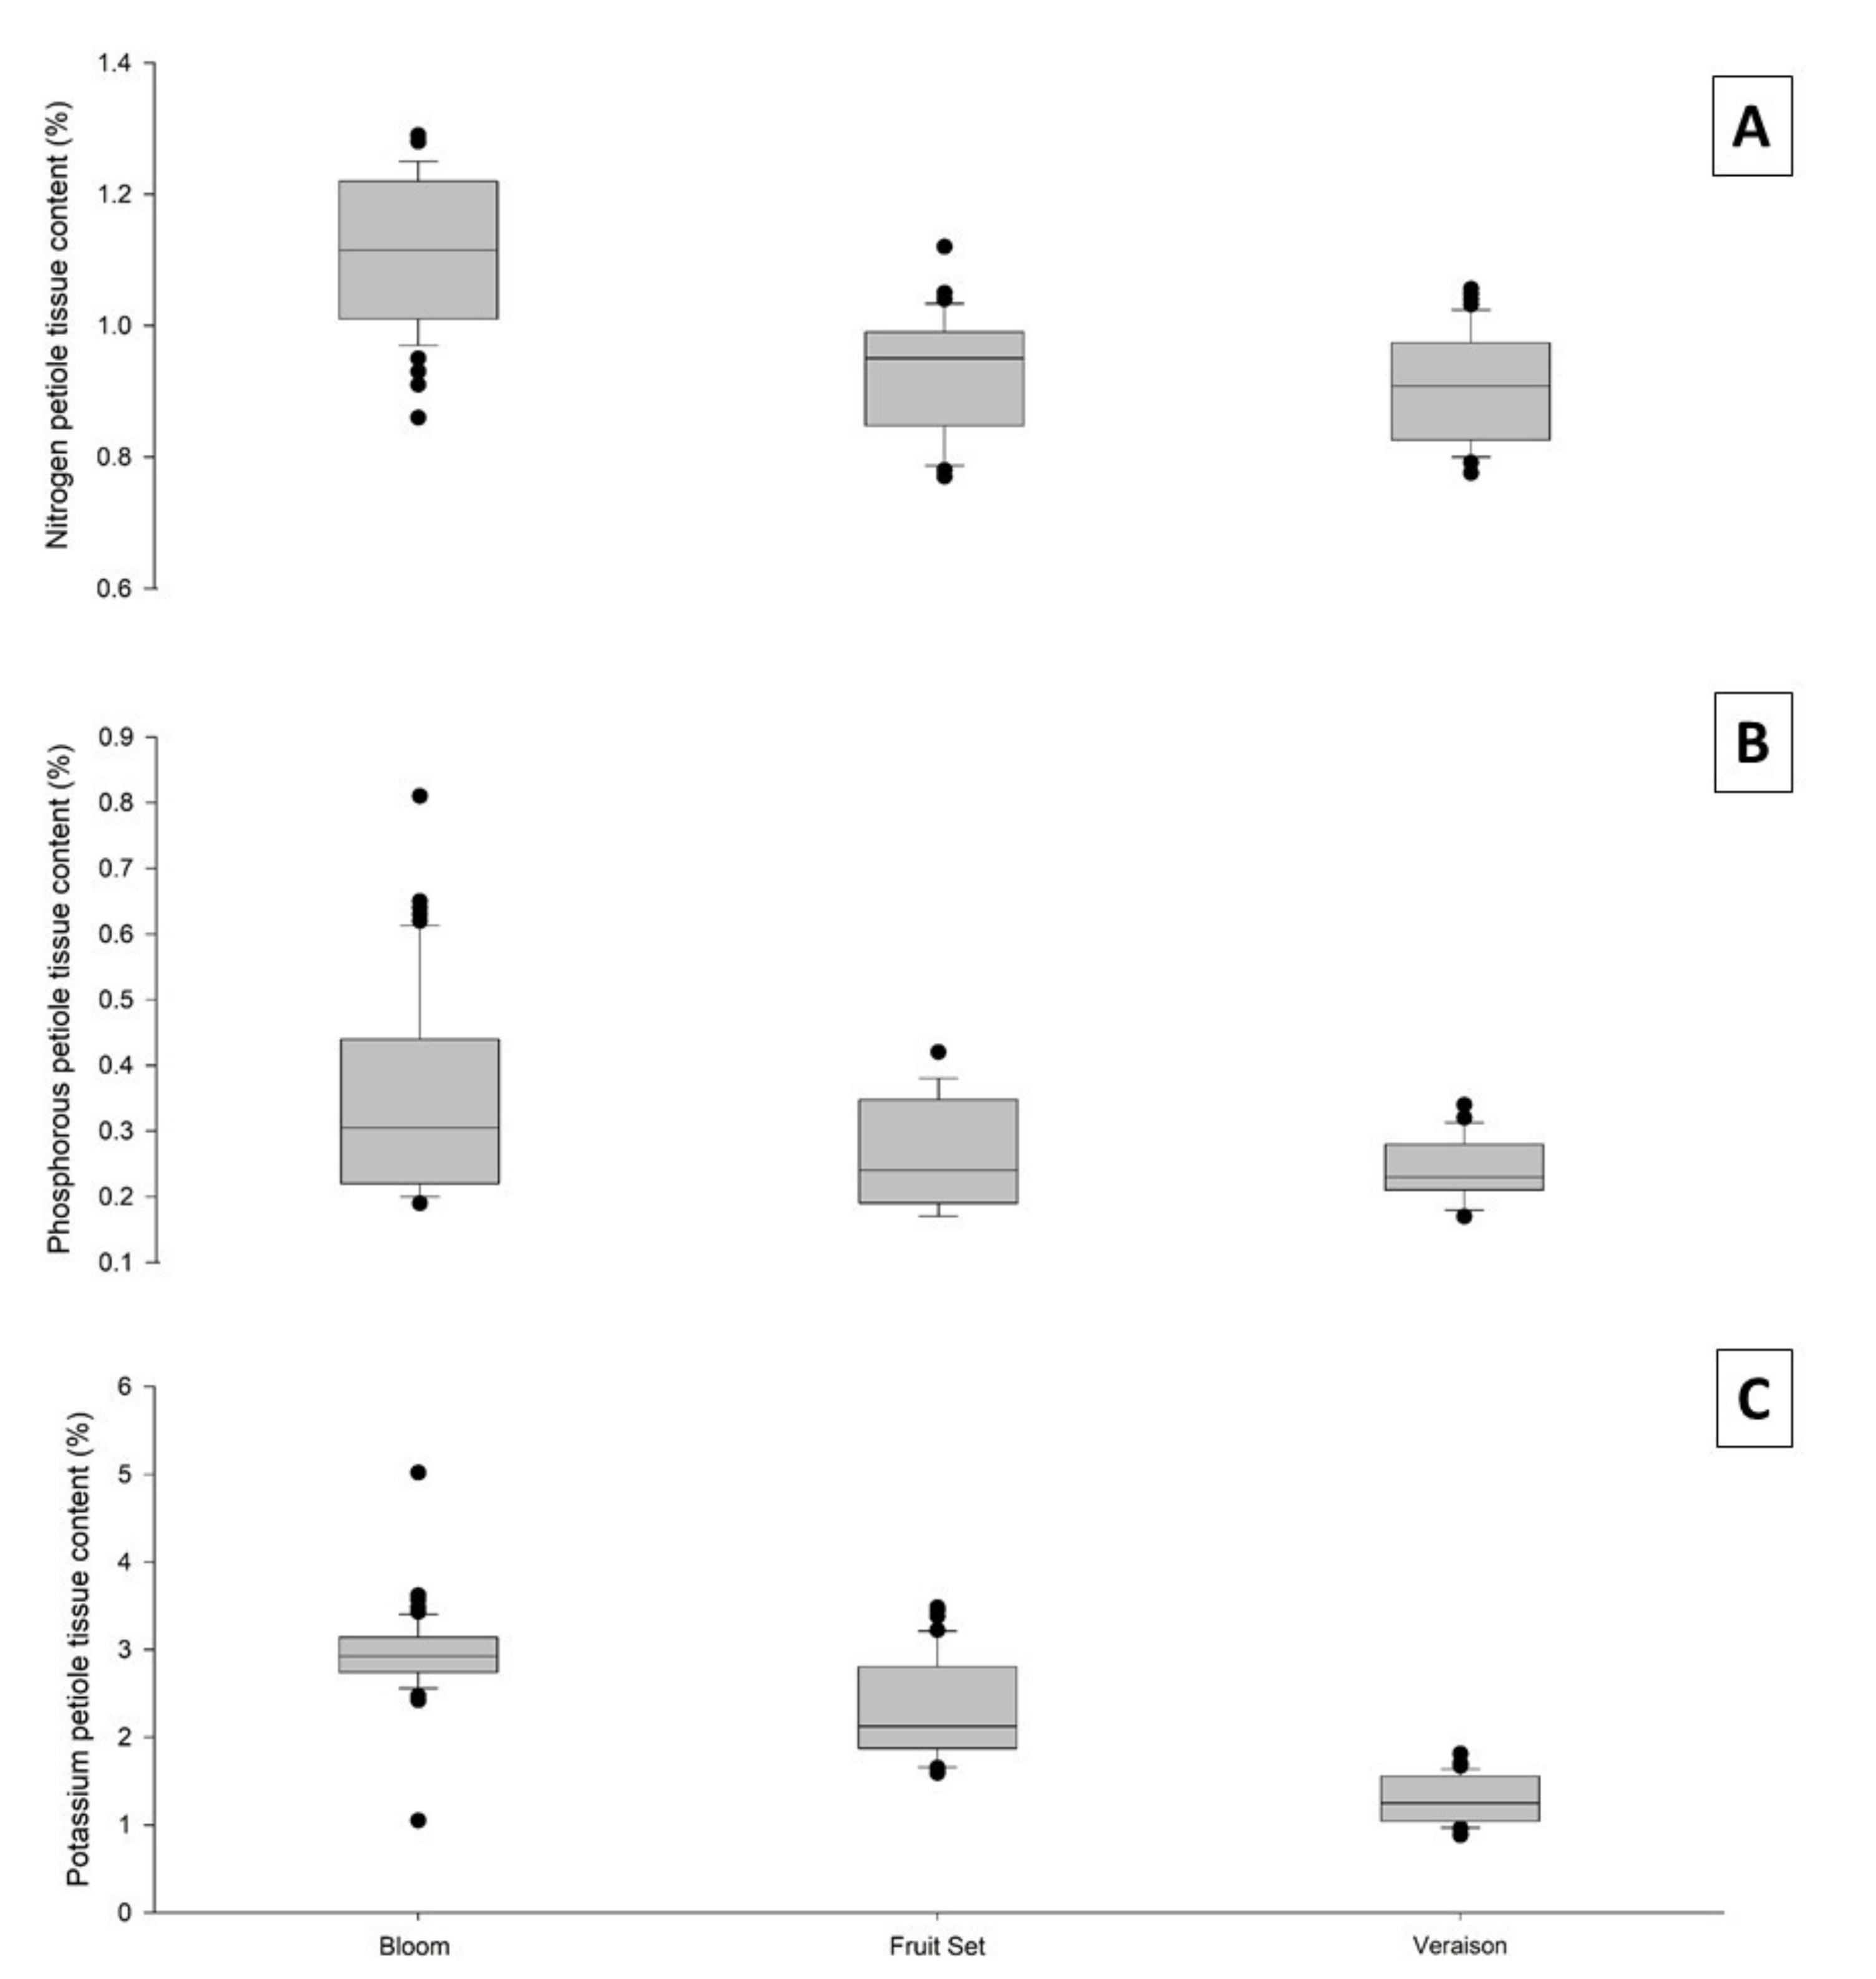
3.1. Variability and Content of Tissue Nutrients Change over the Season

The variability of tissue nutrient content changed over the season in both full leaf and petiole. Samples collected during bloom showed the highest variability in nutrient content, regardless of tissue type (Figure 2 and Figure 3). Variability in nutrient content decreased over the season. Samples taken later in the season show less variability in full leaf samples (Figure 2) and petiole samples (Figure 3). In addition, nutrient content varied significantly between the investigated growth stages in both tissue types. For example, the average N content for the fully mature leaf during bloom was 2.45%, while during fruit set and véraison it was 1.94% and 2.04%, respectively, (Figure 2 and Figure 3, Table 1). For leaf tissue, a decrease in nutrient content between bloom and fruit set could be observed for all nutrients in 2019 (Table 2) and for all nutrients with exception of Cu (Table 3) in 2020.

3.2. Nutrient Content Differs between Tissue Types

No differences in tissue nutrient content were found between sample positions (opposite of a cluster or at a shoot, data not shown). However, there were significant differences for all nutrients between full-leaf and petiole samples with the exception of Cu during véraison in 2019. Tissue nutrient concentrations in petioles differed mostly from recommended ranges [3,27], especially for the macronutrients N, P and K (Table 1). Generally, N, S, Fe, and Mn content was higher in leaf samples, while petiole samples were higher in P, K, Mg, Zn and B content. (Table 2 and Table 3).

4. Discussion

Muscadine grapes (Vitis rotundifolia) are an important commercial specialty crop in the Southeastern US [2,3]. However, most of the knowledge on muscadine production systems is solely based on anecdotal knowledge [1,3]. This is also true for practices of tissue sampling for nutrient content: current practice is the collection of full-leave samples during June or early July [3]. Questions remained open as to whether or not this practice based on calendar month is sufficient, especially in the light of long-established phenology based tissue sampling practices in European wine grapes [5,9,10,13,29,30,31,32]. In this study, we investigated the variability of tissue nutrient content over two growth seasons and three phenological vines stages in a commercial muscadine vineyard (‘Carlos’). Our main finding shows a decrease of variability in almost all macro- and micronutrient contents over the progress of the season. Such decrease was previously reported for European (Vitis vinifera) wine grapes [5,9,10,13,29,30,31]. However, to the knowledge of the authors, this is the first report on growth stage related differences in tissue nutrient content in muscadine vines (Vitis rotundifolia).
We also investigated the potential of sample location and tissue type as a factor for variability of tissue nutrient content over the growing season. While the location of the sample (either primary shoot or opposite of a cluster) did not have an impact, the tissue type (petiole vs. full leaf) showed difference in content and variability between mobile and less mobile nutrients. This was reported previously in Vitis vinifera [5,10,29,33] and muscadines [26,32]. Generally, lower variability was observed when samples were taken as whole leaf samples. This is currently also recommended practice for muscadine growers [1,2,3].

Nutrient Content

N tissue content was highly variable during bloom, and decreased as the season progressed. Such early season decrease in tissue N content was also previously reported in muscadines [32]. Mobilization of N into younger growing parts such as meristems, leaves, fruits, or translocation into woody organs may have led to decrease of N content after bloom. However, petiole N content was always below the recommended sufficiency range [3], while full leaf N content was above (at bloom) and within the range (at fruit set and véraison).
Petiole P and K were mostly above the recommended sufficiency ranges [3], while full leaf P and K content were above or within the range with the progression of the season. Similar trends were found in a recent survey of muscadine tissue nutrient content across two states [26], suggesting a reevaluation and update of the recommended ranges for most nutrients. K was an exception in our study, as it showed lowest content during fruit set in full leaf samples. However, similar patterns could also be observed in V. vinifera grapevines previously [5]. K is a highly mobile nutrient via both xylem and phloem and fruit are strong sinks. Thus, K translocation from leaves to fruit may have decreased its concentration of the sampled tissues between bloom and fruit set [5,10,29,33].

5. Conclusions

To make informed fertility management decisions, growers need to monitor vine nutrient status over the entire life-span of a vineyard. In this study we have shown that if growers follow current tissue sampling recommendations, they are at risk to encounter high variability in nutrient content in their samples. We also have shown that later sampling dates might decrease this risk significantly. This was the first study that showed vast differences in nutrient content in muscadine tissue samples over a growing season. Based on our results, we believe sampling during fruit-set or veraison will be more accurate than the current practice of sampling based on calendar month. However, our results need to guide future studies to develop indicators for tissue sampling guidelines in muscadines, such as fertility and yield.

Author Contributions

Conceptualization, M.H.; Methodology, T.S.R.; Formal analysis, K.A.F. and M.H. Investigation, T.S.R.; Resources, M.H.; Data curation, T.S.R. and K.A.F. Writing—original draft preparation: K.A.F. and T.S.R.; Writing—review and editing, M.H. and K.A.F.; Visualization: M.H. and T.S.R.; Supervision, M.H.; Project administration, M.H.; funding acquisition, M.H. All authors have read and agreed to the published version of the manuscript.

Funding

This study was funded by the North Carolina Department of Agriculture and Consumer Services (Grant Nr: 2019-1587).

Institutional Review Board Statement

Not applicable.

Data Availability Statement

Data of this study are available upon request.

Acknowledgments

We want to thank the North Carolina Department of Agriculture and Consumer Services, especially Kristin Hicks, for their support over the entirety of the study. We thank Emma Volk (North Carolina State University) and Amanda Lay-Walters (University of Arkansas) for their help in field and laboratory.

Conflicts of Interest

The authors declare no conflict of interest.

References

  1. Anderson, P.C.; Crocker, T.E.; Breman, J. The Muscadine Grape; HS763; University of Florida IFAS Extension: Gainesville, FL, USA, 2018. [Google Scholar]
  2. Hickey, C.C.; Smith, E.D.; Cao, S.; Conner, P. Muscadine (Vitis rotundifolia Michx., syn. Muscandinia rotundifolia (Michx.) Small): The resilient, native grape of the Southeastern U.S. Agriculture 2019, 9, 131. [Google Scholar] [CrossRef] [Green Version]
  3. Hoffmann, M.; Conner, P.; Brannen, P.; Burrack, H.; Mitchem, W.; Cline, B.; Perkins-Veazie, P.; Poling, B. Muscadine Grape Production Guide for the Southeast; AG-94; NC State Extension: Raleigh, NC, USA, 2020. [Google Scholar]
  4. Arrobas, M.; Ferreira, I.Q.; Freitas, S.; Verdial, J.; Rodrigues, M.A. Guidelines for fertilizer use in vineyards based on nutrient content of grapevine parts. Sci. Hort. 2014, 172, 191–198. [Google Scholar] [CrossRef]
  5. Benito, A.; Romero, I.; Domínguez, N.; García-Escudero, E.; Martin, I. Leaf blade and petiole analysis for nutrient diagnosis in Vitis vinifera L. cv. Garnacha tinta. Austral. J. Grape Wine Res. 2013, 19, 285–298. [Google Scholar] [CrossRef]
  6. Benito, A.; García-Escudero, E.; Romero, I.; Domínguez, N.; Martin, I. Sufficiency ranges (SR) and deviation from optimum percentage (DOP) references for leaf blade and petiole analysis in ‘Red Grenache’ grapevines. OENO One 2014, 49, 47–58. [Google Scholar] [CrossRef]
  7. García-Escudero, E.; Romero, I.; Benito, A.; Domínguez, N.; Martin, I. Reference levels for leaf nutrient diagnosis of cv. Tempranillo grapevine in the Rioja Appellation. Commun. Soil Sci. Plant Anal. 2013, 44, 645–654. [Google Scholar] [CrossRef]
  8. Assimakopoulou, A.; Tsougrianis, C. Correlation between yield, must attributes and nutritional status of the Greek red wine grape variety ‘Agiorgitiko’. J. Plant Nutr. 2012, 35, 1022–1036. [Google Scholar] [CrossRef]
  9. Christensen, P. Seasonal changes, and distribution of nutritional elements in Thompson Seedless grapevines. Am. J. Enol. Vitic. 1969, 20, 176–190. [Google Scholar]
  10. Romero, I.; García-Escudero, E.; Martin, I. Effects of leaf position on blade and petiole mineral nutrient concentration of Tempranillo grapevine (Vitis vinifera L.). Am. J. Enol. Vitic. 2010, 64, 544–550. [Google Scholar] [CrossRef] [Green Version]
  11. Schreiner, R.P.; Scagel, C.F. Leaf blade versus petiole nutrient tests as predictors of nitrogen, phosphorus, and potassium status of ‘Pinot Noir’ grapevines. HortScience 2017, 52, 174–184. [Google Scholar] [CrossRef]
  12. Robinson, J. Critical Plant Tissue Values and Application of Nutritional Standards for Practical Use in Vineyards. In Proceedings of the American Society for Enology and Viticulture, Davis, CA, USA, 29–30 June 2005; pp. 61–68. [Google Scholar]
  13. Peuke, A.D. Nutrient composition of leaves and fruit juice of grapevine as affected by soil and nitrogen fertilization. J. Plant Nutr. Soil Sci. 2009, 172, 557–564. [Google Scholar] [CrossRef]
  14. Davenport, J.R.; Lunden, J.D.; Winkler, T. Wine grape tissue nutrient concentration in the inland Pacific Northwest. Commun. Soil Sci. Plant Anal. 2012, 43, 21–27. [Google Scholar] [CrossRef]
  15. Fallahi, E.; Shafii, B.; Stark, J.C.; Fallahi, B. Cane and leaf growth and leaf mineral nutrients in various cultivars of wine grapes. J. Am. Pomol. Soc. 2005, 59, 182–191. [Google Scholar]
  16. Fallahi, E.; Shafii, B.; Stark, J.C.; Fallahi, B.; Hafez, S.L. Influence of wine grape cultivars on growth and leaf blade and petiole mineral nutrients. HortTechnology 2005, 15, 825–830. [Google Scholar] [CrossRef] [Green Version]
  17. Goldammer, T. Grape Grower’s Handbook: A Guide to Viticulture for Wine Production, 3rd ed.; Apex Publishers: Centreville, VA, USA, 2018. [Google Scholar]
  18. Boswell, F.C.; Lane, R.P.; Ohki, K. Field studies with boron on muscadine grapes. Commun. Soil Sci. Plant Anal. 1980, 11, 201–207. [Google Scholar] [CrossRef]
  19. Cummings, G.A.; Lilly, P. Soil pH rate for fruit yield and elemental concentration of muscadine grapes. HortScience 1984, 19, 831–832. [Google Scholar] [CrossRef]
  20. Cummings, G.A.; Fish, A.S.; Nesbitt, W.B.; Underwood, V.H. The influence of mineral nutrition and time of year upon the elemental concentration of muscadine grapes (Vitis rotundifolia). Commun. Soil Sci. Plant Anal. 1973, 4, 211–218. [Google Scholar] [CrossRef]
  21. Spiers, J.M.; Braswell, J.H. Nitrogen rate and source affects leaf elemental concentration and plant growth in muscadine grapes. J. Plant Nutr. 1993, 16, 1547–1554. [Google Scholar] [CrossRef]
  22. Spiers, J.M.; Braswell, J.H. Response of ‘Sterling’ muscadine grape to calcium, magnesium, and nitrogen fertilization. J. Plant Nutr. 1994, 17, 1739–1750. [Google Scholar] [CrossRef]
  23. Bryson, G.M.; Mills, H.A.; Sasseville, D.N.; Jones, J.B., Jr.; Barker, A.V. Plant Analysis Handbook III; Micro-Macro Publishing, Inc.: Athens, GA, USA, 2014. [Google Scholar]
  24. Clark, J.R.; Spiers, J.M. Irrigation and Mineral Nutrition: Muscadine Grape; ASHS Press: Alexandria, VA, USA, 2001; pp. 169–187. [Google Scholar]
  25. Plank, C.O.; Campbell, C.R. Reference Sufficiency Ranges for Plant Analysis in the Southern Region of the United States: Grape, Muscadine; SCSB#394; Southern Cooperative Series Bulletin: Raleigh, NC, USA, 2013; pp. 101–102. Available online: www.ncagr.gov/agronomi/saaesd/scsb394.pdf (accessed on 5 October 2022).
  26. Rana, T.S.; Smith, E.D.; Hickey, C.; Hoffmann, M. Leaf-tissue nutrient dynamics in mature muscadine cultivars Carlos and Noble in Georgia and North Carolina. HortTechnology 2021, 31, 280–290. [Google Scholar] [CrossRef]
  27. Jones, J.B., Jr.; Mills, H.A. Plant Analysis Handbook II: A Practical Sampling, Preparation, Analysis, and Interpretation Guide, 2nd ed.; Micromacro Publishing: Athens, GA, USA, 1996. [Google Scholar]
  28. Hicks, K. NCDA & CS Methods for Plant Tissue Analysis. 2020. Available online: https://www.ncagr.gov/agronomi/documents/NCDACS_Plant_Analysis_Methods.pdf (accessed on 4 October 2022).
  29. Romero, I.; García-Escudero, E.; Martin, I. Leaf blade vs. petiole analysis for nutritional diagnosis of Vitis vinifera L. cv. Tempranillo. Am. J. Enol. Vitic. 2013, 64, 50–64. [Google Scholar] [CrossRef]
  30. Schreiner, R.P. Spatial and temporal variation of roots, arbuscular mycorrhizal fungi, and plant and soil nutrients in a mature Pinot noir (Vitis vinifera L.) vineyard in Oregon. Plant Soil 2005, 276, 219–234. [Google Scholar] [CrossRef]
  31. Parejo, J.; Gonzalo, A.; Giro, P. Seasonal differences of nutrient level in Chardonnay. In Proceedings of the 4th International Symposium on Grapevine Physiology; Turin, Italy, 11–15 May 1992; Ministero dell’Agricolturae delle Foreste, Ed.; Instituto Agrario San Michele all’Adige: Trentino, Italy, 1992. [Google Scholar]
  32. Cummings, G.A. Variation in the concentration of certain elements in muscadine grape leaves related to season leaf portion, and age. J. Am. Soc. Hortic. Sci. 1977, 103, 339–342. [Google Scholar] [CrossRef]
  33. Barker, A.V.; Pilbeam, D.J. Handbook of Plant Nutrition; CRC Press: Boca Raton, FL, USA, 2007. [Google Scholar]
Figure 1. A commercial muscadine vineyard (A). Muscadines are commonly planted at 3.3 m row width and 6.6 m plant spacing on a single high wire trellis system (~1.8 m above the ground). Tissue sampling positions: opposite to cluster (B) and first fully mature leaf (C). Tissue types: full leaf (D) and petioles (E). Growth stages: late bloom—early fruit set (F), late fruit set (G), and mid véraison (H).
Agriculture 12 01805 g001
Figure 2. Variation of tissue nutrient content for nitrogen (A), phosphorous (B) and potassium (C) in fully mature leaf samples (combined data from 2019 and 2020, n = 56). Shown are Median, 25 and 75 percentiles as well as outliers. Samples taken during bloom show the highest variability, compared to samples taken at fruit set or véraison.
Agriculture 12 01805 g002
Figure 3. Variation of tissue nutrient content for nitrogen (A), phosphorous (B) and potassium (C) in petiole samples (combined data from 2019 and 2020, n = 56). Shown are Median, 25 and 75 percentiles as well as outliers. Samples taken during bloom show the highest variability, compared to samples taken at fruit set or véraison.
Agriculture 12 01805 g003
Table 1. Mean and standard error of mean (SEM) for nitrogen (N), phosphorus (P) and potassium (P) content of each position and tissue type over bloom, fruitset and véraison (combined data from 2019 and 2020, n = 56).
N (%)P (%)K (%)
Recommended Range [3,27]1.65–2.150.12–0.180.80–1.20
Sample PositionTissue TypeMeanSEMMeanSEMMeanSEM
Bloom
Cluster
Leaf2.45 c0.02160.214 a0.01430.904 a0.0662
Petiole1.01 a0.02160.464 c0.01433.033 b0.0662
Mature
Leaf2.44 c0.02160.277 b0.01431.072 a0.0662
Petiole1.21 b0.02160.240 ab0.01432.873 b0.0662
Fruit set
Cluster
Leaf1.942 c0.02140.176 a0.01110.931 a0.0746
Petiole0.879 a0.02140.266 b0.01112.154 b0.0746
Mature
Leaf1.95 c0.02140.156 a0.01110.887 a0.0746
Petiole0.98 b0.02140.256 b0.01112.429 b0.0746
Veraison
Cluster
Leaf2.034 d0.01440.150 a0.004760.649 a0.0366
Petiole0.706 a0.01440.278 d0.004761.315 b0.0366
Mature
Leaf1.925 c0.01440.173 b0.004760.733 a0.0366
Petiole0.868 b0.01440.208 c0.004761.247 b0.0366
Letters (a, b, c) indicate significant differences between tissue nutrient concentrations after a Tukey post hoc test (p < 0.05).
Table 2. Nutrient concentrations of petiole and full-leaf from two sampling positions in mature muscadine ‘Carlos’ in 2019 (n = 28).
N XPKCaMgSFeMnZnCuB
% ppm
PositionTissue1.65–2.15 W0.12–0.180.80–1.200.70–1.100.15–0.250.19–0.2760–12060–15018–355.0–1015–24
Bloom Y
Opposite clusterPetiole1.05 d Z0.51 a3.12 a1.39 b0.91 a0.09 b23.59 c104.64 b54.04 a3.79 c25.71 a
Whole leaf2.58 a0.22 b0.87 b1.83 a0.54 b0.17 a86.14 a308.16 a38.96 b5.1 c28.07 a
ShootPetiole1.18 c0.25 b2.79 a0.81 c0.46 bc0.07 b16.47 c63.32 b27.51 bc6.78 b20.77 b
Whole leaf2.42 b0.26 b1.02 b0.85 c0.31 c0.15 a55.7 b107.47 b15.48 c8.45 a14.62 c
p-value <0.0001<0.0001<0.00010.0137<0.0001<0.0001<0.0001<0.00010.00060.00110.0026
Fruit Set
Opposite of clusterPetiole0.96 b0.2 b2.03 b0.68 c0.25 c0.05 c12.43 d75.09 c24.84 a5.31 b16.06 b
Whole leaf2.03 a0.19 b0.94 c0.58 d0.2 d0.09 b41.17 b99.28 b11.74 c7.09 a12.76 c
ShootPetiole0.98 b0.34 a3.15 a1.12 b0.61 a0.05 c23.46 c103.24 b23.23 a2.81 d21.96 a
Whole leaf2.0 a0.13 c0.88 c1.23 a0.34 b0.10 a81.72 a192.14 a17.32 b3.64 c16.34 b
p-value <0.0001<0.0001<0.0001<0.0001<0.0001<0.0001<0.0001<0.0001<0.0001<0.0001<0.0001
Véraison
Opposite of clusterPetiole0.76 d0.25 a1.56 a1.11 a0.73 a0.05 d18.61 c130.21 bc23.54 b2.53 b19.43 a
Whole leaf2.03 a0.14 d0.68 b0.95 b0.32 c0.12 a71.85 a146.79 ab11.31 d2.86 b12.93 b
ShootPetiole0.92 c0.22 b1.46 a0.84 c0.41 b0.06 c18.86 c117.62 c48.29 a5.6 a18.02 a
Whole leaf1.86 b0.16 c0.76 b0.75 d0.29 c0.11 b40.24 b149.71 a17.65 c5.63 a14.67 b
p-value <0.0001<0.0001<0.0001<0.0001<0.0001<0.0001<0.0001<0.0001<0.00010.5622<0.0001
W Recommended sufficiency ranges of each nutrient [3,27]. Macronutrients are in % and micronutrients are in parts per million (ppm). X Note: N = nitrogen, P = phosphorus, K = potassium, Ca = calcium, Mg = magnesium, S = sulfur, Fe = iron, Mn = manganese, Zn = zinc, Cu = copper, B = boron. Y Sampling dates: Bloom = 6 June, Fruit set = 26 July, and Véraison = 30 August of 2019. Z Means followed by different letters within a column and within a growth stage are statistically significant at p ≤ 0.05 according to Tukey adjustment.
Table 3. Nutrient concentrations of petiole and full-leaf from two sampling positions in mature muscadine ‘Carlos’ in 2020 (n = 28).
NPKCaMgSFeMnZnCuB
% ppm
Sufficiency range W 1.65–2.150.12–0.180.80–1.200.70–1.100.15–0.250.19–0.2760–12060–15018–355.0–1015–24
Bloom
Opposite of clusterPetiole0.98 d0.41 a2.95 a1.12 b0.71 a0.05 c18.88 c103.65 b26.04 b3.15 d34.75 a
Whole leaf2.33 b0.21 d0.94 c1.33 a0.48 b0.14 a63.03 a247.93 a15.51 c4.51 c23.4 c
ShootPetiole1.25 c0.23 c2.95 a0.82 c0.36 c0.07 b14.81 d52.32 c28.59 a6.28 b29.51 b
Whole leaf2.47 a0.29 b1.12 b0.78 c0.3 d0.15 a45.78 b88.38 b15.33 c9.21 a18.26 d
p-value <0.0001<0.0001<0.0001<0.0001<0.0001<0.0001<0.0001<0.0001<0.0001<0.0001<0.0001
Fruit set
Opposite of clusterPetiole0.8 c0.33 a2.28 a0.93 b0.55 a0.04 c19.02 c93.74 b16.14 b2.94 d26.49 a
Whole leaf1.86 a0.17 b0.92 c1.02 a0.36 b0.08 a49.02 a185.93 a12.31 c3.64 c18.27 c
ShootPetiole0.98 b0.18 b1.7 b0.7 c0.27 c0.05 b13.55 d58.55 c28.96 a8.38 b21.46 b
Whole leaf1.9 a0.18 b0.89 c0.69 c0.23 d0.08 a31.9 b86.06 b13.84 c11.02 a13.53 d
p-value <0.0001<0.0001<0.00010.0002<0.0001<0.0001<0.0001<0.0001<0.0001<0.0001<0.0001
Véraison
Opposite of clusterPetiole0.66 c0.31 a1.07 a1.35 a0.89 a0.05 b16.59 c138.43 ab36.26 b2.53 d26.58 a
Whole leaf2.04 a0.16 c0.62 c1.12 b0.33 c0.13 a55.17 a144.71 a13.04 d3.61 c15.62 c
ShootPetiole0.81 b0.2 b1.03 a1.13 b0.56 b0.05 b14.29 d118.61 b49.01 a6.1 b24.74 b
Whole leaf2.0 a0.18 b0.71 b0.98 c0.33 c0.13 a42.13 b146.79 a16.36 c7.62 a16.51 c
p-value <0.0001<0.0001<0.0001<0.0001<0.0001<0.0001<0.00010.0058<0.0001<0.0001<0.0001
W Recommended sufficiency ranges of each nutrient [3,27]. Macronutrients are in % and micronutrients are in parts per million (ppm). Note: N = nitrogen, P = phosphorus, K = potassium, Ca = calcium, Mg = magnesium, S = sulfur, Fe = iron, Mn = manganese, Zn = zinc, Cu = copper, B = boron. Y Sampling dates: Bloom = 22 June, Fruit set = 27 July, and Véraison = 2 September of 2020. Z Means followed by different letters within a column and within a growth stage are statistically significant at p ≤ 0.05 according to Tukey adjustment.
Publisher’s Note: MDPI stays neutral with regard to jurisdictional claims in published maps and institutional affiliations.

