Article

Deep-Learning Approach for Fusarium Head Blight Detection in Wheat Seeds Using Low-Cost Imaging Technology

by
Rodrigo Cupertino Bernardes
1,
André De Medeiros
2,
Laercio da Silva
2,
Leo Cantoni
2,
Gustavo Ferreira Martins
3,
Thiago Mastrangelo
4,
Arthur Novikov
5 and
Clíssia Barboza Mastrangelo
4,*
1
Department of Entomology, Universidade Federal de Viçosa (UFV), Viçosa 36570-900, Minas Gerais, Brazil
2
Department of Agronomy, Universidade Federal de Viçosa (UFV), Viçosa 36570-900, Minas Gerais, Brazil
3
Department of General Biology, Universidade Federal de Viçosa (UFV), Viçosa 36570-900, Minas Gerais, Brazil
4
Laboratory of Radiobiology and Environment, Center for Nuclear Energy in Agriculture (CENA/USP), Piracicaba 13416-000, São Paulo, Brazil
5
Timber Industry Faculty, Voronezh State University of Forestry and Technologies Named after G.F. Morozov, 394087 Voronezh, Russia
*
Author to whom correspondence should be addressed.
Agriculture 2022, 12(11), 1801; https://doi.org/10.3390/agriculture12111801
Submission received: 29 September 2022 / Revised: 26 October 2022 / Accepted: 27 October 2022 / Published: 29 October 2022
(This article belongs to the Special Issue Recent Advances in Modern Seed Technology)

Abstract

:
Modern techniques that enable high-precision and rapid identification/elimination of wheat seeds infected by Fusarium head blight (FHB) can help to prevent human and animal health risks while improving agricultural sustainability. Robust pattern-recognition methods, such as deep learning, can achieve higher precision in detecting infected seeds using more accessible solutions, such as ordinary RGB cameras. This study used different deep-learning approaches based on RGB images, combining hyperparameter optimization, and fine-tuning strategies with different pretrained convolutional neural networks (convnets) to discriminate wheat seeds of the TBIO Toruk cultivar infected by FHB. The models achieved an accuracy of 97% using a low-complexity design architecture with hyperparameter optimization and 99% accuracy in detecting FHB in seeds. These findings suggest the potential of low-cost imaging technology and deep-learning models for the accurate classification of wheat seeds infected by FHB. However, FHB symptoms are genotype-dependent, and therefore the accuracy of the detection method may vary depending on phenotypic variations among wheat cultivars.

Graphical Abstract

1. Introduction

Wheat (Triticum aestivum L.) is a key crop for global food security [1]. However, this crop is threatened by numerous biotic and abiotic pressures, which result in significant losses in productivity and quality [2]. Among the fungal diseases, Fusarium head blight (FHB), predominantly caused by Fusarium graminearum Schwabe, is one of the most widespread and devastating fungal diseases in wheat production [3]. This pathogen produces different mycotoxins such as deoxynivalenol (DON) that accumulate in wheat seeds and can seriously affect human and animal health [4]. Further, mycotoxins drastically compromise the physiological potential of seeds used to establish production fields [5]. Therefore, techniques that enable the identification of seeds infected by FHB are necessary to mitigate the risks associated with this disease. For instance, enzyme-linked immunosorbent assays (ELISA) and high-performance liquid chromatography (HPLC) are among the most widely used and accurate traditional techniques for identifying contaminated seeds. However, they have high costs [6], requiring a large number of samples to be tested, which affects the efficiency of the seed production chain.
Emerging techniques, particularly those based on spectroscopy, hyperspectral, and multispectral imaging, have shown satisfactory results for the detection of FHB in wheat spikes or crop canopy in the field [7,8,9,10,11,12,13]. Few studies, however, have tried to apply imaging systems to detect FHB or predict DON content levels in wheat kernels, seeds, or flour, and most of them were performed with hyperspectral imaging techniques [14,15,16,17,18]. Although these techniques provide important spectral information from qualitative and quantitative measurements, there are still challenges related to cost, complexity, and instrumentation [17,19,20]. Alternatively, ordinary RGB cameras and scanners are more accessible options, and although they are limited in terms of spectral resolution, when combined with robust pattern-recognition methods, such as deep learning, RGB cameras and scanners can also achieve high precision [21,22,23] (Table S1).
Deep-learning models, including convolutional neural networks (convnets), provide outstanding performance in solving computer-vision tasks, such as plant disease recognition, fruit classification, and crop seed phenotyping [24,25,26,27,28,29]. In the convnets, the input goes through a convolutional base composed of convolutional layers (conv layers) that perform feature extraction. In the final portion of these networks, there is a classifier consisting of fully connected layers (dense layers) that perform a classification to produce the network output [30]. These networks learn how to predict the results based on features extracted from inputs, and then they can be applied to assess seed quality without elaborate equipment or manual extraction.
When building a deep-learning model, an important step is the choice of hyperparameters. Hyperparameters are usually arbitrary. They are related to the network architecture that is not learned, which is similar to the model parameters via backpropagation. Different strategies can be used to adjust these hyperparameters, including random interactions that maximize search efficiency [31]. Another useful approach is to use a convnet previously trained on a large dataset with established hyperparameters [30]. In pretrained networks, a method called fine-tuning can be used. This method consists of training the weights of a few of the top layers from a pretrained convolutional base and jointly training a new fully-connected classifier to adjust the more abstract representations of the model [32]. Therefore, the features learned from a pretrained network can effectively act as a generic model for other computer vision tasks [30].
The objectives of this work were summarized as follows: (1) to provide deep-learning models for monitoring FHB in wheat seeds, and for this, we employed convnets to discriminate unhealthy seeds (i.e., seeds infected by FHB) from healthy seeds based on data extracted from RGB digital images; (2) the use of different convnet models for performance comparison. To address this, we defined a network architecture from scratch (custom convnet) and performed various interactions in the search for optimal hyperparameters. We also used different pretrained convnet architectures with different fine-tuning strategies, comparing their performance with the custom convnet. Furthermore, (3) we searched for the seed features that were most commonly used by the convnets in the learning process.

2. Materials and Methods

2.1. Seed Sample

Wheat seeds of the TBIO Toruk genotype (moderately susceptible to FHB) were produced during the 2019/2020 crop season in an experimental field located in the region of Passo Fundo (28°15′54″ S, 52°19′14″ W, 700 m), Southern Brazil. The spikelets showing symptoms of FHB (premature bleaching) and healthy spikelets were collected, and then the seeds were kept in a cold chamber (15 °C) until image acquisition. In total, 1200 seeds were sampled, containing 600 seeds infected by FHB and 600 healthy seeds. In this study, fungal colonization symptoms in the wheat seeds related to FHB infection were roughness, shriveled appearance, and pink-colored tissues. The following subsections will provide details about deep-learning procedures and the proposed imaging technology (Figure 1).

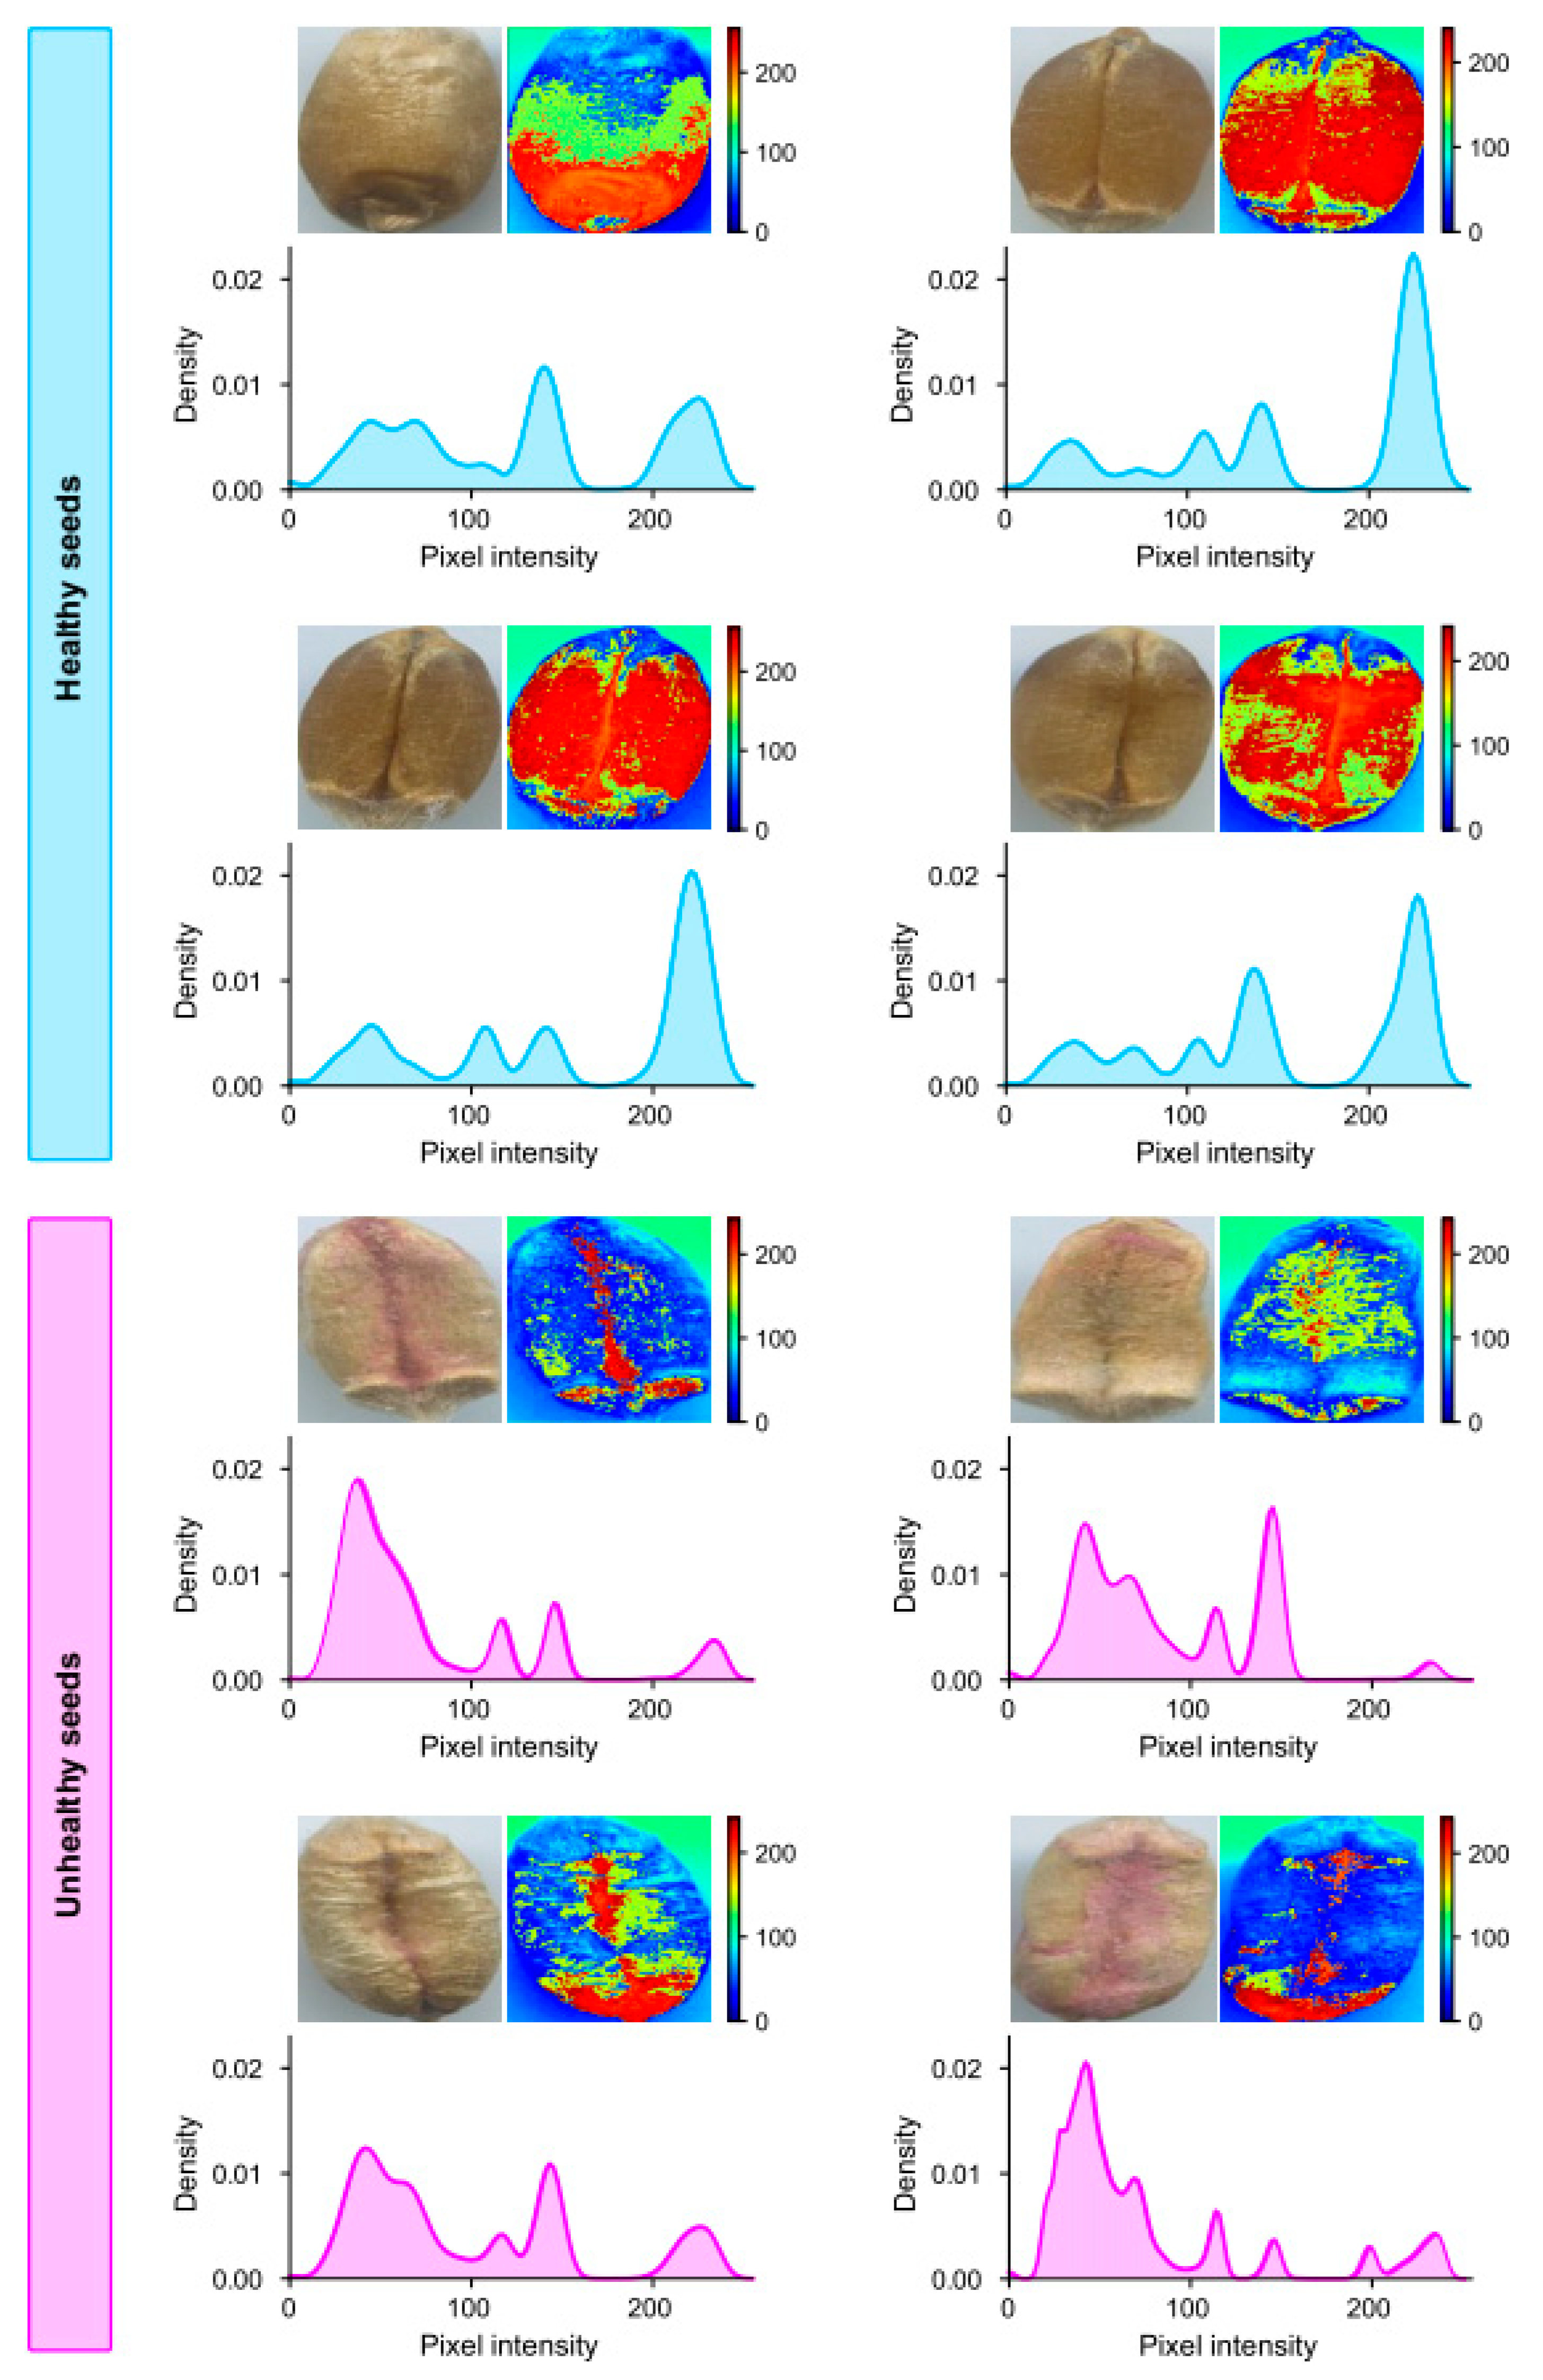
2.2. Image Acquisition, Segmentation, and Resizing

The images were acquired using an Epson Perfection V800 scanner with 1200 DPI resolution. The seeds were randomly arranged without standardization of the ventral and dorsal surfaces to obtain generalist models for any surface or position of the seeds. All images were segmented using histogram-based thresholding to remove the background. Then, the seed bounding boxes were calculated based on the contour lines of the selection and used to cut and store each seed image individually. The images were resized to a resolution of 124 × 124 pixels before training the convnet models. We sampled 1200 images from individual seeds (600 healthy and 600 unhealthy), and this dataset was split into 70% for training, 15% for testing, and 15% for validation.

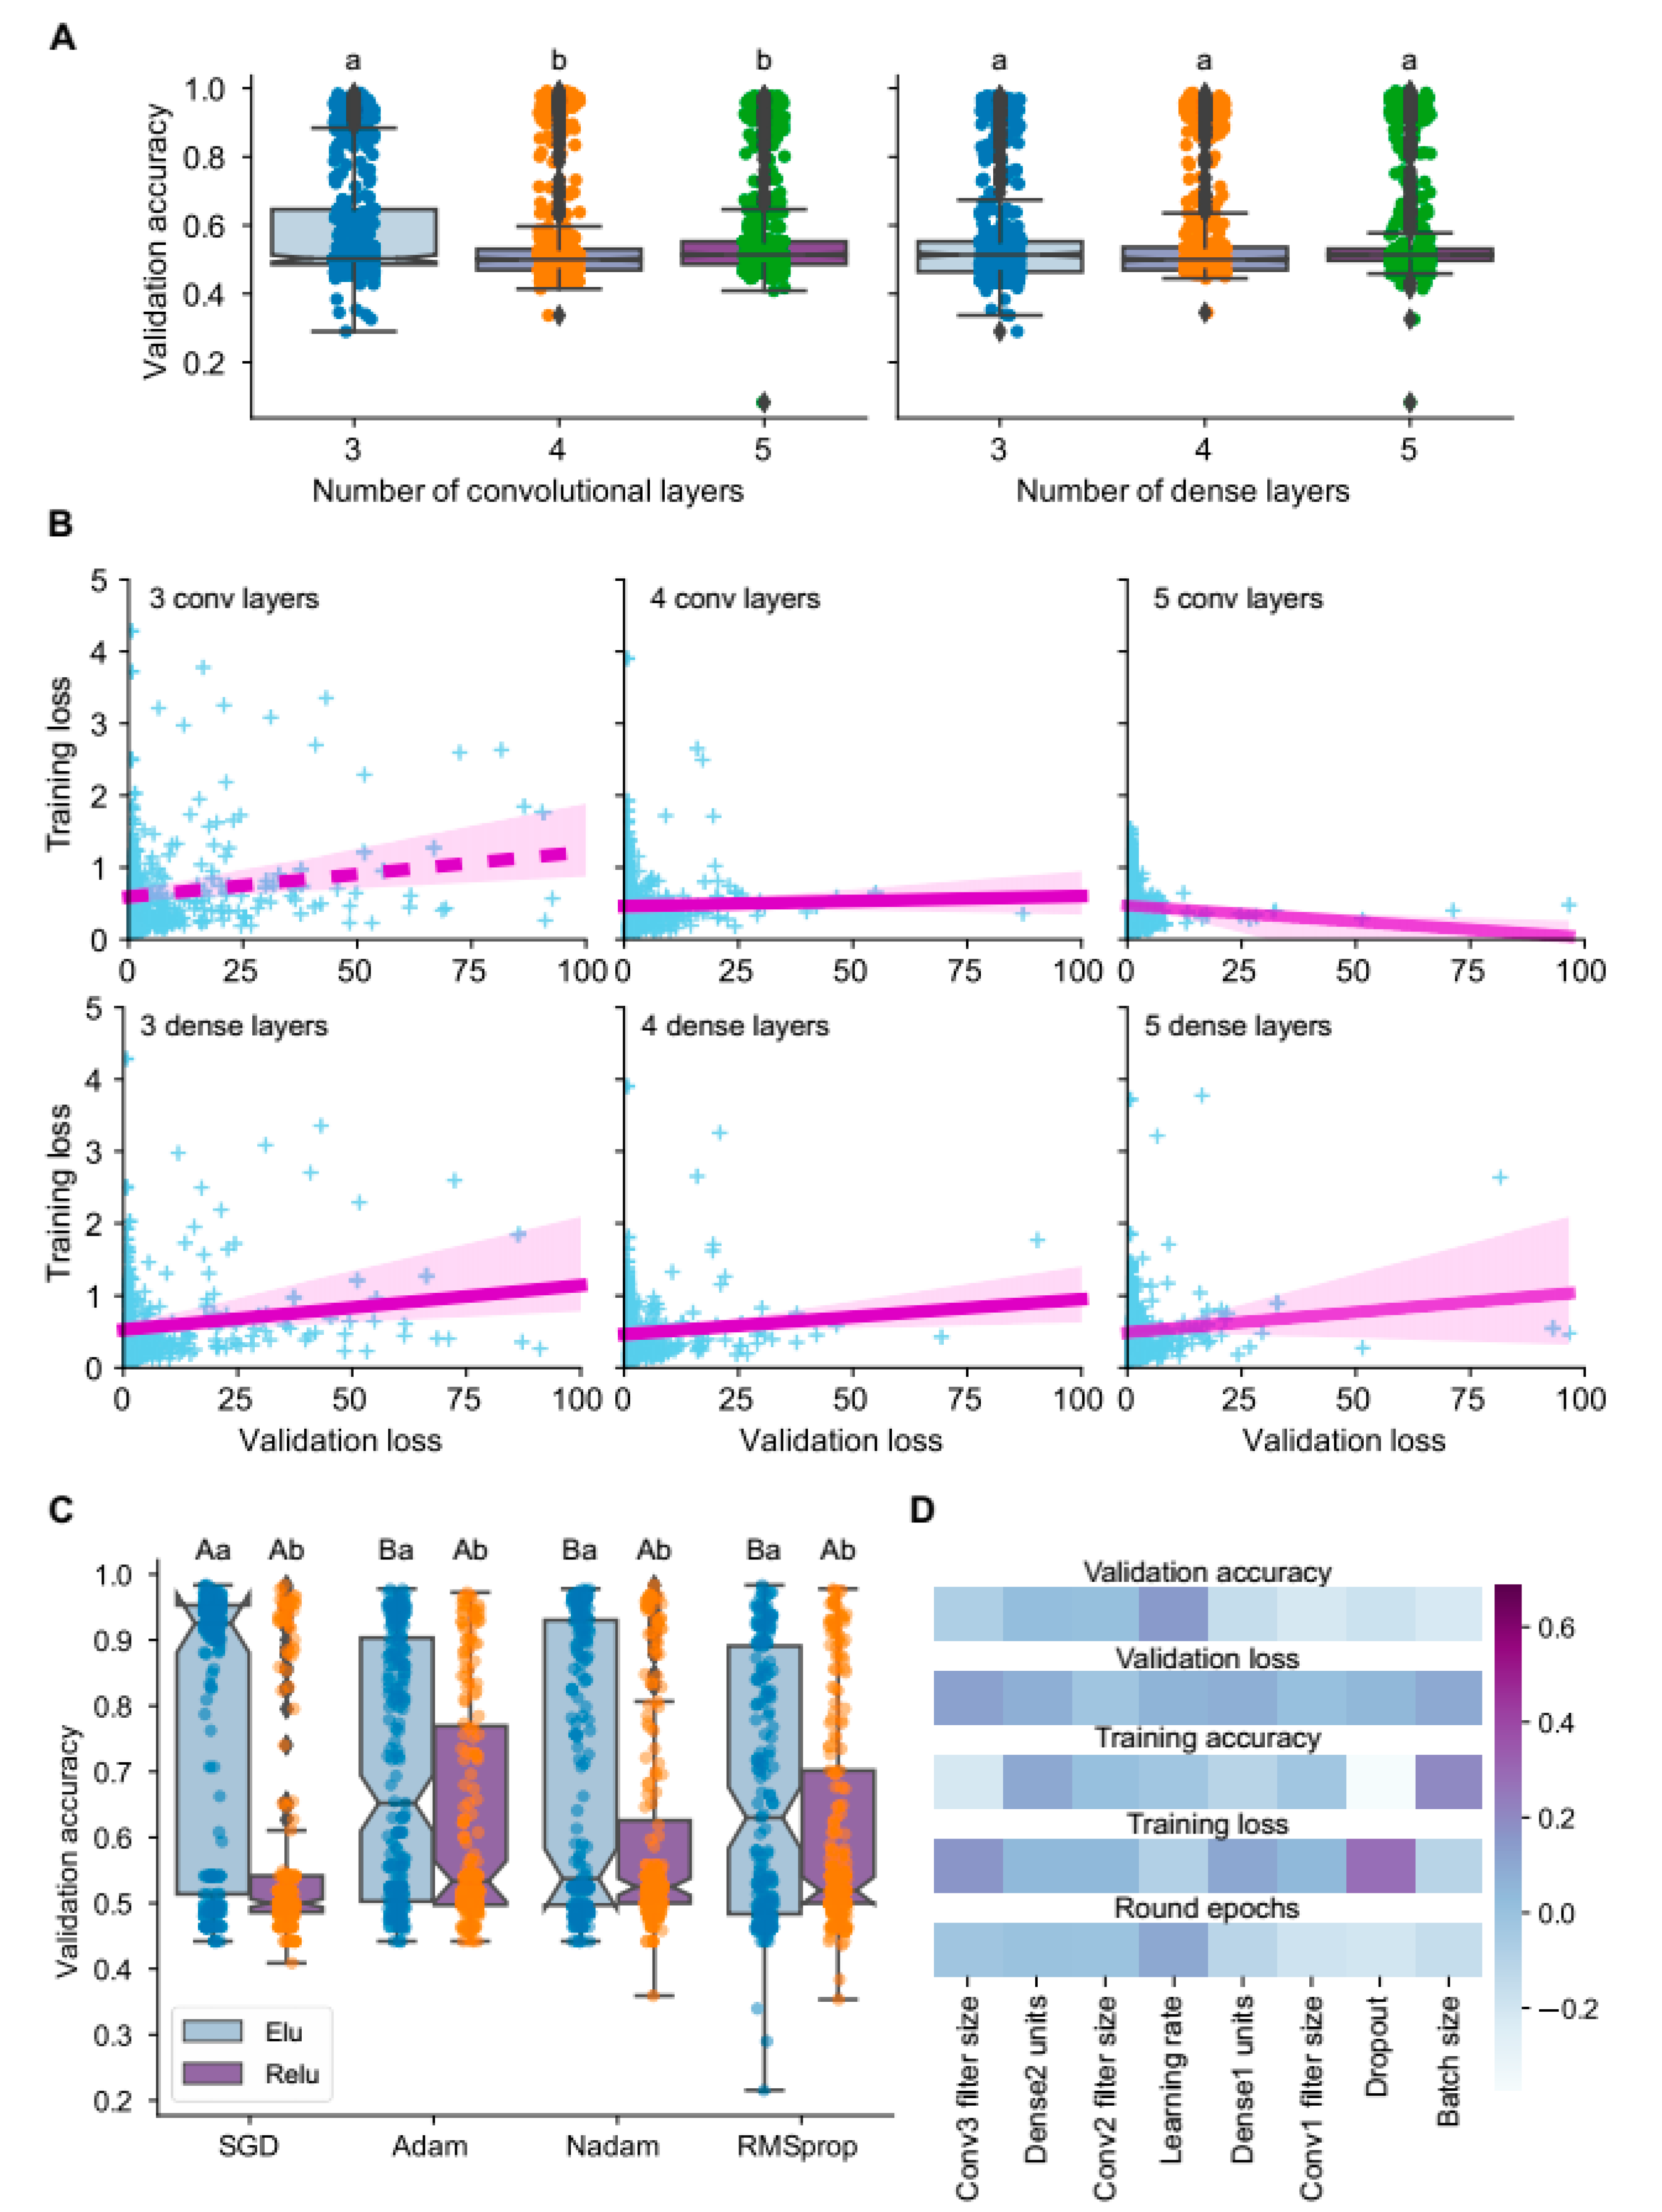
2.3. Custom Convnet Hyperparameter Optimization

To define the architecture of the custom convnet, we used a hyperparameter space (Table 1), and a random search strategy was performed to maximize the search efficiency [31]. Initially, we performed 1728 random interactions to optimize the number of convolutional layers and dense layers in the network architecture. After defining the architecture, we performed more 1701 interactions to evaluate other categorical and numeric hyperparameters of the network (Table 1). To avoid overfitting during hyperparameter optimization, we used data augmentation to randomly rotate images up to 30°, and apply 20% variations in height, width, shear, and zoom. We also flipped half of the images horizontally, and the nearest strategy was used for filling in newly created pixels, which can appear after a rotation or a width/height shift.
We assessed the relationship of validation accuracy with the number of convolutional and dense layers through analysis of variance (ANOVA). An analysis of covariance (ANCOVA) was performed to verify whether the correlation between training loss and validation loss (continuous covariate) differed among the number of layers (categorical variable). We performed multiple analyses of variance (two-way ANOVA) to evaluate the effects of the optimizers, activation functions, and the interactions between these explanatory variables on the variable-response validation accuracy. For the other numeric hyperparameters, we applied multivariate correlations. When necessary, we used Tukey’s test (p < 0.05) for comparisons among the explanatory variable levels.

2.4. Fine-Tuning Pretrained Convnets

To perform fine-tuning, we used the previously trained convnets MobileNet [33], InceptionV3 [34], VGG16 [35], VGG19 [35], and Xception [36], with different percentages of weights from the ImageNet dataset [37]. We fine-tuned 0% (FT 0) with a convolutional base using all weights from ImageNet, 20% (FT 20), 50% (FT 50), 80% (FT 80), and 100% (FT 100), training the complete network with randomly initialized weights. The classifier added on top of these pretrained convnets consisted of three dense layers with 64, 32, and 2 units per layer, respectively. Among these dense layers, a dropout rate of 20% and an exponential linear unit (ELU) activation function were added. The sigmoid function was used in the last layer as it involved binary classification. A mini-batch stochastic gradient descent (mini-batch SGD) was used as the optimizer, and a binary cross-entropy was used as the cost function. In the SGD optimizer, the learning rate was 0.001 and the momentum was 0.9. We used a callback to decrease or increase the learning rate in the case of a loss plateau to remove local minima during training. In these fine-tuning approaches, we also used data augmentation with the same parameters as the hyperparameter optimization of the custom convnet (Section 2.3).
During training and validation of the fine-tuned convnets, we adjusted the callback to stop the training early after five successive epochs without validation accuracy improvement. The accuracy, loss, and mean square error for training and validation were measured to check the better models. We also measured the training time per epoch and overfitting. Overfitting was calculated as the ratio of training loss divided by validation loss.

2.5. Model Tests

The three superior-established convnets (one custom convnet and two from the fine-tuning stage) were validated using the test data. Therefore, we constructed the confusion matrices and calculated the overall accuracy (OA) (Equation (1)) and kappa coefficient ( K ^ ) (Equation (2)):
O A = i = 1 k x i i N ,
K ^ = N i = 1 k n i i i = 1 k n i n i N 2 i = 1 k n i n i ,
where k = number of classes;   x i i = observations classified in the correct population (diagonal of the confusion matrix);   N = sample size; n i = marginal total of the matrix line i;   n i = marginal total of the matrix column i.
We considered 0.4 < K ^ < 0.6 to indicate that the classification is reasonably suitable, 0.61 < K ^ < 0.8 to mean substantially appropriate, and   K ^ > 0.81 to be highly suitable [38]. A Z-test (Equation (3)) was also used to indicate whether the K ^ models ( K ^ i and K ^ j ) were statistically different at a significance level of 5%:
Z c = K ^ i K ^ j σ K ^ i 2 + σ K ^ j 2 ,
where, σ K ^ i 2 and σ K ^ j 2 are variances of the kappa values under analysis.
After defining the best model in the test step, we developed a class activation map to understand which parts of the seeds led the convnet to the classification decision. In all image analysis and data processing, we used the Python language (version 3.6.8; Amsterdam, The Netherlands) on a Dell G3 machine, with Intel i7-9750H CPU 2.60 GHz × 12, 8 GB RAM and GPU NVIDIA® GeForce® GTX 1660 (6 GB) Ti Max-Q. Statistical analyses were performed in the R language (version 4.0.0; Vienna, AT) [39].

3. Results

3.1. Custom Convnet Architecture

Regarding the number of conv layers, there was a significant difference between the numbers tested, in which the model with the lowest number of layers (3 conv layers) showed the highest accuracy (F 2,1725 = 10.54, p < 0.0001, Figure 2A). The accuracy did not vary significantly in relation to the number of dense layers (F 2,1725 = 2.1, p = 0.13, Figure 2A). For overfitting assessed through the correlation between training loss and validation loss, there was a difference between the number of convolutional layers (F 2,1724 = 5.32, p = 0.005, Figure 2B); however, there was no difference between the dense layers (F 2,1724 = 0.79, p = 0.45, Figure 2B). Accordingly, a model with fewer layers tended to avoid overfitting. There was also a significant interaction between the optimizer and the activation function (F 3,1693 = 13.1, p < 0.0001), wherein better accuracy was obtained with the SGD optimizer and Elu activation (Figure 2C). Although other tested hyperparameters did not show a high correlation with validation accuracy (Figure 2D), we chose these hyperparameters following the direction of the correlations (whether positive or negative) to employ the least costly model (Figure 3).

3.2. Fine-Tuning

Considering the results obtained during fine-tuning of the pretrained convnets, the outstanding strategies were MobileNet FT 50 and InceptionV3 FT 100 (Figure 4). High validation accuracy (98.9% and 99.9%), low validation loss (0.029 and 0.012), and low mean square error (0.009 and 0.003) were achieved for MobileNet FT 50 and InceptionV3 FT 100, respectively. These networks also exhibited outstanding values associated with the proportion of overfitting (3.16 and 1.91 for MobileNet FT 50 and InceptionV3 FT 100, respectively), demonstrating excellent generalizability. Therefore, these two networks were used to compare the performance with the custom convnet in the test dataset.

3.3. Model Performance on the Test Dataset

For classifier tests, the custom (i.e., the network architecture we defined), MobileNet FT 50, and InceptionV3 FT 100 convnets obtained overall accuracies of 97.2%, 96.1%, and 99.4% and kappa coefficients of 0.944, 0.922, and 0.989, respectively (Figure 5). The Z-test indicated that MobileNet FT 50 and InceptionV3 FT 100 are statistically different in predictive capacity (Z = 2.16, p = 0.031) However, there was no difference between the custom convnet and MobileNet FT 50 (Z = 0.59, p = 0. 56), nor between the custom convnet and InceptionV3 FT 100 (Z = 1.66, p = 0.097).
The activation map for the custom convnet showed that different regions are activated between unhealthy and healthy seeds (Figure 6). In healthy seeds, the activation is broader and more homogeneous, as evidenced by image histograms (Figure 6). Nonetheless, in unhealthy seeds, the network tends to activate specific regions where the fungus is evident on the seeds.

4. Discussion

In this study, we used a low-cost imaging technology combined with convnets for the detection of FHB in wheat seeds. Studies using imaging technologies for this seed species and deep-learning approaches are mainly based on hyperspectral imaging systems [8,14,15,16,40]. Although hyperspectral imaging is becoming more popular, it still presents cost restrictions and operational complexity [17,19,20]. On the other hand, the use of RGB images generally offers easy-to-use devices with high spatial resolution and low cost [41,42,43]. RGB scanner systems are easy to set up, upgrade, and replace in an online quality control process. Furthermore, the use of these devices (which are based on closed light sources) reduces the influence of ambient lighting and, therefore, does not require advanced processing techniques to obtain accurate results. However, the image capture performance may not be as fast as high-speed cameras, which may not be convenient when analyzing a very large number of samples [41].
RGB images have already been tested for the identification of FHB in wheat seeds with 85% accuracy by means of a linear discriminant analysis [44]. Gu et al. [23] used features of RGB images of wheat ears extracted from AlexNet (a deep convolutional neural network-DCNN) for training a random forest (RF) algorithm, which was able to identify infected and healthy ears with an accuracy of ca. 93%. Qiu et al. [22] used RGB images of the canopy and a mask region-based convolutional neural network (Mask–RCNN) for in-situ non-destructive FHB detection, obtaining an average precision of 92.01%. In our study, a high accuracy (>97%) was achieved using a low-complexity design architecture with hyperparameter optimization and 99% accuracy was reached using pretrained networks with fine-tuning.
The deep-learning approaches (hyperparameter optimization and fine-tuning) applied in the current work were crucial to obtaining accurate models for the detection of FHB. Regarding the number of layers in the custom convnet model, the hyperparameter optimization results demonstrated that the custom convnet with three convolution layers and three dense layers (i.e., the custom convnet with the fewest layers) presented superior performances, both in terms of learning (superior accuracy in random search) and generalization (low overfitting in random search). With increasing network size, the number of parameters also increases, which can generate overparameterization, wherein the network has more parameters than training data (i.e., RGB images of seeds). Therefore, the system tends to overfit the training data and does not learn to generalize when applied to disease prediction in new wheat seed data [45]. The satisfactory generalization of networks can also be attributed to the use of data augmentation. This approach increases the amount of training data through random transformations and helps expose the model to more aspects of the data and enables it to generalize better [46].
The results for hyperparameter optimization also demonstrated that the activation function and optimization were important to improving the accuracy of the custom convnets. The highest accuracy for the validation dataset was obtained with the Elu function, along with the mini-batch stochastic gradient descent (SGD) optimizer. The identity function, Elu, tends to normalize the output of the layers [47]. This normalization probably increased the accuracy by optimizing the performance of the SGD in the process of updating the trainable parameters (weights) of the network to minimize the cost function.
We used binary cross-entropy (cost function) to compute the loss during the network training, which is in consonance with the binary classification of the seeds (healthy and unhealthy) [48]. The other hyperparameters were optimized following the direction of the correlations to keep the custom convnet more parsimonious. For instance, dropout had a low correlation with accuracy, so we applied only 1% dropout. Dropout is a regularization technique that randomly zeroes out the input units of a layer, breaking fixed patterns to avoid overfitting, but can decrease accuracy at high rates [49]. The learning rate was one of the hyperparameters that showed the highest correlation with accuracy in hyperparameter optimization, indicating that a higher learning rate would be better in FHB detection. Inversely, at high learning rates, network updates can result in great randomness [50]; therefore, we applied a rate that decreased during the training epochs (each iteration over all the training data).
Fine-tuning is an interesting technique to reuse the model weights learned in large datasets in a new dataset. The model was fine-tuned to the new data of interest. The models tested in the current study (MobileNet, InceptionV3, VGG16, VGG19, and Xception) were trained on the ImageNet dataset. This dataset was broad enough that the resources learned by the pretrained networks could effectively act as a generic and relevant model for the detection of FHB in wheat seeds [37]. Although the MobileNet FT 50 and InceptionV3 FT 100 strategies showed similar accuracy in the fine-tuning stage, InceptionV3 FT 100 presented better predictive capacity (i.e., better performance in the test stage), as indicated in the Z-test. InceptionV3 and MobileNet networks have similar proposals, but InceptionV3 aims for high precision, while MobileNet is a lightweight model that balances compression with accuracy [51]. Thus, InceptionV3 was the model that exhibited better generalization capacity in the prediction of the FHB. An interesting result is that the custom convnet was similar to InceptionV3, indicating that even a small network with few parameters can be applied successfully in the identification of FHB in wheat seeds with low computational cost.
The specific areas of the seeds detected by the network (i.e., the most activated areas) would be difficult to manually extract for the detection of FHB in wheat seeds. Meanwhile, the application of deep learning methods allowed the extraction of different features automatically, without requiring manual features. This means that this method has great potential for practical applications in quality-control programs of wheat seeds, with high throughput capacity and high accuracy, in addition to the advantage of requiring low-cost equipment. With the availability of sufficiently good quality images, the models could also be trained in the future to make classifications based on the severity of FHB on seeds and even of other diseases, such as Ergot (Claviceps purpurea Tul.) [18]. However, despite the promising results of our approach, FHB symptoms are genotype-dependent, and the accuracy of the detection method may vary depending on phenotypic variations among wheat cultivars. This issue, however, can be solved by training the convnets with datasets of seed images of the different cultivars used worldwide.

5. Conclusions

We present an approach based on deep learning (hyperparameter optimization and fine-tuning) with different convnets (MobileNet, InceptionV3, VGG16, VGG19, and Xception) using RGB images for automatic inspection of classes of wheat seeds infected by FHB. The proposed method was developed using wheat seeds of the TBIO Toruk cultivar, and the pretrained convnets with fine-tuning allowed an increase in the accuracy of detection of infected seeds to more than 97% with the InceptionV3 FT 100 model and the custom convnet. Therefore, our findings provide guidelines for the accurate detection of FHB in wheat seeds using low-cost imaging technology combined with deep-learning models, providing new opportunities for non-destructive and rapid screening of the wheat seed health status in breeding programs, seed-analysis laboratories, and the food industry.

Supplementary Materials

The following supporting information can be downloaded at: https://www.mdpi.com/article/10.3390/agriculture12111801/s1, Table S1: Recent studies focusing on the detection of FHB in wheat structures through RGB and/or Hyperspectral images combined with different classification approaches.

Author Contributions

Conceptualization, A.D.M. and L.d.S.; methodology, R.C.B. and A.D.M.; formal analysis, R.C.B., A.D.M., and L.d.S.; investigation, R.C.B., A.D.M., and L.C.; validation, L.d.S. and C.B.M.; writing—original draft, R.C.B. and A.D.M.; data curation, R.C.B. and A.D.M.; writing—review and editing, L.d.S., G.F.M., T.M., A.N., and C.B.M.; visualization, L.d.S., L.C., T.M., A.N., and C.B.M.; supervision, L.d.S. and G.F.M.; project administration, L.d.S.; funding acquisition, L.d.S., T.M., and C.B.M.; resources, L.d.S. and C.B.M. All authors have read and agreed to the published version of the manuscript.

Funding

This work was supported by the Sao Paulo Research Foundation (FAPESP, Grant number 2017/15220-7); the National Council for Scientific and Technological Development (CNPq, Grant numbers 301725/2019-5 and 141342/2020-0); the Coordination for the Improvement of Higher Education Personnel (CAPES, Finance code 001); and the Minas Gerais Research Foundation (FAPEMIG).

Institutional Review Board Statement

Not applicable.

Data Availability Statement

Not applicable.

Acknowledgments

We thank the National Council for Scientific and Technological Development (CNPq), the Coordination for the Improvement of Higher Education Personnel (CAPES), the Sao Paulo Research Foundation (FAPESP), and the Minas Gerais Research Foundation (FAPEMIG) for the financial support.

Conflicts of Interest

The authors declare no conflict of interest. The funders had no role in the design of the study; in the collection, analysis, or interpretation of data; in the writing of the manuscript; or in the decision to publish the results.

References

  1. Gruber, K. Agrobiodiversity: The living library. Nature 2017, 544, S8–S10. [Google Scholar] [CrossRef] [PubMed]
  2. Ghimire, B.; Sapkota, S.; Bahri, B.A.; Martinez-Espinoza, A.D.; Buck, J.W.; Mergoum, M. Fusarium head blight and rust diseases in soft red winter wheat in the Southeast United States: State of the art, challenges and future perspective for breeding. Front. Plant Sci. 2020, 11, 1080. [Google Scholar] [CrossRef] [PubMed]
  3. Sari, E.; Knox, R.E.; Ruan, Y.; Henriquez, M.A.; Kumar, S.; Burt, A.J.; Cuthbert, R.D.; Konkin, D.J.; Walkowiak, S.; Campbell, H.L.; et al. Historic recombination in a durum wheat breeding panel enables high-resolution mapping of Fusarium head blight resistance quantitative trait loci. Sci. Rep. 2020, 10, 7567. [Google Scholar] [CrossRef] [PubMed]
  4. Legrand, F.; Picot, A.; Cobo-Díaz, J.F.; Chen, W.; Floch, G.L. Challenges facing the biological control strategies for the management of Fusarium Head Blight of cereals caused by F. graminearum. Biol. Control 2017, 113, 26–38. [Google Scholar] [CrossRef]
  5. Sharafi, Z.; Sadravi, M.; Abdollahi, M. Impact of 29 seed-borne fungi on seed germination of four commercial wheat cultivars. Seed Sci. Technol. 2017, 45, 570–579. [Google Scholar] [CrossRef]
  6. Femenias, A.; Gatius, F.; Ramos, A.J.; Sanchis, V.; Marín, S. Near-infrared hyperspectral imaging for deoxynivalenol and ergosterol estimation in wheat samples. Food Chem. 2021, 341, 128206. [Google Scholar] [CrossRef]
  7. Jørgensen, J.; Shrestha, S. Detection of Fusarium in wheat by multispectral Imaging. In Proceedings of the Final COBRA Conference, Vingsted, Denmark, 16–18 September 2015. [Google Scholar] [CrossRef]
  8. Zhang, N.; Pan, Y.; Feng, H.; Zhao, X.; Yang, X.; Chuanlong, D.; Yang, G. Development of Fusarium head blight classification index using hyperspectral microscopy images of winter wheat spikelets. Biosyst. Eng. 2019, 186, 83–99. [Google Scholar] [CrossRef]
  9. Moghimi, A.; Yang, C.; Anderson, J.A.; Reynolds, S.K. Selecting informative spectral bands using machine learning techniques to detect Fusarium head blight in wheat. In Proceedings of the ASABE Annual International Meeting, Boston, MA, USA, 7–10 July 2019; p. 1900815. [Google Scholar] [CrossRef]
  10. Zhang, D.Y.; Chen, G.; Yin, X.; Hu, R.J.; Gu, C.Y.; Pan, Z.G.; Zhou, X.G.; Chen, Y. Integrating spectral and image data to detect Fusarium head blight of wheat. Comput. Electron. Agric. 2020, 175, 105588. [Google Scholar] [CrossRef]
  11. Mustafa, G.; Zheng, H.; Khan, I.H.; Tian, L.; Jia, H.; Li, G.; Cheng, T.; Tian, Y.; Cao, W.; Zhu, Y.; et al. Hyperspectral Reflectance Proxies to Diagnose In-Field Fusarium Head Blight in Wheat with Machine Learning. Remote Sens. 2022, 14, 2784. [Google Scholar] [CrossRef]
  12. Rangarajan, A.K.; Whetton, R.L.; Mouazen, A.M. Detection of fusarium head blight in wheat using hyperspectral data and deep learning. Expert Syst. Appl. 2022, 208, 118240. [Google Scholar] [CrossRef]
  13. Zhang, H.; Huang, L.; Huang, W.; Dong, Y.; Weng, S.; Zhao, J.; Ma, H.; Liu, L. Detection of wheat Fusarium head blight using UAV-based spectral and image feature fusion. Front. Plant Sci. 2022, 13, 1004427. [Google Scholar] [CrossRef] [PubMed]
  14. Senthilkumar, T.; Jayas, D.S.; White, N.D.G.; Fields, P.G.; Grafenhan, T. Detection of fungal infection and Ochratoxin A contamination in stored wheat using near-infrared hyperspectral imaging. J. Stored Prod. Res. 2016, 65, 30–39. [Google Scholar] [CrossRef] [Green Version]
  15. Delwiche, S.R.; Rodriguez, I.T.; Rausch, S.R.; Graybosch, R.A. Estimating percentages of fusarium-damaged kernels in hard wheat by near-infrared hyperspectral imaging. J. Cereal Sci. 2019, 87, 18–24. [Google Scholar] [CrossRef] [Green Version]
  16. Liang, K.; Huang, J.; He, R.; Wang, Q.; Chai, Y.; Shen, M. Comparison of Vis-NIR and SWIR hyperspectral imaging for the non-destructive detection of DON levels in Fusarium head blight wheat kernels and wheat flour. Infrared Phys. Technol. 2020, 106, 103281. [Google Scholar] [CrossRef]
  17. Nadimi, M.; Brown, J.M.; Morrison, J.; Paliwal, J. Examination of wheat kernels for the presence of Fusarium damage and mycotoxins using near-infrared hyperspectral imaging. Meas. Food 2021, 4, 100011. [Google Scholar] [CrossRef]
  18. Erkinbaev, C.; Nadimi, M.; Paliwal, J. A unified heuristic approach to simultaneously detect fusarium and ergot damage in wheat. Meas. Food 2022, 7, 100043. [Google Scholar] [CrossRef]
  19. Moghaddam, T.M.; Razavi, S.M.A.; Taghizadeh, M. Applications of hyperspectral imaging in grains and nuts quality and safety assessment: A review. J. Food Meas. Charact. 2013, 7, 129–140. [Google Scholar] [CrossRef]
  20. Mahesh, S.; Jayas, D.S.; Paliwal, J.; White, N.D.G. Hyperspectral imaging to classify and monitor quality of agricultural materials. J. Stored Prod. Res. 2015, 61, 17–26. [Google Scholar] [CrossRef]
  21. Santos, A.A.; Marcato Junior, J.; Araújo, M.S.; Martini, D.R.D.; Tetila, E.C.; Siqueira, H.L.; Aoki, C.; Eltner, A.; Matsubara, E.T.; Pistori, H.; et al. Assessment of CNN-based methods for individual tree detection on images captured by RGB cameras attached to UAVs. Sensors 2019, 19, 3595. [Google Scholar] [CrossRef] [Green Version]
  22. Qiu, R.; Yang, C.; Moghimi, A.; Zhang, M.; Steffenson, B.J.; Hirsch, C.D. Detection of Fusarium Head Blight in Wheat Using a Deep Neural Network and Color Imaging. Remote Sens. 2019, 11, 2658. [Google Scholar] [CrossRef] [Green Version]
  23. Gu, C.; Wang, D.; Zhang, H.; Zhang, J.; Zhang, D.; Liang, D. Fusion of deep convolution and shallow features to recognize the severity of wheat Fusarium head blight. Front. Plant Sci. 2020, 11, 599886. [Google Scholar] [CrossRef]
  24. Mohanty, S.P.; Hughes, D.P.; Salathé, M. Using deep learning for image-based plant disease detection. Front. Plant Sci. 2016, 7, 1419. [Google Scholar] [CrossRef] [PubMed] [Green Version]
  25. Kamilaris, A.; Prenafeta-Boldu, F.X. Deep learning in agriculture: A survey. Comput. Electron. Agric. 2018, 147, 70–90. [Google Scholar] [CrossRef] [Green Version]
  26. Toda, Y.; Okura, F.; Ito, J.; Okada, S.; Kinoshita, T.; Tsuji, H.; Saisho, D. Training instance segmentation neural network with synthetic datasets for crop seed phenotyping. Commun. Biol. 2020, 3, 173. [Google Scholar] [CrossRef] [PubMed] [Green Version]
  27. Albarrak, K.; Gulzar, Y.; Hamid, Y.; Mehmood, A.; Soomro, A.B. A Deep Learning-Based Model for Date Fruit Classification. Sustainability 2022, 14, 6339. [Google Scholar] [CrossRef]
  28. Hamid, Y.; Wani, S.; Soomro, A.B.; Alwan, A.A.; Gulzar, Y. Smart Seed Classification System based on MobileNetV2 Architecture. In Proceedings of the 2nd International Conference on Computing and Information Technology (ICCIT), Tabuk, Saudi Arabia, 25–27 January 2022; pp. 217–222. [Google Scholar] [CrossRef]
  29. Zhang, X.; Xun, Y.; Chen, Y. Automated identification of citrus diseases in orchards using deep learning. Biosyst. Eng. 2022, 223 Pt A, 249–258. [Google Scholar] [CrossRef]
  30. Alom, M.Z.; Taha, T.M.; Yakopcic, C.; Westberg, S.; Sidike, P.; Nasrin, M.S.; Hasan, M.; Essen, B.C.V.; Awwal, A.S.; Asari, V.K. A state-of-the-art survey on deep learning theory and architectures. Electronics 2019, 8, 292. [Google Scholar] [CrossRef]
  31. Bergstra, J.; Bengio, Y. Random search for hyper-parameter optimization. J. Mach. Learn. Res. 2012, 13, 281–305. [Google Scholar]
  32. Käding, C.; Rodner, E.; Freytag, A.; Denzler, J. Fine-tuning deep neural networks in continuous learning scenarios. In Computer Vision—ACCV 2016 Workshops; Springer: Cham, Switzerland, 2017; pp. 588–605. [Google Scholar] [CrossRef]
  33. Howard, A.G.; Zhu, M.; Chen, B.; Kalenichenko, D.; Wang, W.; Weyand, T.; Andreetto, M.; Adam, H. MobileNets: Efficient convolutional neural networks for mobile vision applications. arXiv 2017, arXiv:1704.04861. [Google Scholar]
  34. Szegedy, C.; Vanhoucke, V.; Ioffe, S.; Shlens, J.; Wojna, Z. Rethinking the inception architecture for computer vision. arXiv 2015, arXiv:1512.00567. [Google Scholar]
  35. Simonyan, K.; Zisserman, A. Very Deep Convolutional Networks for Large-Scale Image Recognition. In Proceedings of the 3rd International Conference on Learning Representations, ICLR 2015—Conference Track Proceedings, San Diego, CA, USA, 7–9 May 2015; pp. 1–14. [Google Scholar]
  36. Chollet, F. Xception: Deep learning with depthwise separable convolutions. In Proceedings of the IEEE Conference on Computer Vision and Pattern Recognition (CVPR), Honolulu, HI, USA, 21–26 July 2017; pp. 1251–1258. [Google Scholar]
  37. Deng, J.; Dong, W.; Socher, R.; Li, L.J.; Li, K.; Fei-Fei, L. ImageNet: A large-scale hierarchical image database. In Proceedings of the IEEE Conference on Computer Vision and Pattern Recognition, Miami, FL, USA, 20–25 June 2009; pp. 248–255. [Google Scholar] [CrossRef] [Green Version]
  38. McHugh, M.L. Interrater reliability: The kappa statistic. Biochem. Med. 2012, 22, 276–282. [Google Scholar] [CrossRef]
  39. R Core Team. R: A Language and Environment for Statistical Computing. R Foundation for Statistical Computing. Available online: https://www.R-project.org/ (accessed on 8 March 2022).
  40. Barbedo, J.G.A.; Tibola, C.S.; Fernandes, J.M.C. Detecting Fusarium head blight in wheat kernels using hyperspectral imaging. Biosyst. Eng. 2015, 131, 65–76. [Google Scholar] [CrossRef]
  41. Vadivambal, R.; Jayas, D.S. Bio-Imaging: Principles, Techniques, and Applications; CRC Press: Boca Raton, FL, USA; Taylor & Francis Group: Abingdon, UK, 2016; 399p. [Google Scholar] [CrossRef]
  42. Özkan, K.; Işık, Ş.; Yavuz, B.T. Identification of wheat kernels by fusion of RGB, SWIR, and VNIR samples. J. Sci. Food Agric. 2019, 99, 4977–4984. [Google Scholar] [CrossRef]
  43. Gulzar, Y.; Hamid, Y.; Soomro, A.B.; Alwan, A.A.; Journaux, L. A Convolution Neural Network-Based Seed Classification System. Symmetry 2020, 12, 2018. [Google Scholar] [CrossRef]
  44. Jirsa, O.; Polišenská, I. Identification of Fusarium damaged wheat kernels using image analysis. Acta Univ. Agric. Silvic. Mendel. Brun. 2011, 59, 125–130. [Google Scholar] [CrossRef] [Green Version]
  45. Salman, S.; Liu, X. Overfitting mechanism and avoidance in deep neural networks. arXiv 2019, arXiv:1901.06566. [Google Scholar]
  46. Mikołajczyk, A.; Grochowski, M. Data augmentation for improving deep learning in image classification problem. In Proceedings of the International Interdisciplinary PhD Workshop (2018 IIPhDW), Świnouście, Poland, 9–12 May 2018; pp. 117–122. [Google Scholar] [CrossRef]
  47. Clevert, D.A.; Unterthiner, T.; Hochreiter, S. Fast and accurate deep network learning by exponential linear units (ELUs). arXiv 2016, arXiv:1511.07289. [Google Scholar]
  48. Ho, Y.; Wookey, S. The real-world-weight cross-entropy loss function: Modeling the costs of mislabeling. IEEE Access 2020, 8, 4806–4813. [Google Scholar] [CrossRef]
  49. Srivastava, N.; Hinton, G.; Krizhevsky, A.; Sutskever, I.; Salakhutdinov, R. Dropout: A simple way to prevent neural networks from overfitting. J. Mach. Learn. Res. 2014, 15, 1929–1958. [Google Scholar]
  50. Wilson, D.R.; Martinez, T.R. The need for small learning rates on large problems. In Proceedings of the International Joint Conference on Neural Networks, Washington, DC, USA, 15–19 July 2001; pp. 115–119. [Google Scholar] [CrossRef] [Green Version]
  51. Zhao, P.; Li, C.; Rahaman, M.M.; Xu, H.; Yang, H.; Sun, H.; Jiang, T.; Grzegorzek, M. A Comparative Study of Deep Learning Classification Methods on a Small Environmental Microorganism Image Dataset (EMDS-6): From Convolutional Neural Networks to Visual Transformers. Front. Microbiol. 2022, 13, 792166. [Google Scholar] [CrossRef]
Figure 1. Flowchart depicting the deep-learning procedures and the proposed imaging technology. The numbers on the right side of the rectangles indicate the step in the process. These steps are described in the subsequent sections from Section 2.2 to Section 2.5.
Agriculture 12 01801 g001
Figure 2. Hyperparameters evaluated in the custom convolutional neural network (convnet) architecture to detect Fusarium head blight disease in wheat seeds. (A) Accuracy validation for the number of convolutional and dense layers; boxes followed by different letters are significantly different (Tukey’s test, p < 0.05). (B) Training loss and validation loss for the number of convolutional and dense layers. Dashed line indicates a significant difference between the number of layers and the solid line indicates no significant difference (Tukey’s test, p < 0.05). (C) Validation accuracy in response to the interaction between the optimizer and activation function. Different uppercase letters indicate differences between optimizers within each level of the activation function, and different lowercase letters indicate differences between activation functions within each level of the optimizer (Tukey’s test, p < 0.05). (D) Correlations among some hyperparameters employed during the custom network architecture optimization. The median, dispersion range (lower and upper quartiles), and confidence intervals (represented as notches) are displayed in all boxplots.
Agriculture 12 01801 g002
Figure 3. Custom network architecture established after hyperparameter optimization by a random search technique. In the convolutional layers, the intermediate convnet outputs (intermediate activations) are represented, showing how the input is transformed to extract the features. The numbers above the layers represent the dimensions for each step. This model was compiled with the stochastic gradient descent optimizer, binary cross-entropy loss function, and batch size = 10.
Agriculture 12 01801 g003
Figure 4. Variables measured during the fine-tuning of pretrained convolutional neural networks. The architectures tested were MobileNet, InceptionV3, VGG16, VGG19, and Xception, with different percentages of weights from the ImageNet dataset. We fine-tuned 0% (FT 0) with a convolutional base using all weights from ImageNet, 20% (FT 20), 50% (FT 50), 80% (FT 80), and 100% (FT 100) training of the complete network with the weights initialized randomly. The training time per epoch is measured in seconds.
Agriculture 12 01801 g004
Figure 5. Performance of different convolutional neural network architectures (convnet) applied in the prediction of Fusarium head blight disease in wheat seeds. (A) A custom convnet after hyperparameter optimization. (B) MobileNet with 50% fine-tuning. (C) InceptionV3 with 100% fine-tuning. The scatter plots show the accuracy (left panel) and loss (middle panel) during the interactions over the epochs. The right panel shows the test confusion matrix for each convnet architecture.
Agriculture 12 01801 g005
Figure 6. RGB images of healthy wheat seeds and seeds infected by Fusarium head blight disease show how the network activates different characteristics in the seed images to predict the presence of infected seeds. The RGB images are exhibited with their respective activation maps and histograms. In the activation map, the color range represents gray levels (0–255) of each pixel, wherein blue indicates regions with little activation, green and yellow indicate intermediate activation, and red indicates high feature activation.
Agriculture 12 01801 g006
Table 1. T Overview of hyperparameter space used in the optimization of the custom convnet architecture.
StateHyperparametersValues
FixedPooling operationMax pooling
Pool size(2,2)
Momentum0.9
Early stopping5 Epochs without improvement
Max. number of epochs50
Kernel size(3,3)
Loss functionBinary cross-entropy
Last-layer activationSigmoid
OptimizedActivation functions{Elu, Relu}
Batch size{5, 10, 20, 30}
Dropout{0, 25%, 50%, 75%}
Optimizer{SGD, Adam, Nadam, RMSprop}
Learning rate{0.01, 0.001, 0.0001, 0.00001}
Filters per conv layer{16, 32, 64, 128, 256, 512}
Number of conv layers{3, 4, 5}
Units per dense layer{16, 32, 64, 128, 256, 512}
Number of dense layers{3, 4, 5}
Publisher’s Note: MDPI stays neutral with regard to jurisdictional claims in published maps and institutional affiliations.

