Article

Interaction and Coupling Mechanism between Recessive Land Use Transition and Food Security: A Case Study of the Yellow River Basin in China

1
School of Public Policy and Management, China University of Mining and Technology, Xuzhou 221116, China
2
College of Public Policy and Management, Hohai University, Nanjing 210098, China
3
Geospatial Science, School of Science, STEM College, RMIT University, Melbourne 3000, Australia
*
Author to whom correspondence should be addressed.
Agriculture 2022, 12(1), 58; https://doi.org/10.3390/agriculture12010058
Submission received: 25 November 2021 / Revised: 26 December 2021 / Accepted: 31 December 2021 / Published: 2 January 2022
(This article belongs to the Special Issue Ecological Restoration and Rural Economic Development)

Abstract

:
The Yellow River Basin (YRB) plays an important role in China’s socioeconomic development and ecological security. From the perspective of recessive land use transition (RLUT), exploring the watershed food security (FS) coordination mechanism is of strategic significance to territorial space optimization and high-quality development. To this end, a coordinated evaluation system was built for analyzing the coupling coordination degree (CCD), spatiotemporal evolution characteristics, and driving mechanism between RLUT and FS of 74 cities in the YRB from 2003 to 2018, using methods such as the coupling coordination degree model, spatial autocorrelation analysis, and the geo-detector model. The results are as follows: (1) Spatial imbalance of RLUT and FS in the YRB is significant. RLUT has significant differences between east and west, and FS has significant differences between north and south. (2) From 2003 to 2018, the CCD between RLUT and FS increased from 0.6028 to 0.6148, maintaining a steady upward trend, and the cold and hot characteristics of spatial agglomeration are significant. (3) The CCD between RLUT and FS depends on population density, average annual temperature, and average elevation. The driving effect of natural factors is higher than the socioeconomic factors on the total basin scale, but the opposite is true on the sub-basin scale. Clarifying the spatiotemporal pattern, characteristics, and mechanism of the coupling and the coordination of RLUT and FS can provide a scientific basis for territorial space planning.

1. Introduction

The unprecedented urbanization and industrialization in China in the past three decades has resulted in significant changes in the land use pattern, including not only changes in the spatial use structure and types but also changes in environmental quality and intensive level in time. These changes are collectively referred to as land use transition (LUT) in academic circles [1,2,3]. Generally speaking, the transition of quantity and type, such as urban expansion, occupation of cultivated land, and returning farmland to forests, is called dominant land use transition, and the change in inherent attributes, such as land quality, property right, input, output, and management mode, is called recessive land use transition (RLUT) [4,5]. The influence of the dominant transition on the population–land–food in the region has already aroused widespread concern, such as the occupation of farmland by urban expansion and mining development [6,7]. RLUT is regarded as the primary force for promoting the transformation of the population–land–food system, bringing about direct socio-economic and environmental effects on regional sustainable development [8,9]. There are many such cases. For example, the huge migration of rural labor force to cities has led to marginalization of agricultural production; substitution of physical and chemical capital, such as pesticides and fertilizers, leads to degradation of the farmland environment; and the land transfer caused by the intervention of industrial and commercial capital leads to the non-grain conversion of cultivated land. All these have completely changed the key bearing factors of human coordination between land and grain [3,10]. The rapid economic and social development in China has not only upgraded the demand for diversified agricultural products but also triggered people’s pursuit of high-quality ecological products and ecological services [11,12,13]. The problem of food security is becoming increasingly prominent, and there is a complex and interdependent relationship between RLUT and FS. How to coordinate and optimize the relationship between them is the major issue in front of the academicians.
People change the way of land use and management, which directly triggers tremendous land use transitions in China [14,15]. A new way of comprehensive research on land use change and land use transition was first introduced by Long [4], which gradually entered the academic vision at home and abroad, making it a multi-disciplinary research hotspot [16,17]. At present, a lot of research is being conducted on LUT, ranging from theoretical hypothesis and connotation measurement [8,18,19], transition mode and potential [20,21,22], and dynamic driving mechanisms [7,23,24,25] to understanding the relationship between land use transitions and other socio-economic activities [26,27]. For example, Song Xiaoqing combed the origin, expansion, and enlightenment of LUT; discriminated the connotation differences between LUT and land use change; and then constructed the research framework of LUT [18]. He pointed out that there are significant differences between land use change and land use transition in basic types, spatiotemporal scales, value subjects, driving factors, trajectory characteristics, and results/effects. The empirical research mainly focused on the different spatial scales of the whole country, city, county, and watershed [8,24,28,29,30,31] to construct the transfer matrix, dynamic attitude model, GIS spatial analysis, landscape index model, etc., to study the spatiotemporal pattern of LUT [31,32,33]. Spatial econometric regression, geographic detectors, GWR, and other models were used to reveal the driving mechanism of LUT or explore the different effects of LUT [7,25,26,34]. For example, Yin et al. constructed the land use transition Tupu and the ecological service value Tupu, which revealed the temporal and spatial characteristics of LUT and its impact on the ecological effect in the YRB [26].
Lambin and Meyfroidt [2] divided the LUT mode into two categories: one is the expansion of the agricultural field, in which the marginal land is constantly converted into agricultural land due to the growing global demand for food and other agricultural products, and the other is the intensification of agricultural land, which is closely related to the pursuit of utilization efficiency. The former is dominant, while the latter is recessive. RLUT implies inherent essential changes, which have an impact on land functions, such as grain production capacity. At present, China’s economy and society have shifted to high-quality development, and only paying attention to the dominant transition cannot meet actual needs, so it is necessary to carry out in-depth research on RLUT. Some studies have tried to construct the evaluation index system of RLUT and analyzed the connotation and form, but it is still in the exploratory stage. For example, Cheng et al. explored the spatiotemporal pattern and transformation mode of RLUT in China and found that the recessive transformation show characteristics of periodicity and stage, with the transformation period showing an S shape [35]. Some scholars have discussed the coupling and coordination between RLUT and grain yield, although food security is not the only quantitative security [36,37], but attention should also be paid to production, consumption, circulation, and many other aspects of security [12,38]. Therefore, it is necessary to study the relationship between RLUT and FS, objectively evaluate the CCD between them, and optimize the allocation of regional land resources.
Although FS is the overall strategy of a country, unified regulation is essential in different regions, and FS at the watershed scale cannot be ignored, especially in the YRB, which spans many agricultural regions. As the cradle of Chinese civilization, it carries 24.2% of the country’s population and 13.4% of grain output [39]. Although the proportion of the total grain output is not high, grain production, transportation, and processing are inseparable from the support of soil and water resources and are related to the ecological protection and high-quality development strategy of “determined by water and water quantity” in the YRB. RLUT depends on economic transformation and development and is closely related to food security. For the past two decades, there is a strong interaction between human activities and the natural environment in the whole basin and ecological transformation has gradually become the dominant type of LUT in the basin. Some areas have unreasonable land use and a large water demand, resulting in a shortage of water resources, while other areas are devoid of supporting projects for agricultural production, thereby affecting food security and the ecology [40,41]. All these indicate that the land use and grain problems in the basin are deep rooted, neither properly coordinated nor paid due attention to. Food security and ecological security urgently need a proper land use pattern with a reasonable structure and orderly space as support [42]. In view of the overall scale of the YRB, studying the relationship between RLUT and FS can provide a decision-making reference for the optimal allocation of land resources in the future. However, research on LUT in the YRB focuses only on the dynamics of land use change and its causes, but the impact of such changes on FS still needs further investigation [42,43].
In view of the above-cited problems and, especially, the strategic role played by the YRB in Chinese economic development, this study was undertaken. The theoretical framework of the relationship between RLUT and FS was constructed in the second part. The spatiotemporal evolution between the characteristics of RLUT and FS were analyzed, and the coupling coordination degree model (CCDM) was used to identify the relationship between RLUT and FS in the third part. The fourth part elaborates the geographic detector model used to explore the driving mechanism of the coupling and coordination degree between RLUT and FS and puts forward relevant policy recommendations. This study is likely to provide a reference for the optimization of land resource allocation and the improvement in grain production capacity in different regions of the YRB. In addition, the requisite policy support necessary for territorial spatial planning and regional sustainable development is also suggested.

2. Theoretical Framework

Farmland protection explicitly limits the use of agricultural land in terms of quantity and space, so is food safe enough? Obviously not; the key obstacles to the current FS are the low efficiency of grain growing, the loss of the rural labor force, the shortage of water resources, and the pollution of cultivated land. Only using dominant transition to judge whether FS meets the requirements in the future will not be helpful. The number one document of the Central Committee of the People’s Republic of China in 2021 states that the quality of cultivated land and R&D should continuously improve, “storing grain in the land and technology” essentially needs support and guarantee, and the improvement of total factor productivity should drive output benefits and avoid land exhaustion. However, the interaction between RLUT and FS is rather complex.
RLUT mainly affects economic and social development [4]. Different land uses are complementary to each other and jointly promote the transformation of the regional FS pattern [36,44]. The elements of RLUT and FS are neither independent operations within the system nor a single correspondence between the two systems, but the interaction between multiple elements and the interaction process are extremely complex. In essence, it can be regarded as the optimal allocation of production factors under the influence of natural, social, economic, technological, and other external factors, jointly promoting the coordinated development of the man–land coupling system. Consequently, the relationship between RLUT and FS is refined and simplified to depict the coupling mechanism (Figure 1).
The RLUT system has three parts: factor input, output benefit, and utilization intensity. The FS system has three links: production, consumption, and circulation. This promotes the coupling and coordination of the two systems through mutual influence of capital, technology, labor force, industry, ecological environment, and other factors [45] in the following two ways:
(1) The recessive transformation of land use promotes the evolution of the food security pattern [46]. (i) Reasonable capital, technology, and labor input can support and guarantee agricultural production, accelerate the transformation of traditional agriculture to the large scale, help to optimize the allocation of resources, and improve grain production capacity [47]. However, at present, the benefit of growing grain is insignificant, and the new construction on land will inevitably occupy a lot of cultivated land in the process of urbanization, which will lead to the spread of non-agricultural and non-grain-cultivated land. The migration of a large number of the young rural labor force has accelerated the growth of cities and towns, resulting in a reduction in agriculture labor input, lessening the area of arable land and increasing idle land, thereby restricting grain production [6]. (ii) The industrial structure adjustment and the economic development transformation accelerate the gradual shift from the primary industry to secondary and tertiary industries, drive the surplus employment of the rural labor force, provide more non-agricultural employment opportunities, and promote the transformation of the rural industrial development mode, the employment mode, and the consumption structure [28]. This subsequently increases farmers’ income, upgrades grain consumption demand, and ensures the safety of grain consumption. (iii) Efficient allocation of land resources and moderate land use are in line with the goal of sustainable land management [8]. It will help to improve the grain production capacity and lead to higher cultivated land-planting benefits, reduce the circulation cost of agricultural products, and ensure regional grain circulation.
(2) The transformation of FS will influence RLUT in different ways. (i) The increase in grain production needs mechanization, a professional production mode, and advanced technology support so as to provide more factors for RLUT [4]. (ii) Agricultural modernization will not only promote the development of agricultural industrialization and upgrade the industrial structure and system improvement but also change the farmers’ production and lifestyle, broaden the channels of increasing the farmers’ income, and inject strong internal power into RLUT [42]. (iii) The state has implemented a number of policies, such as purchasing at the lowest price, grain rotation circulation, collection, storage, and distribution, to ensure prompt regional grain supply to a certain extent [48]. To meet the food supply, a region should not only strictly control the expansion of construction land but also curb the cultivated land conversion and control non-grain cultivated land. This trade-off determines that the land resources cannot be developed and used in the absence of restrictions, and suitable land use patterns to improve the efficiency of land resource allocation. Judging from this, all aspects of FS may affect the sustainability of land use and promote or restrain RLUT.

3. Data Sources and Methods
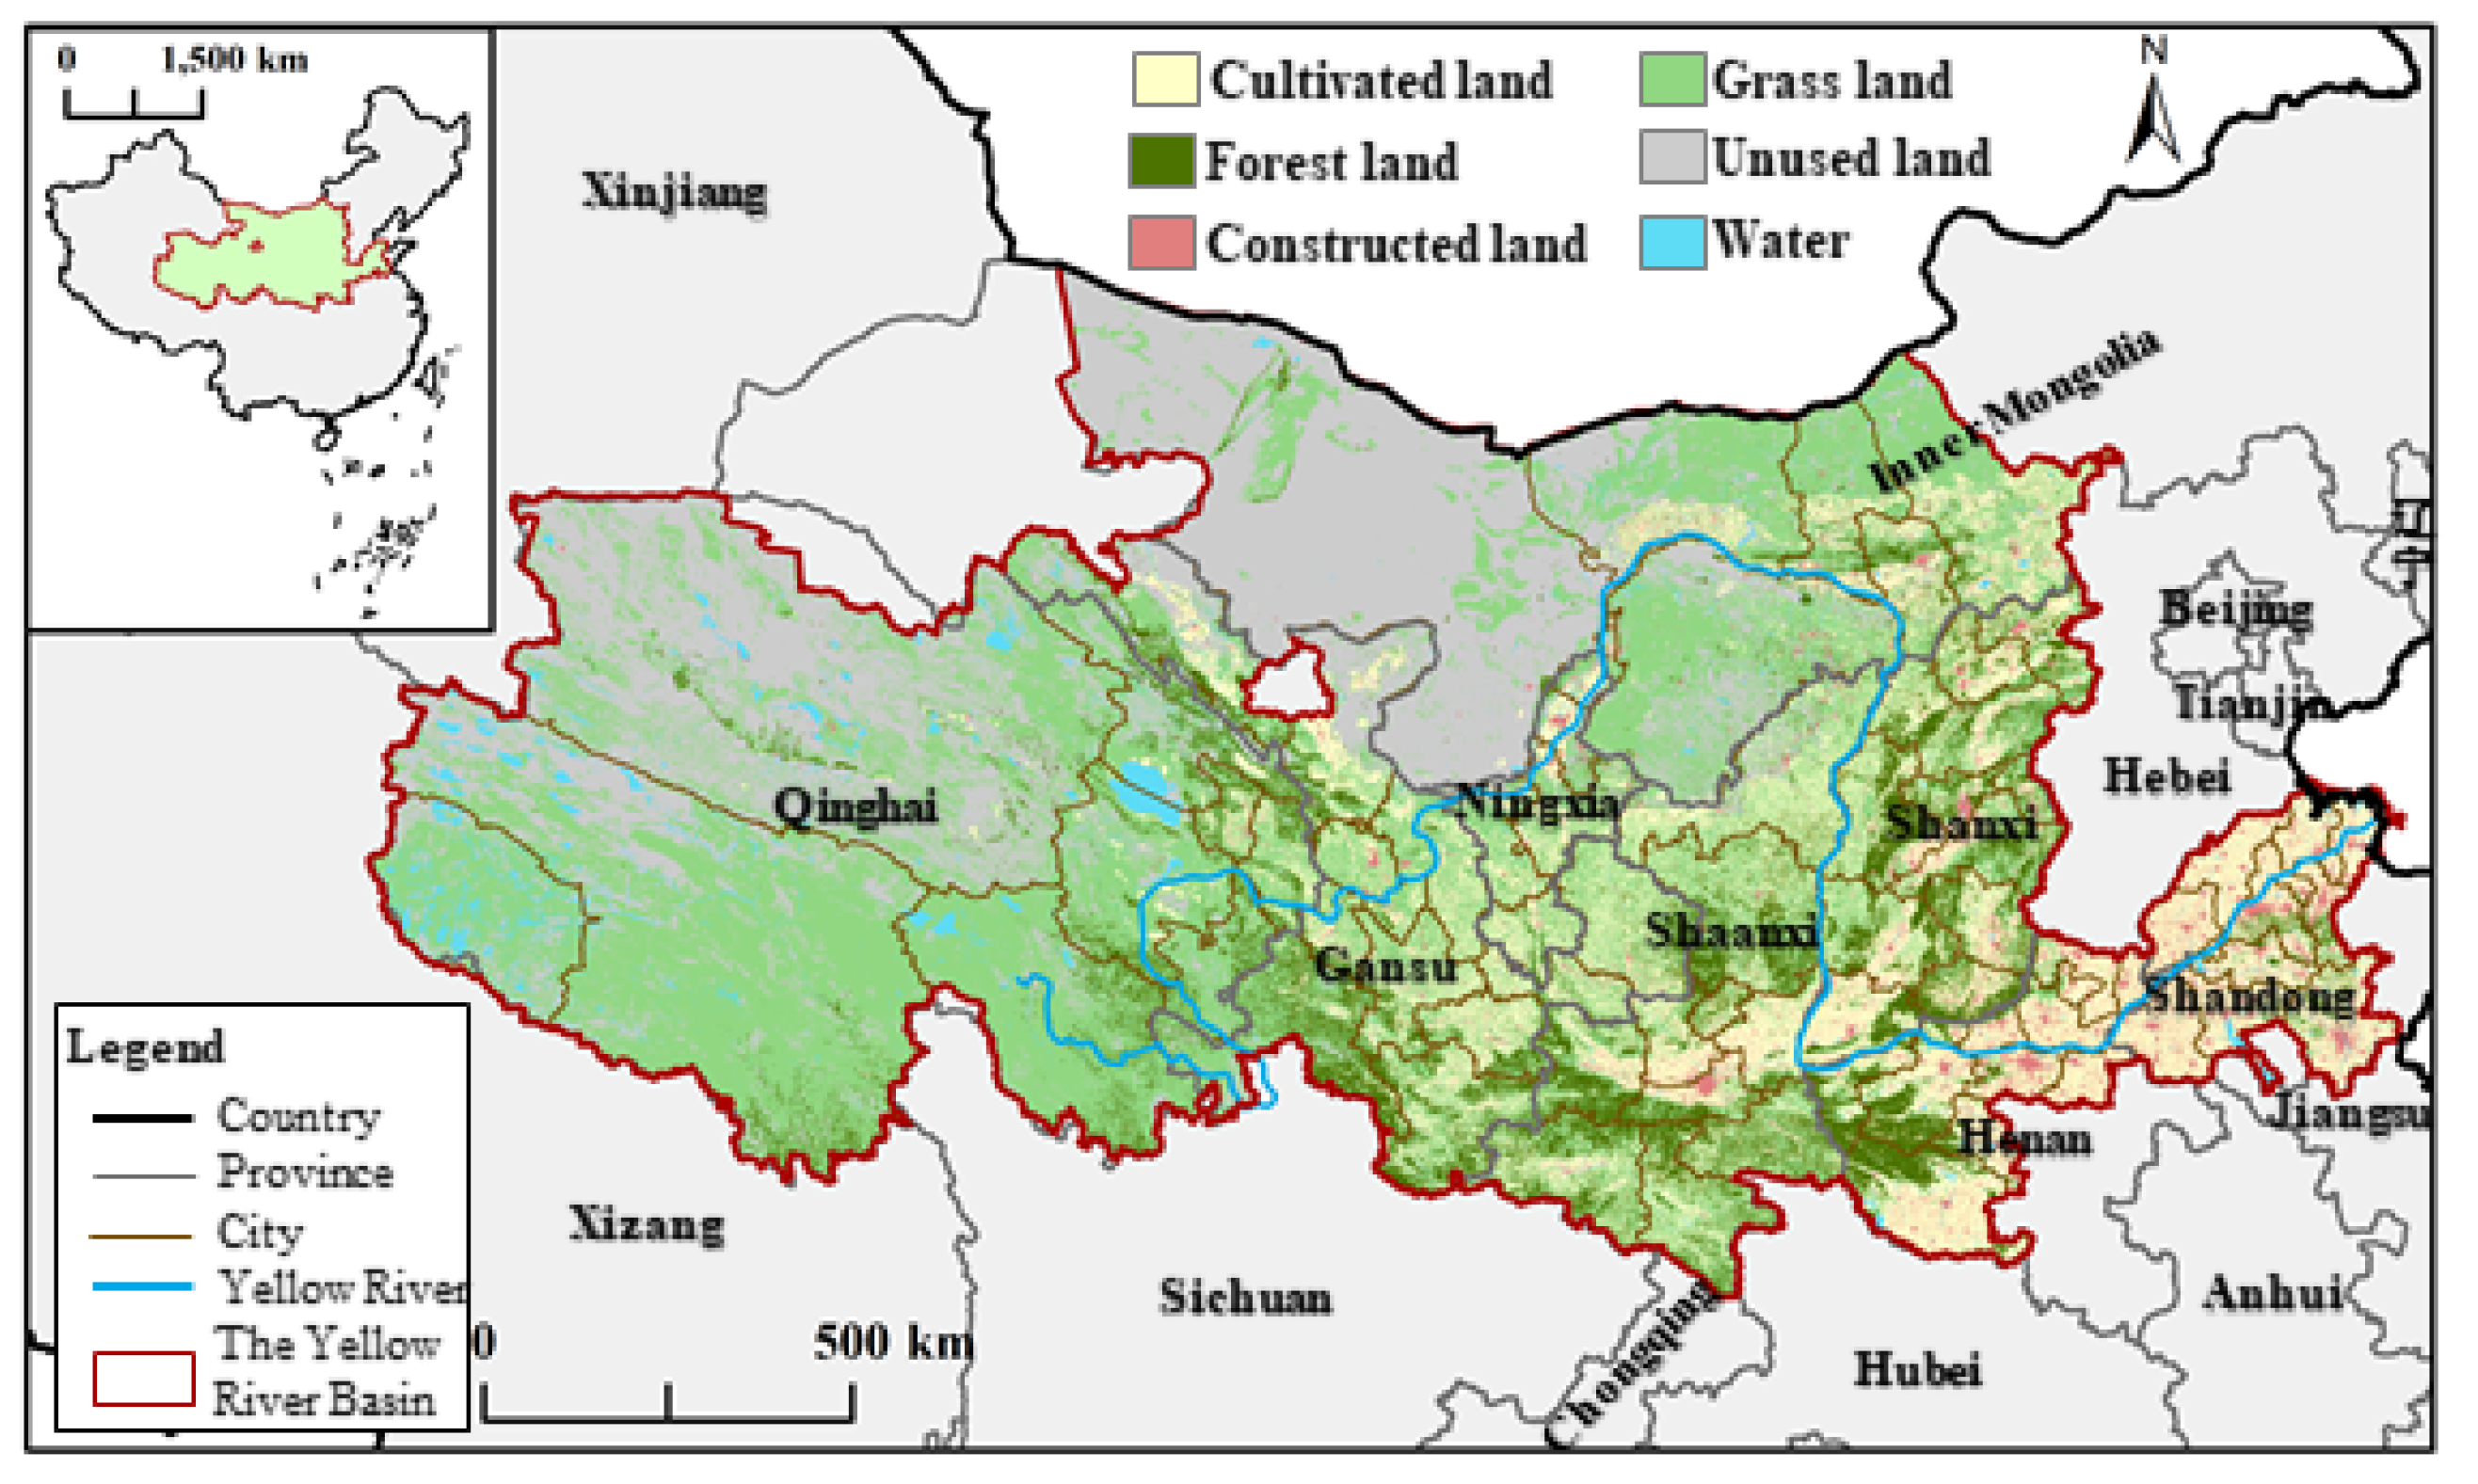
3.1. Study Area

Originating from the Bayan Kara Mountains in Qinghai Province, China, the Yellow River involves 9 provinces (autonomous regions), including Qinghai, Sichuan, Gansu, Ningxia, Inner Mongolia, Shaanxi, Shanxi, Henan, and Shandong, which is located at 95°53’–119°05′ E, 32°10’–41°50′ N. Since Sichuan Province has been integrated into the Yangtze River economic belt and the Yellow River only flows through Aba Prefecture and Ganzi Prefecture in Sichuan, the population and economy only account for 0.7% and 0.3% of the whole basin, respectively, which has little impact on the overall pattern, so Sichuan was excluded in this study [49]. Therefore, the YRB in this study only included 74 cities in 8 provinces (Figure 2). The YRB plays an important role in the national economic development pattern [39]. The total area of the basin is 262 × 104 km2, accounting for 27.3% of the total area of the country. The total GDP is 180182.4 × 108 yuan, accounting for 21.8% of the total GDP of the country [49]. In 2018, the total population of the YRB was 3.6 × 10⁸, accounting for 24.2% of the population of China, producing only 13.4% of the country’s grain production, so the food security situation is not optimistic.

3.2. Data Sources

Considering the availability and comparability of data, 2003, 2008, 2013, and 2018 were selected as the research time points, and the data sources were divided into two parts:
(1) Natural environment data. The average annual temperature and precipitation were derived from the National Meteorological Service Data Center (http://data.cma.cn/ (accessed on 25 November 2021)). The original data were monthly data of meteorological stations in the YRB. After excluding the data of abnormal stations, the annual average value of the remaining station data was calculated. According to the related research [50], the raster data of annual precipitation and annual temperature of 74 prefectures and cities in the YRB were obtained by Kriging interpolation. The average digital elevation model (DEM) with a spatial resolution of 30 m was supplied by the Resource and Environmental Science Data Center (http://www.resdc.cn/ (accessed on 25 November 2021)). On this basis, the natural environment data of 74 prefectures and cities were calculated by using the table display zoning tool in ArcGis.
(2) Socio-economic data. The socio-economic data of 74 prefectures and cities in the YRB mainly come from the China Statistical Yearbook, the China Urban Statistical Yearbook, the China Regional Economic Statistical Yearbook, the China Rural Statistical Yearbook, the National cost and compilation of Agricultural products, the 74 cities’ Statistical Yearbook, the Water Resources Bulletin, and the Statistical Bulletin on National Economic and Social Development. There was a lack of data in some cities of Qinghai and Gansu, which were corrected by provincial data and the adjacent year trend method, as appropriate.

3.3. Methods

3.3.1. The Evaluation Index System

This study aimed to measure the interactive relationship between RLUT and FS using an objective, comprehensive, and scientific method. For this purpose, the following general selection criterion were adopted:
(1) The index system should cover the components of RLUT and the FS predetermined categories.
(2) It is necessary to further point out the meaning of the direction of the evaluation index. Among them, “+” and “–,” respectively, indicated that the information entropy of the evaluation index increases or decreases the overall evaluation level of the evaluation index system.
(3) The entropy method was used to calculate the index weight of each factor.
From the perspective of analysis, the existing index system as a measurement of RLUT was divided into “input–output” two dimensions [40] and “economy–society–ecology” three dimensions [35]. According to the analysis framework of this study, RLUT needs to consider not only input and output but land use intensity as well. Therefore, this paper constructed a three-dimensional RLUT compound index system of “factor input–output benefit–utilization intensity,” as shown in Table 1.
With reference to the FAO definition of FS, it is necessary to consider not only the security of output and supply but also the security of the production process [12]. Therefore, this study intended to put forward a specific FS evaluation index system from three aspects: production, consumption, and circulation (Table 2).
There are significant differences in many index values among the upper, middle, and lower reaches due to the imbalance of regional development in the YRB. To avoid the over-concentration of evaluation results and improve the differentiation and stability of the standardization process, in line with the idea of “abandoning the part and improving the whole,” the distribution of the original data was optimized with reference to existing research [35].
x i = { max p x i > max p x i min l x i max p min l x i < min l
where maxp and minl represent the index values of the largest p and the smallest l obtained by sorting the original values of the index xi from small to large (1 ≤ p, l ≤ n), respectively, and the outliers maxp and minl are determined by manual interpretation.

3.3.2. The Entropy Method

Entropy mainly comes from a concept in thermodynamics, which mainly represents the dispersion degree of indicators. The smaller the entropy value is, the greater the dispersion degree of indicators is, and the greater the influence (weight) of indicators on comprehensive evaluation is, otherwise, the smaller the influence (weight) of indicators on comprehensive evaluation is. As an objective weight assignment method with high reliability and accuracy, the entropy method can effectively overcome the overlapping of index information and is widely used in comprehensive research in the field of social economy. Please refer to the references for its calculation steps [51].

3.3.3. The Improved Coupling Coordination Degree Model (ICCDM)

The ICCDM used to reveal the mutual feedback between RLUT and FS effectively evaluates the stability and sustainability of the system operation [52]. The calculation is performed by using the following equations:
C = 2 X 1 + X = 2 1 X + X
X = min ( U 1 , U 2 ) max ( U 1 , U 2 )
where U1 and U2 represent the standardized RLUT index and the FS index, respectively, while C is the degree of coupling. The coupling degree C ∈ [0,1]; the larger the value, the higher the correlation between the elements of the system; on the contrary, when the correlation is low, the development tends to be disordered.
The modified coordination degree D used to measure the coordination degree between the RLUT index and the FS index is given by
D = [ 1 ( U 2 U 1 ) 2 ] × min ( U 1 , U 2 ) max ( U 1 , U 2 )
where D represents the coupling coordination degree between U1 and U2, which is between 0 and 1. The higher the D value, the better the coupling coordination.
The coupling coordination degree was divided into different types according to the coordinated development of D-value coupling [47,50], as shown in Table 3.

3.3.4. The Spatial Autocorrelation Model

Spatial autocorrelation can effectively detect the spatial pattern of the coupling coordination degree, including global and local spatial autocorrelation. Global spatial autocorrelation is usually expressed by the global Moran’s I index, which can reveal whether there is a correlation and correlation degree in the adjacent region of the spatial distribution of a certain attribute, and can directly reflect the relevance and difference of a certain spatial phenomenon [53]. See Equation (5):
I = n i = 1 n j = 1 n ( x i x ¯ ) ( x j x ¯ ) i = 1 n j = 1 n w i j i = 1 n ( x i x ¯ ) 2
where n is the number of spatial units, xi and xj are index observations, x ¯ denotes the mean value of spatial units, and wij is a spatial weight matrix. The value range of Moran’s I is [−1,1]; when I > 0, it means that there is positive spatial correlation between the attribute values of geographic units and feature attributes are clustered and distributed; when I < 0, there is spatial negative correlation and element attributes show discrete distribution; when I < 0, there is random distribution.
Global spatial autocorrelation mainly studies the overall distribution characteristics of spatial elements, and the prerequisite is the default spatial homogeneity in the study area, but it was difficult to measure spatial local agglomeration and its spatial heterogeneity. Therefore, it was still necessary to depict the spatial differentiation characteristics of the coupling coordination of the RLUT index and the FS index from the local scale with the help of the Getis-Ord Gi* index.
G i * ( d ) = i = 1 n j = 1 n w i j x j i = 1 n x i
where Gi*(d) is the local Jerry index, wij is the spatial weight of the unit, and xi and xj represent the level of coupling coordination between region i and region j, respectively. When Gi*(d) > 0, it indicates that the horizontal space of the coupling coordination degree shows a hot-spot significant region; if Gi*(d) = 0, it is a random distribution; and if Gi*(d) < 0, it is a cold-point significant region. Therefore, the CCD was divided into seven types: cold-spot high-significant area, cold-spot middle-significant area, cold-spot low-significant area, random distribution area, hot-spot low-significant area, hot-spot middle-significant area, and hot-spot high-significant area.

3.3.5. The Geographic Detector Model

The geographic detector method was used to detect the spatial differentiation of geographical things and its driving factors to reveal the mechanism of regional differences [54] and to detect the influence of multi-dimensional factors on the CCD.
q = 1 i = 1 n N D , i σ F D , i 2 N σ F 2
where q is the degree of the spatial differentiation explanation of the CCD by each detection factor, and the value interval is [0,1]. The larger the value, the stronger the explanatory ability. D is the study area divided into n subregions Di (i = 1, 2, …, n; n is the number of subregions for one driving factor). N is the number of samples in the whole basin; σ F 2 is the variance of the F over the whole region; N D , i signifies the number of samples in subregion i in the study area, and σ F D , i 2 is the dispersion variance of F in the subregions Di.
The YRB stretches over three major economic zones of eastern, central, and western China, where the regional natural background conditions and socio-economic factors are quite different. Considering the actual situation and relevant research [55,56], this study constructed the driving factor model of the coupling coordination degree between the RLUT index and the FS index and revealed the coupling coordination mechanism between RLUT and FS in the YRB. Table 4 displays the selected 9 factors with respective descriptions.

4. Results

4.1. Evolution Characteristics of RLUT and FS

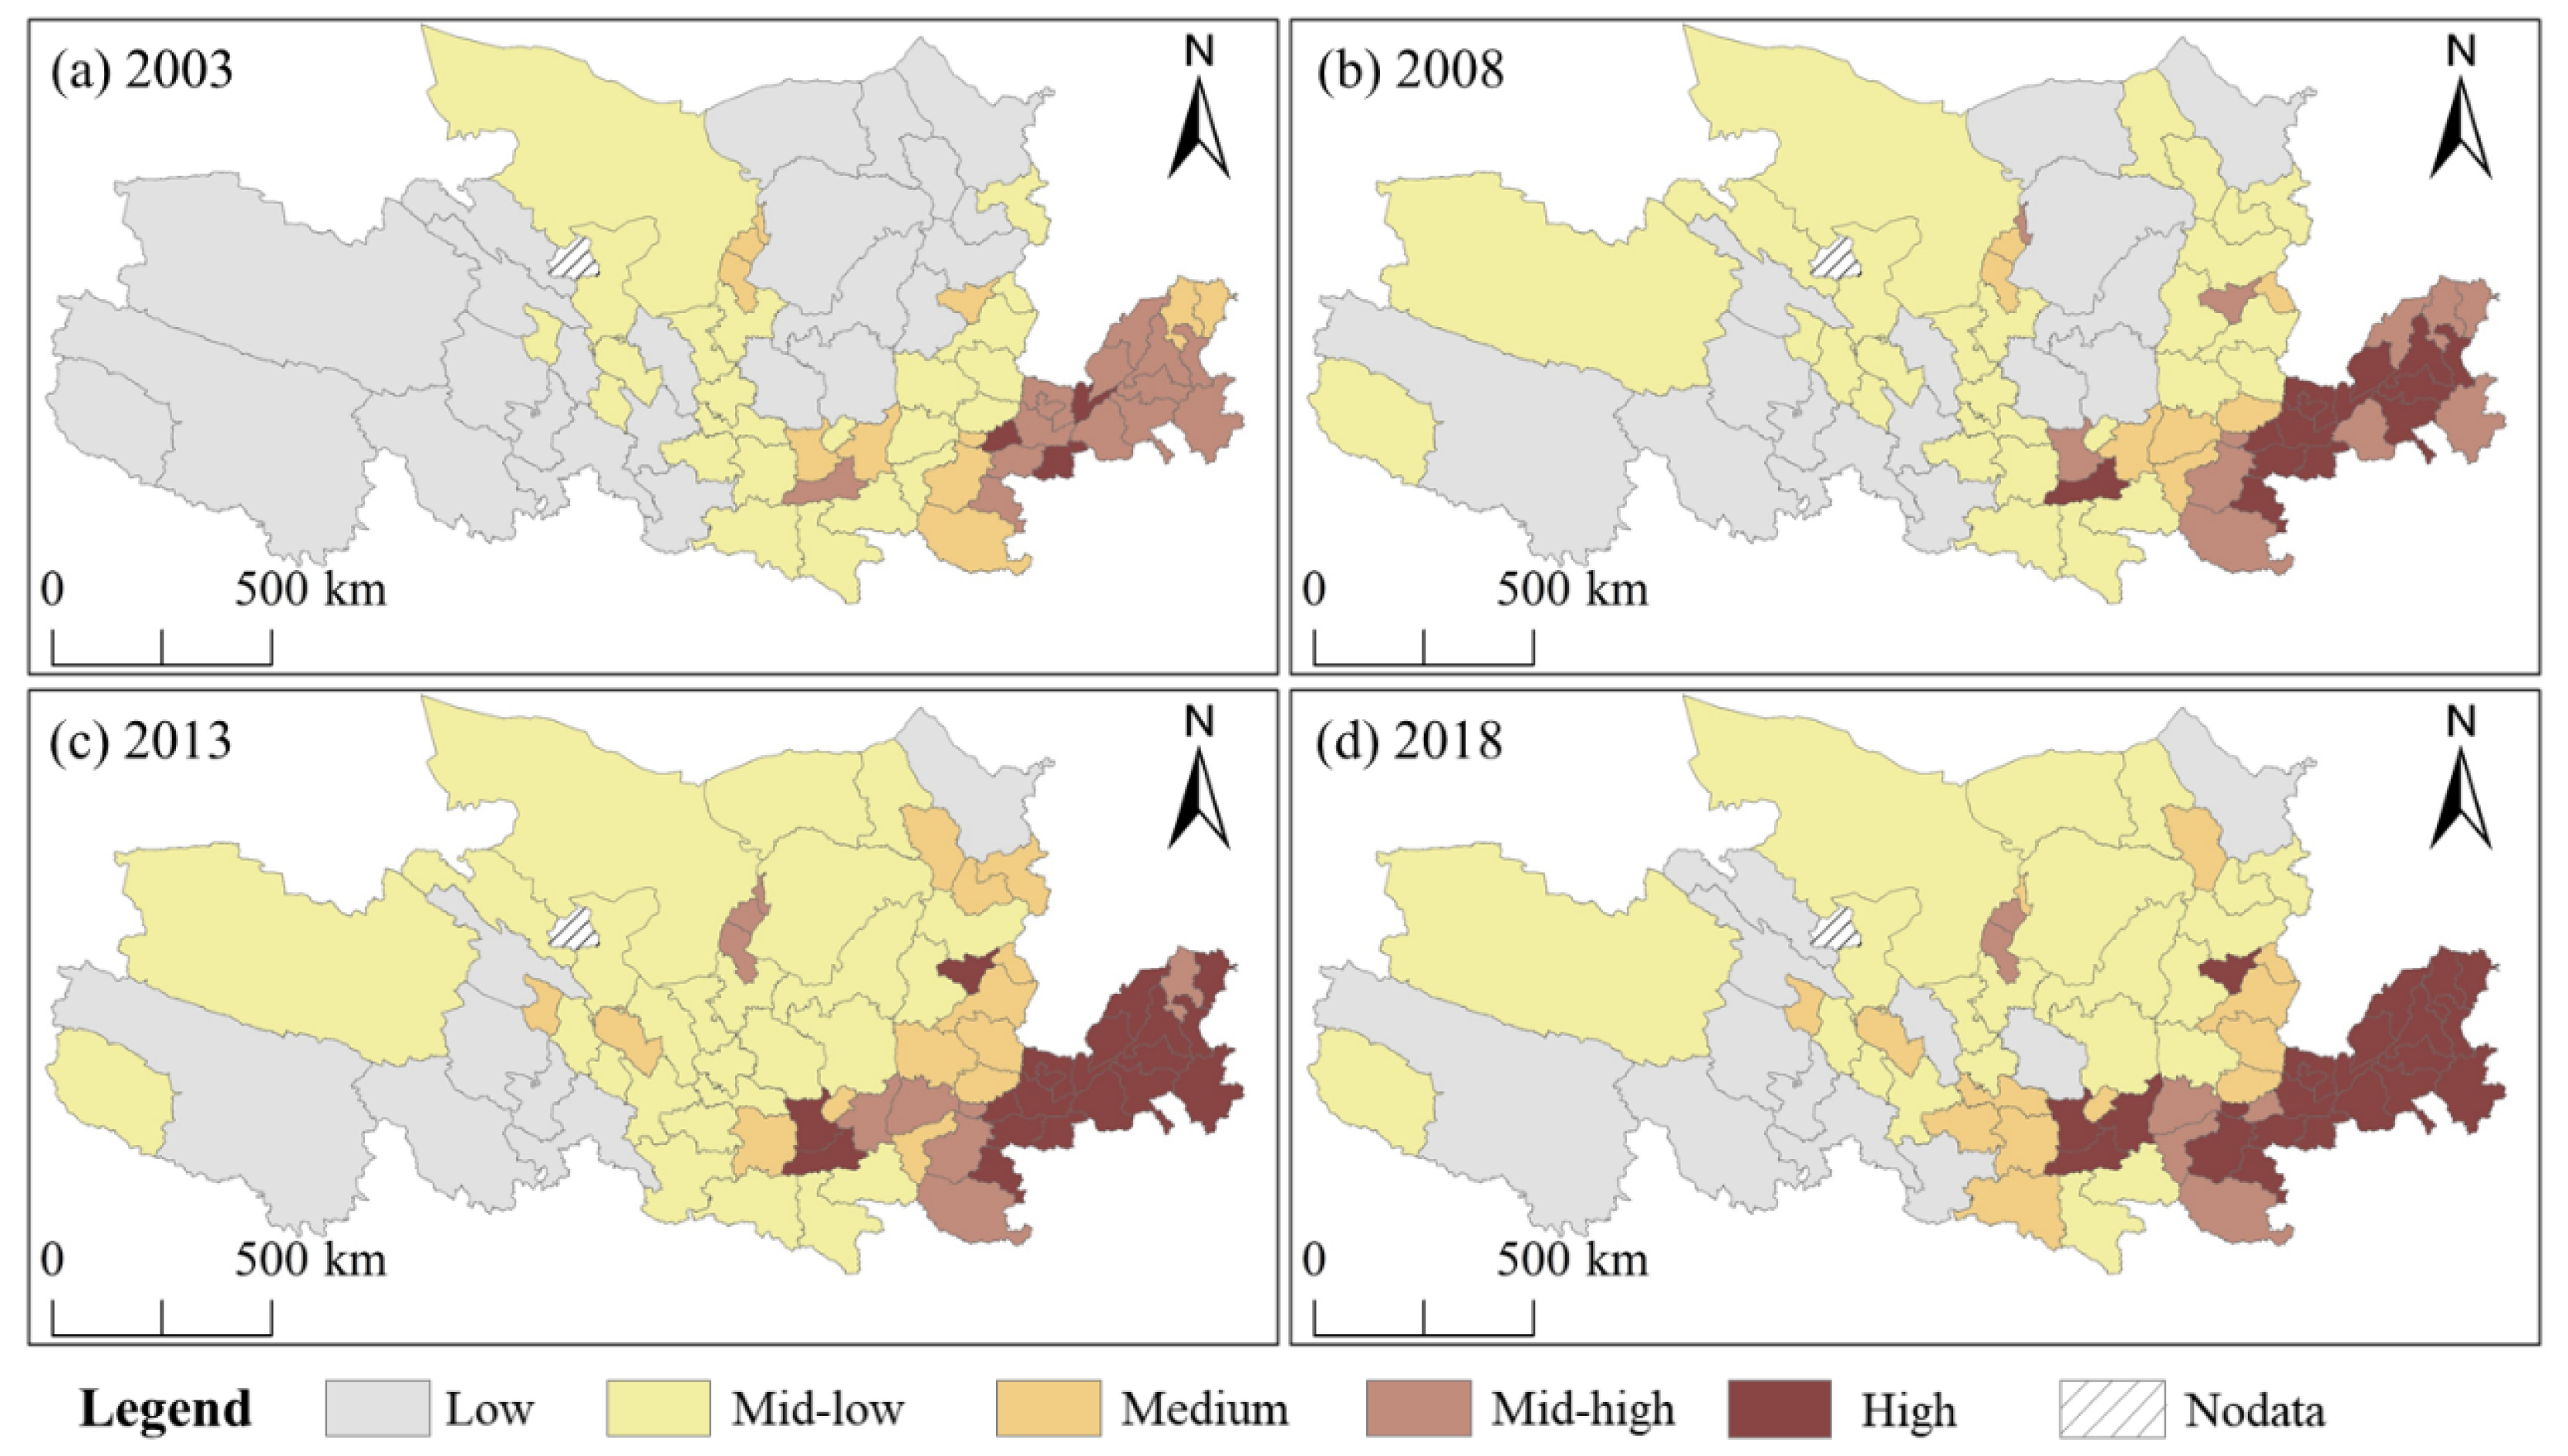
4.1.1. Evolution Characteristics of RLUT

The spatial temporal pattern distribution of RLUT in the YRB was obtained by the classifications low level (<0.15), lower level (0.15~0.20), middle level (0.20~0.27), higher level (0.27~0.35), and high level (>0.35), as shown in Figure 3. The RLUT index showed a gradient pattern that decreased gradually from east to west, that is, downstream > middle reaches > upstream, consistent with the level pattern of economic development. Among them, the upper reaches were mainly low and mid-low levels, the middle reaches were mainly mid-low and medium levels, and the lower reaches were mainly mid-high and high levels. Thus, two gradient zones of southeast high transition and northwest low transition were formed. This kind of differentiation pattern reflected relatively the reasonable land use in the middle and lower reaches, where the economy was relatively developed.
In 2003, the number of the low, mid-low, medium, mid-high, and high levels of the RLUT index in the YRB were 23, 23, 11, 14, and 3, respectively, which in 2018 were 11, 21, 13, 6, and 23, respectively. The low-level areas of the RLUT index decreased, whereas the high-level areas continued to increase, indicating that the level of RLUT in the YRB has improved to a certain extent. The average RLUT index rose from 0.2017 (medium level) to 0.2825 (mid-high level), an increase of 40.0%, but the growth rate slowed significantly in 2013–2018, which has shifted China’s economy from high speed to medium-high speed. The average value of the RLUT index in different regions increased rapidly at first and then slowed down, and all increased by one grade, from the low to the mid-low level in the upstream area, from the mid-low to the medium level in the middle reaches, and from the mid-high to the high level in the three to six lower reaches. However, there was no significant change in the nine overall differences in different regions. The above analysis showed that LUT in the YRB has shifted from the initial pursuit of the commodity output of land resources to paying more attention to the non-commodity output (such as ecological effect, food security) behind it so as to realize the multi-function management of land use.

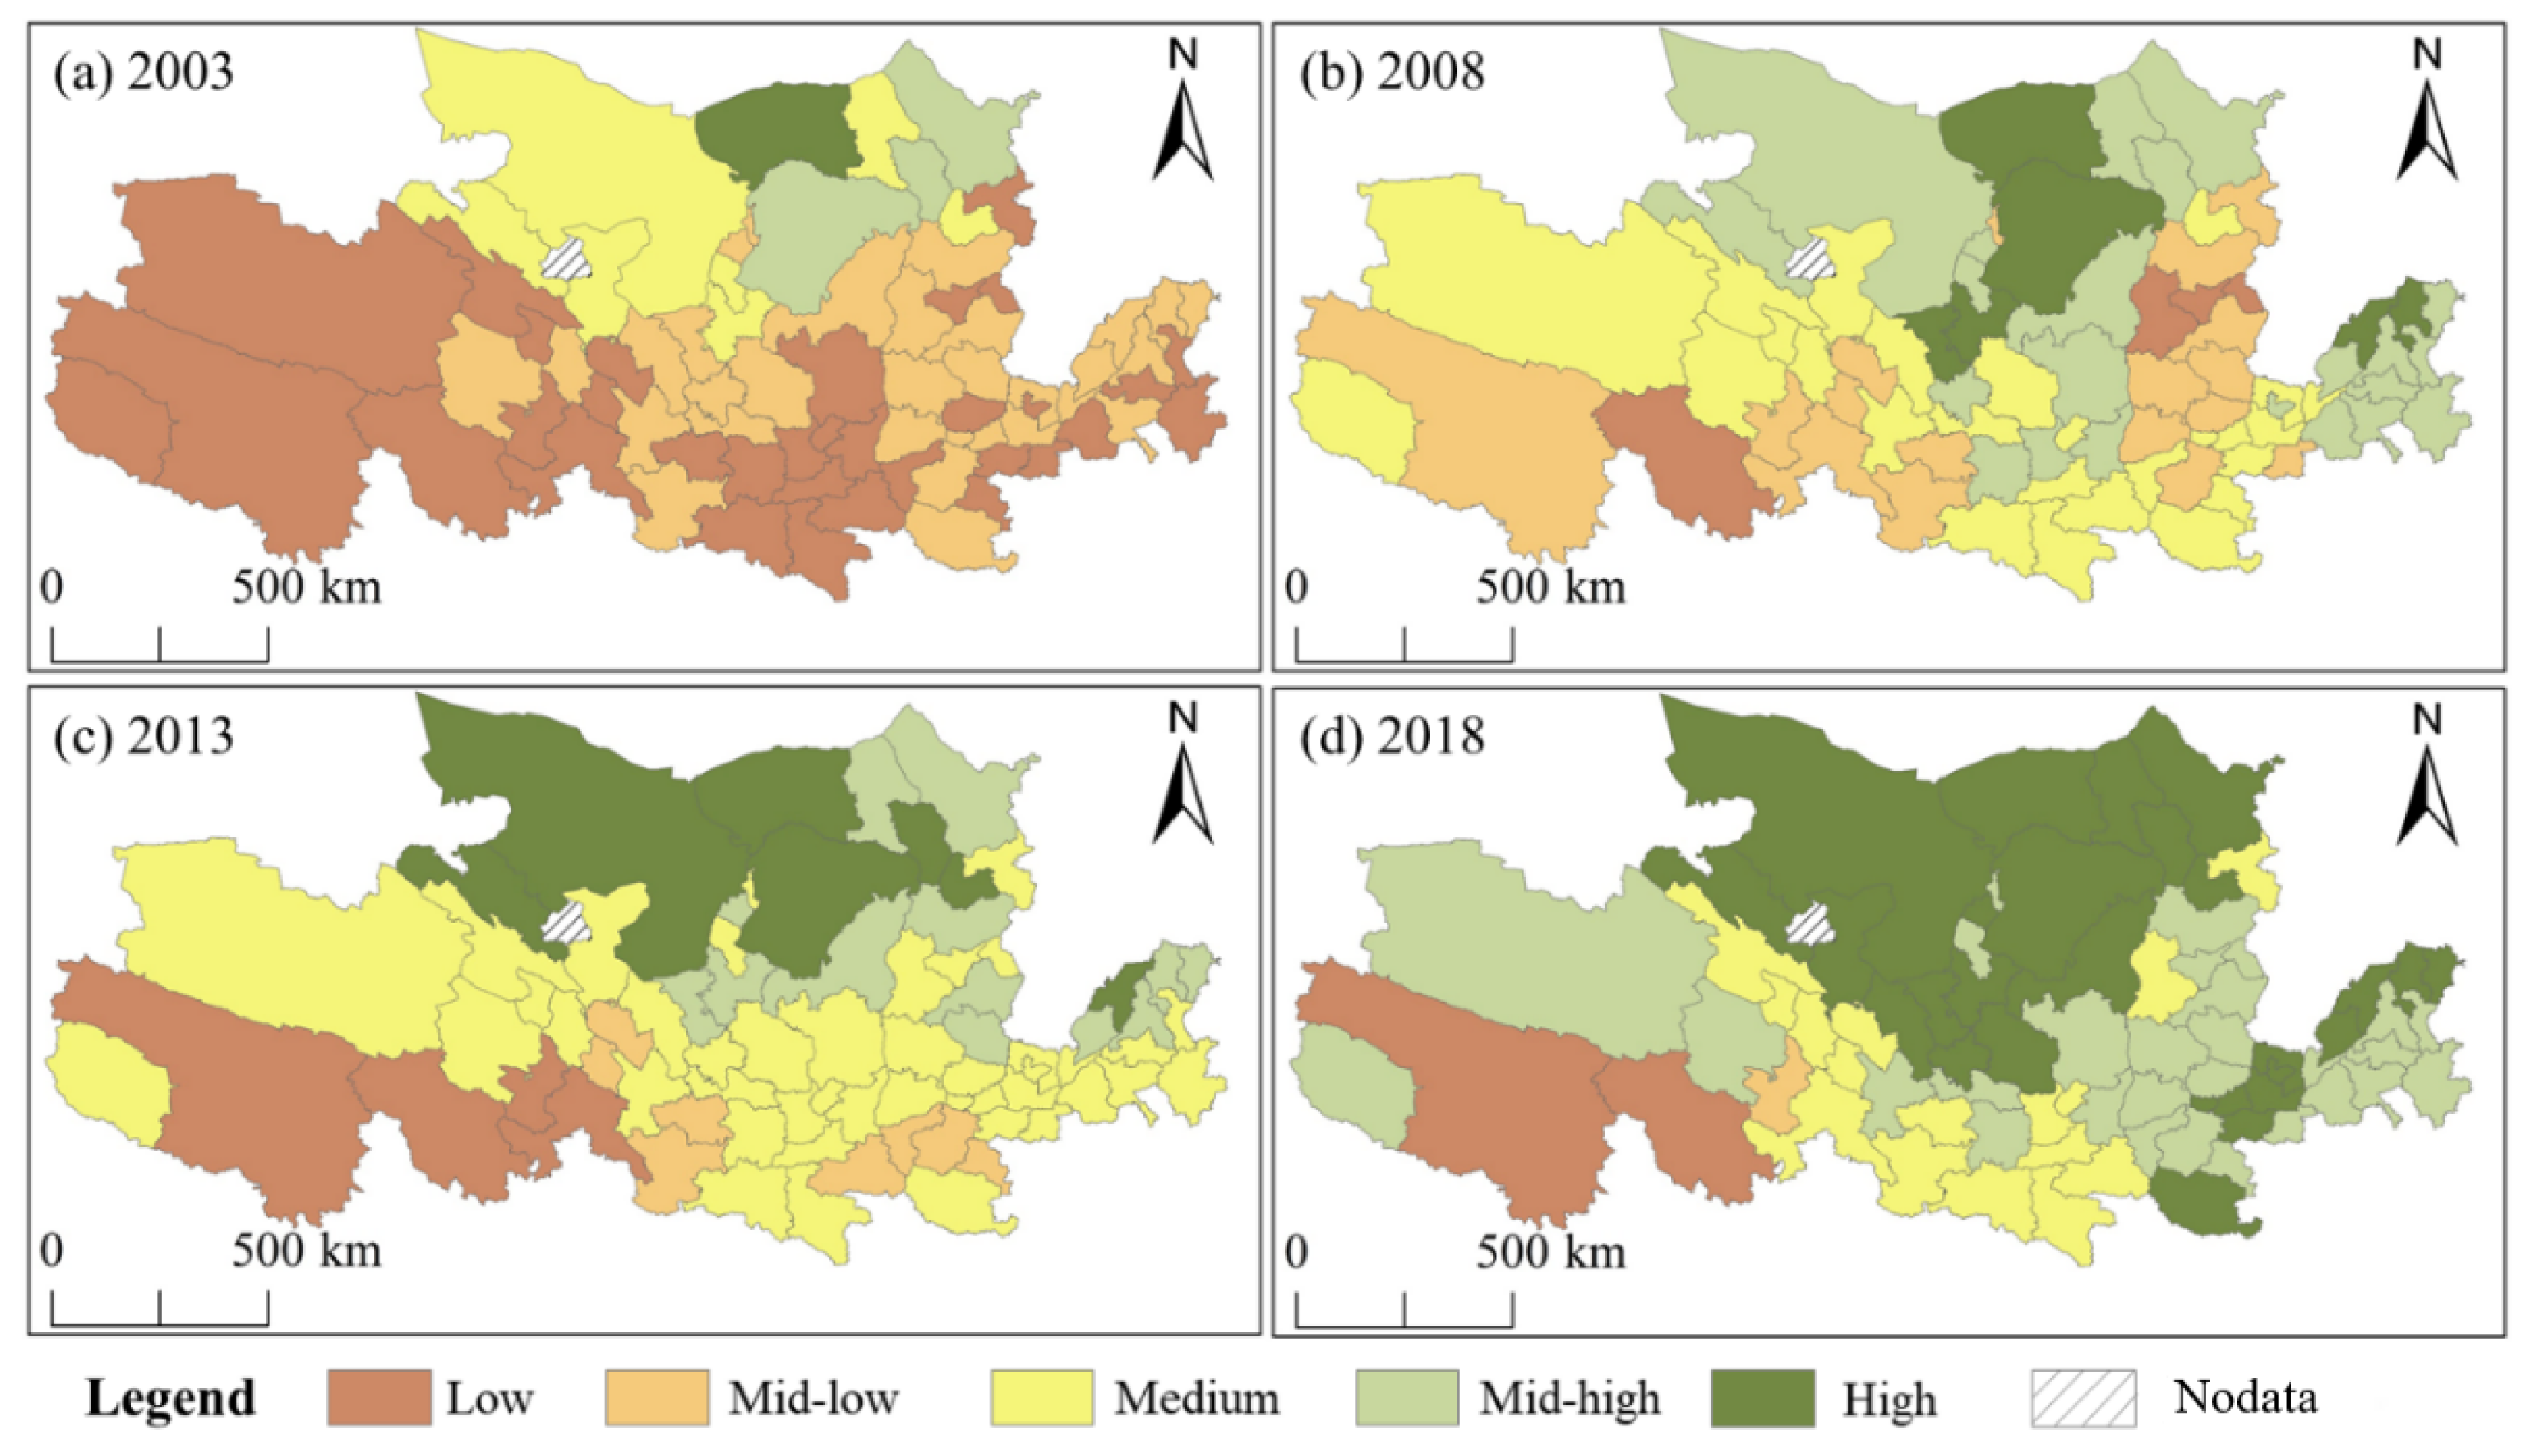
4.1.2. Evolution Characteristics of FS

The spatiotemporal pattern distribution of FS in the YRB was obtained by the classifications low level (<0.28), lower level (0.28–0.35), middle level (0.35–0.45), higher level (0.45–0.55), and high level (>0.55), as shown in Figure 4. As compared to the RLUT index pattern, the FS index showed a significant difference between north and south, while the difference between east and west was relatively small. The main reasons for this pattern were as follows: First, the center of gravity of national grain production has shifted northward, and the north has gradually become the main grain-producing area of the country [12,48]. The Hetao Irrigation District, the Fen-Wei Plain, and Shandong were the major national grain-producing areas, and some high-score units were concentrated in three areas. Second, Inner Mongolia and Ningxia have high-quality grassland resources, which can raise a large number of cattle and sheep without occupying or squeezing grain production, thus alleviating the pressure on food supply. For example, Bayannur and Inner Mongolia are located in the Hetao Plain. The suitable climate and rich resources provide convenient conditions for the development of grain production and animal husbandry. At the same time, grain prices and circulation costs are not high. These advantages determine that the city’s FS is always at a high level.
From 2003 to 2018, the low- and mid-low-level units of the FS index in the YRB gradually decreased, the mid-high- and high-level units expanded in the middle and lower reaches, while the whole basin evolved from a mid-low level to a mid-high level. The average FS index rose from 0.3045 to 0.5281, an increase of 73.40%, indicating significant progress in FS in the YRB. However, the average variation trend in the FS index in the upper, middle, and lower reaches was quite different, and the variation amplitude in the lower reaches was much higher than that in the middle and upper reaches. However, the evolution trend in the middle reaches steadily rose, while that in the upstream and downstream areas rose at first and then fell and then rose. Moreover, the average value of the FS index was higher than that of the RLUT index, which also reflects the high level of FS development in the YRB. Especially in Inner Mongolia and Ningxia, the average value of the FS index was much higher than the average value of the whole basin, which provided a solid guarantee for the FS of the YRB and even the country. It is worth mentioning that in major grain-producing areas, such as Shandong, Henan, Shaanxi, and other provinces, although the FS index improved significantly, most of the cities’ FS was still at the middle level or below. This reflected that the problem of FS in the YRB is still not optimistic. Therefore, it is necessary to make a careful trade-off between economic development and food security.

4.2. Coupling Coordination Degree between RLUT and FS

4.2.1. Temporal Evolution Characteristics of the CCD

RLUT was significantly different from east to west, while FS was significantly different from north to south. To clarify the matching degree between RLUT and FS, the coupling coordination degree between them was further determined (Figure 5).
(1) From the watershed scale, the CCD increased from 0.6028 to 0.6148 during 2003 to 2018, an increase of 1.99%, and maintained a state of moderate coordination. The change trend in the CCD for the upstream, midstream, and downstream areas was different. The upstream had a lower CCD, which decreased from 0.5429 to 0.5237 (3.54%), but it was still in the state of near imbalance. For the midstream area, the CCD increased from 0.5959 to 0.6001 (0.70%), with a transition from basic coordination to moderate coordination. It was noted that the CCD of the downstream area increased substantially from 0.6936 to 0.7571 (9.15%) and remained in a balanced development state, with an obvious transition from moderate coordination to high coordination. In short, although the CCD increased as a whole, the range of change was small, and the coordinated development of RLUT and FS in the YRB still has a long way to go.
(2) On the provincial scale, the spatial heterogeneity was significant. The CCD of Shandong, Henan, Shaanxi, and Qinghai increased by 10.55%, 7.97%, 2.41%, and 2.43%, respectively, among which Henan and Shandong rose to the state of high coordination. To investigate the reason, the downstream and some excessive areas midstream and upstream of the basin are important guarantee areas for grain production. The regional economic structure is good with a low Engel coefficient, which is conducive to the coordinated development of RLUT and FS in these regions. However, the CCD of Gansu, Ningxia, Inner Mongolia, and Shanxi decreased by 5.69%, 6.25%, 4.74%, and 0.94%, respectively, of which Inner Mongolia directly fell into the state of moderate imbalance. In these areas, the level of economic development is low, the ecological environment is relatively fragile, the influence of natural factors such as topography make the carrying capacity of resources and environment in this region low, and the transformation and development lags behind grain production, which reduces the coupling coordination degree.
(3) At the municipal scale, there were 1, 5, 15, 16, 28, and 9 types of serious imbalance, moderate imbalance, near imbalance, basic coordination, moderate coordination, and high coordination in 2003, respectively, which evolved into 3, 11, 13, 12, 15, and 20 in 2018. The high coordination units downstream have expanded significantly since 2008. However, severe or moderate imbalance units also increased and were concentrated in the middle and upper reaches, and these two evolutionary trends led to increasing differences between east and west. Anyang, Hebi, and Jinan were always in a state of high coordination, while many cities in Gansu were always on the verge of imbalance, which is closely related to the fragile ecological environment, dense population, overuse of resources, etc. However, there were some units in which two systems developed in the reverse direction. For example, the FS index of Bayannur and Ordos got increasingly better, whereas the RLUT index decreased gradually, leading to serious imbalance. However, few regions achieved synchronization development by the end of the study period, which indicates these regions are not coordinated with respect to RLUT and FS protection.

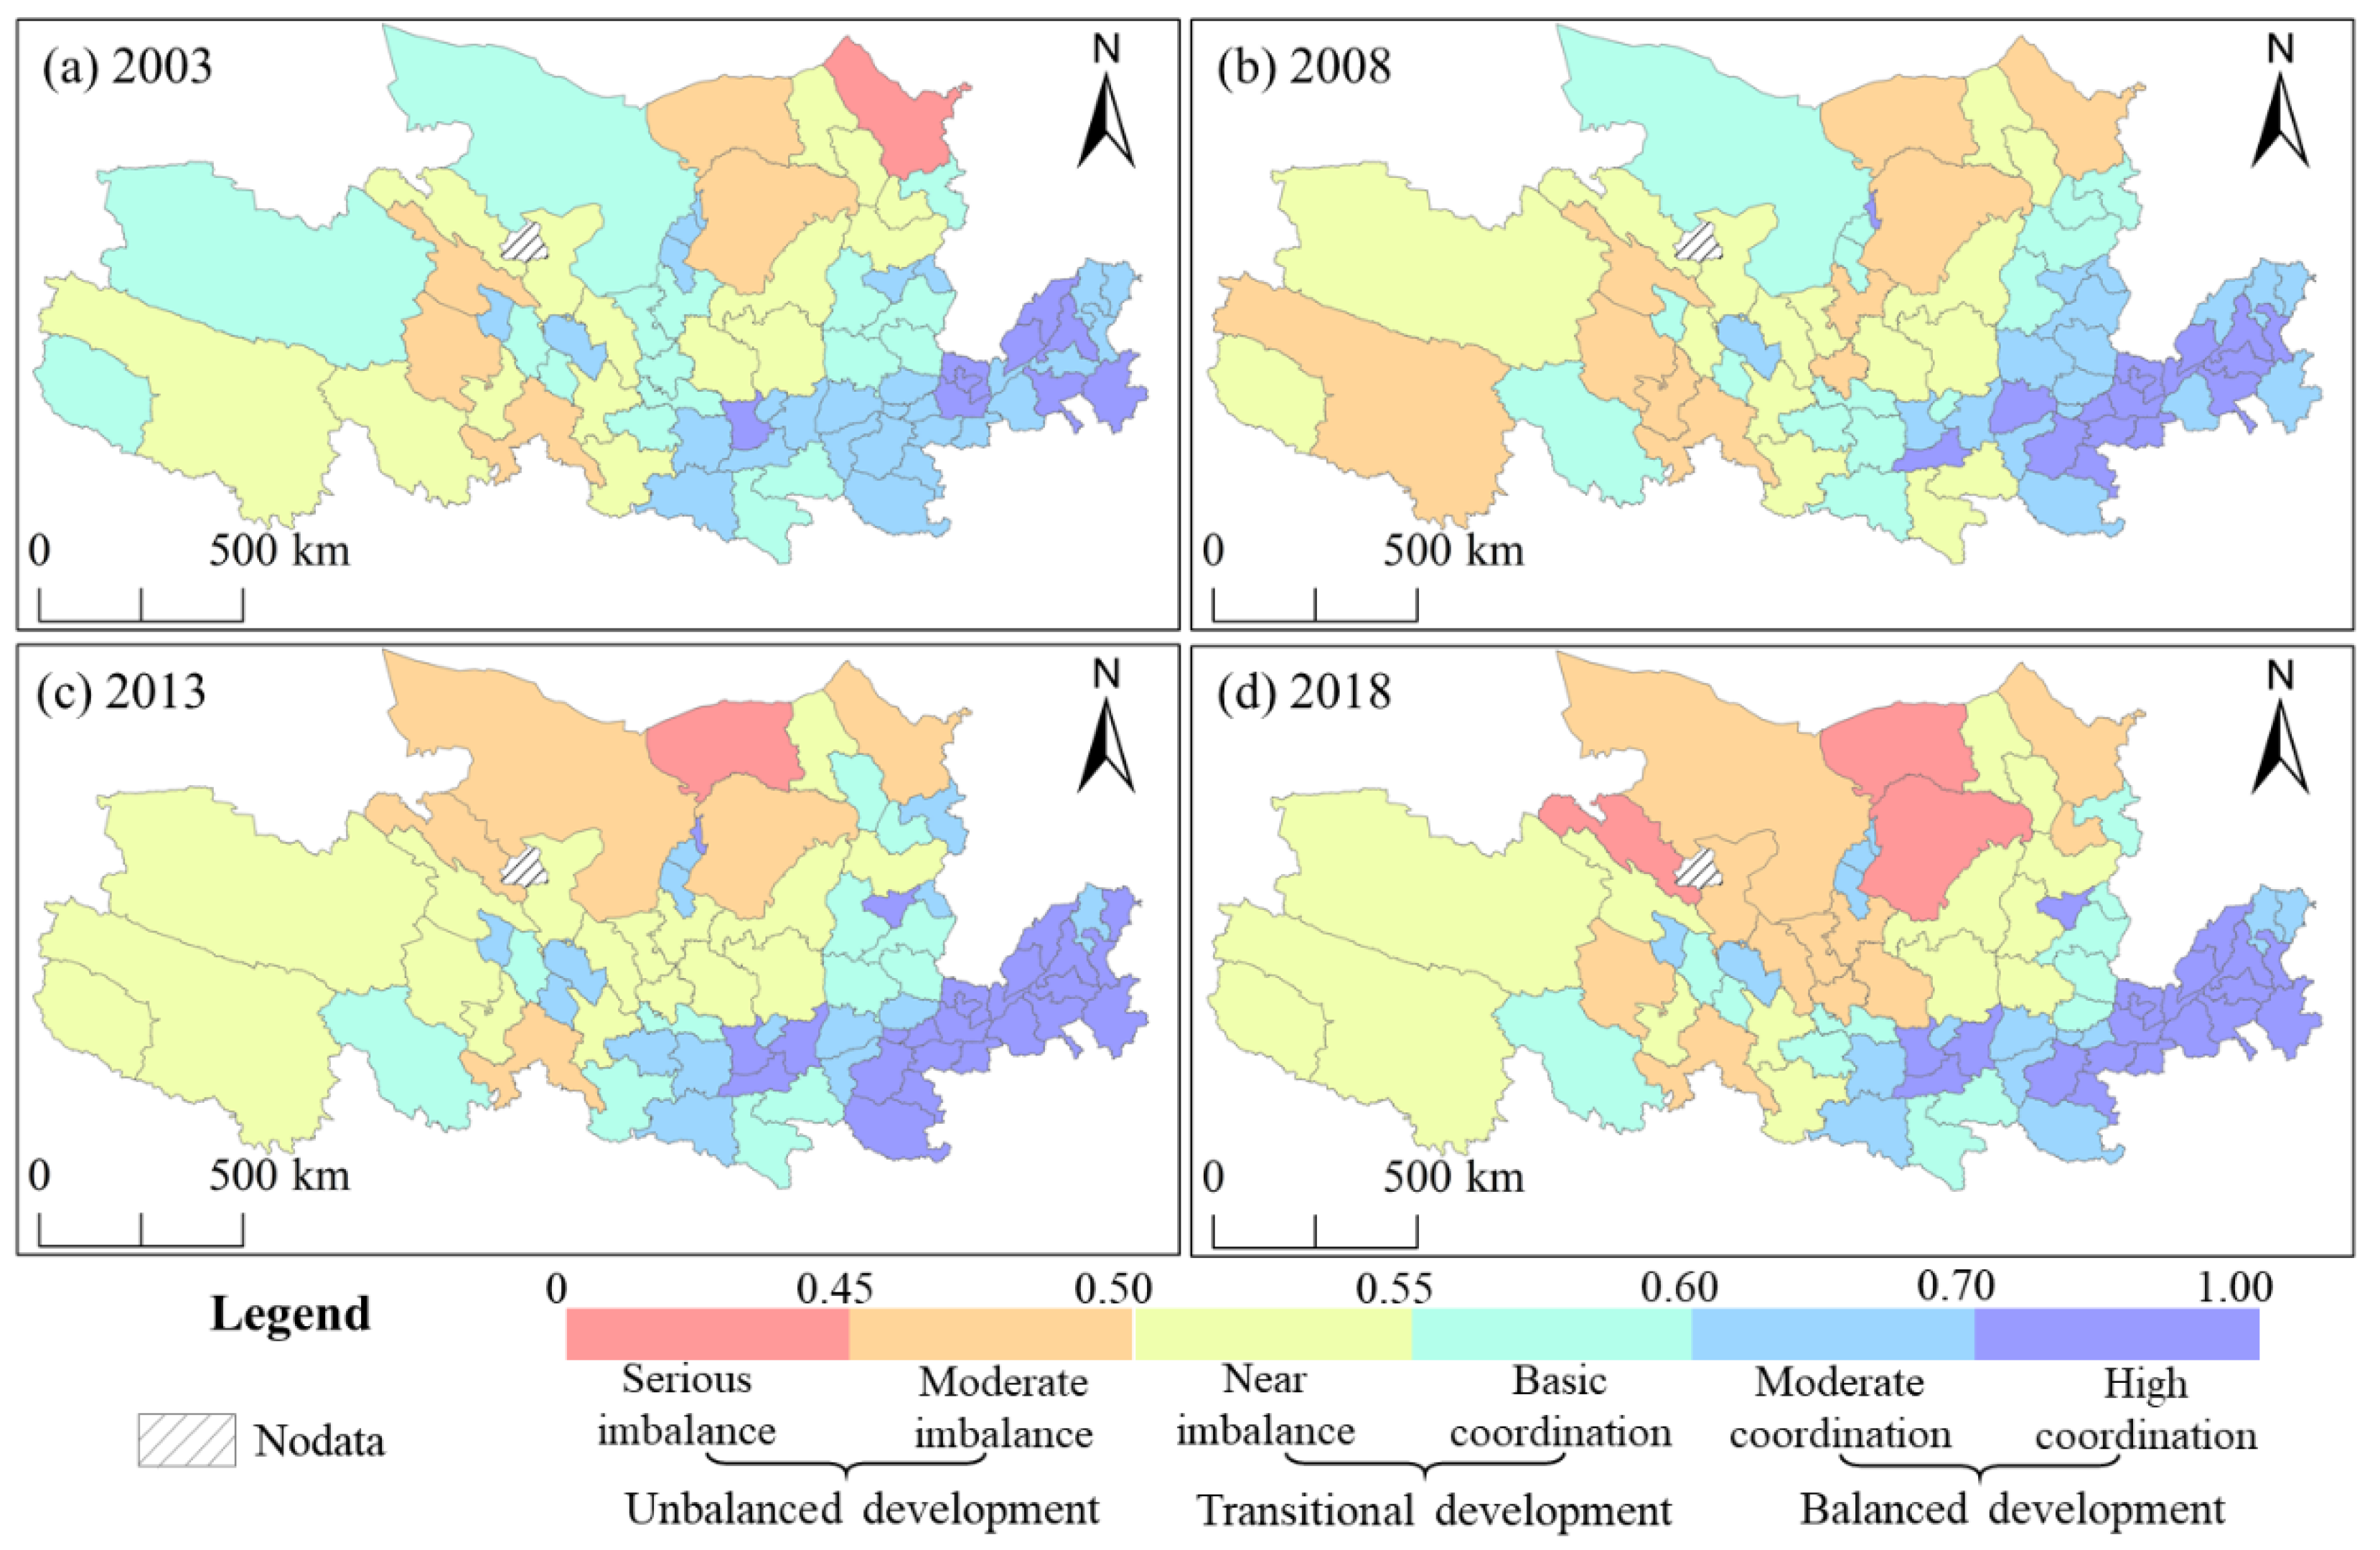
4.2.2. Spatial Evolution Characteristics of the CCD

The CCD of RLUT and FS in the YRB have obvious characteristics of concentrated and continuous spatial distribution, indicating that there is a spatial correlation in geographical space. To clarify the spatial dependence and heterogeneity of their coupling coordination degree, the spatial autocorrelation analysis method was used to calculate the global Moran’s I index in different years. Its value varied from 0.5147 to 0.6042 and was significant at the 0.01% level, indicating the CCD had a strong positive spatial agglomeration. That is, cities with a high CCD level were adjacent to other cities with high CCD values, and cities with a low CCD level were adjacent to other cities with low CCD values. From 2003 to 2018, the global Moran’s I index increased at first, then decreased, and then increased over time. The global Moran’s I index in 2003 was 0.5495, and it then gradually rose to 0.6042 in 2008, falling to 0.5147 in 2013 after 2008, and rising to 0.5665 at the end of the study period. This indicated that the spatial autocorrelation of the CCD of urban units shows an enhanced–weakened–enhanced evolution. Different types of CCD showed the evolution model of agglomeration–dispersion–reagglomeration in space. Additionally, the global Moran’ I index of the CCD was always kept between 0.5 and 0.6, showing strong spatial stability.
The local Moran’s I index can reflect the correlation degree of the CCD of each city unit, and the hot-spot evolution map reflected the spatial agglomeration characteristics of the CCD during the study period (Figure 6). The main results were as follows:
(1) The spatial difference of the CCD between RLUT and FS in the YRB was obvious, showing a spatial pattern of gradual transition from a hot spot to a cold point from east to west. The polarization of the basin was obvious, and the space was stable.
(2) The radiation range of the hot-spot area was slightly smaller but more concentrated, gradually converging from Shanxi, Henan, and Shandong to Henan and Shandong. The downstream area was more developed, the levels of RLUT and FS were higher, and their synergistic promotion was more obvious at a high level. For example, Jinan, Zibo, Dongying, and Zhengzhou have always been hot spots and have promoted the coordinated development around them.
(3) The change in the cold-point area fluctuated and gradually evolved from the Haidong and Baotou double-core cold-point significant area to the “Central Inner Mongolia–Northern Shaanxi–Ningxia–Gannan–Qingdong” banded agglomeration area. However, the reasons for the formation of the first two cold spots were different. In the cold-spot-gathering area with Haidong as the core, RLUT and FS restricted each other at a low level, and their resource endowments were poor, which limited their coordinated development. The FS level in the cold-point radiation zone with Baotou as the core was not low, but RLUT lagged behind for a long time, which led to coordination between RLUT and FS. This showed that the cold-point area also played the role of radiation, constantly expanding the imbalance caused by different reasons to form a banded area restricted by the barrel effect. When efforts were made to improve the level of a single system, if RLUT and FS mismatched, a hot-spot significant area could not be formed.

4.3. Coupling and Coordination Mechanism of RLUT and FS

According to the previous analysis, there were obvious spatial agglomeration characteristics in the CCD between RLUT and FS in the YRB. Hence, the geographical detector model was used to explore the influence of natural, social, and economic factors on the CCD. By using the natural breakpoint method, the dominant factors were divided into eight categories, and the q values of different influence factors on the CCD of the two systems were obtained (Figure 7). There were significant differences among various influencing factors. According to the q value, the influence factors were divided into main factors (>0.5), secondary factors (0.2–0.5), and general factors (<0.2). The year-wise influence on the degree and the changing trend of factors are shown in Table 5.
As can be seen from Figure 7 and Table 5, the effects of scales and influencing factors were different. The population density, average elevation, and average annual temperature were the most important driving factors, which affected the CCD in the whole basin. The role of natural factors was much stronger than the socio-economic factors except population density. The factors that played a leading role in different regions were different. Specifically, the upstream factors were mainly affected by the population density, GDP, and urbanization rate; the midstream factors were mainly affected by the population density, science and technology expenditure, and urbanization rate; and the downstream factors were mainly affected by the population density, financial expenditure, and the tertiary industry ratio. It is worth mentioning that population density always played a key role. An interesting phenomenon was that the effect of natural factors in different regions on the CCD was weaker than that of socio-economic factors contrary to the whole basin. This was similar to the previous results on the drivers of LUT at different scales [23]. This also showed that the main driving factors of the CCD are not in conflict with the driving factors of LUT. Actually, although there are great differences between natural factors and socio-economic factors in the YRB, natural conditions have a congenital constraint or promoting effect on human production and life at a large-scale level and will infiltrate from climate, topography, and other aspects. This will play a decisive role in RLUT and FS (especially grain production and circulation). In contrast, on a small scale, the differences in natural factors are small or even negligible, but the images of different human activities on FS or LUT are far-reaching, so the key driving forces mainly come from human social and economic activities.
According to the time series evolution of the action intensity of detection factors, the role of natural factors continued to decline, while that of socio-economic factors continued to improve. On the watershed scale, technological progress, industrial upgrading, and urbanization gradually became high-acting factors to promote the coupling and coordination of RLUT and FS, and the effect of precipitation substantially decreased. This showed that with economic development and technological progress, the restriction of natural factors, such as precipitation, on agriculture has declined. The CCD of RLUT and FS changed from factor driven to innovation driven, which is consistent with the core essence of current high-quality development [8]. On the domain scale, the explanatory power of the total GDP to both upstream and midstream increased but decreased to the downstream area. Due to the high level of downstream investment and diminishing marginal returns, it is difficult to add economic input to achieve a substantial improvement in the CCD. It has transformed and upgraded to a higher level. At the same time, the explanatory power of finance expenditure to the whole basin increased, but the explanatory power to each region decreased. In reality, the difference of inter-provincial fiscal expenditure was often higher than that within the province, which caused the differences in the level of economic development in different regions.

5. Discussion

5.1. The Influence of RLUT on FS

The distribution pattern of RLUT in the YRB gradually increased from west to east, which was similar to the previous study on LUT [26,40]. However, it does not explain what kind of transition is more conducive to FS and ecological protection in the future. Theoretically speaking, FS mostly comes from the mapping of cultivated land, which is closely related to RLUT. In fact, it is the common result of multiple problems, such as physical geography, economic development, agricultural development, and people’s life. After introducing the factor input and benefit output, this study found that the downstream area is in a higher level of transformation, while the midstream and upstream areas are lower, which is consistent with the current economic transformation pattern. Related studies have shown that the carrying capacity of resources and the environment in the midstream and downstream areas was much higher than that in the upstream area, which is conducive to the recessive form of land use in a good state [50]. On the contrary, the relatively backward upstream economy, coupled with congenital deficiencies, such as shortage of water resources and ecological fragility, limit the potential of land development and hinder the recessive form of land use to a higher level. There was a significant difference in FS between north and south in the YRB, and some units in the main grain-producing areas were still below the medium level. However, some units with natural grasslands in Ningxia and Inner Mongolia had higher levels of FS, showing that it was far enough to pay attention to traditional grain cultivation and more attention should be paid to human dietary nutrition and diversification [44,57]. In the future, we should change the narrow concept of “only more grain is the rational use of cultivated land,” appropriately promote forage planting to develop aquaculture and raise herbivores to alleviate the pressure on cultivated land, and improve the people’s dietary and nutritional structure. Recessive transformation may be of more significance to food security.

5.2. Effects of Different Factors on the CCD of RLUT and FS

At present, the spatial and temporal pattern of the imbalance between RLUT and FS in the YRB is essentially resource allocation, and the imbalance of regional resource allocation has perplexed the regional economic development of China for a long time. The natural conditions and resource endowments of the upstream, midstream, and downstream areas are different, and there is an insurmountable gap in economic development [58]. This reflects the imbalance pattern between the upper, middle, and lower reaches. This study noted that the most important factor affecting the CCD in the whole basin and different regions is the population density. In 2018, the average population density of Shandong and Henan was 579 and 553 persons/km2, respectively, while that of Shanxi and Shaanxi was 212 and 185 persons/km2, respectively. The population density in the upstream area was less than 100 persons/km2, and that in Qinghai was only 7.2 persons/km2. In addition, the population distribution of some small- and medium-size cities in the downstream area is also relatively balanced, but the population in the middle and upper reaches is more concentrated in large cities. In particular, the limited arable land in the middle and upper reaches [26], coupled with the coexistence of drought and fragility [42], makes it difficult to transform land use. From 2003 to 2018, the effect of natural factors on the coupling coordination of RLUT and FS decreased, while the role of socio-economic factors increased, indicating that the traditional agricultural production mode of “relying on heaven for a living” is difficult to sustain [57]. In the future, we should change our strategy from factor driven to innovation driven to achieve high-quality development and shift upgrading. At present, China’s agricultural development is far from large-scale mechanization and the rural labor force still remains an important factor affecting grain production. In the future, we should solve practical problems, such as the first line of rural revitalization, agricultural development, and the lack of technology and wisdom.

5.3. Policy Implications and Limitations

The inherent characteristics of RLUT provide an important theoretical support for regional economic transformation. However, rapid economic development can easily squeeze the space of food production and restrict food security. Based on the differences in economic level, ecological background, and resource endowment in different regions, we should adopt measures in accordance with the local conditions and time to promote the coupling and coordinated development of RLUT and FS.
The intensity of land development downstream is high, and the utilization intensity of land resources in some areas exceeds the carrying capacity of the ecological environment, threatening the ecological environment security of the basin. With the advanced stage of economic development in the downstream areas, the growth of the GDP has been unable to bring about large-scale land expansion [42]. Therefore, the downstream area should fundamentally change the concept of development by innovation-driven alternative elements and upgrading quality instead of quantity catch-up [59]. This should be done by reducing the use of chemical fertilizers, increasing the intensity of land regulation, and strengthening the early warning system and mechanism of natural disasters to ensure the food security. At the same time, efforts should be made to improve total factor productivity and develop new industries based on high and new technology and eco-agricultural technology.
The elasticity coefficients of construction land in Shanxi and Shaanxi in the midstream area are as high as 10.0 and 6.72, respectively, which are much higher than the national level. However, the per capita GDP of land and the intensity of investment in fixed assets are lower than the national average. This has led to the rapid expansion of construction land and the low efficiency of land use in the midstream area, which restricts the high-quality development of the YRB. The midstream area should break through the resource curse as well as the environmental bottleneck [50]. Faced with the dual-carbon goal, we should seek a balance between emission reduction and development, weighing the relationship of water–soil–energy–ecology–food [60]. Under the premise of adapting hard constraints of the carrying capacity of resources and the environment, we should appropriately enhance the intensity of land and space development in this region and promote the depth transformation of land use.
The congenital deficiency of natural conditions in the upstream area not only restricts the pace of economic development but also restricts the development of large-scale and mechanized agriculture, resulting in the dual pressure of ecological protection and economic development [55]. Although grazing can ease the pressure on FS, overgrazing also leads to grassland degradation [61]. Therefore, the upstream area should give priority to protection, strengthen the function of land ecological services, and improve the scale efficiency of land use. In the future we should take water resources as the greatest constraint, limit the intensity of land development in this area, control the crowding out of ecological space by construction activities, and reasonably avoid areas where the ecological environment is sensitive and fragile. At the same time, we should encourage planting of selected non-grain crops according to local conditions; encourage the protection, renovation, and restoration of agriculture and ecological space; and regulate the coupling and coordination mechanism of RLUT and FS.
This study attempted to clarify the driving factors and action mechanism of RLUT and FS in the YRB. The methods adopted have good applicability and scientific basis, but there are still some shortcomings. First, this study focused only on the coupling relationship between RLUT and FS on the city scale due to data acquisition and technical reasons and lacked the county-level and more micro-scale analysis. In addition, due to the influence of complex factors, RLUT has not yet formed a unified and mature research paradigm and method system. This study focused on natural and human factors for the analysis of the factors affecting the coupling and coordination of RLUT and FS, but there are still some factors, such as policy and related land engineering, in the actual process. In the future, we will comprehensively clarify the interaction between the two systems from multiple perspectives, micro-scale and long time series; reduce the pressure of shortage and mismatch of resources; and provide decision-making support for watershed land spatial planning and socio-economic sustainable development.

6. Conclusions

The YRB plays an important role in China’s economic development, ecological protection, and food security. Exploring the regional FS coordination mechanism from the perspective of RLUT is of strategic significance for land space optimization and high-quality development. Therefore, starting from the municipal scale, this paper measured the coupling coordination level of RLUT and FS in the YRB. Based on this, spatial autocorrelation analysis and geographic detector model were used to reveal the spatiotemporal pattern of their coupling coordination degree and its driving mechanism. The main conclusions are as follows:
(1) In the overall situation, the level of RLUT and FS in the YRB from 2003 to 2018 was generally low but showed a trend of gradual increase. The average value of the RLUT index increased from 0.2017 to 0.2825, and the average FS index increased from 0.3045 to 0.5281. In terms of spatial patterns, RLUT showed the characteristics of a gradient pattern gradually decreasing from east to west, but the regional difference has not significantly improved. The difference of FS between north and south was greater than that between east and west, showing a pattern of high in the north and low in the south, and high in the east and low in the west, and the spatial heterogeneity strengthened gradually.
(2) The average value of the CCD between RLUT and FS in the YRB was between 0.6028 and 0.636, which was at the moderate coordination level as a whole with slight improvement. The spatial agglomeration was remarkable, and the difference between the east and the west was increasingly obvious and showed the characteristics of decreasing gradually from the southeast to the northwest. The CCD in the cities showed a wave evolution trend of “enhancement–weakening–re-enhancement,” but the two-level differentiation of the river basin formed a strong characteristic of spatial stability. The radiation range of the hot-spot area of the CCD was slightly reduced but more concentrated, and the cold-spot area gradually evolved into a contiguous cold-point agglomeration zone of “Central Inner Mongolia–Northern Shaanxi–Ningxia–Gannan–Qingdong.”
(3) The factor detection results showed that population density, average elevation, and average annual temperature are always the main factors affecting the coupling and coordinated development of the YRB. The driving effect of natural factors was higher than that of the socio-economic factors, but the driving effect of socio-economic factors in different regions was higher than that of the natural factors. In the changing situation, the role of natural factors in the basin as a whole and in the upstream, midstream, and downstream areas decreased, while the socio-economic factors gradually increased. Therefore, we should constantly strengthen the importance of social and economic factors and take effective measures to deal with climate change in the basin to promote the coordinated development of RLUT and FS.

Author Contributions

Conceptualization, F.C.; methodology, D.Y.; software, D.Y.; validation, H.Y., J.L., and D.Y.; formal analysis, H.Y. and J.M.; investigation, D.Y. and H.Y.; resources, F.C. and H.Y.; data curation, D.Y.; writing—original draft preparation, D.Y.; writing—review and editing, F.C., J.M., and G.L.; visualization, D.Y. and H.Y.; supervision, F.C. and G.L.; project administration, F.C.; funding acquisition, F.C. All authors have read and agreed to the published version of the manuscript.

Funding

This research was funded by the National Science and Technology Support Program (nos. 2015BAD06B02), the Major Consulting and Research Project of Chinese Academy of Engineering (nos. 2021NXZD3), and the Jiangsu Graduate Research and Practice Innovation Program (nos. KYCX21-2111).

Institutional Review Board Statement

Not applicable.

Informed Consent Statement

Not applicable.

Data Availability Statement

The data used to support the findings of this study are available from the authors upon request.

Acknowledgments

The authors gratefully acknowledge the editors and anonymous reviewers for their constructive comments on our manuscript. We also thank the data support from the Data Center for Resources and Environmental Sciences, Chinese Academy of Sciences (RESDC) (http://www.resdc.cn (accessed on 25 November 2021)) and the China Meteorological Data Service Center (http://data.cma.cn/ (accessed on 25 November 2021)).

Conflicts of Interest

The authors declare no conflict of interest.

References

  1. DeFries, R.S.; Foley, J.A.; Asner, G.P. Land-Use Choices: Balancing Human Needs and Ecosystem Function. Front. Ecol. Environ. 2004, 2, 249–257. [Google Scholar] [CrossRef]
  2. Lambin, E.F.; Meyfroidt, P. Land use transitions: Socio-ecological feedback versus socio-economic change. Land Use Policy 2010, 27, 108–118. [Google Scholar] [CrossRef]
  3. Long, H.; Li, X. Analysis on regional land use transition: A case study in transect of the Yangtze River. J. Nat. Resour. 2002, 17, 144–149. [Google Scholar]
  4. Long, H. Land use transition and rural transformation development. Prog. Geogr. 2012, 31, 131–138. [Google Scholar]
  5. Foley, J.; DeFries, R.; Asner, G.; Barford, C.; Bonan, G.; Carpenter, S.; Chapin, F.; Coe, M.; Daily, G.; Gibbs, H.; et al. Global consequences of land use. Science 2005, 309, 570–574. [Google Scholar] [CrossRef] [Green Version]
  6. Chen, F.; Zeng, S.; Zhang, Z.; Zhu, F.; Xu, T.; Zhang, S. The effect of rural land consolidation on rural transformation: A case study of whole village restructuring program in Jiangsu Province. China Land Sci. 2018, 32, 50–58. [Google Scholar]
  7. Jadin, I.; Meyfroidt, P.; Lambin, E.F. International trade, and land use intensification and spatial reorganization explain Costa Rica’s forest transition. Environ. Res. Lett. 2016, 11, 035005. [Google Scholar] [CrossRef]
  8. Meyfroidt, P. Trade-offs between environment and livelihoods: Bridging the global land use and food security discussions. Glob. Food Secur. 2018, 16, 9–16. [Google Scholar] [CrossRef]
  9. Long, H.; Chen, K. Urban-rural integrated development and land use transitions: A perspective of land system science. Acta Geogr. Sin. 2021, 76, 295–309. [Google Scholar]
  10. Deng, X.; Xu, D.; Zeng, M.; Qi, Y. Does outsourcing affect agricultural productivity of farmer households? Evidence from China. China Agr. Econ. Rev. 2020, 12, 673–688. [Google Scholar] [CrossRef]
  11. Fischer, A.; Eastwood, A. Coproduction of ecosystem services as human–nature interactions—An analytical framework. Land Use Policy 2016, 52, 41–50. [Google Scholar] [CrossRef]
  12. Ma, E.; Cai, J.; Lin, J.; Guo, H.; Han, Y.; Liao, L. Spatio-temporal evolution of global food security pattern and its influencing factors in 2000–2014. Acta Geogr. Sin. 2020, 75, 332–347. [Google Scholar]
  13. Laborde, D.; Martin, W.; Swinnen, J.; Vos, R. COVID-19 risks to global food security. Science 2020, 369, 500–502. [Google Scholar] [CrossRef]
  14. Liu, Y.; Fang, F.; Li, Y. Key issues of land use in China and implications for policy making. Land Use Policy 2014, 40, 6–12. [Google Scholar] [CrossRef]
  15. Long, H.; Liu, Y.; Hou, X.; Li, T.; Li, Y. Effects of land use transitions due to rapid urbanization on ecosystem services: Implications for urban planning in the new developing area of China. Habitat. Int. 2014, 44, 536–544. [Google Scholar] [CrossRef]
  16. Long, H.; Heilig, G.; Li, X.; Zhang, M. Socio-economic development and land-use change: Analysis of rural housing land transition in the Transect of the Yangtse River, China. Land Use Policy 2007, 24, 141–153. [Google Scholar] [CrossRef]
  17. Rounsevell, M.D.A.; Pedroli, B.; Erb, K.; Gramberger, M.; Busck, A.G.; Haberl, H.; Kristensen, S.; Kuemmerle, T.; Lavorel, S.; Lindner, M.; et al. Challenges for land system science. Land Use Policy 2012, 29, 899–910. [Google Scholar] [CrossRef]
  18. Song, X. Discussion on land use transition research framework. Acta Geogr. Sin. 2017, 72, 471–487. [Google Scholar]
  19. Long, H.; Qu, Y. Land use transitions and land management: A mutual feedback perspective. Land Use Policy 2018, 74, 111–120. [Google Scholar] [CrossRef]
  20. Song, X.Q.; Huang, Y.; Wu, Z.F.; Ouyang, Z. Does cultivated land function transition occur in China? J. Geogr. Sci. 2015, 25, 817–835. [Google Scholar] [CrossRef]
  21. Hu, S.; Tong, L.; Long, H. Land use transition potential and its assessment framework. Geogr. Res.-Aust. 2019, 38, 1367–1377. [Google Scholar]
  22. Ferreira, M.P.; Alves, D.S.; Shimabukuro, Y.E. Forest dynamics and land-use transitions in the Brazilian Atlantic Forest: The case of sugarcane expansion. Reg. Environ. Chang. 2015, 15, 365–377. [Google Scholar] [CrossRef]
  23. Liu, Y.; Long, H. Land use transitions and their dynamic mechanism in the Huang-Huai-Hai Plain. Acta Geogr. Sin. 2016, 71, 666–679. [Google Scholar] [CrossRef] [Green Version]
  24. Tsai, Y.; Zia, A.; Koliba, C.; Bucini, G.; Guilbert, J.; Beckage, B. An interactive land use transition agent-based model (ILUTABM): Endogenizing human-environment interactions in the Western Missisquoi Watershed. Land Use Policy 2015, 49, 161–176. [Google Scholar] [CrossRef]
  25. Nourqolipour, R.; Shariff, A.R.B.M.; Balasundram, S.K.; Ahmad, N.B.; Sood, A.M.; Buyong, T. Predicting the Effects of Urban Development on Land Transition and Spatial Patterns of Land Use in Western Peninsular Malaysia. Appl. Spat. Anal. Policy 2016, 9, 1–19. [Google Scholar] [CrossRef]
  26. Yin, D.; Li, X.; Li, G.; Zhang, J.; Yu, H. Spatio-temporal evolution of land use transition and its eco-environmental effects: A case study of the Yellow River Basin, China. Land 2020, 9, 514. [Google Scholar] [CrossRef]
  27. Nizalov, D.; Thornsbury, S.; Loveridge, S.; Woods, M.; Zadorozhna, O. Security of property rights and transition in land use. J. Comp. Econ. 2016, 44, 76–91. [Google Scholar] [CrossRef] [Green Version]
  28. Qu, Y.; Long, H. Spatial differentiation of the recessive morphology of urban land use and its influential factors: A case study of 289 prefecture-level cities in China. Econ. Geogr. 2016, 36, 1–8. [Google Scholar]
  29. Kong, D.; Chen, H. Spatio-temporal patterns of land use transitions and related influencing factors—Comparative analysis based on three counties of north, middle and south Jiangsu province, China. Chin. J. Soil Sci. 2020, 51, 300–307. [Google Scholar]
  30. Tateishi, H.R.; Bragagnolo, C.; Almeida, A.N.D. Forest, agriculture and land conversion: Environmental efficiency in Brazilian Amazon rainforest. For. Policy Econ. 2021, 133, 102615. [Google Scholar] [CrossRef]
  31. Grainger, A. National land use morphology: Patterns and possibilities. Geography 1995, 3, 235–245. [Google Scholar]
  32. Liu, J.; Kuang, W.; Zhang, Z.; Xu, X. Spatiotemporal characteristics, patterns and causes of land use changes in China since the late 1980s. Acta Geogr. Sin. 2014, 69, 3–14. [Google Scholar] [CrossRef]
  33. Zhao, R.; Wang, F.; Zhang, L.; Li, H. Dynamic of Farmland Landscape and Its Socioeconomic Driving Forces in the Middle Reaches of the Heihe River. Sci. Geogr. Sin. 2017, 37, 920–928. [Google Scholar]
  34. Tu, X.S.; Sun, Q.R.; Xu, G.L.; Wu, X.F. Functional transformation of rural homesteads: A field survey of poyang county, Jiangxi Province, China. J. Resour. Ecol. 2021, 12, 214–224. [Google Scholar] [CrossRef]
  35. Cheng, J.; Cheng, J. The Spatio-Temporal Pattern, Driving Forces and Transformation Mode of Inter-provincial Recessive Land Use Morphology in China. China Land Sci. 2017, 31, 60–68. [Google Scholar]
  36. Ge, D.; Long, H.; Tu, S.; Zhang, Y. Coupling relationship between land use transitions and grain yield in Huang-Huai-Hai Plain, China. J. Agric. Resour. Environ. 2017, 34, 319–327. [Google Scholar]
  37. Skaf, L.; Buonocore, E.; Dumontet, S.; Capone, R.; Franzese, P.P. Applying network analysis to explore the global scientific literature on food security. Ecol. Inform. 2020, 56, 101062. [Google Scholar] [CrossRef]
  38. Al-Ansari, T.; Korre, A.; Nie, Z.; Shah, N. Development of a life cycle assessment tool for the assessment of food production systems within the energy, water and food nexus. Sustain. Prod. Consum. 2015, 2, 52–66. [Google Scholar] [CrossRef]
  39. Lu, D.; Sun, D. Development and management tasks of the Yellow River Basin: A preliminary understanding and suggestion. Acta Geogr. Sin. 2019, 74, 2431–2436. [Google Scholar]
  40. Lu, X.; Qu, Y.; Sun, P.; Yu, W.; Peng, W. Green Transition of Cultivated Land Use in the Yellow River Basin: A Perspective of Green Utilization Efficiency Evaluation. Land 2020, 9, 475. [Google Scholar] [CrossRef]
  41. de Grenade, R.; House-Peters, L.; Scott, C.A.; Thapa, B.; Mills-Novoa, M.; Gerlak, A.; Verbist, K. The nexus: Reconsidering environmental security and adaptive capacity. Curr. Opin. Environ. Sust. 2016, 21, 15–21. [Google Scholar] [CrossRef] [Green Version]
  42. Zhang, B.; Miao, C. Spatiotemporal changes and driving forces of land use in the Yellow River Basin. Resour. Sci. 2020, 42, 460–473. [Google Scholar] [CrossRef]
  43. Wang, S.; Liu, J.; Ma, T. Dynamics and changes in spatial patterns of land use in Yellow River Basin, China. Land Use Policy 2010, 27, 313–323. [Google Scholar] [CrossRef]
  44. Viana, C.M.; Freire, D.; Abrantes, P.; Rocha, J.; Pereira, P. Agricultural land systems importance for supporting food security and sustainable development goals: A systematic review. Sci. Total Environ. 2021, 806, 150718. [Google Scholar] [CrossRef]
  45. Song, J.; Chen, S. Coupling relationship and coordination between recessive land use morphology and land eco-security in Fujian province. Res. Soil Water Conserv. 2020, 27, 301–307. [Google Scholar]
  46. Deng, X.; Xu, D.; Zeng, M.; Qi, Y. Does Internet use help reduce rural cropland abandonment? Evidence from China. Land Use Policy 2019, 89, 104243. [Google Scholar] [CrossRef]
  47. Jiang, Z.; Hu, Y. Coupling and coordination between new urbanization and agricultural modernization in Central China. J. Nat. Resour. 2021, 36, 702–721. [Google Scholar] [CrossRef]
  48. Luo, H.; Yu, Z.; Zou, N. The empirical study on the spatial coupling of ecology and food security in major grain-producing areas in China. Chin. J. Agric. Resour. Reg. Plan. 2020, 41, 32–39. [Google Scholar]
  49. Zhao, J.; Liu, Y.; Zhu, Y.; Qin, S.; Wang, Y.; Miao, C. Spatiotemporal differentiation and influencing factors of the coupling and coordinated development of new urbanization and ecological environment in the Yellow River Basin. Resour. Sci. 2020, 42, 159–171. [Google Scholar] [CrossRef]
  50. Bian, Z.; Yu, H.; Lei, S.; Yin, D.; Zhu, G.; Mu, S.; Yang, D. Strategic consideration of exploitation on coal resources and its ecological restoration in the Yellow River Basin, China. J. China Coal Soc. 2021, 46, 1378–1391. [Google Scholar]
  51. Liu, X.; Zhang, Y.; Leng, X.; Yang, Q.; Chen, H.; Wang, X.; Cui, N. Exploring the optimisation of mulching and irrigation management practices for mango production in a dry hot environment based on the entropy weight method. Sci. Hortic.-Amst. 2022, 291, 110564. [Google Scholar] [CrossRef]
  52. Zhang, Q.; Shen, J.; Sun, F. Spatiotemporal differentiation of coupling coordination degree between economic development and water environment and its influencing factors using GWR in China’s province. Ecol. Model. 2021, 462, 109794. [Google Scholar] [CrossRef]
  53. Yang, Q.; Duan, X.; Jin, Z.; Wang, L.; Wang, Y. Spatiotemporal differentiation and influencing mechanism of urban land development intensity in the Yangtze River Delta. Resour. Sci. 2020, 42, 723–734. [Google Scholar] [CrossRef]
  54. Han, J.; Wang, J.; Chen, L.; Xiang, J.; Ling, Z.; Li, Q.; Wang, E. Driving factors of desertification in Qaidam Basin, China: An 18-year analysis using the geographic detector model. Ecol. Indic. 2021, 124, 107404. [Google Scholar] [CrossRef]
  55. Guo, F.; Tong, L.; Qiu, F.; Li, Y. Spatio-temporal differentiation characteristics and influencing factors of green development in the eco-economic corridor of the Yellow River Basin. Acta Geogr. Sin. 2021, 76, 726–739. [Google Scholar]
  56. Ma, L.; Cheng, J.; Cheng, J.; Fei, L. Analysis of the influencing factors for recessive transformation of land use. China Land Sci. 2019, 33, 81–90. [Google Scholar]
  57. Yu, H.; Zeng, S.; Wang, Q.; Dai, J.; Bian, Z.; Chen, F. Forecast on China’s cultivated land protection baseline in the new era by multi-scenario simulations. Resour. Sci. 2021, 43, 1222–1233. [Google Scholar]
  58. Fang, C. Spatial Organization Pattern and High-Quality Development of Urban Agglomeration in the Yellow River Basin. Econ. Geogr. 2020, 40, 1–8. [Google Scholar] [CrossRef]
  59. Wang, Y. Changes Unseen in a Century, High-Quality Development, and the Construction of a New Development Pattern. Manag. World 2020, 36, 1–13. [Google Scholar]
  60. Chen, F.; Yu, H.; Bian, Z.; Yin, D. How to handle the crisis of coal industry in China under the vision of carbon neutrality. J. China Coal Soc. 2021, 46, 1808–1820. [Google Scholar]
  61. Zhang, Y.; Zhang, C.B.; Wang, Z.Q.; Chen, Y.Z.; Gang, C.C.; An, R.; Li, J.L. Vegetation dynamics and its driving forces from climate change and human activities in the Three-River Source Region, China from 1982 to 2012. Sci. Total Environ. 2016, 563–564, 210–220. [Google Scholar] [CrossRef] [PubMed]
Figure 1. Mechanism of coupling coordination between RLUT and FS.
Agriculture 12 00058 g001
Figure 2. Overview of the Yellow River Basin.
Agriculture 12 00058 g002
Figure 3. Spatio-temporal pattern of RLUT in the YRB. (ad) denote the spatio-temporal pattern of RLUT for 2003, 2008, 2013 and 2018, respectively.
Agriculture 12 00058 g003
Figure 4. Spatio-temporal pattern of FS in the YRB. (ad) denote the spatio-temporal pattern of FS for 2003, 2008, 2013 and 2018, respectively.
Agriculture 12 00058 g004
Figure 5. Level of coupling coordination between RLUT and FS in the YRB. (ad) denote the coupling coordination level between RLUT and FS in 2003, 2008, 2013 and 2018, respectively.
Agriculture 12 00058 g005
Figure 6. Spatial agglomeration of the CCD between RLUT and FS in the YRB. (ad) denote the spatial agglomeration of the CCD between RLUT and FS in 2003, 2008, 2013 and 2018, respectively.
Agriculture 12 00058 g006
Figure 7. Detection results of the coupling coordination factor in the YRB. B, basin; U, upstream; M, midstream; D, downstream; AT, average annual temperature; AP, average annual precipitation; AE, average elevation; UP, urbanization rate; PD, population density; TIR, tertiary industry ratio; GDP, gross domestic product; FE, finance expenditure; STE, science and technology expenditure.
Agriculture 12 00058 g007
Table 1. Evaluation index system of RLUT.
Target LayerCriterion LayerIndex LayerUnitDirectionWeight
Recessive land use transition (RLUT)Factor inputInvestment in fixed assets per capita104 yuan/km2+0.1566
Land average agricultural employeesPeople/km2+0.1076
Average amount of chemical fertilizer applicationkg/hm2+0.0500
Proportion of effective irrigated area%+0.0456
Land average use of agricultural machinery103 w/hm2+0.0381
Output benefitGDP per capita 104 yuan/km2+0.1368
Output value of secondary and tertiary industries per capita104 yuan/km2+0.1424
Gross agricultural output value per capita104 yuan/km2+0.1135
Utilization intensityMultiple crop index%+0.0160
Population densityPeople/km2+0.0723
Ground average energy consumptiont standard coal/km2+0.1210
Table 2. Evaluation index system of FS.
Target LayerCriterion LayerIndex LayerUnitDirectionWeight
Food security (FS)Production safetyPer capita grain outputkg/people+0.1284
Per capita cultivated land areahm2/people+0.1607
Per capita meat outputkg/people+0.0289
Consumption safetyEngel coefficient of rural residents%0.0242
Grain consumer price index 0.0852
Per capita net income of farmersYuan/people+0.2676
Circulation securityChange of grain circulation cost 0.1757
Grain self-sufficiency rate%+0.1284
Note: Provinces such as Mongolia, Qinghai, Gansu, and Ningxia and regions are characterized by herbivorous livestock, such as cattle and sheep, which alleviate food security, so the per capita meat output is a positive index, whereas other provinces dominated by pork production require a lot of grain as feed, so the per capita meat output is a negative index.
Table 3. Classification of the coupling coordination degree between RLUT and FS.
ClassEvaluationClasses
Primary division of development stagesValue rangeSecondary division of development stages
Unbalanced development(0.00, 0.45)Serious imbalance
(0.45, 0.50)Moderate imbalance
Transitional development(0.50, 0.55)Near imbalance
(0.55, 0.60)Basic coordination
Balanced development(0.60, 0.70)Moderate coordination
(0.70, 1.00)High coordination
Table 4. Driving factors of the coupling coordination degree between RLUT and FS.
CategoryInfluence FactorVariableFactor Interpretation
Natural environmentTemperaturex1Average annual temperature
Precipitationx2Average annual precipitation
Elevationx3Average elevation
Population growthUrbanization ratex4Proportion of resident urban population
Population densityx5Number of people living on land per unit area
Industrial upgradingDevelopment of tertiary industryx6Ratio of the output value of the tertiary industry to the GDP
Economic developmentGDPx7Total per capita GDP of the whole city
Government regulation and controlExpenditurex8Total financial expenditure of the whole city
Technological progressScience and technology expenditurex9Science and technology expenditure of the whole city
Table 5. Changes and influence degrees of CCD factors in the YRB.
Domain SegmentATAPAEURPDTIRGDPFESTE
BA↘B↘A↘C↗A↗C↗B↗B↗B↗
UC↘C↘C↘B↗A↗B↗A↗B↘B↗
MB↘C↗C↘B↘A↗B↗B↗C↘A↗
DC↘C↘C↘C↗A↗B↗C↘B↘C↗
A: main factors; B: secondary factors; C: general factors; ↗: factor rise; ↘: factor decline. Other abbreviations have the same meaning as Figure 7.
Publisher’s Note: MDPI stays neutral with regard to jurisdictional claims in published maps and institutional affiliations.

