Article

Response of Rice Harvest Index to Different Water and Nitrogen Management Modes in the Black Soil Region of Northeast China

1
School of Water Conservancy and Civil Engineering, Northeast Agriculture University, Harbin 150030, China
2
Key Laboratory of Efficient Utilization of Agricultural Water Resources, Ministry of Agriculture and Rural Affairs, Northeast Agricultural University, Harbin 150030, China
*
Author to whom correspondence should be addressed.
Agriculture 2022, 12(1), 115; https://doi.org/10.3390/agriculture12010115
Submission received: 7 December 2021 / Revised: 7 January 2022 / Accepted: 11 January 2022 / Published: 14 January 2022
(This article belongs to the Special Issue Water-Saving Irrigation Technology and Strategies for Crop Production)

Abstract

:
Understanding the methods leading to rice yield increase is vital for sustainable agricultural development. Improving the harvest index (HI) is an important way to increase rice yield. To explore the effects of different water and nitrogen management modes on the rice HI in the black soil region of Northeast China, a field experiment was conducted in 2019 (Y1) and 2020 (Y2). Two irrigation methods, conventional flooding irrigation (FI) and controlled irrigation (CI), were established in the experiment, and four nitrogen application levels (0 kg/ha, 85 kg/ha, 110 kg/ha, and 135 kg/ha) were set during the entire growth period, named N0, N1, N2, and N3. The dry matter weight and the rice yield at the maturity stage were determined, and the HI was then calculated. The results showed that different irrigation modes and nitrogen application levels had significant effects on the rice HI. Under different irrigation modes with the same nitrogen application level during the two years, the comparison regular of HI was consistent. In Y1 and Y2, the HI of FN0 was 3.36% and 5.02% higher than that of CN0 (p < 0.05), and the HI of CN1 was 0.31% and 2.43% higher than that of FN1 (p > 0.05). The HI under CI was significantly higher than that under FI under N2 and N3 (p < 0.05), the HI of CN2 was 4.21% and 4.97% higher than that of FN2, and the HI of FN3 was 13.12% and 20.34% higher than that of CN3. In addition, during the two-year experiment, the HI first increased and then decreased with an increase in the nitrogen application rate under FI and CI. Under the FI treatments, the HI of N1 was the highest, and that of N2 was the highest under the CI treatments. A variance analysis showed that the irrigation pattern and nitrogen application level had significant interactions on the rice HI (p < 0.01), and the appropriate water and N management mode could increase rice the HI by 26.89%. The experimental results showed that the HI of the 110 kg/ha nitrogen application rate under CI was the highest, reaching 0.574 and 0.572, respectively, in two years. This study provides a data reference and theoretical support for realizing water savings, nitrogen reduction, and sustainable agricultural development in the black soil region of Northeast China.

1. Introduction

Rice is one of the most important crops in the world and is the foremost staple food in Asia, providing 60% of the dietary calories for more than three billion people [1]. As the first of three major grain crops in China, its output accounts for approximately 33.8% of the total grain output [2]. Currently, China is the largest rice producer and consumer in the world. With the continuous growth of China’s population (1.4 billion now) [3], the rice yield has a direct impact on China’s food security.
Currently, a lack of water resources has become an important problem that hinders agricultural development, and rice is the most water-consuming crop in agriculture. The irrigation water consumption of a paddy field accounts for greater than 65% of the total agricultural water consumption [4]. In addition, the application of fertilizer is of great significance to the rice yield. Nitrogen fertilizer accounts for the largest proportion of chemical fertilizers. During the actual agricultural production process, if a reasonable application amount of nitrogen fertilizer cannot be scientifically estimated, this results in excessive application, and a large portion of this N fertilizer will pollute the water, soil, and atmosphere through NH3 volatilization, runoff, and leaching [5]. Based on the above status and problems, it has become important to explore the appropriate water and N management mode to improve the rice yield. The total rice yield still needs to be increased to feed the growing population under the current situation of increasing water resource shortages. Therefore, scholars have proposed many water-saving regimes, such as aerobic rice systems [6] and alternate wetting and mode rate soil drying regimes [7]. Different water-saving regimes have greatly reduced the need for irrigation water and improved the water use efficiency. Currently, China’s demand for agricultural water is rising sharply, and the contradiction between supply and demand is becoming increasingly prominent [8]. Therefore, it is very necessary to develop water-saving agriculture. In addition to water, nitrogen is another key factor that determines crop yield, but many farmers alleviate the pressure of agricultural production by increasing the application of nitrogen fertilizer. This is an unreasonable method and not desirable. Some studies have shown that the blind application of nitrogen fertilizer will cause “extravagant nitrogen consumption of rice” and seriously reduce the yield [9]. For the important task of agricultural production to improve the utilization efficiency of water and fertilizer resources, some scholars have studied the coupling of water and nitrogen. This water and nitrogen coupling has been studied because these two factors interact jointly to affect crop growth and development [10]. Researchers have also proposed the viewpoint of “regulating water with fertilizer and promoting fertilizer with water” [11,12]. Some scholars have conducted extensive research on the relationships between water–nitrogen coupling, crop growth, and the environment [13,14,15], and these studies have shown that the goals of stable yield, yield increase, and sustainable agricultural development can be achieved using an appropriate water and nitrogen management mode.
Currently, there are two primary methods to further increase rice yield. The first is to increase the HI when the biological yield is certain. The second is to increase the biological yield under the condition of a certain HI. The HI is the ratio of the crop economic yield to the biological yield. This concept was first proposed by the former Soviet scholar Niki Porovich in 1954 [16]. In recent years, some scholars have conducted a series of studies on increasing the yield by improving the rice HI [17,18,19]. In China, Liao et al. led by proposing a comprehensive index of the high HI of rice. The research showed that a high HI of rice showed the advantages of a high and stable yield and wide adaptability during the production practice [20]. The research of He et al. proved that rice varieties with a high HI had better development characteristics, enhanced photosynthetic product transport, and enhanced distribution characteristics, and these further improved the rice yield [21]. The research of Mai et al. showed that the cultivation method of sowing effectively improved the rice HI [22]. The research of Xue et al. showed that the rice HI was improved by late sowing, early planting, and early topdressing [23]. Most of the studies on improving the yield by improving the HI have focused on rice breeding and cultivation. According to previous studies, the crop yield can be improved to a certain extent using water and fertilizer management, and there is a close relationship between rice dry matter accumulation and transport. However, the research results on the impact of water and the nitrogen management mode on the rice HI remain vague.
The formation of a crop yield is essentially a process of dry matter synthesis, accumulation, transport, and distribution [24]. Some scholars have conducted relevant studies on crop dry matter accumulation and transport. Huang et al. proposed that fertilizer and water conditions have an impact on the total dry matter quality of rice, and there was a significant positive correlation between the rice yield and the total dry matter accumulation [25]. Zhou et al. showed that nutrient management and nitrogen backward transfer are conducive to dry matter accumulation and transport after heading, which is an important method to promote a high rice yield [26,27]. Research by Zhang et al. showed that there were significant differences in maize dry matter transport under different water and nitrogen management modes [28]. The Zhang et al. research showed that subsoiling can increase the dry matter accumulation of spring maize and improve the dry matter transport efficiency [29]. Research by He et al. showed that soil microfilm mulching and timely one-time irrigation can promote the transport of winter wheat vegetative organs to grains [30]. However, for the same crop variety, the different growth environment may also lead to a difference in the HI.
Heilongjiang Province is located in the northeast black soil region of China, one of the four black soil zones in the world. The northeast black soil region consists of black humus topsoil as the dominant ground component [31]. The region has the characteristics of high fertility, good structure, and loose texture and is suitable for farming and crop growth. It is an important commodity grain and rice production and supply base in the country [32], and it plays an important role in ensuring national food security [33]. However, during the process of rice planting, the water and nitrogen resource investment required is too high, and this causes great risks for sustainable agricultural development in Heilongjiang Province. Moreover, Heilongjiang Province is located in arid and semi-arid areas, and water shortage problems are becoming increasingly serious [34]. In addition, the excessive application of nitrogen fertilizer will reduce nitrogen use efficiency and cause environmental pollution [13]. Currently, it is feasible and necessary to propose a reasonable water and nitrogen management mode for rice production for Heilongjiang Province to achieve a stable and increased rice yield by improving the HI.
In this study, the response of the rice HI to water and nitrogen management modes in the northeast black soil region was studied by analyzing the rice yield data, dry matter accumulation, and HI under different water and nitrogen management modes for two years. The aim of this study was to (1) clarify the influence law and degree of water and nitrogen management mode on the rice HI in the black soil region of Northeast China, and (2) explore a reasonable water and nitrogen management mode to increase and stabilize the yield by improving the rice HI. The results of this study provide useful information for rice production in the northeast black soil region to achieve a higher grain yield and resource use efficiency. This study also provides scientific guidance for rice production in the northeast black soil region to formulate a reasonable water and nitrogen management model and provide data support to scientifically estimate the relationship between the water and nitrogen management mode and the rice HI.

2. Materials and Methods

2.1. Survey of the Test Area

The experiment was conducted in summer and autumn of Y1 and Y2 at the Rice Irrigation Experimental Station of the Heping Irrigation District, Qing’an County, Heilongjiang Province. The experimental station (127°40′45″ E, 46° 57′ 28″ N) is located in the middle upper reaches of the Hulan River Basin that is located in the plain area of low mountains and hills and belongs to the typical black soil region of Northeast China. The annual average temperature is 2.5 °C, the annual average precipitation is 550 mm, and the annual average water evaporation is 750 mm. The water–thermal growth period of crops is 156–171 days, and the annual frost-free period is 128 days. The climate characteristics belong to the cold temperate continental monsoon climate. The soil type is albic rice soil, which is classified as clay loam soil (USDA classification). It had a soil bulk density of 1.01 g/cm3 and soil porosity of 61.8%. It is the primary soil type in the Songnen Plain, and rice has been planted in the experimental region for more than 20 years. The soil is fertile, and the soil nutrient content is stable. The soil tillage thickness was 11.3 cm, and the thickness of the plough base layer was 10.5 cm at the time of the study. The basic physical and chemical properties of the soil were as follows: the mass ratio of organic matter was 41.4 g/kg, the pH value was 6.40, the mass ratio of total nitrogen was 15.06 g/kg, the mass ratio of total phosphorus was 15.23 g/kg, the mass ratio of total potassium was 20.11 g/kg, and the mass ratio of alkaline hydrolyzable nitrogen was 154.36 mg/kg [35].

2.2. Experiment Design

In this experiment, there were two irrigation modes. Four nitrogen application levels were selected under each irrigation mode, and the test scheme is shown in Table 1. Two irrigation modes were established in this test: conventional flooding irrigation (FI) and controlled irrigation (CI). Under CI, the field surface maintained a water layer of 5–25 mm at the re-green stage of rice, and no water layer was established at the other growth stages. The soil moisture content of the root layer was regarded as the water control index to determine the irrigation quota and irrigation time. The upper limit of irrigation was the soil saturated moisture content. During the pre-tiller, mid-tiller, end-tiller, jointing and booting stage, heading flowering stage, and milky stage, the lowest limits of the soil moisture content were 85%, 85%, 60%, 85%, 85%, and 70% of the saturated water content, respectively. Under FI, except for the proper drainage and drying during the late tillering stage to prevent ineffective tillering and natural drying during the yellow ripening stage, the field surface at the other rice growth stages was maintained at a 3–5 cm water layer. Four nitrogen application levels were selected during the experiment, namely N0 (0 kg/ha), N1 (85 kg/ha), N2 (110 kg/ha), and N3 (135 kg/ha). There were 8 treatments in this experiment, 3 repetitions for each treatment, a total of 24 experimental plots, and the area of each plot was 100 m2(10 m × 10 m). A random block arrangement was adopted. To prevent water and nitrogen exchange between each plot, each plot was separated by inserting plastic plates to a depth of 40 cm. The fertilizers tested were urea (N 46%), superphosphate (P2O5 12%), and potassium chloride (K2O 60%). The proportion of nitrogen fertilizer applied during each period was base fertilizer: tiller fertilizer: panicle fertilizer equal to 4.5:2:3.5. The base fertilizer was applied one day before rice transplanting, the tiller fertilizer was applied 24 days after transplanting, and the panicle fertilizer was applied 72 days after transplanting. The phosphorus fertilizer (P2O5 45 kg/ha) and potassium fertilizer (K2O 80 kg/ha) were used for each treatment. The phosphorus fertilizer was applied once before transplanting, and the potassium fertilizer was applied before transplanting and at an 8.5 leaf age of the rice with a ratio of 1:1. The study employed the variety “Suijing 18”, which is a popular variety of rice in the local area, and the planting density was 30 cm × 10 cm with three plants per hole.

2.3. Determination Items and Methods

2.3.1. Dry Matter Weight of Rice at Each Growth Stage

At each growth stage of rice, representative rice were selected as samples from each treatment block. To reduce the boundary effect, five plant samples with uniform growth were selected from the middle portion of the block. The agricultural compressed sprayer was used to rinse and clean up the organs of the rice plant. After loading it into the bag, it was brought back to the Ministry of Agriculture’s Key Laboratory for the efficient utilization of agricultural water resources, placed into an oven, adjusted to 105 °C, and killed green for 30 min under the condition of a blast. It was then dried at a constant temperature until 70 °C, and the dry matter of the different parts was weighed [36].

2.3.2. Rice Yield and Its Components

At maturity, five representative rice samples with uniform growth were selected from each field block, and the number of effective panicles, thousand grain weight, grain number per panicle, and seed setting percentage (%) were manually inspected. The theoretical rice yield was then calculated according to the population density of the rice.

2.3.3. Determination of Rice Plant N Content

The weighed rice plant was crushed into various parts of the plant organs with a pulverizer, screened through an 80 mesh (0.18 mm) screen, digested by H2SO4–H2O2 method, and the solution to be measured was taken to determine the N content with a continuous flow analyzer (autoanalyzer-3, Bran+Luebbe, Norderstedt, Germany).

2.3.4. Calculation Equation of the Relevant Indicators

HI = Y/AGDM,
where
  • AGDM = Above ground dry matter accumulation, kg/ha;
  • Y = Yield, kg/ha;
  • HI = Harvest index.
The material transport capacity of the stem and leaf = the dry matter weight of the stem and leaf at the heading stage − the dry matter weight of the stem and leaf at maturity, t/ha.
The stem leaf material transport rate = the material transport capacity of the stem and leaf/the dry matter weight of the stem and leaf at the heading stage, %.
The grain contribution rate = the material transport capacity of the stem and leaf/the dry matter weight of the rice at maturity, % [37].
ET = P + I + G + W1 − R − D − W2
where
  • ET = water consumption, mm
  • P = rainfall, mm
  • I = irrigation amount
  • G = Groundwater recharge, mm; because the buried depth of groundwater in the test area is very deep, K value is taken as 0
  • W1 = Soil water storage of 0–60 cm after rice transplanting
  • R = Drainage during rice growth period, mm
  • D = Deep soil leakage, mm
  • W2 = Soil water storage during rice harvest, mm
  • N recovery efficiency (NRE, %) = (Aboveground nitrogen uptake in N application area − Aboveground N uptake in control area)/N application amount × 100% [38].

2.4. Data Processing and Analysis

Excel Y1 was used for the statistics, calculation, and processing of the yield-related data. IBM SPSS Statistics 22 was used for the significance analysis, and ANOVA and origin2021b software were used for the mapping.

3. Results

3.1. Effects of the Different Water and Nitrogen Management Modes on the Rice Yield and Its Components

The rice yield and its components under different water and fertilizer management modes are shown in Table 2. The results show that, under FI, the number of effective panicles of rice increased with an increase in the nitrogen application. Under CI, the number of effective panicles of rice first increased and then decreased with an increase in the nitrogen application. Under CI, the number of grains per panicle first increased and then decreased with an increase in the nitrogen application. The number of grains per panicle of rice first increased and then decreased with the amount of nitrogen application under FI in Y1, while it increased with an increase in the nitrogen application under FI in Y2. The seed setting percentage of the rice decreased significantly when the nitrogen application level increased from N2 to N3 under the two irrigation modes; in Y1, it decreased from 88.1% to 78.4% under FI, from 88.4% to 82.8% under CI, and, in Y2, it decreased from 89.2% to 79.5% under FI, from 90% and from 82% under CI. Under FI, the thousand seed weight of the rice decreased with an increase in the nitrogen application. In Y1, with the increase in nitrogen application, the thousand seed weight decreased from 23.89 g to 19.8 g, in which the nitrogen application level from N1 to N2 was significantly different (p < 0.05), and, in Y2, it decreased from 23.8 g to 19.98 g, in which the nitrogen application level from N2 to N3 was significantly different (p < 0.05). Under CI, it first increased and then decreased with the increase in the N application in Y1, CN2 > CN3 > CN1 > CN0, and continued to increase with the increase in N application in Y2, from 20.61 g to 25.33 g. The differences in these related characters of the theoretical yield affected the theoretical yield. Under the two irrigation modes, the yield first increased and then decreased with the increase in N application level. The yields of the CN2 treatment were the highest, 9179.37 kg/ha and 9024.18 kg/ha, respectively, and those of CN0 treatment were the lowest, 5855.39 kg/ha and 5788.99 kg/ha, respectively, in Y1 and Y2. Under N0, the yields of FI in two years were 3.24% and 2.28% higher than those of CI, respectively. Under N1, N2, and N3, the yield under CI was higher than that under FI. The yields of the FN2 treatment and the CN2 treatment reached the maximum under FI and CI, respectively. Under the two irrigation modes, the rice yield increased at first and then decreased with an increase in the nitrogen application. This result demonstrated that nitrogen is an important element to promote rice yield, but excessive application will reduce the rice yield. Under the N1, N2, and N3 treatments, the yield of CI was higher than that of FI. Under the N1, N2, and N3 in Y1, the yield increase of CI compared with FI was 0.5%, 6.61%, and 9.99%, respectively, and the increase in Y2 was 3.44%, 4.35%, and 14.63%, respectively. This demonstrated that, under the same nitrogen application level, CI was more conducive to an improvement in the rice yield. The above results showed that CI and the appropriate nitrogen application level effectively improved the rice yield.

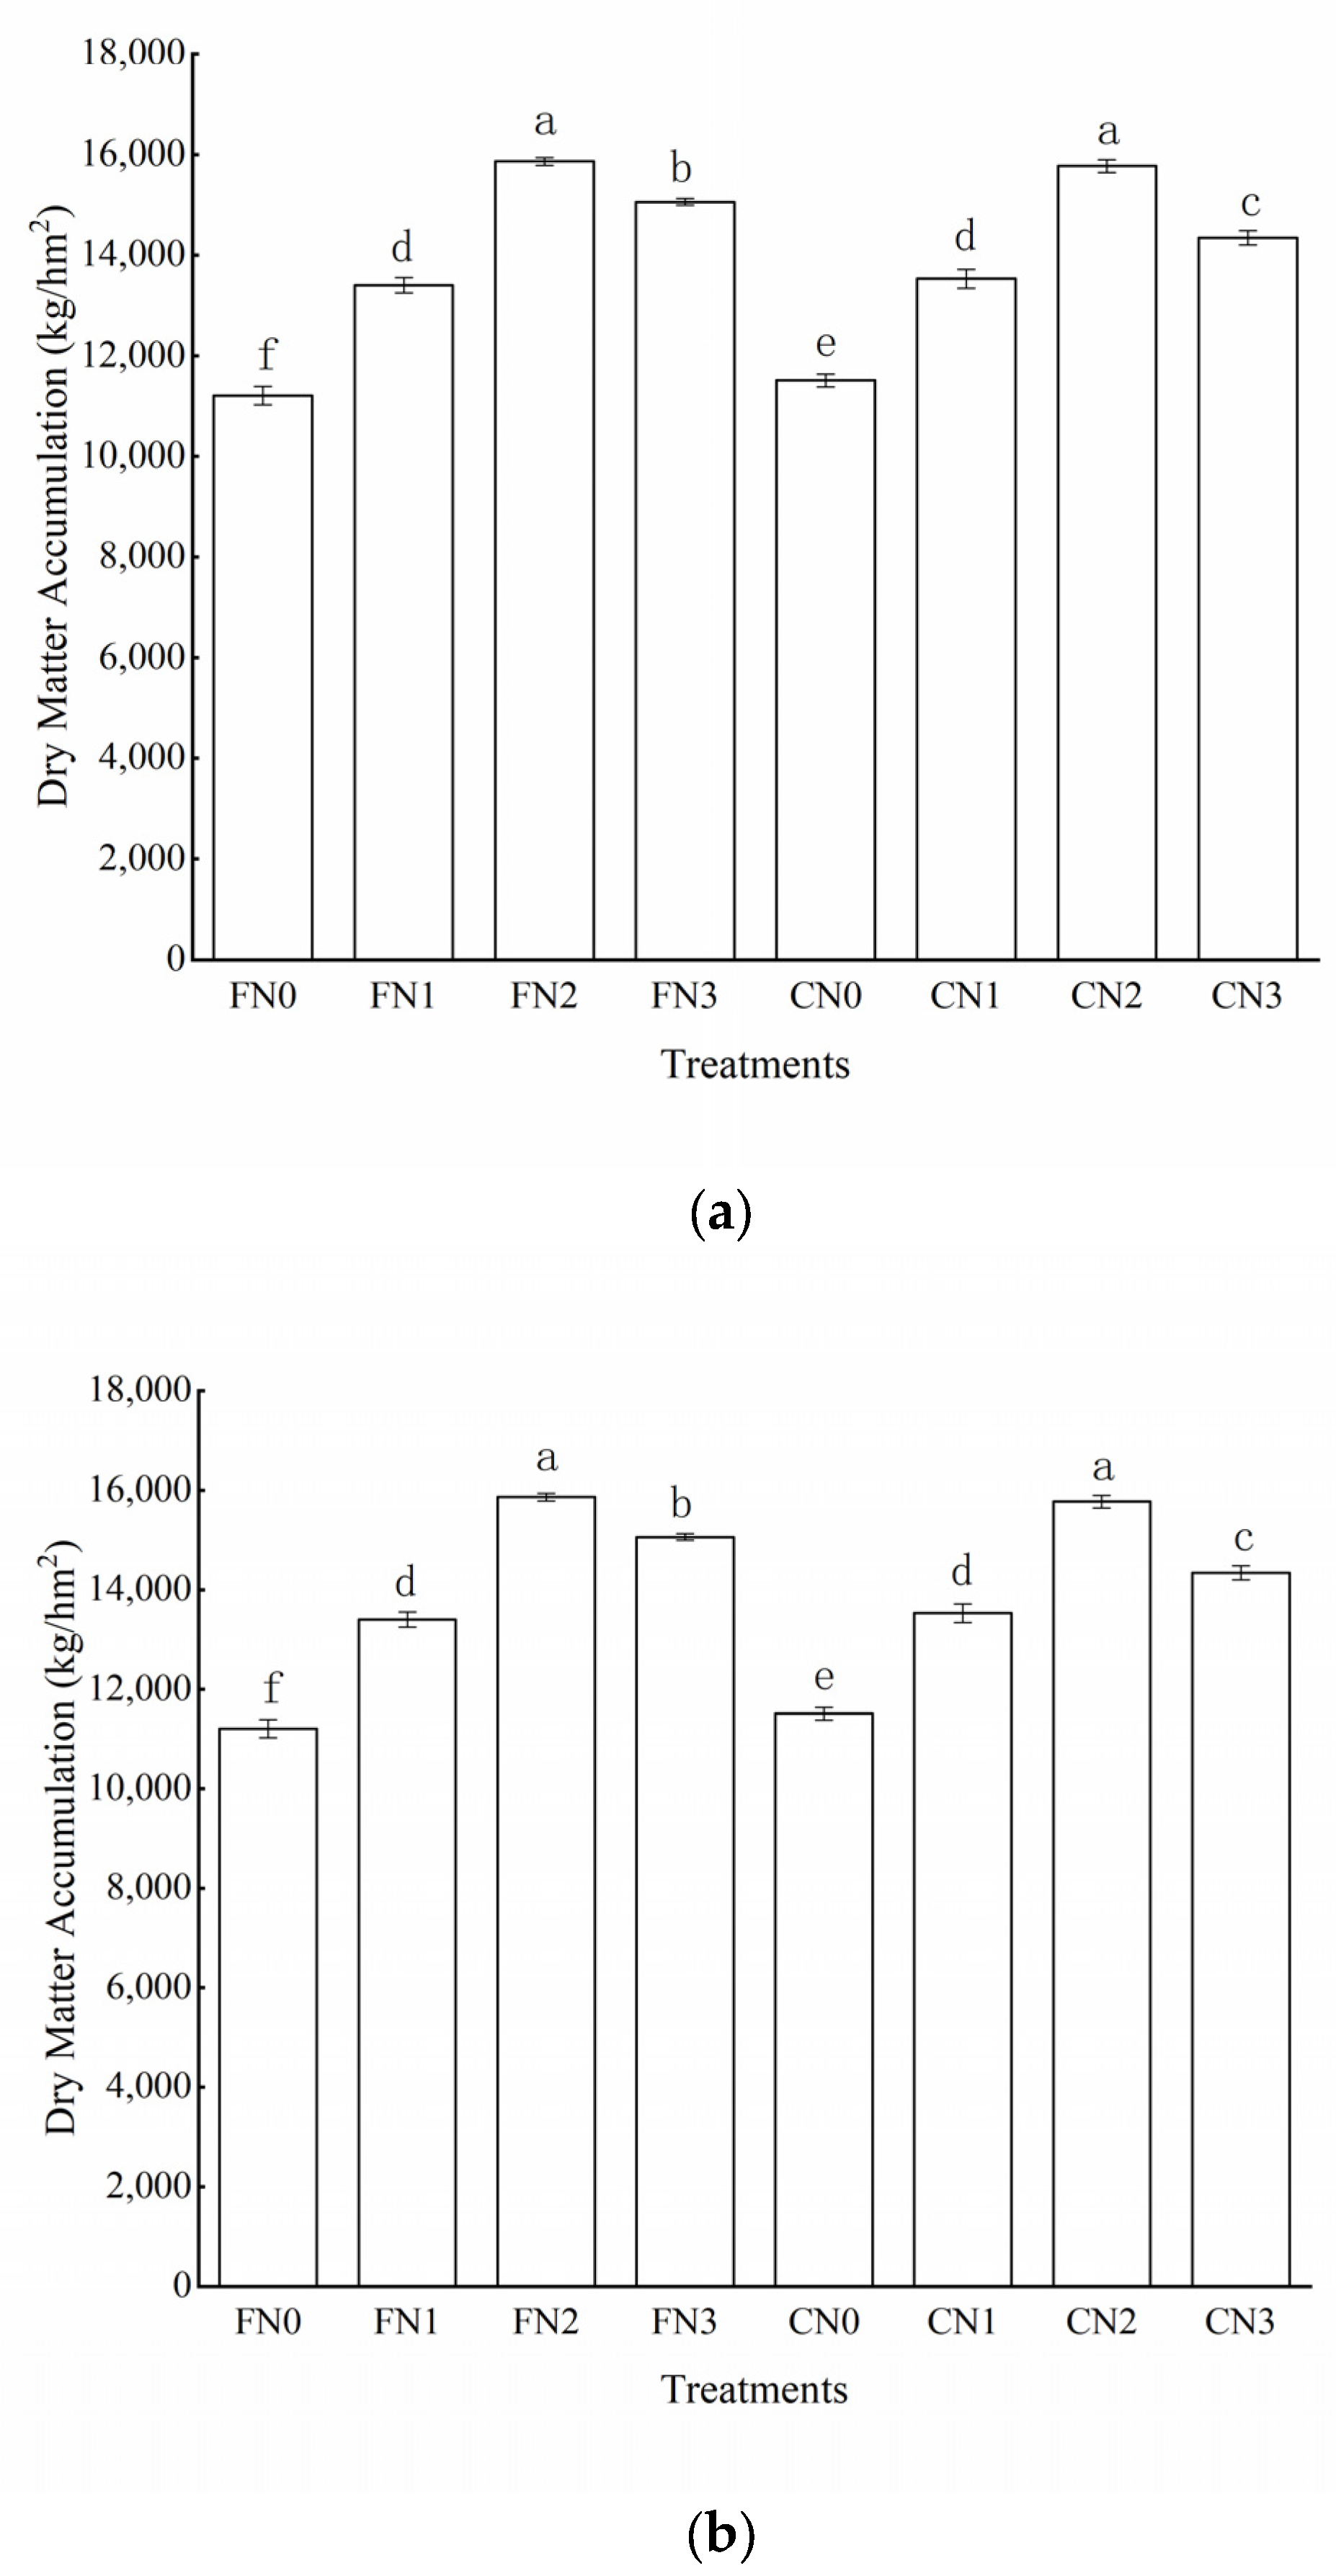
3.2. Effects of the Different Water and Nitrogen Management Modes on the above Ground Dry Matter Accumulation

The above ground dry matter accumulations during rice maturity under the different water and nitrogen management modes in Y1 and Y2 are shown in Figure 1. Under the same irrigation mode, the above ground dry matter accumulation first increased and then decreased with an increase in the nitrogen application level. The maximum dry matter accumulation was 15,981.9 kg/ha for the CN2 treatment in Y1 and 15,867.68 kg/ha for the FN2 treatment in Y2. When the nitrogen application rate exceeded a certain level, the excess nitrogen could not continue to contribute to the dry matter accumulation and even reduced the dry matter accumulation. By comparing the above ground dry matter accumulations under different irrigation modes at the same nitrogen application level, under N3 in Y1, the dry matter accumulation of rice under FI was 2.85% higher than that under CI (p < 0.05). Under N0, N1, and N2, the dry matter accumulation of rice under CI was 0.11%, 0.14%, and 2.31% higher than that under CI, respectively (p < 0.05). Under N0 and N1 in Y2, the dry matter accumulation under CI was 2.68% and 0.99% higher than that under FI, respectively, with a significant difference under N0 (p < 0.05). However, under N2 and N3, the dry matter accumulation under CI was 0.59% and 4.98% higher than that under CI, respectively, with significant difference under the N3 level (p < 0.05).
The results show that the dry matter accumulation of CI was more at the low nitrogen application level, while that of FI was more at the medium and high nitrogen application levels. Under the different water and nitrogen management modes, the above ground dry matter accumulation of rice was significantly different. The two factors of water and nitrogen affected the aboveground dry matter accumulation of rice.

3.3. Effects of Different Water and Nitrogen Management Modes on Water and Nitrogen Use Efficiency

The effects of different water and nitrogen management modes on water use efficiency (WUE) are shown in Table 3. The results showed that the water consumption and WUE of rice were different under different water and nitrogen management modes. Under the same N application level, the water consumption of CI was significantly lower than that of FI (p < 0.05). In Y1, the water consumption of CI was 31.74–34.59% lower than that of FI, and, in Y2, the water consumption of CI was 32.27–34.09% lower than that of FI. Additionally, under the same N application level, the WUE of CI was significantly higher than that of FI (p < 0.05). Under the four N application levels, the WUEs of CI were 46.74%, 53.57%, 56.20%, and 63.81% higher than those of FI in 2019, while they were 48.35%, 56.76%, 57.02%, and 69.23% in 2020. Under the same irrigation mode, the water consumption of rice increased first and then decreased with the increase in N application. Under the FI, the water consumption of FN2 was the highest, reaching 7115.66 m3/ha and 7147.02 m3/ha, respectively, in two years, and the water consumption of FN0 was the lowest, 6570.93 m3/ha and 6506.43 m3/ha, respectively; under CI, the water consumption of CN2 was the highest, 4856.91 m3/ha and 4749.57 m3/ha, respectively, and those of CN0 were the lowest, 4337.32 m3/ha and 4288.14 m3/ha, respectively. Moreover, under the two irrigation modes, The WUE first increased and then decreased with the increase in N application. The WUE of N2 was the highest, and that of N0 was the lowest. In 2019, the WUEs of N2 reached 1.21 kg/m3 and 1.89 kg/m3, respectively, 31.52% and 40% higher than those of N0; in 2020, the WUEs of N2 reached 1.21 kg/m3 and 1.9 kg/m3, 32.97% and 40.74% higher than those of N0.
Under different water and N management modes, the total N accumulations of rice in Y1 and Y2 were 138.5–207.28 kg/ha and 134.41–205.65 kg/ha, respectively. Under the same N application level, the total N accumulation of CI increased by 6.55–8.42% and 6.99–8.53%, respectively, in 2019 and 2020, compared with FI. Under the CI, NRE increased by 8.79–15.12% and 5.07–11.74%, respectively, in two years compared with FI. The results showed that the CI was more conducive to the absorption and utilization of nitrogen by rice. Under the same irrigation mode, the total N accumulation of rice increased significantly with the increase in N application (p < 0.05). In Y1 and Y2 under FI, the total N accumulation of FN1 was 18.16% and 18.63% higher than those of FN0, the total N accumulation of FN2 was 27.88% and 29.41% higher than those of FN0, and those of FN3 were 38.95% and 40.98% higher than FN0, respectively; under CI, the total N accumulation of CN1 was 18.54% and 18.24% higher than those of CN0, the total N accumulation of CN2 was 30.13% and 30.61% higher than those of CN0, and the total N accumulation of CN3 was 40.46% and 42.54% higher than those of CN0, respectively. NRE increased with the increase in N application under the two irrigation modes (p < 0.05). In the Y1 and Y2, NRE of FN2 was 18.66% and 21.99% higher than those of FN1, while those of FN3 were only 13.83% and 9.43% higher than those of FN2. Similarly, NRE of CN2 was 25.57% and 29.73% higher than those of CN1, while those of CN3 were only 13.83% and 13.21% higher than those of CN2. The results showed that NRE increased with the increase in N application, but the increase rate of NRE decreased when N application was too high.

3.4. Effects of the Different Water and Nitrogen Management Modes on the Dry Matter Transport

The material transports of the rice stems and leaves under the different water and nitrogen management modes are shown in Table 4. Different irrigation modes combined with different nitrogen application rates will have an impact on the rice stem and leaf material transport capacity, transport rate, and grain contribution rate. Under the two different irrigation modes, the material transport capacity of the stem and leaf, the transport rate, and the grain contribution rate of rice generally increased first and then decreased with an increase in the nitrogen application. At N0, the material transport capacity of the stem and leaf, the transport rate, and the grain contribution rate of FI were higher than those of CI. However, at N1, N2, and N3, the material transport capacity of the stem and leaf, the transport rate, and the grain contribution rate of FI were lower than those of CI. In Y1, the material transport capacity of the stem and leaf of FN3 was 0.53% lower than that of CN0 (p > 0.05) and, compared with other water and nitrogen management modes, FN3 was 22.39–49.82% lower and the difference was significant (p < 0.05). The stem and leaf material transport rate of the FN3 treatment was the lowest among all the treatments, which was 40.64–59.98% lower than that of the other water and nitrogen treatments (p < 0.05). The contribution rate of grains was the lowest under the FN2 treatment in Y1. It was 8.7–43.67% lower than the other water and nitrogen management modes, in which FN2 had no significant difference compared with FN3, and a significant difference was reached with the other treatments (p < 0.05). In Y2, the FN3 treatment had a lower stem and leaf material transport capacity, transport rate, and contribution rate to grain than the other water and nitrogen management modes at 28.38–60.1%, 58–73.08%, and 22.75–48.85%, respectively, with a significant difference (p < 0.05). The results showed that the different water and nitrogen management modes had significant effects on the dry matter transport of rice. Under the N1, N2, and N3 levels, the stem and leaf matter transport capacity and rate were higher under CI than under FI, and the grain contribution rates of CI at the N1, N2, and N3 application levels in Y1 were higher than those of FI. There was no significant difference between FI and CI at N1 in Y2, and the contribution rates of the CI grains at N2 and N3 were significantly higher than those of FI (p < 0.05). The formation of the rice yield is essentially the accumulation and transport of dry matter. The transport capacity, transport rate, and grain contribution rate of dry matter comprehensively reflect the transport capacity of rice dry matter. According to the three indexes, the combination of CI and N2 had significant advantages over the other water and fertilizer treatments in the late heading stage of rice.

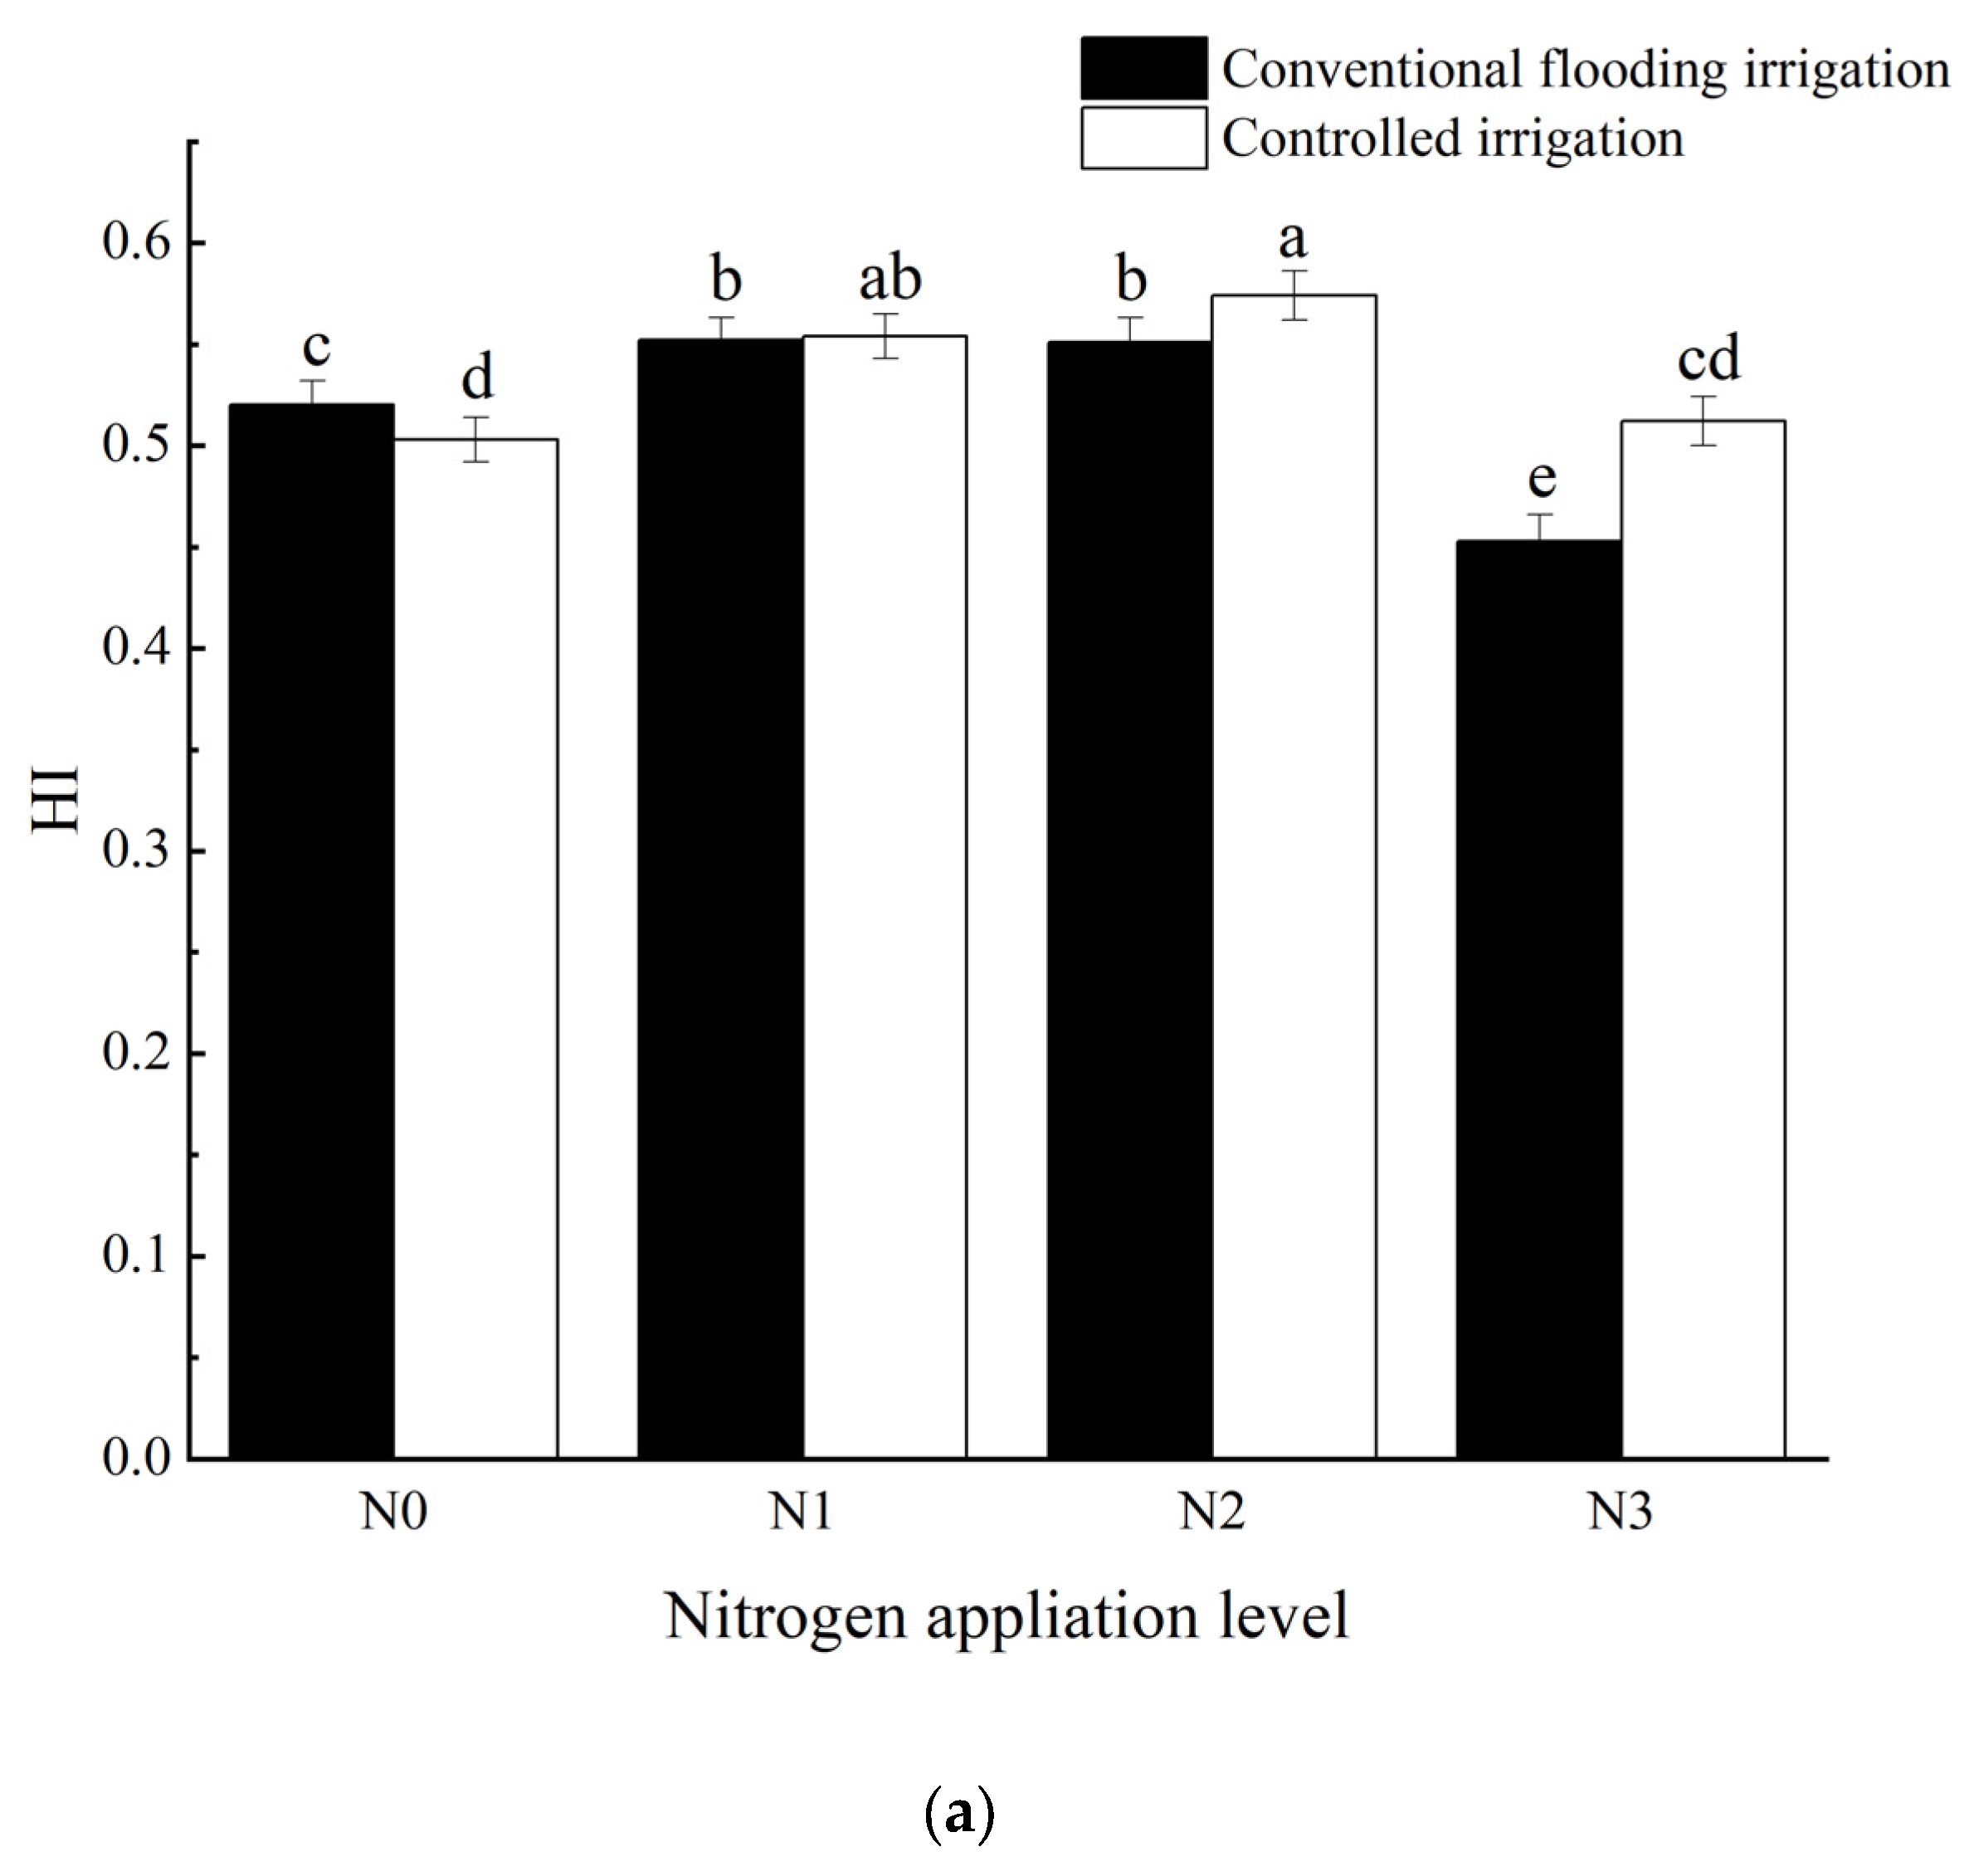
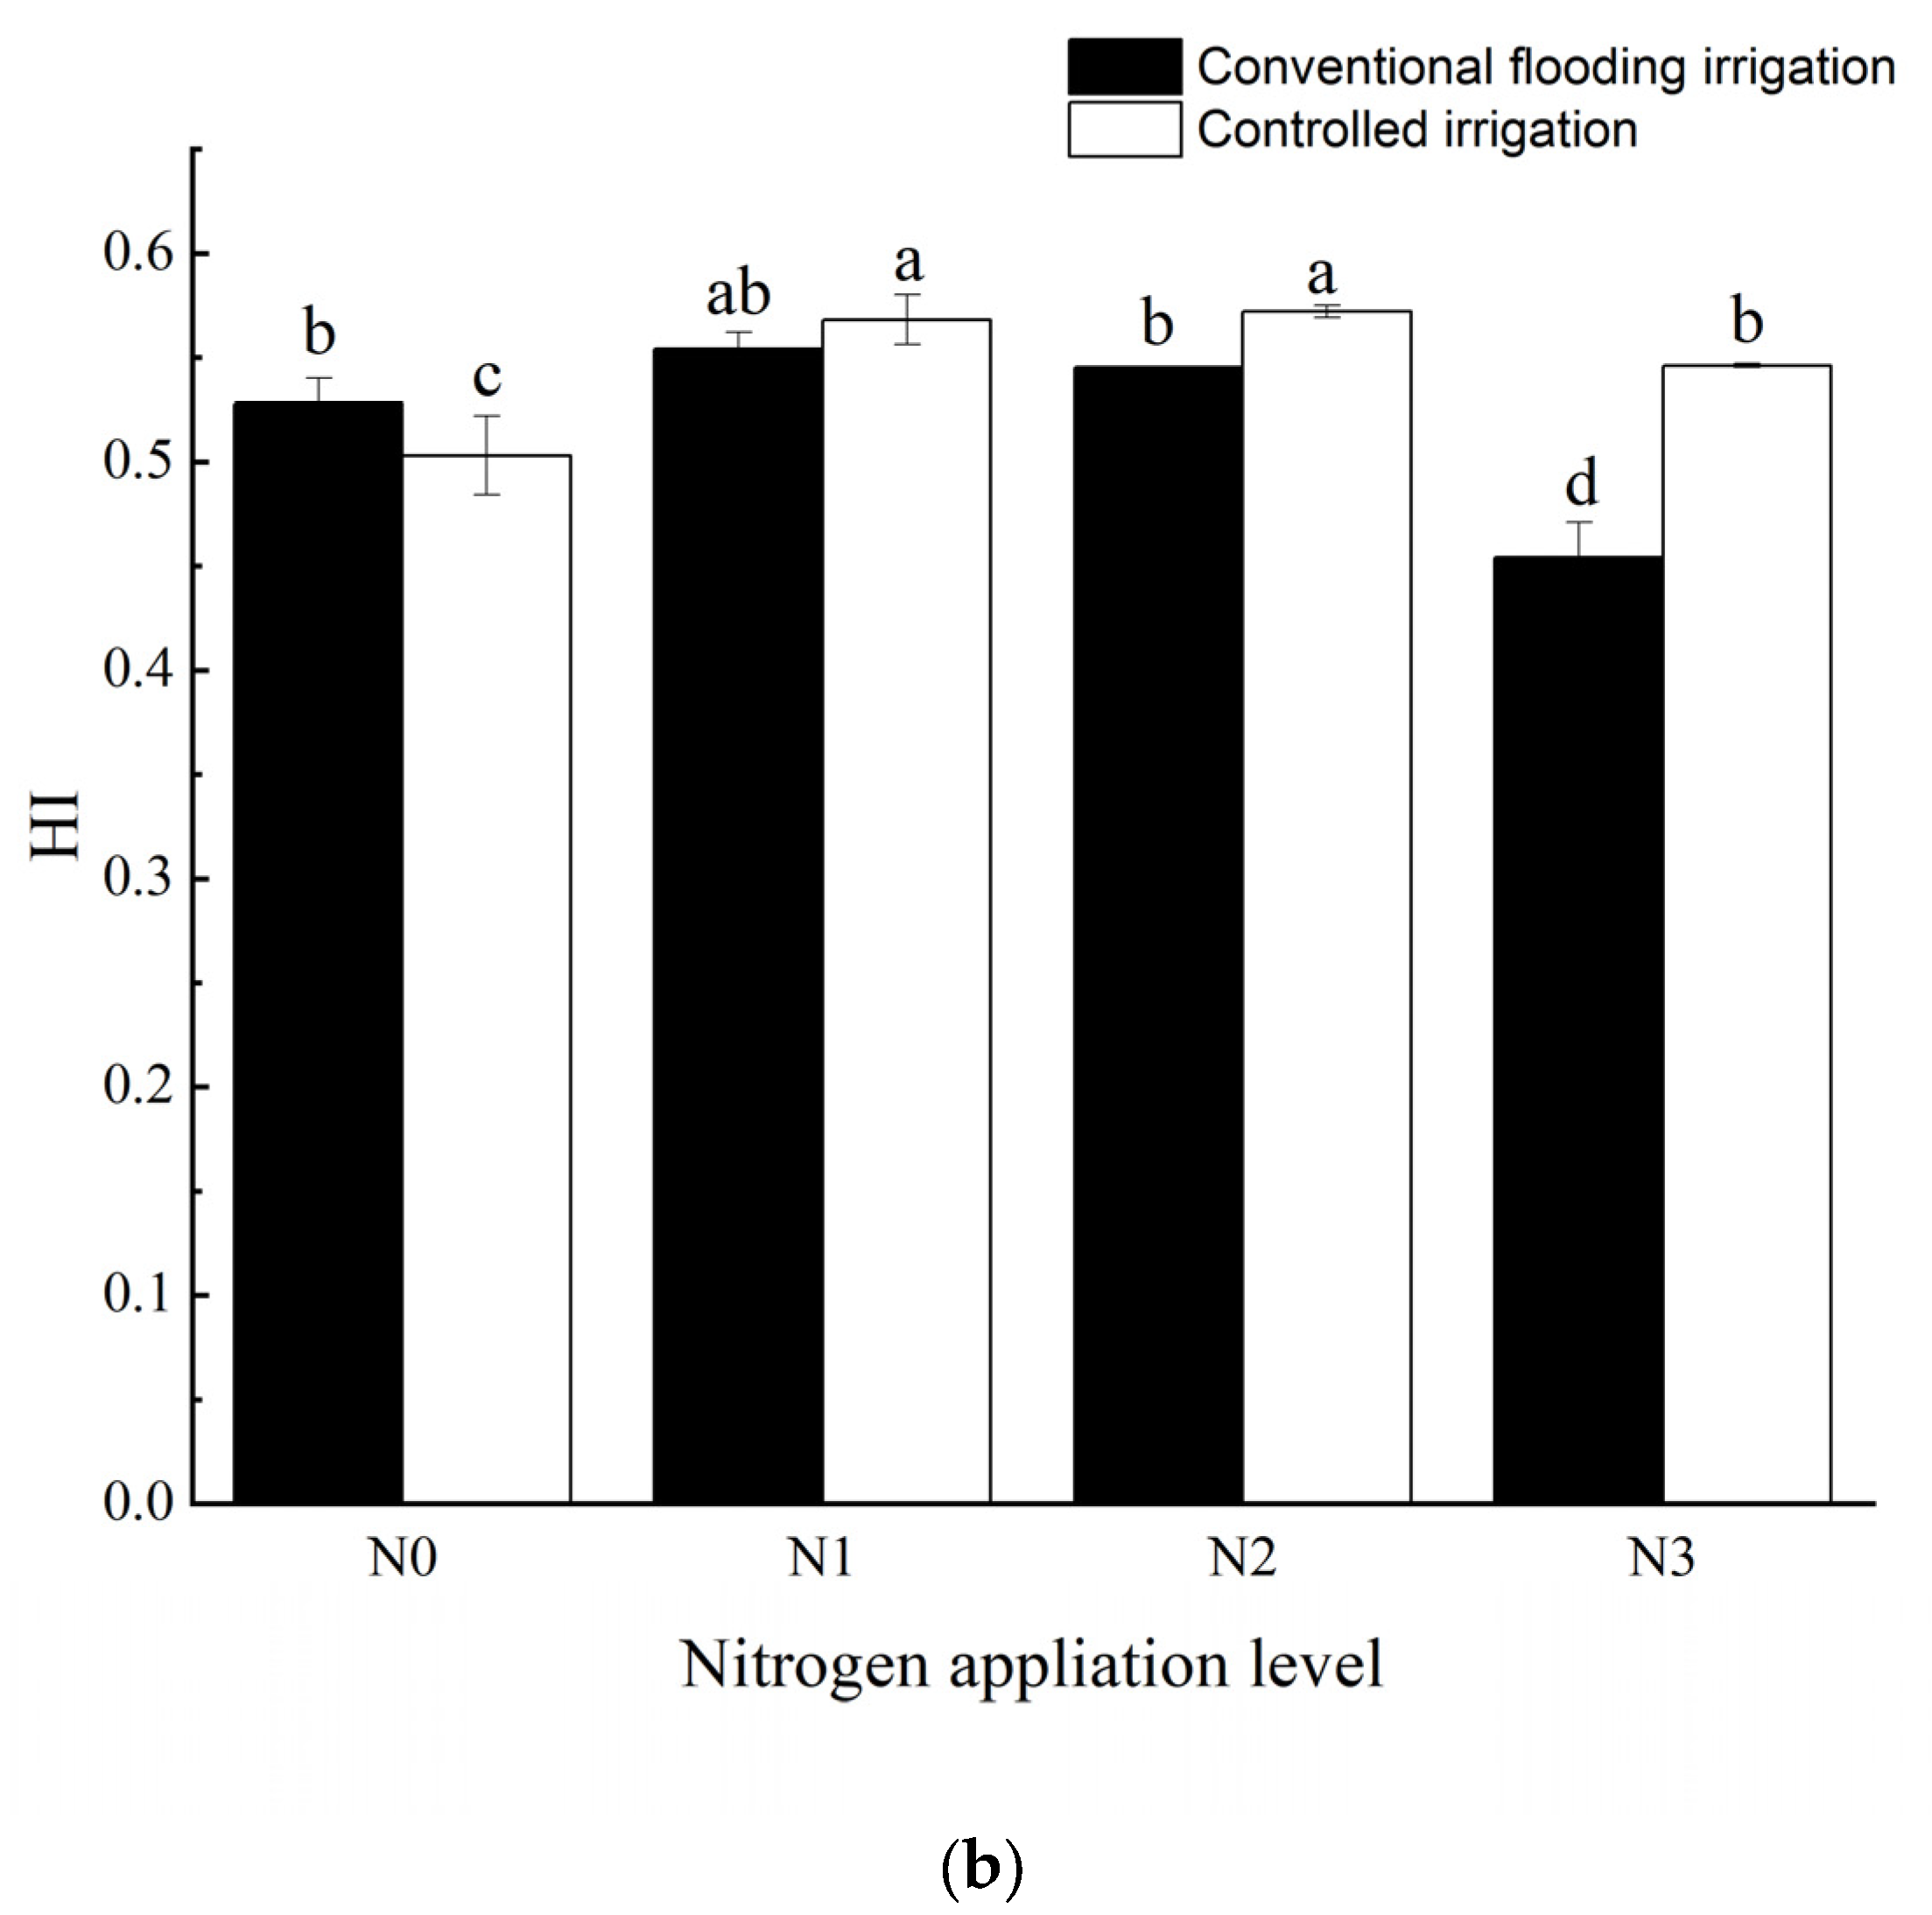
3.5. Effects of the Different Water and Nitrogen Management Modes on the Rice HI

A comparison of the HIs of the different water and nitrogen management modes is shown in Figure 2. In Y1 and Y2, at N0, the HIs of FN0 were 0.52 and 0.528, respectively, higher than those under CN0 by 3.38% and 4.97% (p < 0.05). At N1, N2, and N3, the HI under CI was higher than that under FI, and the difference was significant at the nitrogen application levels of N2 and N3. At N2, the HIs of CN2 were 0.574 and 0.572, respectively, higher than those of FN2 in Y1 and Y2 by 4.17% and 4.95%. At N3, the HIs of CN3 in Y1 and Y2 were 0.512 and 0.546, respectively, 13.02% and 20.26% higher than those of FN3, respectively. The results showed that, under the same nitrogen application level, CI was more conducive to improving the rice HI. Under the same irrigation mode and different nitrogen application levels, the rice HI also showed significant differences.
Under FI, the order of the rice HI from high to low was FN1 > FN2 > FN0 > FN3. In Y1 and Y2, the HI of the FN1 treatment was the highest; it was 0.552 and 0.554 in two years, respectively, and 0.2%, 6.2%, and 21.9% higher than those of the other three treatments in Y1 and 1.7%, 4.9%, and 22% higher than those of Y2. The difference between FN1 and FN2 was not significant in the two-year experiment (p > 0.05), and the difference between FN2 and FN0 reached a significant level in Y1 (p < 0.05). There was no significant difference between FN2 and FN0 in Y2, and the difference between FN0 and FN3 reached a significant level in two years (p < 0.05). Under CI, the order of HI from high to low was: CN2 > CN1 > CN3 > CN0. In Y1 and Y2, the HI of the CN2 treatment was the highest, respectively, 3.6%, 12.1%, and 14.1% higher than those of the other three treatments in Y1 and 0.7%, 4.8%, and 13.7% higher than those of Y2. The HIs of the CN2 and CN1 treatments were different but not significant (p > 0.05). The difference in the HIs between the CN1 and CN3 treatments reached a significant level in two years (p < 0.05), and the difference in the HIs between the CN3 and CN0 treatments was not significant in Y1 but significant in Y2 (p < 0.05). Although the significant difference level in the experiment was different in the interannual variation, under the same irrigation mode, the HI first increased and then decreased with an increase in the nitrogen application. In this experiment, the change trend of the HI under CI was similar to that of the yield, but not under FI because, under FI, with an increase in the nitrogen application, the increase rate of the dry matter accumulation was greater than that of the yield, resulting in a decline in the rice HI.
The data showed that different water and nitrogen management modes will affect the rice HI, and, for improving the rice HI, CI was better than FI, and N1 and N2 show advantages in improving the rice HI.

3.6. Interaction Effect of the Water and Nitrogen Factors on the Rice HI

Under field conditions, irrigation methods and nitrogen application levels interact with the dry matter accumulation and transport capacity, HI, and rice yield (Table 5). Under N0, the yield, HI, and dry matter transport capacity of FI were higher than those of CI. Under N1, N2, and N3, the yield, HI, and dry matter transport capacity of FI were lower than those of CI. Under FI, the rice HI, yield, and dry matter accumulation of FN2 were the highest, and those under FN0 were the lowest. FN1 and FN2 showed advantages in the HI and dry matter transport capacity. Therefore, FN1 had a low dry matter accumulation but high yield. Under CI, the laws of the rice HI and dry matter transport capacity were the same, which were CN2 > CN1 > CN3 > CN0, and the laws of the yield and dry matter accumulation were CN2 > CN3 > CN1 > CN0. Rice yield is affected by dry matter accumulation and transport. The stronger the ability of accumulation and transport, the higher the yield. The irrigation mode and nitrogen application level had a certain interactive effect on the rice dry matter accumulation and transport.
Under the same water and nitrogen management mode, the interannual change had no significant effect on the rice yield, stem and leaf material transport rate, and H. The effect of the irrigation mode on the dry matter accumulation was not significant, and the effect of the irrigation mode on other indexes in the table reached a very significant level (p < 0.01). In addition, the effects of the Y × W interaction on the rice yield, dry matter accumulation, stem and leaf matter transport, grain contribution rate, and HI were not significant, and the conclusion showed that, under the two-year experiment, the influence law of the irrigation mode on these indexes was consistent. In addition, it can be seen from the above that the CI was better than FI under the appropriate nitrogen application level. The effect of the nitrogen application level on all the research indexes reached a very significant level (p < 0.01), while the effect of the Y × N interaction on the rice yield, stem and leaf matter transport rate, grain contribution rate, and HI was not significant. In addition, the effect on the dry matter accumulation and stem and leaf matter transport was very significant (p < 0.01). The results showed that, during the two-year experiment, the dry matter accumulation and transport were different in different years, and the effect of the nitrogen application level on the rice yield, stem and leaf matter transport rate, grain contribution rate, and HI was the same in different years. The interaction of the irrigation and nitrogen application (W × N) had a significant effect on the rice yield, dry matter accumulation, transport, and HI (p < 0.01). An analysis of the influence degree of the water and nitrogen factor interaction (Y × W × N) on these indexes under interannual change showed that it had no significant effect on the yield, stem and leaf material transport rate, and HI, indicating that the influence degree of the water and nitrogen factor interaction on these three indexes was not affected by interannual change.
The results showed that both the water and nitrogen factors would affect the rice yield, dry matter accumulation and transport, and HI to varying degrees, and the interaction of the irrigation mode and nitrogen application rate reached a very significant level. In this study, the interaction effect of the CN2 treatment was superior to other treatments in the rice water and nitrogen management mode, which was the best water and nitrogen management mode in this study. Therefore, in the black soil region of Northeast China, CI and an appropriate amount of nitrogen fertilizer should be applied to achieve the coordination of water and fertilizer and promote dry matter transport so as to improve the HI and yield.

4. Discussion

Water plays an important role in the growth of rice. Moisture in soil is different under different irrigation methods. Moisture in soil has an impact on rice growth and development and agronomic character [39,40,41,42]. By comparing the rice HI under different irrigation modes, it was concluded that, under the appropriate nitrogen application level, the rice HI and yield of CI were higher than those of FI. In Northeast China, the rice yield can be improved by increasing the HI. Research by Chen et al. showed that [43] the HI of “Suijing18” planted under water-saving irrigation in Heilongjiang was higher than that under conventional irrigation. The conclusion was consistent with the results of CI compared with FI under the nitrogen application levels of N1, N2, and N3 in this experiment. Compared with FI, CI improved the rice HI, which may have been because CI can effectively improve the efficient leaf area index at the full heading stage, slow leaf senescence after full heading (high leaf SOD activity and low MDA content), and better maintain leaf photosynthetic energy so as to improve the rice HI [44]. Under CI in this experiment, the irrigation volume of FI was greater than that of CI from the heading stage to the milk ripening stage. The research results showed that the HI of FI was lower than that of CI, and the dry matter transport capacity was lower than that of CI, which was consistent with the research results of Sun et al. The research of Sun et al. showed that the output and the conversion rate of the stem and sheath from the heading stage to the maturity stage decreased with an increase in the irrigation volume, thus reducing the rice HI [45]. The research of Wang et al. also reached the same conclusion and showed that, compared with FI, the alternative dry–wet irrigation mode improved the HI and yield of rice by improving the transport capacity of non-structural carbohydrates [46].
Nitrogen has an important impact on the growth of rice and plays a key role in the rice yield. The excessive application of nitrogen fertilizer will reduce the nitrogen utilization rate, waste resources, and pollute soil and water resources [47]. Zheng et al. demonstrated that the carbon–nitrogen ratio of rice leaves in Northeast China was lower than that of the control under the condition of high nitrogen application [48]. This showed that the high input of nitrogen fertilizer was not conducive to rice growth. In this experiment, the rice HI of the two irrigation modes increased at first and then decreased with an increase in the nitrogen application level. According to research by Cao et al., this situation may have been caused by too many tillers under a high nitrogen application rate, and late tillers have difficulty forming panicles, and the movement of stem and leaf materials to panicles is low [49]. Fang et al. reached the same conclusion in research results from Southwest China [50], and the rice HI under the nitrogen application rate of 150 kg/ha was significantly higher than those of 120 kg/ha and 180 kg/ha. This result was consistent with the experimental conclusion that the rice HI increased first and then decreased with an increase in the nitrogen application rate. However, the difference is that, in the research by Fang et al., the rice HI was the highest under a nitrogen application level of 150 kg/ha, while the nitrogen application level with the highest HI under the two irrigation modes in this experiment was 85 kg/ha under FI and 110 kg/ha under CI because the land fertility in the northeast is higher than that in the southwest. Moreover, Yang et al. showed that soil with high organic matter content, sufficient nitrogen, and good texture can better meet the nitrogen nutrient demand of rice after nitrogen reduction than poor soil [51], and this can explain the difference between the optimal nitrogen application rate obtained in this experiment and the research by Fang et al. In this experiment, the dry matter transport capacity first increased and then decreased with an increase in the nitrogen application. Zhao et al. showed that reducing the nitrogen fertilizer promoted dry matter transport after anthesis and grain filling after anthesis [52]. This may be because an appropriate amount of nitrogen application is conducive to the storage of assimilates in crops, the transport of assimilates to grains, and the increase in the soluble sugar content and starch accumulation in grains [53]. Studies by Zhang et al. have shown that [54], whether it is rice or wheat, the appropriate amount of nitrogen application can ensure a high material transport rate, high nitrogen use efficiency, and economic benefits.
Crops absorb water and nutrients, and these are two independent processes, but the effects of water and nutrients on crop growth are interactive [55]. Studies have shown that the water and nitrogen interaction will have a significant impact on crop HI [56,57]. An analysis of the interaction of water and nitrogen factors on the rice HI showed that there was a significant interaction between the irrigation mode and nitrogen application on above ground dry matter accumulation, transport capacity, yield, and the HI of rice (p < 0.01).

5. Conclusions

The two-year field experiment aims to report different water and nitrogen management modes to improve the rice yield by improving the HI. The results showed that the HI of conventional flooding irrigation was higher than that of controlled irrigation under the N application level of 0 kg/ha, and that of controlled irrigation was higher than those of conventional flooding irrigation under the N application levels of 85 kg/ha, 110 kg/ha, and 135 kg/ha. Under the two irrigation modes, the rice HI increased first and then decreased with an increase in the nitrogen application. Under conventional flooding irrigation, the HI under different N application levels was significantly different: the highest HI was obtained with 85kg/ha of N application under conventional flooding irrigation, the yield was the highest under the N application level of 110 kg/ha, and, under the controlled irrigation, the HI and yield were both the highest under the N application level of 110 kg/ha. Additionally, the results showed that controlled irrigation was beneficial to improve the WUE and NRE of rice.
The results showed that the interaction effect of water and nitrogen on the rice HI was significant. Considering the rice HI and yield, the controlled irrigation combined 110 kg/ha N application treatment is the best water and nitrogen management mode we recommend for rice planting in the black soil region of Northeast China.

Author Contributions

Conceptualization, Z.Z. and S.D.; methodology, S.D.; software, S.D. and T.L.; validation, Z.W., Z.G. and Z.Q.; formal analysis, S.D.; investigation, S.D.; resources, Z.Z.; data curation, S.D.; writing—original draft preparation, S.D; writing—review and editing, S.D.; visualization, X.Z.; supervision, Z.Q.; project administration, Z.Z.; funding acquisition, Z.Z. All authors have read and agreed to the published version of the manuscript.

Funding

This research was supported by National Natural Science Foundation Project of China (the project no. 52079028).

Institutional Review Board Statement

Not applicable.

Informed Consent Statement

Not applicable.

Data Availability Statement

Not applicable.

Conflicts of Interest

The authors declare no conflict of interest.

References

  1. Fageria, N.K. Yield Physiology of Rice. J. Plant Nutr. 2007, 30, 843–879. [Google Scholar] [CrossRef]
  2. National Bureau of Statistics of the People’s Republic of China. Statistical Bulletin of the People’s Republic of China on National Economic and Social Development in 2017. Available online: http://www.stats.gov.cn/tjsj/zxfb/201802/t20180228_1585631.Html (accessed on 14 October 2020).
  3. Tong, Y. Research on the Latest Dynamics and Trends of Population in China—An Analysis Combines with Seventh National Census Data. J. China Univ. Labor Relat. 2021, 35, 15–25. [Google Scholar]
  4. China Irrigation and Drainage Development Center. Technical Guidelines for Computer Monitoring and Information System of Pumping Station: SL583—2012; Ministry of Water Resources of the People’s Republic of China: Beijing, China, 2012; pp. 6–7.
  5. Wang, X. Treatment and protection of agricultural non-point source pollution in Fenhe Reservoir and its upstream drinking water functional area. J. Soil Water Conserv. China 2010, 2010, 55–57. [Google Scholar]
  6. Bouman, B.A.M.; Peng, S.; Castañeda, A.R.; Visperas, R.M. Yield and water use of irrigated tropical aerobic rice systems. J. Agric. Water Manag. 2004, 74, 87–105. [Google Scholar] [CrossRef]
  7. Zhang, H.; Xue, Y.; Wang, Z.; Yang, J.; Zhang, J. An Alternate Wetting and Moderate Soil Drying Regime Improves Root and Shoot Growth in Rice. J. Crop Sci. 2009, 49, 2246–2260. [Google Scholar] [CrossRef]
  8. Gao, Y.; Wu, P.; Zhao, X.; Wang, Z. Growth, yield, and nitrogen use in the wheat/maize intercropping system in an arid region of northwestern China. J. Field Crops Res. 2014, 167, 19–30. [Google Scholar] [CrossRef]
  9. Xiao, X.; Zhu, W.; Yang, L.; Deng, Y.; Huang, L.; Zhao, Y.; Wang, J. Effects of irrigation model and nitrogen fertilization on rice evapotranspiration and yield. J. Nanjing Agric. Univ. 2012, 35, 27–31. [Google Scholar]
  10. Yao, F. Studies on Physiological Mechanism of Rice Growth and Water and Nitrogen Use Efficiency under Different Water and Nitrogen Regimes. Ph.D. Thesis, Huazhong Agricultural University, Wuhan, China, 2011. [Google Scholar]
  11. Prasertsak, A.; Fukai, S. Nitrogen availability and water stress interaction on rice growth and yield. J. Field Crops Res. 1997, 52, 249–260. [Google Scholar] [CrossRef]
  12. Sandhu, S.S.; Mahal, S.S.; Vashist, K.K.; Buttar, G.S.; Brar, A.S.; Singh, M. Crop and water productivity of bed transplanted rice as influenced by various levels of nitrogen and irrigation in northwest India. J. Agric. Water Manag. 2011, 104, 32–39. [Google Scholar] [CrossRef]
  13. Yang, S.; Peng, S.; Xu, J.; Yao, J.; Jin, X.; Song, J. Characteristics and simulation of ammonia volatilization from paddy fields under different water and nitrogen management. Trans. Chin. Soc. Agric. Eng. 2012, 28, 99–104. [Google Scholar]
  14. Liu, L.; Chen, T.; Wang, Z.; Zhang, H.; Yang, J.; Zhang, J. Combination of site-specific nitrogen management and alternate wetting and drying irrigation increases grain yield and nitrogen and water use efficiency in super rice. J. Field Crops Res. 2013, 154, 226–235. [Google Scholar] [CrossRef]
  15. Zhang, Z.; Li, T.; Qi, Z.; Zhen, P.; Nie, T. Effects of Water and Nitrogen Coupling on Soil Respiration and Carbon Balance in Black Soil Paddy Field. Trans. Chin. Soc. Agric. Mach. 2020, 51, 301–308. [Google Scholar]
  16. Porovich, N.A.A. Physiological Basis of Crop Yield Variation; Science and Technology Press: Beijing, China, 1960. [Google Scholar]
  17. He, Q.; Xing, J.; Shu, F.; Zhang, W.; Deng, H. Review and Prospect for the Research on Harvest Index in Rice. J. Hybrid Rice 2012, 34, 627–634. [Google Scholar]
  18. Zhong, L. Comparative Analysis on the Yield Component Uniformity and Photosynthesis Characteristics during Later Growth Stages in Rice Varieties with Different Harvest Indexes. Acta Agric. Univ. Jiangxiensis 2012, 34, 627–634. [Google Scholar]
  19. Su, L.; Liu, Y.; Wang, Q. Rice growth model in China based on growing degree days. Trans. Chin. Soc. Agric. Eng. 2020, 36, 162–174. [Google Scholar]
  20. Liao, Y.; Chen, Z.; Chen, S. The main characteristics and discussion of the new variety Yuexiangzhan with high yield and high harvest index. China Rice 1999, 2, 11–12. [Google Scholar]
  21. He, X.; Liao, Y.; Chen, Z.; Chen, S.; Chen, Y. Studies on Translocation and Distribution of Photosynthate in Rice Variety Yuexianzhan with High Harvest Index. Chin. Agric. Sci. Bull. 2000, 3, 5–8. [Google Scholar]
  22. Mai, W.; Buhaliqem, A.; Zhang, B.; Zeng, F.; Tian, C. Rice Yield under Different Cultivation Patterns. Chin. Agric. Sci. Bull. 2019, 35, 1–5. [Google Scholar]
  23. Xue, Q.; Xu, J.; Wang, J. Technical measures to increase biological yield and harvest index of rice in north Henan. Ctry. Agric. Farmers B 2019, 10, 57–58. [Google Scholar]
  24. Chen, L.; Peng, X.; Liu, Y.; Li, Z.; Zhang, M.; Li, J. Effect of nutrient management on dry matter accumulation and translocation of rice in cold area. J. Northeast. Agric. Univ. 2010, 41, 52–56. [Google Scholar]
  25. Huang, Y.; Wang, S.; Wu, X.; Wang, X.; Liu, X.; Wang, D. Effect of Fertilizer and Water Conditions on Dry Matter Accumulation and Partition of Different Types of Rice. J. Shenyang Agric. Univ. 2004, 4, 346–349. [Google Scholar]
  26. Zhou, X.; Peng, J.; Liu, Q.; Cai, G.; Tian, C.; Liu, Y. Effect of nutrient application on dry matter accumulation and translocation of early rice. J. Hunan Agric. Univ. 2012, 38, 229–234. [Google Scholar] [CrossRef]
  27. Wang, Y.; Guo, X.; Dai, M. Effects of nitrogen application on dry matter accumulation and yield of hybrid rice. Soil Fertil. Sci. China 2008, 2, 31–34. [Google Scholar]
  28. Zhang, Z.; Liu, M.; Qi, Z. Effect of Water Nitrogen Dosage on Nitrogen Absorption and Transformation of Maize under Sprinkler Irrigation Condition. Trans. Chin. Soc. Agric. Mach. 2019, 50, 299–308. [Google Scholar]
  29. Zhang, R.; Yang, H.; Gao, J.; Zhang, Y.; Wang, Z.; Fan, X.; Bi, W. Subsoiling facilitating accumulation and transportation of dry matter and phosphorus of spring maize. Trans. Chin. Soc. Agric. Eng. 2016, 32, 106–112. [Google Scholar]
  30. He, L.; Zhang, W.; Du, X.; Zhang, Y.; Wang, L.; Cai, C.; Li, K. Soil-coated ultrathin plastic-film mulching and suitable irrigation improve water use efficiency of winter wheat. Trans. Chin. Soc. Agric. Eng. 2016, 32, 94–104. [Google Scholar]
  31. Wang, Z.; Zhang, C.; Sun, B.; Ji, Q.; Wang, C. Overview of national soil and water conservation zoning. Soil Water Conserv. China 2015, 12, 12–17. [Google Scholar]
  32. Caviglia, O.P.; Sadras, V.O.; Andrade, F.H. Intensification of agriculture in the south-eastern Pampas. Field Crops Res. 2003, 87, 117–129. [Google Scholar] [CrossRef]
  33. Sun, Y.; Li, F.; Yin, G.; Chen, L. Experimental Research of the Rice-water Production Functions in Black Soil of the Cold Regions. J. Irrig. Drain. 2010, 29, 139–142. [Google Scholar]
  34. Wang, K. Study on Rice Water Production Function and Optimal Irrigation Schedules of Chahayang Irrigation Area. Master’s Thesis, Northeast Agricultural University, Harbin, China, 2008. [Google Scholar]
  35. Zheng, E.; Zhang, Z.; Yang, H.; Chen, P. Effect of Nitrogen Fertilizers Application on Variability of Quality of Paddy with Water-saving Irrigation. Trans. Chin. Soc. Agric. Mach. 2018, 49, 271–278. [Google Scholar]
  36. Jin, J.; Xue, Y.; Yu, L.; Li, W.; Xu, D.; Qiang, X. Comparison of population quality differences among different rice planting methods. China Rice 2006, 6, 31–33. [Google Scholar]
  37. Jiang, B.; Li, H.; Wang, C.; Zhang, D.; Liu, X. Effect of mixed application of organic-inorganic fertilizers on dry matter accumulation and translcation of rice. J. Northeast. Agric. Univ. 2013, 44, 10–13. [Google Scholar] [CrossRef]
  38. Yang, X.; Zhang, F. Genetics of Plant Nutrition; China Agricultural Press: Beijing, China, 1997; pp. 40–42. [Google Scholar]
  39. Li, A.; Yi, S.; Wang, X. The Mechanism and Research of Water Saving Irrigation of Rice in Cold Region. J. Agric. Mech. Res. 2014, 36, 46–49. [Google Scholar]
  40. Li, J.; Zhang, H.; Gong, J. Effects of Different Planting Methods on the Culm Lodging Resistance of Super Rice. Sci. Agric. Sin. 2011, 44, 2234–2243. [Google Scholar]
  41. Zhang, S.; He, Q.; Wang, H. Effects of nitrogen application rates on nitrogen use efficiency and grain yield of indica hybrid rice F You498 under controlled intermittent irrigation. J. Plant Nutr. Fertil. 2018, 24, 82–94. [Google Scholar]
  42. Meng, X.; Zhou, L.; Zhang, Z.; Wu, Q. Effects of Different Irrigation Patterns on Growth, Water and Radiation Use Efficiency of Rice. Trans. Chin. Soc. Agric. Mach. 2019, 50, 285–292. [Google Scholar]
  43. Chen, S.; Zhou, T.; Du, X. Effects of Water-saving and Drought-resistant Cultivation Models on Panicle Characters and Yield of Main Rice Varieties (Lines) in Heilongjiang Province. Heilongjiang Agric. Sci. 2020, 1, 28–38. [Google Scholar]
  44. Li, M.; Luo, D.; Jiang, M.; Jiang, X.; Ji, G.; Li, L.; Zhou, W. Effect of Water Control and Density Increased Cultivation Mode on Photosynthetic Characteristics of Nitrogen Reduction Fertilized Rice. Guizhou Agric. Sci. 2020, 48, 1–4. [Google Scholar]
  45. Sun, Y.; Sun, Y.; Liu, K.; Zhang, R.; Ma, J. Effects of water-nitrogen interaction on rice senescence and material transport and yield during grain filling. J. Plant Nutr. Fertil. 2009, 15, 1339–1349. [Google Scholar]
  46. Wang, Z.; Zhang, W.; Sarah, S. Grain yield, water and nitrogen use efficiencies of rice as influenced by irrigation regimes and their interaction with nitrogen rates. Field Crops Res. 2016, 193, 54–69. [Google Scholar] [CrossRef]
  47. Shang, Z.; Yang, P.; Li, Y.; Ren, S.; Liu, P.; He, G. Effects of different chemical nitrogenous fertilizer application rates on soil nitrogen leaching and accumulation in deep vadose zone. Trans. Chin. Soc. Agric. Eng. 2012, 28, 103–110. [Google Scholar]
  48. Zheng, E.; Yang, H.; Chen, P.; Zhang, Z. Effects of Carbon-Nitrogen Absorption, Soil Respiration and Yield of Rice under Water and Fertilizer Management Modes. Trans. Chin. Soc. Agric. Mach. 2018, 49, 287–295. [Google Scholar]
  49. Cao, N.; Xiong, Q.; Chen, X.; He, H.; Zhu, C.; Fu, J.; Cai, S.; Xu, T. Effects of different nitrogen application rate on low temperature resistance of late rice at heading and flowering stage. Chin. J. Appl. Ecol. 2018, 29, 2566–2574. [Google Scholar]
  50. Fang, L.; Zhang, Y.; Xie, J.; Huang, X.; Zhao, Y.; Yang, L.; Shi, X. Effects of Nitrogen Rate and Application Regime on Rice Yield and Nitrogen Use Efficincy in Cold Waterlogged Paddy Fields. J. Southwest Univ. 2020, 42, 53–60. [Google Scholar]
  51. Yang, Z.; Shen, T.; Luo, Z.; Peng, Z.; Hu, Y.; Zi, T.; Xiong, T.; Song, H. Effects of Low Nitrogen Rate Combined with High Planting Density on Yield Formaation and Nitrogen Use Efficiency of Machine Transplanted Double Cropping Rice. Crops 2020, 2, 71–81. [Google Scholar]
  52. Zhao, Y.; Su, M.; Lv, Y.; Kuang, F.; Chen, X.; Zhang, Y.; Shi, X. Wheat Yield, Nutrientuse Efficiencies and Soil Nutrient Balance under Reduced Fertilizer Rate. J. Plant Nutr. Fertil. 2017, 23, 864–873. [Google Scholar]
  53. Wang, Y.; Yu, Z.; Li, S.; Yu, S. Effect of Nitrogen on Carbon Assimilation and Transfer and Yield after Wheat Anthesis. J. Triticeae Crops 2002, 2, 55–59. [Google Scholar]
  54. Zhang, J.; Liu, J.; Zhang, J.; Zhao, F.; Chen, Y.; Wang, W. Effect of Nitrogen Application Rates on Translocation of Dry Matter and Utilizayion of Nitrogen in Rice and Wheat. Acta Agron. Sin. 2010, 36, 1736–1742. [Google Scholar] [CrossRef]
  55. Dong, X.; Liu, S.; Tao, S. Effects of Water Use Efficincy and Economic Benefit in Summer Corn under Different Water Coordinationg Fertilizer. Acta Agric. Boreali-Sin. 2000, 4, 81–85. [Google Scholar]
  56. Wu, L.; Zhang, F.; Zhou, H.; Suo, Y.; Xue, F.; Zhou, J.; Liang, F. Effect of drip irrigation and fertilizer application on water use efficiency and cotton yield in North of Xinjiang. Trans. Chin. Soc. Agric. Eng. 2014, 30, 137–146. [Google Scholar]
  57. Liu, X.; Zhang, F.; Tian, Y.; Li, Z. Interactive imact of water and nitrogen on group yield of spring wheat and use of water and nitrogen in Shiyang River Basin. J. Northwest A F Univ. 2009, 37, 107–113. [Google Scholar]
Figure 1. Dry matter accumulation under the different water and nitrogen treatments in (a) 2019 and (b) 2020. Note: the different letters in the same figure indicate that the difference between treatments was significant (p < 0.05), and the same letter indicates that the difference was not significant (p > 0.05), same as below.
Agriculture 12 00115 g001
Figure 2. Comparison of the HI under the different irrigation modes in (a) 2019 and (b) 2020. Note: the different letters in the same figure indicate that the difference between treatments was significant (p < 0.05), and the same letter indicates that the difference was not significant (p > 0.05), same as below.
Agriculture 12 00115 g002aAgriculture 12 00115 g002b
Table 1. Design of the experimental treatments kg/ha.
TreatmentIrrigation ModesNitrogen Application Levels
FN0Conventional flooding irrigation0
FN1Conventional flooding irrigation85
FN2Conventional flooding irrigation110
FN3Conventional flooding irrigation135
CN0Controlled irrigation0
CN1Controlled irrigation85
CN2Controlled irrigation110
CN3Controlled irrigation135
Table 2. Effects of the different water and nitrogen treatments on the rice yield and its components.
2019 TreatmentsThe Number of Effective Panicles (Panicle/ha)Grain Number per Panicle (Grain/Panicle)Seed Setting Percentage (%)Thousand Seed Weight (g)Yield (kg/ha)
FN04.0766 × 106 d71.43 d86.9 a,b23.89 a6045.26 c
FN14.4677 × 106 c86.96 c88.1 a,b22.4 a,b7667.04 b
FN24.9273 × 106 a,b91.15 b88.1 a,b21.76 b8609.95 a
FN35.0067 × 106 a,b90.91 b78.4 b19.8 b7065.53 b
CN04.7595 × 106 b69.68 d85.5 a,b20.65 b5855.39 c
CN14.881 × 106 b95.26 a79.6 b20.81 b7702.02 b
CN25.0223 × 106 a89.66 b,c88.4 a23.06 a,b9179.37 a
CN34.8739 × 106 b85.47 c82.8 b22.53 a,b7771.09 b
2020 TreatmentsThe Number of Effective Panicles (Panicle/ha)Grain Number per Panicle (Grain/Panicle)Seed Setting Percentage (%)Thousand Seed Weight (g)Yield (kg/ha)
FN04.1028 × 106 d70.18 d86.4 b23.8 a,b5920.85 c
FN14.3894 × 106 d81.43 c88.6 a23.43 a,b7419.86 b
FN24.6154 × 106 c89.5 b89.2 a23.47 a,b8647.89 a
FN34.7661 × 106 b,c90.28 a79.5 c19.98 c6834.67 b,c
CN04.8382 × 106 b68.22 d85.1 b20.61 b5788.99 d
CN14.9024 × 106 b83.17 c84 b,c22.41 b7675.32 b
CN25.0418 × 106 a82.83 c90 a24.01 a9024.18 a
CN34.8953 × 106 b77.05 c,d82 c25.33 a7834.31 b
Note: the different letters after the data in the same column indicate that the difference between treatments was significant (p < 0.05), and the same letter indicates that the difference was not significant (p > 0.05), same as below.
Table 3. Effects of different water and N management modes on water and nitrogen use efficiency.
2019 TreatmentYield (kg/ha)Water Consumption (m3/ha)WUE (kg/m3)Total N Accumulation (kg/ha)NRE (%)
FN06045.266570.93 b0.92 g138.5 e
FN17667.046845.57 a,b1.12 e163.65 d29.59 d
FN28609.957115.66 a1.21 d177.12 c35.11 c
FN37065.536729.07 a,b1.05 f192.45 b39.96 b
CN05855.394337.32 d1.35 c147.57 e
CN17702.024477.92 c,d1.72 b174.93 c,d32.19 c,d
CN29179.374856.81 c1.89 a192.03 b40.42 b
CN37771.094518.07 c,d1.72 b207.28 a44.23 a
2020 TreatmentYield (kg/ha)Water Consumption (m3/ha)WUE (kg/m3)Total N Accumulation (kg/ha)NRE (%)
FN05920.856506.43 b0.91 g134.41 e
FN17419.866684.56 b1.11 e159.45 d29.46 d
FN28647.897147.02 a1.21 d173.94 c35.94 c
FN36834.676571.79 b1.04 f189.49 b40.8 b
CN05788.994288.14 d1.35 c144.28 e
CN17675.324411.10 c,d1.74 b170.59 c,d30.95 d
CN29024.184749.57 c1.9 a188.45 b40.15 b
CN37834.314451.32 c,d1.76 b205.65 a45.46 a
Note: the different letters after the data in the same column indicate that the difference between treatments was significant (p < 0.05), and the same letter indicates that the difference was not significant (p > 0.05), same as below.
Table 4. The stem and leaf transport capacity, transport rate, and grain contribution rate of rice.
2019 TreatmentsMaterial Transport Capacity of Stem and Leaf (t/ha)Stem Leaf Material Transport Rate (%)Grain Contribution Rate (%)
FN00.719 d12.49 c10.91 b
FN10.924b c13.17 b,c11.85 a
FN20.752 d14.52 b6.72 e
FN30.558 e6.5 d7.36 d,e
CN00.561 e10.95 c7.92 d
CN10.98 b14.69 a,b11.93 a
CN21.112 a16.24 a10.85 b
CN30.858 c11.61 c9.93 c
2020 TreatmentsMaterial Transport Capacity of Stem and Leaf (t/ha)Stem Leaf Material Transport Rate (%)Grain Contribution Rate (%)
FN00.736 d14.09 b,c10.95 b,c
FN11.063 b,c15.56 b13.94 a
FN20.937 c14.09 b,c9.23 c
FN30.482 e5.49 d7.13 d
CN00.673 d13.07 c9.58 c
CN11.082 b16.38 a,b13.53 a,b
CN21.208 a17.46 a12 b
CN30.987 c14.04 b,c11.88 b
Note: the different letters after the data in the same column indicate that the difference between treatments was significant (p < 0.05), and the same letter indicates that the difference was not significant (p > 0.05), same as below.
Table 5. Interaction effects of water and nitrogen on the rice HI and its related indexes.
YieldDry Matter AccumulationStem Leaf Material Transport CapacityStem Leaf Material Transport RateGrain Contribution RateHI
Y5.94 *78.38 **44.32 **19.80 **29.58 **3.73NS
W71.14 **1.73NS148.81 **67.84 **23.16 **43.92 **
N979.62 **2305.3 **186.3 **98.5 **45.54 **104.99 **
Y × W1.58NS1.15NS2.71NS4.76 *0.97NS2.41NS
Y × N0.2NS14.24 **3.89 **2.13NS1.31NS1.83NS
W × N31.01 **19.65 **81.63 **36.54 **33.18 **37.6 **
Y × W × N1.93NS4.73 **6.29 **2.45NS2.9 *1.71NS
Note: Y represents the year, W represents the irrigation mode, N represents the nitrogen application level, the number represents the F value, *and ** represents the different significant levels, p < 0.05 and p < 0.01, and NS represents no significant difference.
Publisher’s Note: MDPI stays neutral with regard to jurisdictional claims in published maps and institutional affiliations.

