Article

Application of Fourier Transform Infrared Spectroscopy and Multivariate Analysis Methods for the Non-Destructive Evaluation of Phenolics Compounds in Moringa Powder

1
Department of Biosystems Machinery Engineering, College of Agricultural and Life Science, Chungnam National University, Daejeon 34134, Korea
2
Department of Crop Science, Chungnam National University, 99 Daehak-ro, Yuseong-gu, Daejeon 34134, Korea
3
Department of Smart Agriculture Systems, College of Agricultural and Life Science, Chungnam National University, 99 Daehak-ro, Yuseong-gu, Daejeon 34134, Korea
4
National Institute of Crop Science, Rural Development Administration, Miryang 50424, Korea
5
Environmental Microbial and Food Safety Laboratory, Agricultural Research Service, United States Department of Agriculture, Powder Mill Road, BARC-East, Bldg 303, Beltsville, MD 20705, USA
*
Author to whom correspondence should be addressed.
Agriculture 2022, 12(1), 10; https://doi.org/10.3390/agriculture12010010
Submission received: 27 November 2021 / Revised: 16 December 2021 / Accepted: 21 December 2021 / Published: 22 December 2021
(This article belongs to the Special Issue Sensors Applied to Agricultural Products)

Abstract

:
This study performed non-destructive measurements of phenolic compounds in moringa powder using Fourier Transform Infrared (FT-IR) spectroscopy within a spectral range of 3500–700 cm−1. Three major phenolic compounds, namely, kaempferol, benzoic acid, and rutin, were measured in five different varieties of moringa powder, which was approved with respect to the high-performance liquid chromatography (HPLC) method. The prediction performance of three different regression methods, i.e., partial least squares regression (PLSR), principal component regression (PCR), and net analyte signal (NAS)-based methodology, called hybrid linear analysis (HLA/GO), were compared to achieve the best prediction model. The obtained results for the PLS regression method resulted in better performance for the prediction analysis of phenolic compounds in moringa powder. The PLSR model attained a correlation coefficient ( R p 2 ) value of 0.997 and root mean square error of prediction (RMSEP) of 0.035 mg/g, respectively, which is comparatively higher than the other two regression models. Based on the results, it can be concluded that FT-IR spectroscopy in conjugation with a suitable regression analysis method could be an effective analytical tool for the non-destructive prediction of phenolic compounds in moringa powder.

1. Introduction

Moringa, a plant belonging to a family of Moringaceae, is a commonly cultivated crop in India, Africa, Indonesia, the Philippines, and various parts of the world. The plant consists of 13 species from tropical and subtropical regions, out of which Moringa Oleifera (MO) is the most cultivated one [1]. It has been consumed as a local food and in the form of medicines and also has several industrial applications [2,3]. Furthermore, due to its higher consumption, people usually refer to it as a miracle tree, as it is highly effective for curing several diseases, such as cancer, diabetes, insomnia, etc. [4]. Various studies in the past have demonstrated the advantageous effects of moringa oleifera in humans [5]. Moringa oleifera is a great source of bioactive chemical compounds, and thus, it provides several important benefits, as mentioned in previous literature [6,7]. The moringa leaves that are widely consumed are rich with vitamins, carotenoids, polyphenols, phenolic acids, flavonoids, alkaloids, isothiocyanates, tannins, and saponins; therefore, they have various pharmacological properties [8].
Phenolic compounds in plants are the secondary metabolites considered a fusion of shikimate, pentose phosphate, and phenylpropanoid pathways. The general chemical structure of phenolic compounds is an aromatic benzene ring with one or more hydroxyl groups [9]. Depending on the number of phenol moieties present in the molecule, they can be classified as simple phenols or polyphenols. Phenolic compounds have several important characteristics properties that are crucial for plants. For example, they work as a defense system for plants by protecting them from harmful UV radiations, insects, and fungi [10,11]. Furthermore, in the past, some research showed the potential of phenolic compounds to work as an antitumor, antimicrobial, anti-adhesive, and anti-inflammatory agent [12].
Currently, the extraction of phenolic compounds in moringa powder is carried out by destructive chemical methods, including mass spectrometry (MS) [13], high-performance liquid chromatography (HPLC) [14], and gas chromatography [15]. The aforementioned wet chemistry methods are fast, efficient, precise, and can detect substances under examination in trace levels, i.e., ppm or ppb levels, but they have certain drawbacks: they are often time-consuming, destructive, require complicated experimental processes, and produce several chemical wastes, limiting real-time measurement. Thus, there is an urgent requirement to develop a rapid detection technique that can cope with the limitations of the methods mentioned above for phenolic compounds measurement in moringa powder samples in a non-destructive manner.
Spectroscopic techniques are promising and important tools for the examination of structures of chemically related systems by measuring the interactions between light and matter. Different spectroscopic techniques, such as infrared spectroscopy, fluorescence spectroscopy, etc., which operate under different spectral ranges and deal with the extraction of chemical information, are sensitive to determining structural and physicochemical properties. These techniques examine the energy of radiation absorbed or emitted by the molecules. For example, infrared spectroscopy allows the measurement of symmetric and asymmetric vibrational transitions between atoms generated by the absorption of IR radiations. Furthermore, fluorescence spectroscopy measured the electronic transition of atoms and the relaxation of electrons to the ground state by the emission of color in the form of radiation that comes under the ultraviolet (UV) range.
Raman and near-infrared (NIR) spectroscopy are popular vibrational spectroscopic techniques that showed strong potential while dealing with qualitative and quantitative measurement in different kinds of organic and inorganic compounds. In the past, many researchers took advantage of these techniques in combination with specific multivariate analysis methods for various kinds of studies, i.e., they used it for the quality determination of Grignard reagent [16], prediction of anthocyanin in soybean [17], and so on. Though the following spectroscopic techniques offer various analytical applications, they still suffer from certain drawbacks while dealing with fluorescence and overtone combinations bands generated during spectral acquisitions. Thus, FT-IR spectroscopy is one of the key solutions to cope with the following limitations by measuring the fundamental vibrations of molecules. Specifically, they can be useful for extracting information regarding the structural and physicochemical properties of molecules by exploiting the matter and light interactions
Fourier Transform Infrared (FT-IR) spectroscopy is a part of vibrational spectroscopy that provides the measurement of fundamental vibrations of molecules in a non-destructive manner and is further used in the analysis of gases, liquids, and solids. Several studies were performed which utilized an application of FT-IR spectroscopy for the quality evaluation of oils mixed with benzene [18] or for the determination of adulteration in wines [19]. Furthermore, some studies were also performed in the past using moringa powder samples by evaluating quality parameters such as minerals, protein, and moisture contents [20] and sorption potential of Moringa oleifera seeds by elucidating possible functional groups responsible for up taking Ag+ [21]. Although FT-IR spectroscopy has numerous applications, as described above, the application of multivariate analysis methods is essential to extract meaningful information from the acquired spectral data. Thus, the present study mainly focused on investigating the potential application of FT-IR spectroscopy for the prediction of the total phenolic content of three significant phenolics compounds in moringa powder, namely kaempferol, benzoic acid, and rutin, by using three different regression analysis methods, namely the PLSR, PCR, and HLA/GO methods, to achieve the best prediction model for the assessment of phenolics compounds in moringa powder samples in a non-destructive manner.

2. Materials and Methods

2.1. Sample Preparation

In the present study, five different varieties of moringa powder were used, purchased from an online shop named Coupang from South Korea. The moringa samples have distinct geographical heritage: the USA, Korea, India, and Africa. The complete details regarding variety, heritage, and manufacturing company are provided in Table 1 below.
To protect the samples from moisture, all the powder samples were dried in a 70 °C dryer for one day before spectral measurement. Fourteen different concentrations, i.e., 1.95, 2.50, 3.10, 3.70, 4.42, 2.51, 2.95, 3.40, 3.82, 4.20, 2.44, 2.90, 3.30, and 3.80 (mg/g), were prepared by mixing different varieties into each other. The samples were shifted to separate snap-cap vials, and the high-speed vortex mixer high-speed Vortex Gene2 (Scientific Industries, Inc., Bohemia, NY, USA) was used for 40 s to make a uniform mixture.

2.2. FT-IR Spectral Measurements

Nicolet 6700 (Thermo Scientific Co., Waltham, MA, USA) FT-IR spectrometer was used for the spectral measurement of moringa powder samples. The system was constructed in attenuated total reflectance (ATR) sampling mode and assigned with a detector made of deuterated triglycine sulfate (DTGS), with potassium bromide (KBr) as a beam splitter, which is all managed together by software made by OMINIC. For each particular sample, the spectra were acquired under the spectral range from 3500 to 800 cm−1. The number of scans was set to 32 per sample with 4 cm−1 intervals in order to reduce the background noise generated by the instrument. The spectral acquisition was performed based on the procedure explained by [19]. During the spectral acquisition, 10 replicates were selected for each of the 14 different concentrations. Thus, a total of 140 samples were measured using an FT-IR spectrometer.

2.3. Extraction and Analysis of Phenolic Compounds Using HPLC

Extraction and analysis of phenolic compounds were carried according to the protocol described by [17]. To the 0.1 g of each fine moringa powder sample, 3 mL of aqueous MeOH solution (80%) was added and vortexed for 1 min, which was then sonicated for 1 h at 37 °C. After that, the mixture was centrifuged at 4 °C for 15 min at 10,000 rpm. The clear supernatants were passed through a 0.45 µm PTFE syringe filter (Millipore, Bedford, MA, USA) into amber glass vials (Thermo Fisher Scientific, Waltham, MA, USA). The HPLC machine, mobile phase, gradient program, identification, and quantification of the phenolic compounds were similar to the protocol described in [22].

2.4. Data Preprocessing and Multivariate Analysis

The origination of spectral noise, scattering effects, and difference in particle size by the spectrometer during spectral acquisition directly correlate with the model’s prediction performance. Therefore, it is necessary to apply spectral pretreatment methods to the acquired raw spectral data to enhance the quality of data. For this research, the raw data were pretreated using several preprocessing methods, including multiplicative scatter correction (MSC), standard normal variate (SNV), and Savitzky-Golay (SG) filtering. MSC and SNV are the most commonly used preprocessing methods to remove background, slope variation, and scattering effects from the spectral data [23]. Furthermore, Savitzky-Golay filters (first and second derivative) methods were used to eliminate the undesired effects, such as noise and baseline drift, from the obtained FT-IR spectroscopic data [24,25]. The pretreated spectra were analyzed using multivariate analysis methods, including partial least square regression (PLSR), principal component regression (PCR), and HLA/GO using MATLAB (Version 7, The Mathworks, Natick, MA, USA).

2.5. PLSR, PCR, and HLA/GO Model

The PLSR, PCR, and HLA/GO models were constructed to predict phenolic compounds in moringa powder samples. The PLSR model is one of the widely used methods for prediction analysis which derives the linear relationship between one of the dependent and independent variables by calculating the properties of the dependent variable. The general equations for the PLSR model are written in the following way:
X = TPT + E
Y = UQT + E
where the terms X and Y are defined as independent and dependent variables, T and U are score matrices, PT and QT are the loading matrices of X and Y, respectively, and E is the error matrix.
PCR is defined as a fusion of principal component analysis (PCA) and multivariate linear regression (MLR) and is commonly applied in multivariate analysis to get rid of highly correlated predicting variables. In the first step, PCA is performed, which reduces the number of variables by using the dimension reduction approach. In the second step, the optimum number of principal components obtained through PCA is used in the MLR model to perform PCR [26].
Furthermore, NAS and hybrid linear analysis (HLA) algorithms were also used to predict phenolic compounds in moringa powder. A detailed explanation of the HLA algorithm is presented in the original article [27]. NAS calculates the portion of the signal which is directly linked with the concentration of analyte under interest [28]. For this study, the NAS vector related to each sample was calculated based on the method explained by Goicoechea and Olivieri [27] and Marsili [29].

3. Results and Discussion

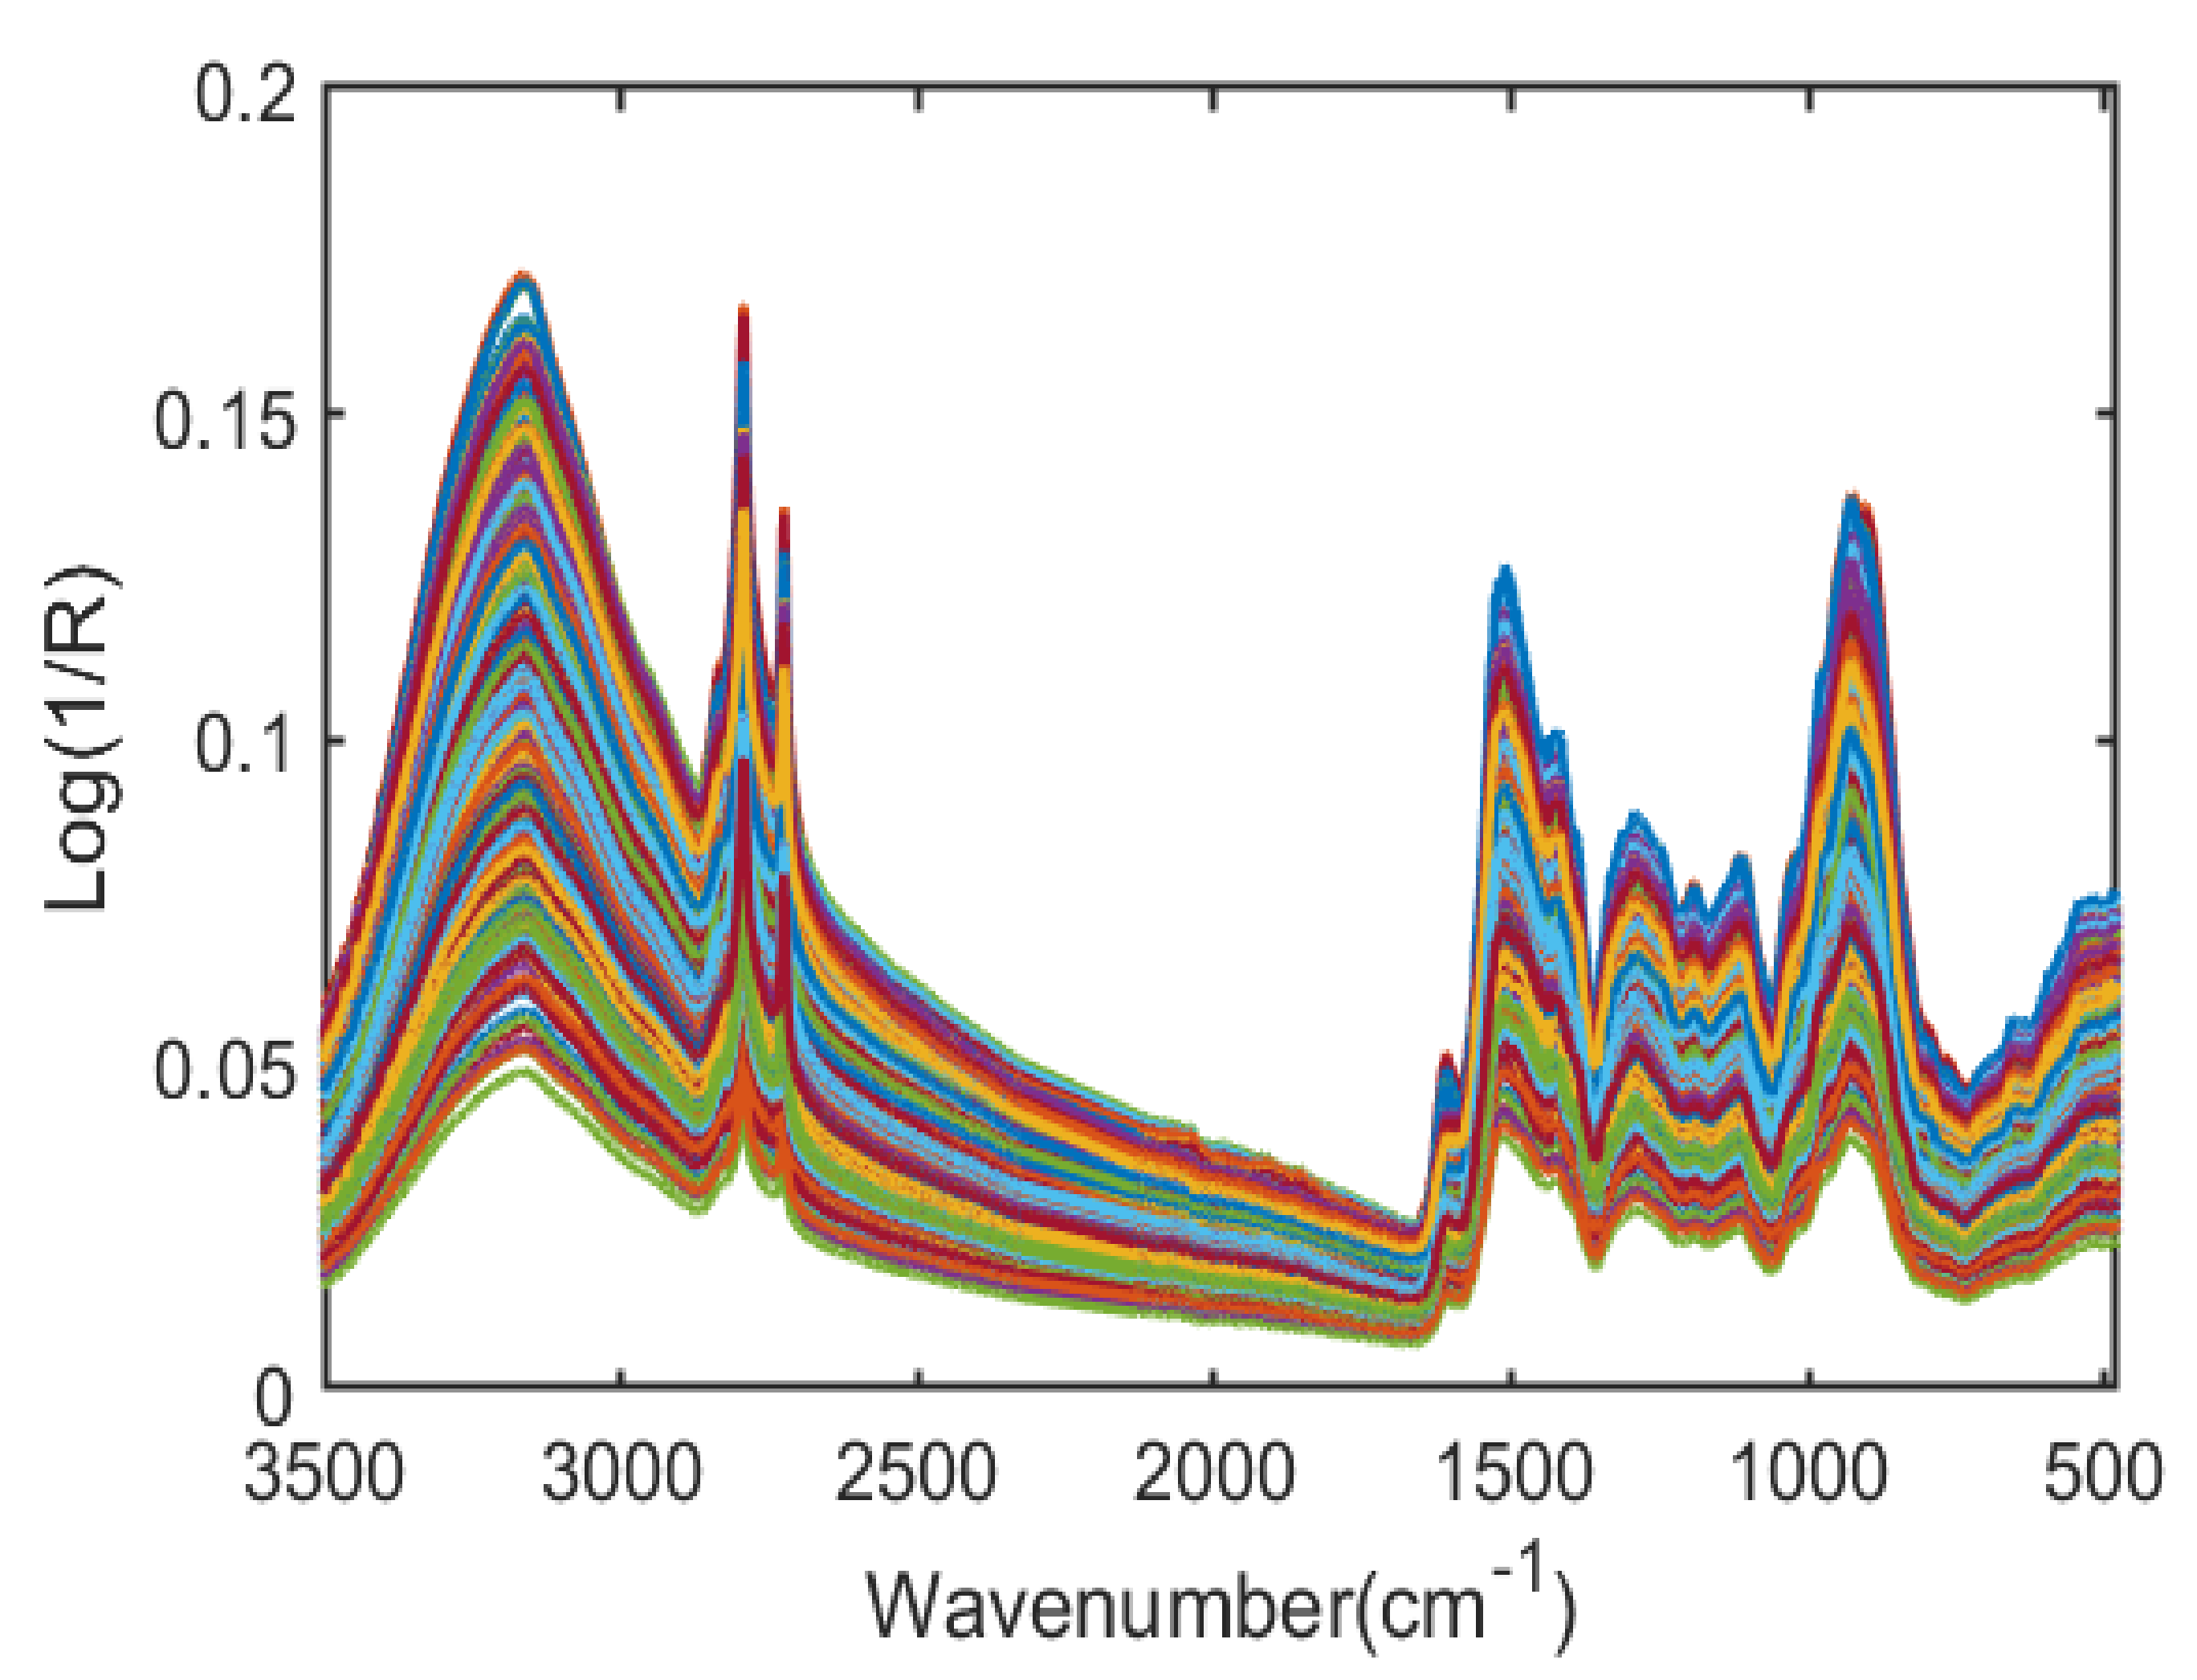
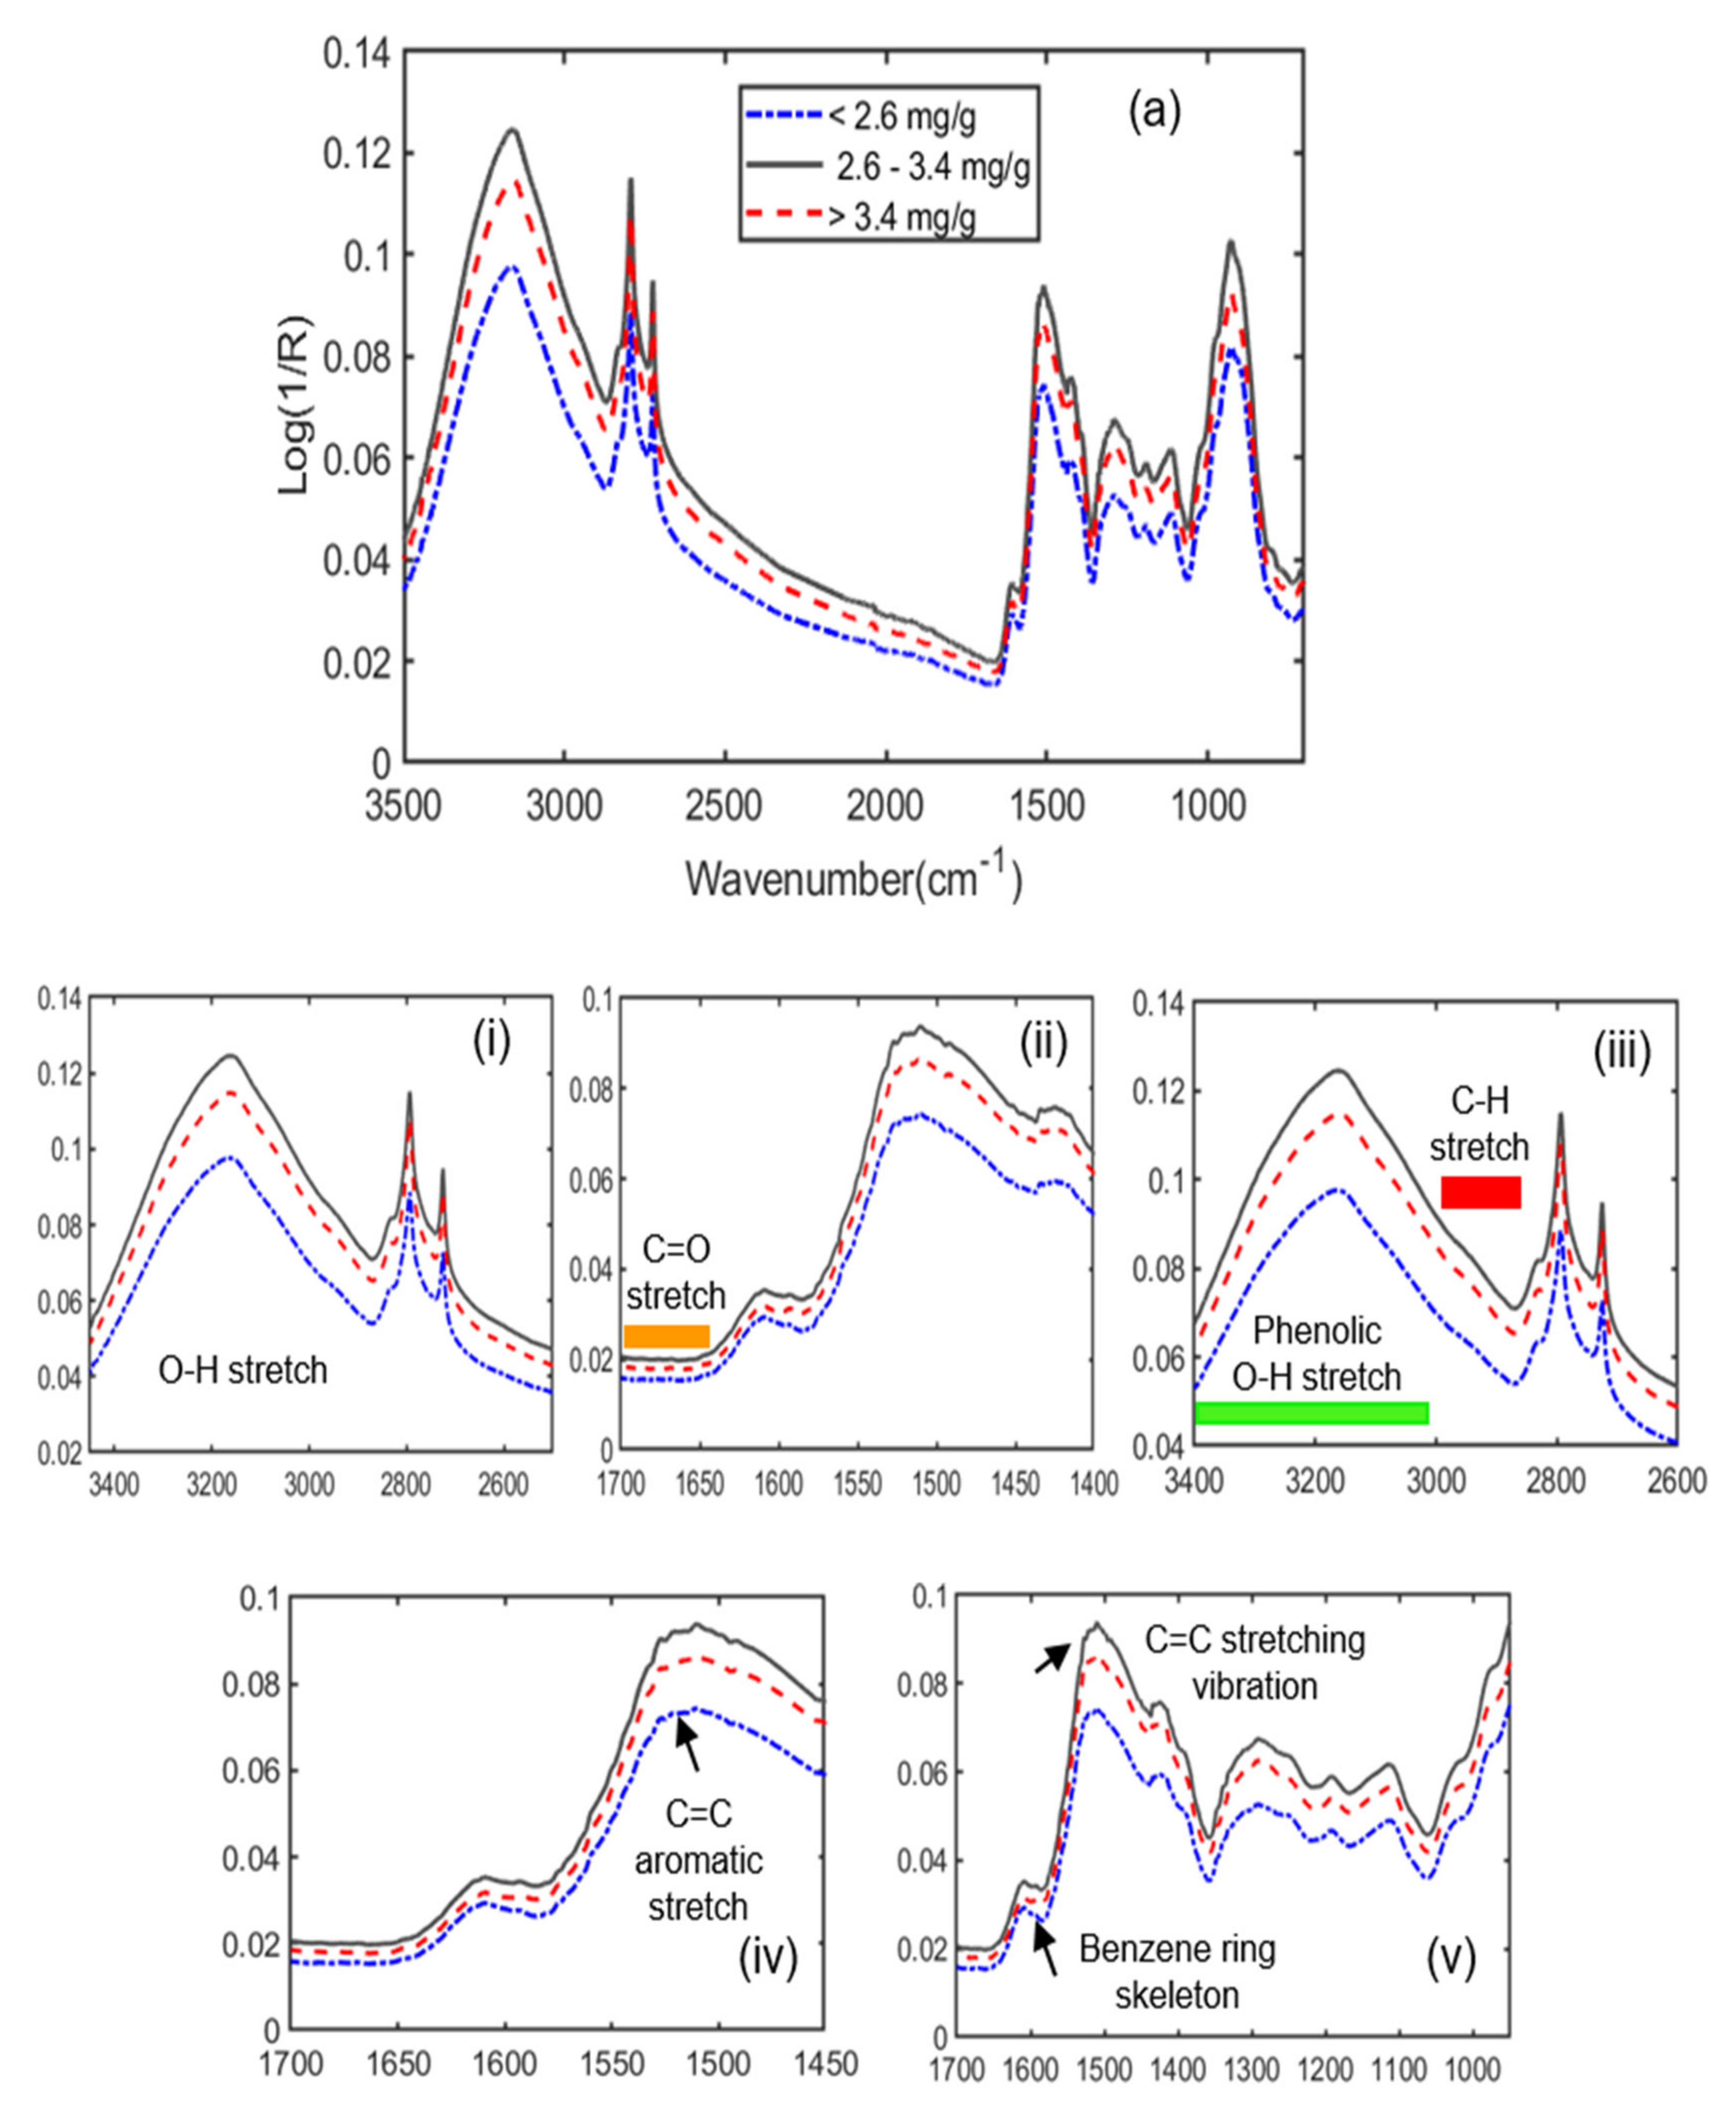
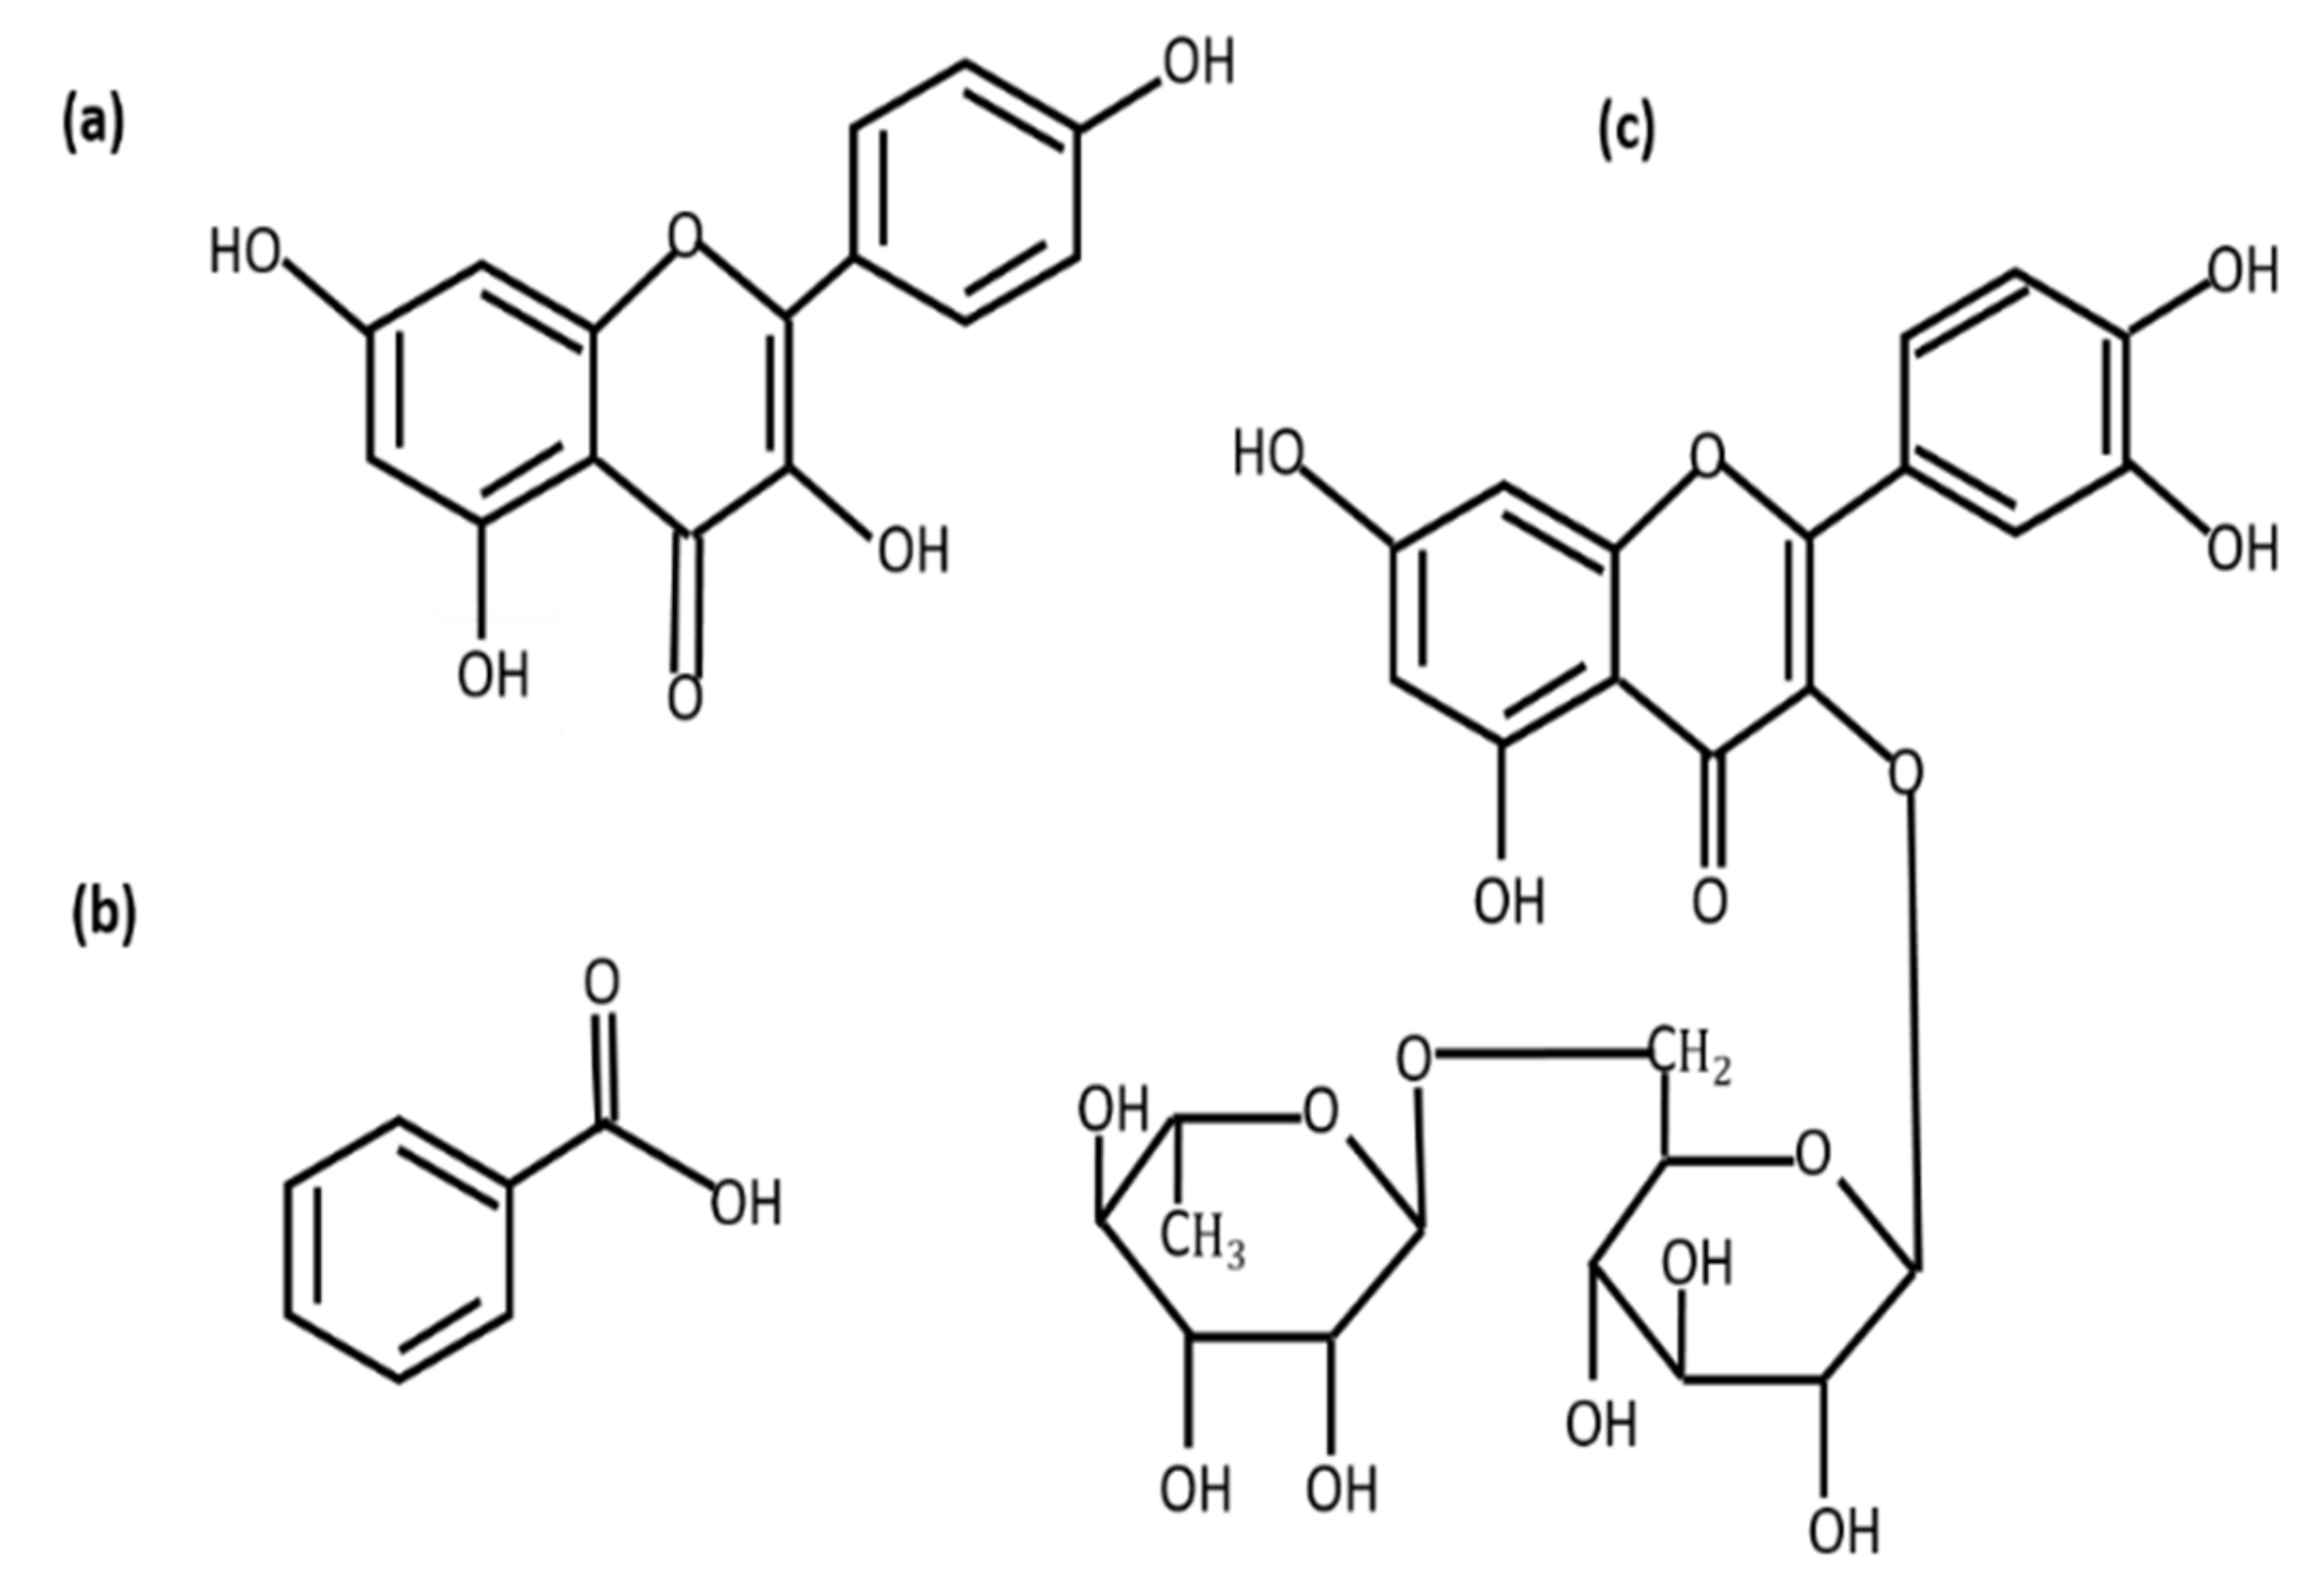
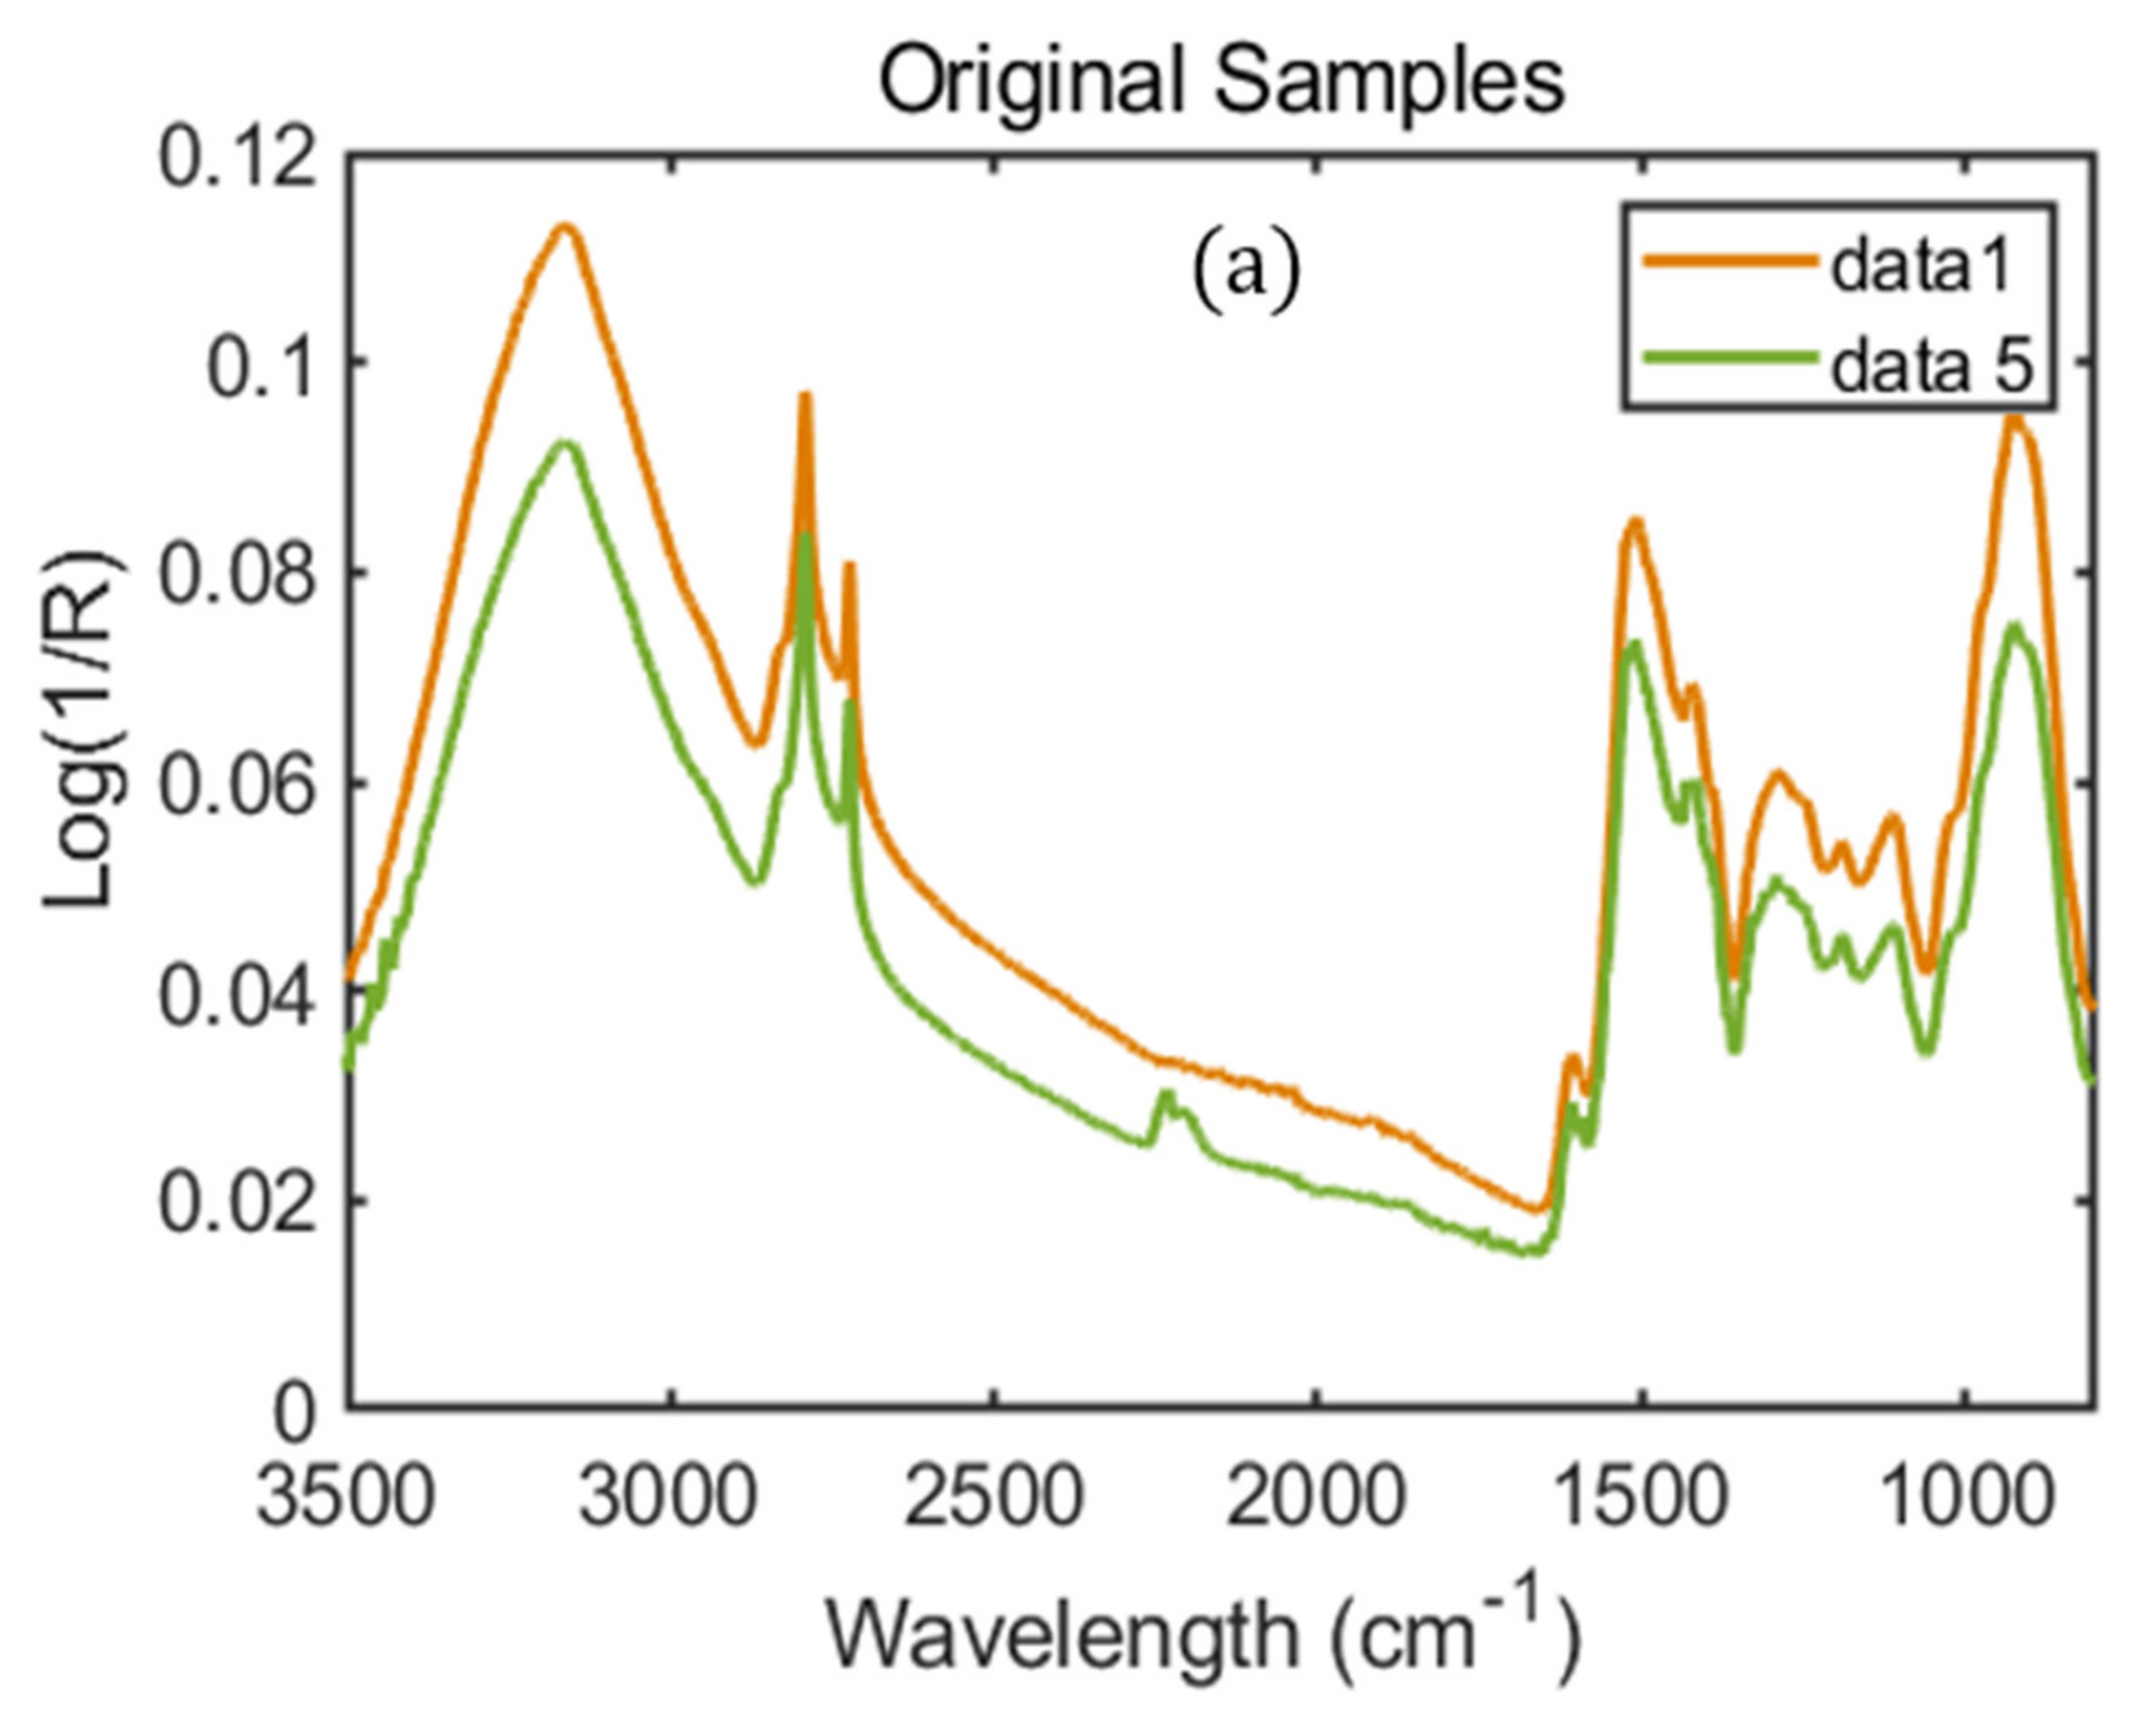
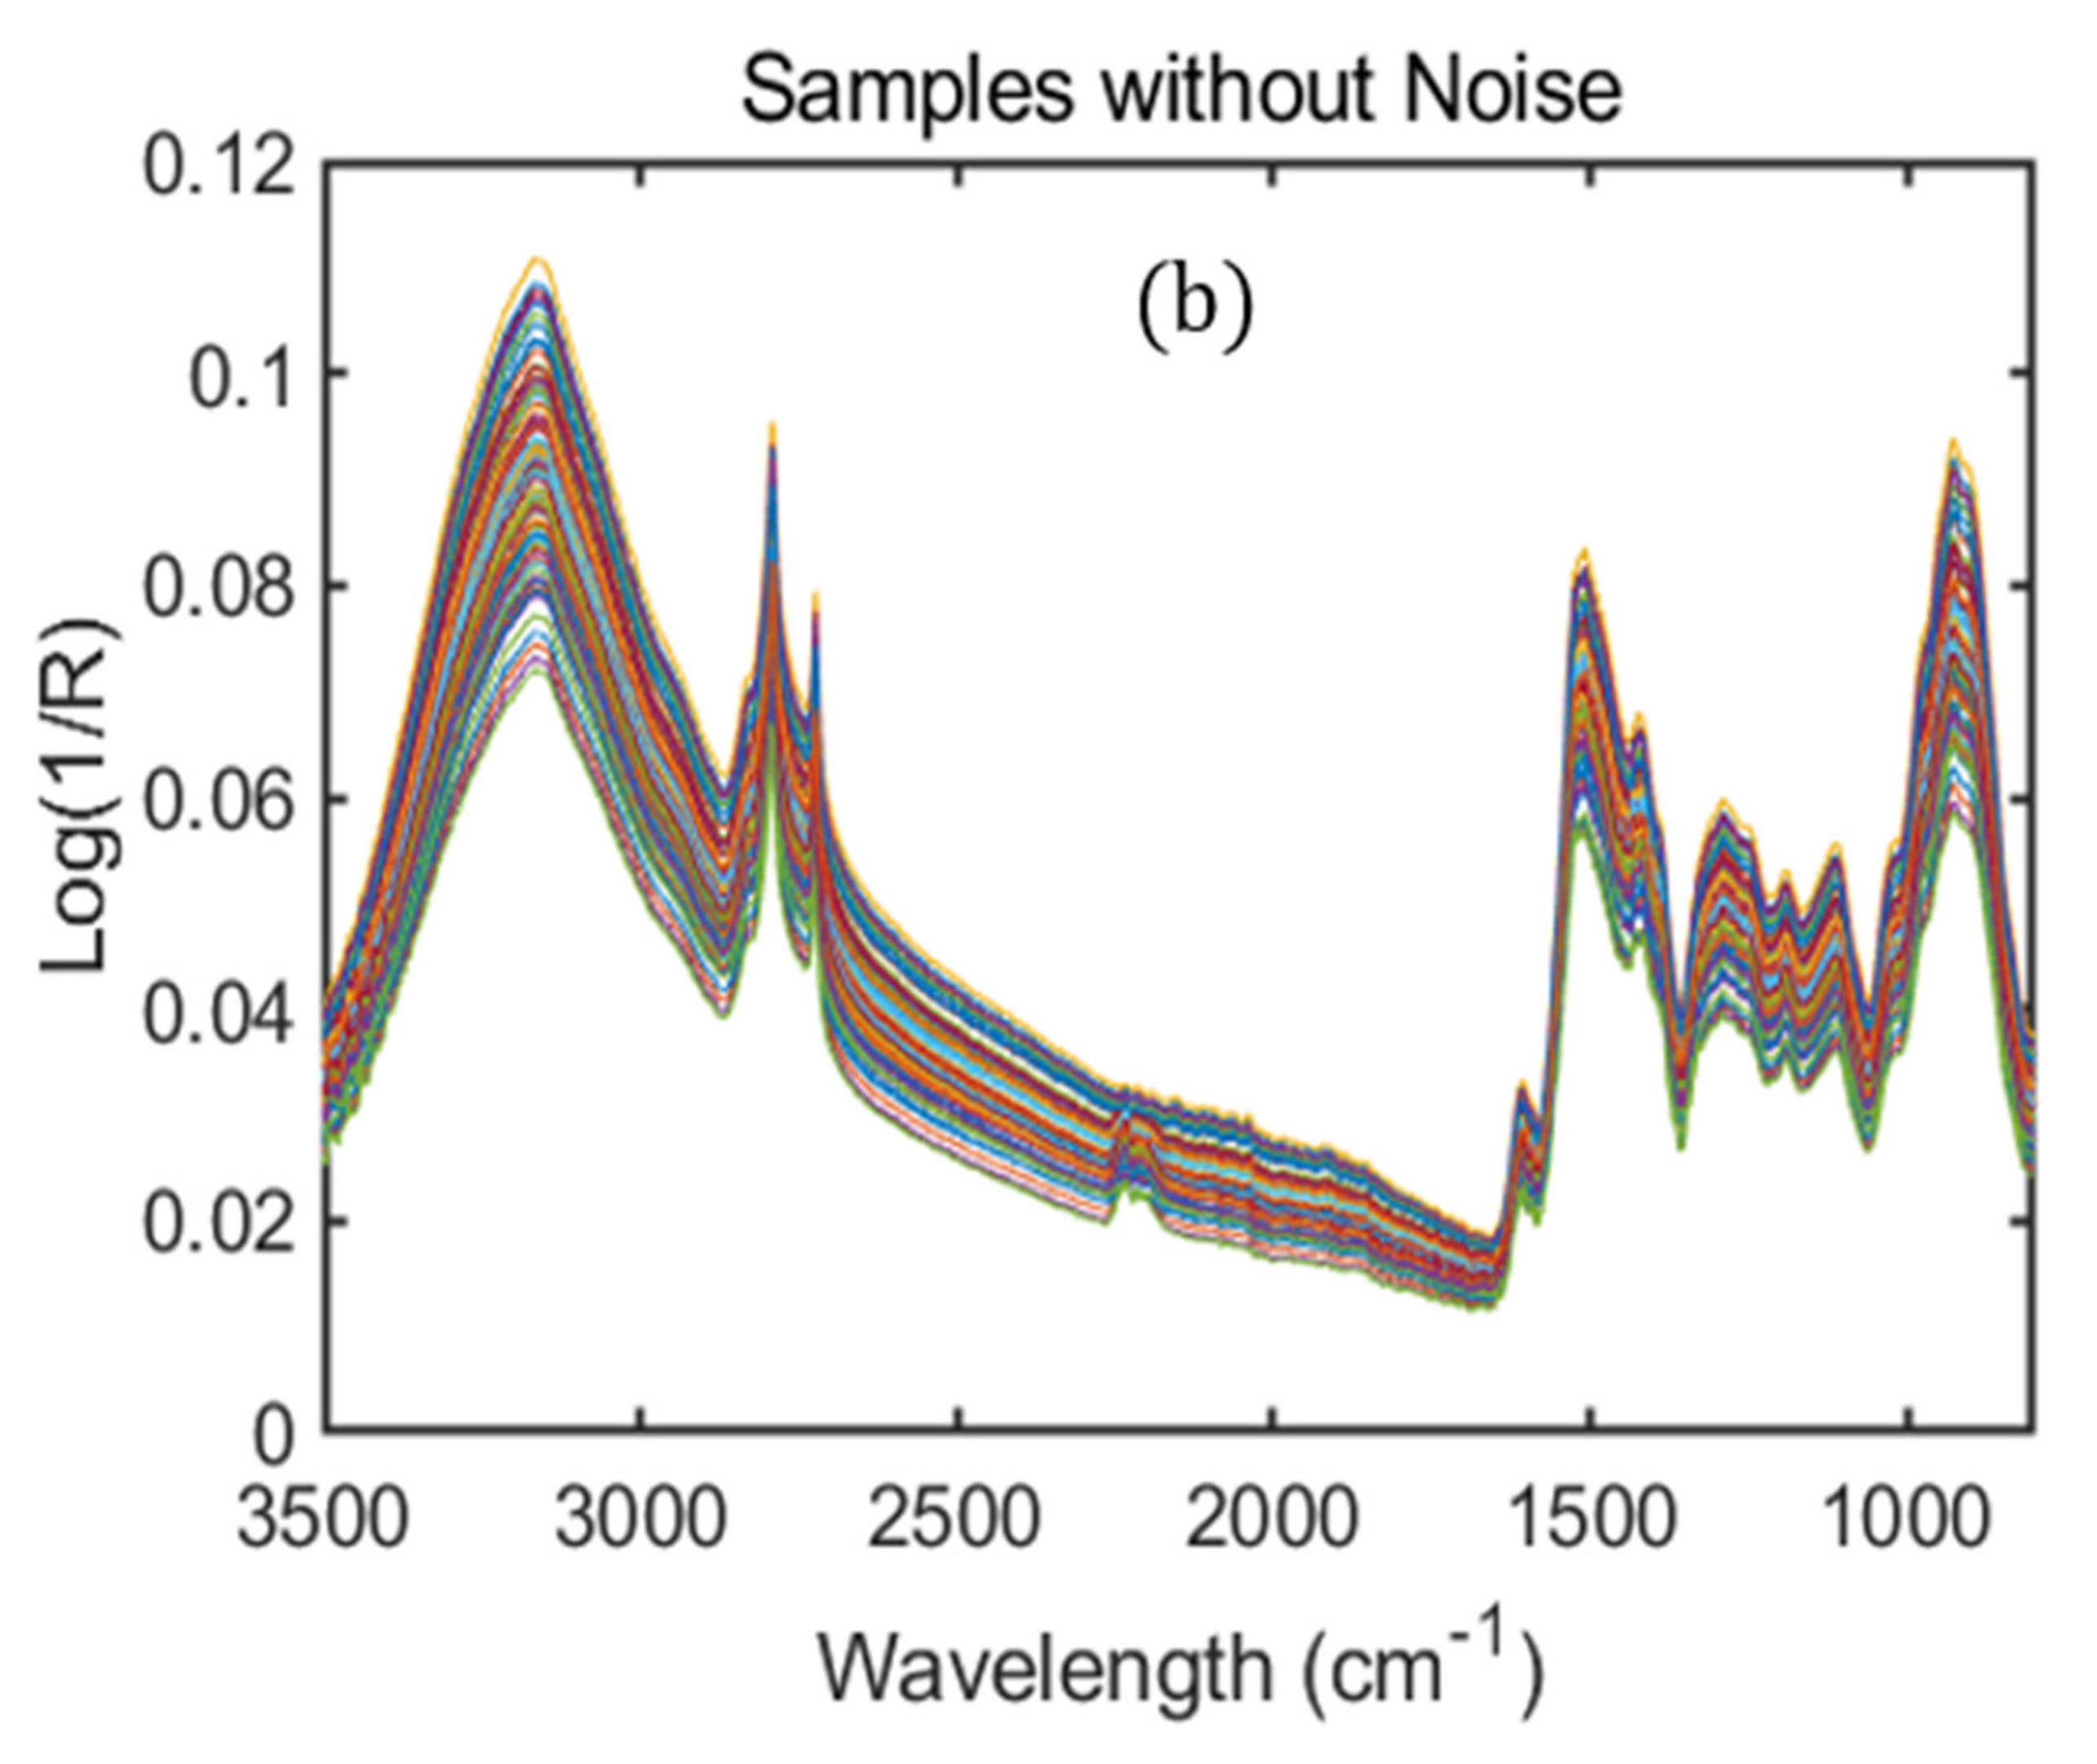
3.1. Spectral Interpretation

Figure 1 shows the raw spectra of moringa powder samples. The original FT-IR spectra consist of several overlapping peaks and noise generated by the instrument during spectral acquisition and, therefore, cannot provide meaningful information, which is sensitive to the phenolic compounds present in the measured samples. Thus, spectral preprocessing played a valuable role in enhancing the spectral quality and, therefore, provides more informative peaks related to critical chemical compounds present in the scanned samples. In this study, after applying standard normal variate (SNV) preprocessing, the high-quality spectral peaks were observed to eliminate unwanted noise and overlapping peaks.
Figure 2a represents SNV preprocessed spectra of moringa powder samples under 14 different concentrations. All the 14 different concentrations of moringa samples were divided into three categories, which were <2.6 mg/g, 2.6–3.4 mg/g, and >3.4 mg/g, respectively. The FTIR spectral range is divided into two important spectral regions: functional group and fingerprint region. The functional group regions usually run from 4000–1450 cm−1, while the fingerprint group region ranges from 1450–500 cm−1. Both these regions display important spectral properties that are crucial during the identification of unknown compounds. Since the functional group region is typically associated with stretching vibrations of functional groups present in compounds and, therefore, consists of relatively few peaks. On the other hand, the fingerprint region is considered most important because each different compound produces its own unique peak pattern and is associated with more peaks. Due to the lack of information after 3500 cm−1 and below 800 cm−1 wavelength range, the spectra were plotted between 3500–800 cm−1, respectively. The peaks observed around 3500–2500 cm−1 and 1700–1600 cm−1 were related to the presence of O-H (hydroxyl) and C=O (carbonyl) stretching (i and ii) vibrational bands. All the 14 different concentrations, which were subdivided into three concentrations ranges, were clearly separated from each other within this range shown in Figure 2i,ii and were obtained within a similar range for all the three phenolic compounds identified through HPLC analysis; their corresponding chemical structures are presented in Figure 3.
Due to the presence of a phenolic ring (C6H5O-H) in kaempferol, some change in spectral lines’ intensity was observed around 3427 and 3317 cm−1, which is generated due to the presence of phenolic O-H stretching vibrations. Additionally, the spectral signature located around 2954 and 2850 cm−1 were both caused by C-H stretching. Both the vibrations observed above are associated with kaempferol [30], one of the phenolic compounds identified in our samples. Furthermore, the following statement was wholly supported by Sharma’s previous reports [31], who identified similar spectral regions done for kaempferol in Pedalium murex using FT-IR spectroscopy. Additionally, Sedef [32] observed identical spectral signatures for kaempferol, which were described in this study in chitosan samples using FT-IR spectroscopy. Furthermore, the spectral peaks acquired for benzoic acid and rutin are located at 1505 cm−1 (C=C aromatic stretching), 1600 cm−1 (benzene ring skeleton), and 1505 cm−1 (C=C stretching), respectively [33,34]. All the corresponding vibrations were marked with an arrow in the extended spectral regions from iii, iv, and v, as shown in Figure 2 and further explained in Table 2.

3.2. HPLC Reference Analysis

The reference values obtained through HPLC analysis for phenolic compounds in moringa powder are explained in Table 3. There are three major phenolic compounds identified in five varieties of moringa powder samples. Rutin was the most abundant compared to the other two types of phenolic compounds detected and presented in a higher range of concentration. After rutin, other phenolic compounds, i.e., kaempferol and benzoic acid, were presented in the appropriate concentration range in the moringa samples. Thus, the prediction model for individual phenolics was carried out using these three compounds.

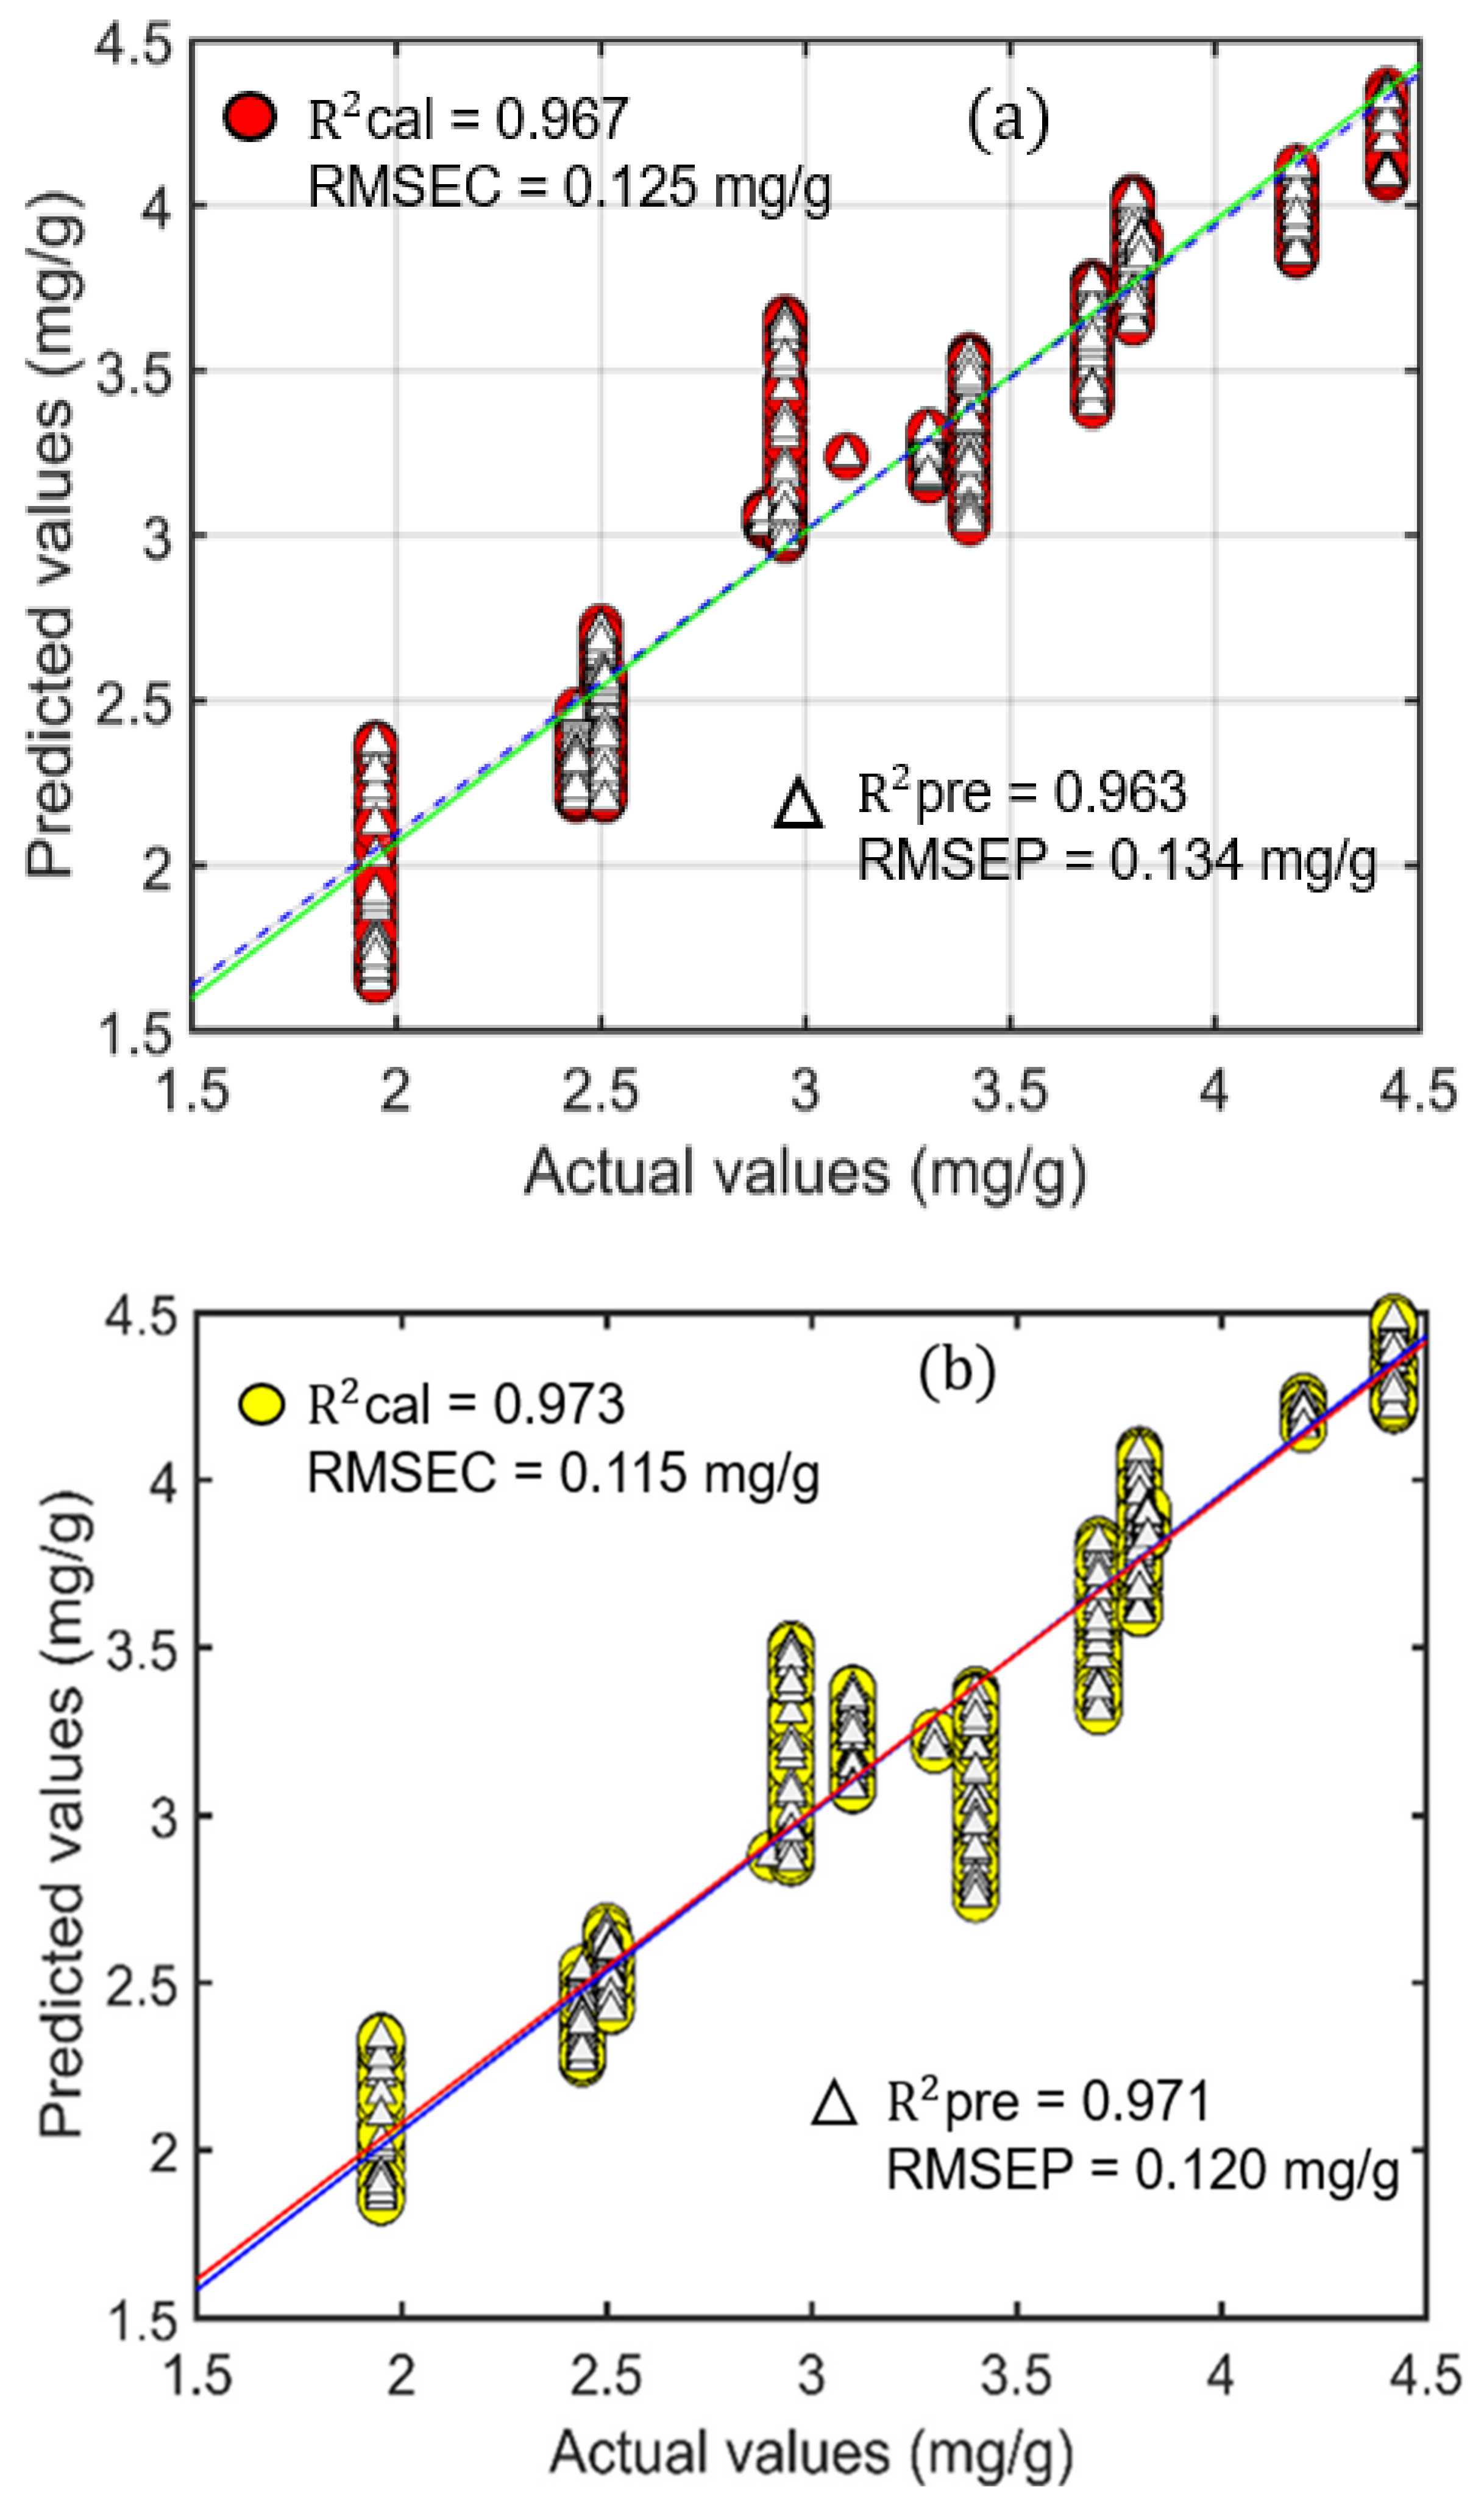
3.3. PLSR, PCR, and HLA/GO Model for Phenolics Compounds Prediction

As the raw spectral data are not suitable for direct analysis, different preprocessing steps were implemented prior to the analysis for the prediction of three different phenolics compounds in moringa powder. Therefore, the evaluation of model performance is done by constructing calibration and prediction datasets. Since the number of samples experimentally measured through FT-IR spectrometer was only 140 for 14 different concentrations, which are comparatively less and could result in under fitting problems during the construction of the multivariate analysis model. Thus, 1400 mixed samples were generated artificially using Dirichlet distribution to solve this issue. The detailed description of the algorithm and methodology of Dirichlet distribution is explained in the following article [35]. Figure 4a,b shows the general concept of Dirichlet distribution after utilizing this algorithm in our study.
After 1400 artificially mixed samples were prepared, a multivariate analysis model named PLSR was developed. A total of 840 samples were used for calibration set samples, while the remaining 560 samples were used for the prediction dataset, presented in Table 4.
Statistical parameters, such as the coefficient of determination (R2) and root mean square error (RMSE), were used as a tool for model performance calculation. During the construction of the PLSR model, different preprocessing steps were employed. Compared to other preprocessing methods, SNV performed better and afforded a higher correlation value (R2) of 0.996 with a minimum error (RMSEC) value of 0.038 mg/g for the calibration dataset. In contrast, the R2 and RMSEP values for the prediction sets were 0.997 and 0.035 mg/g data. Figure 5a,b shows the actual and predicted values for the moringa powder samples, indicating a good agreement between actual and predicted concentrations.
In order to compare the prediction performance of PLSR model, two different regression methods, named PCR and NAS-based HLA/GO models, were further developed for phenolic compounds prediction. During both model construction, the same number of samples were selected, i.e., 1400, in which 840 samples were chosen for calibration set and 560 samples were selected for the prediction dataset. Figure 6a,b shows the relationship between actual and predicted concentration for the phenolic compounds in moringa powder for the calibration and prediction sets. In the FT-IR region, the PCR model predicted correlation coefficients ( R p 2 ) values of 0.963 with an RMSEP value of 0.134 mg/g respectively, using maximum normalization preprocessing. Similarly, the HLA/GO model also predicted a correlation coefficient ( R p 2 ) value of 0.971 with an RMSEP value of 0.120 mg/g using mean normalization preprocessing. The comparative performance of PLSR, PCR, and HLA/GO models were summarized in Table 5. Table 5 clearly demonstrates that the correlation coefficient ( R p 2 ) and RMSEP values acquired through PCR and HLA/GO models performed comparatively lower than the developed PLSR model. Thus, it can be suggested that the PLSR model has a strong potential to perform the prediction analysis of moringa powder samples.

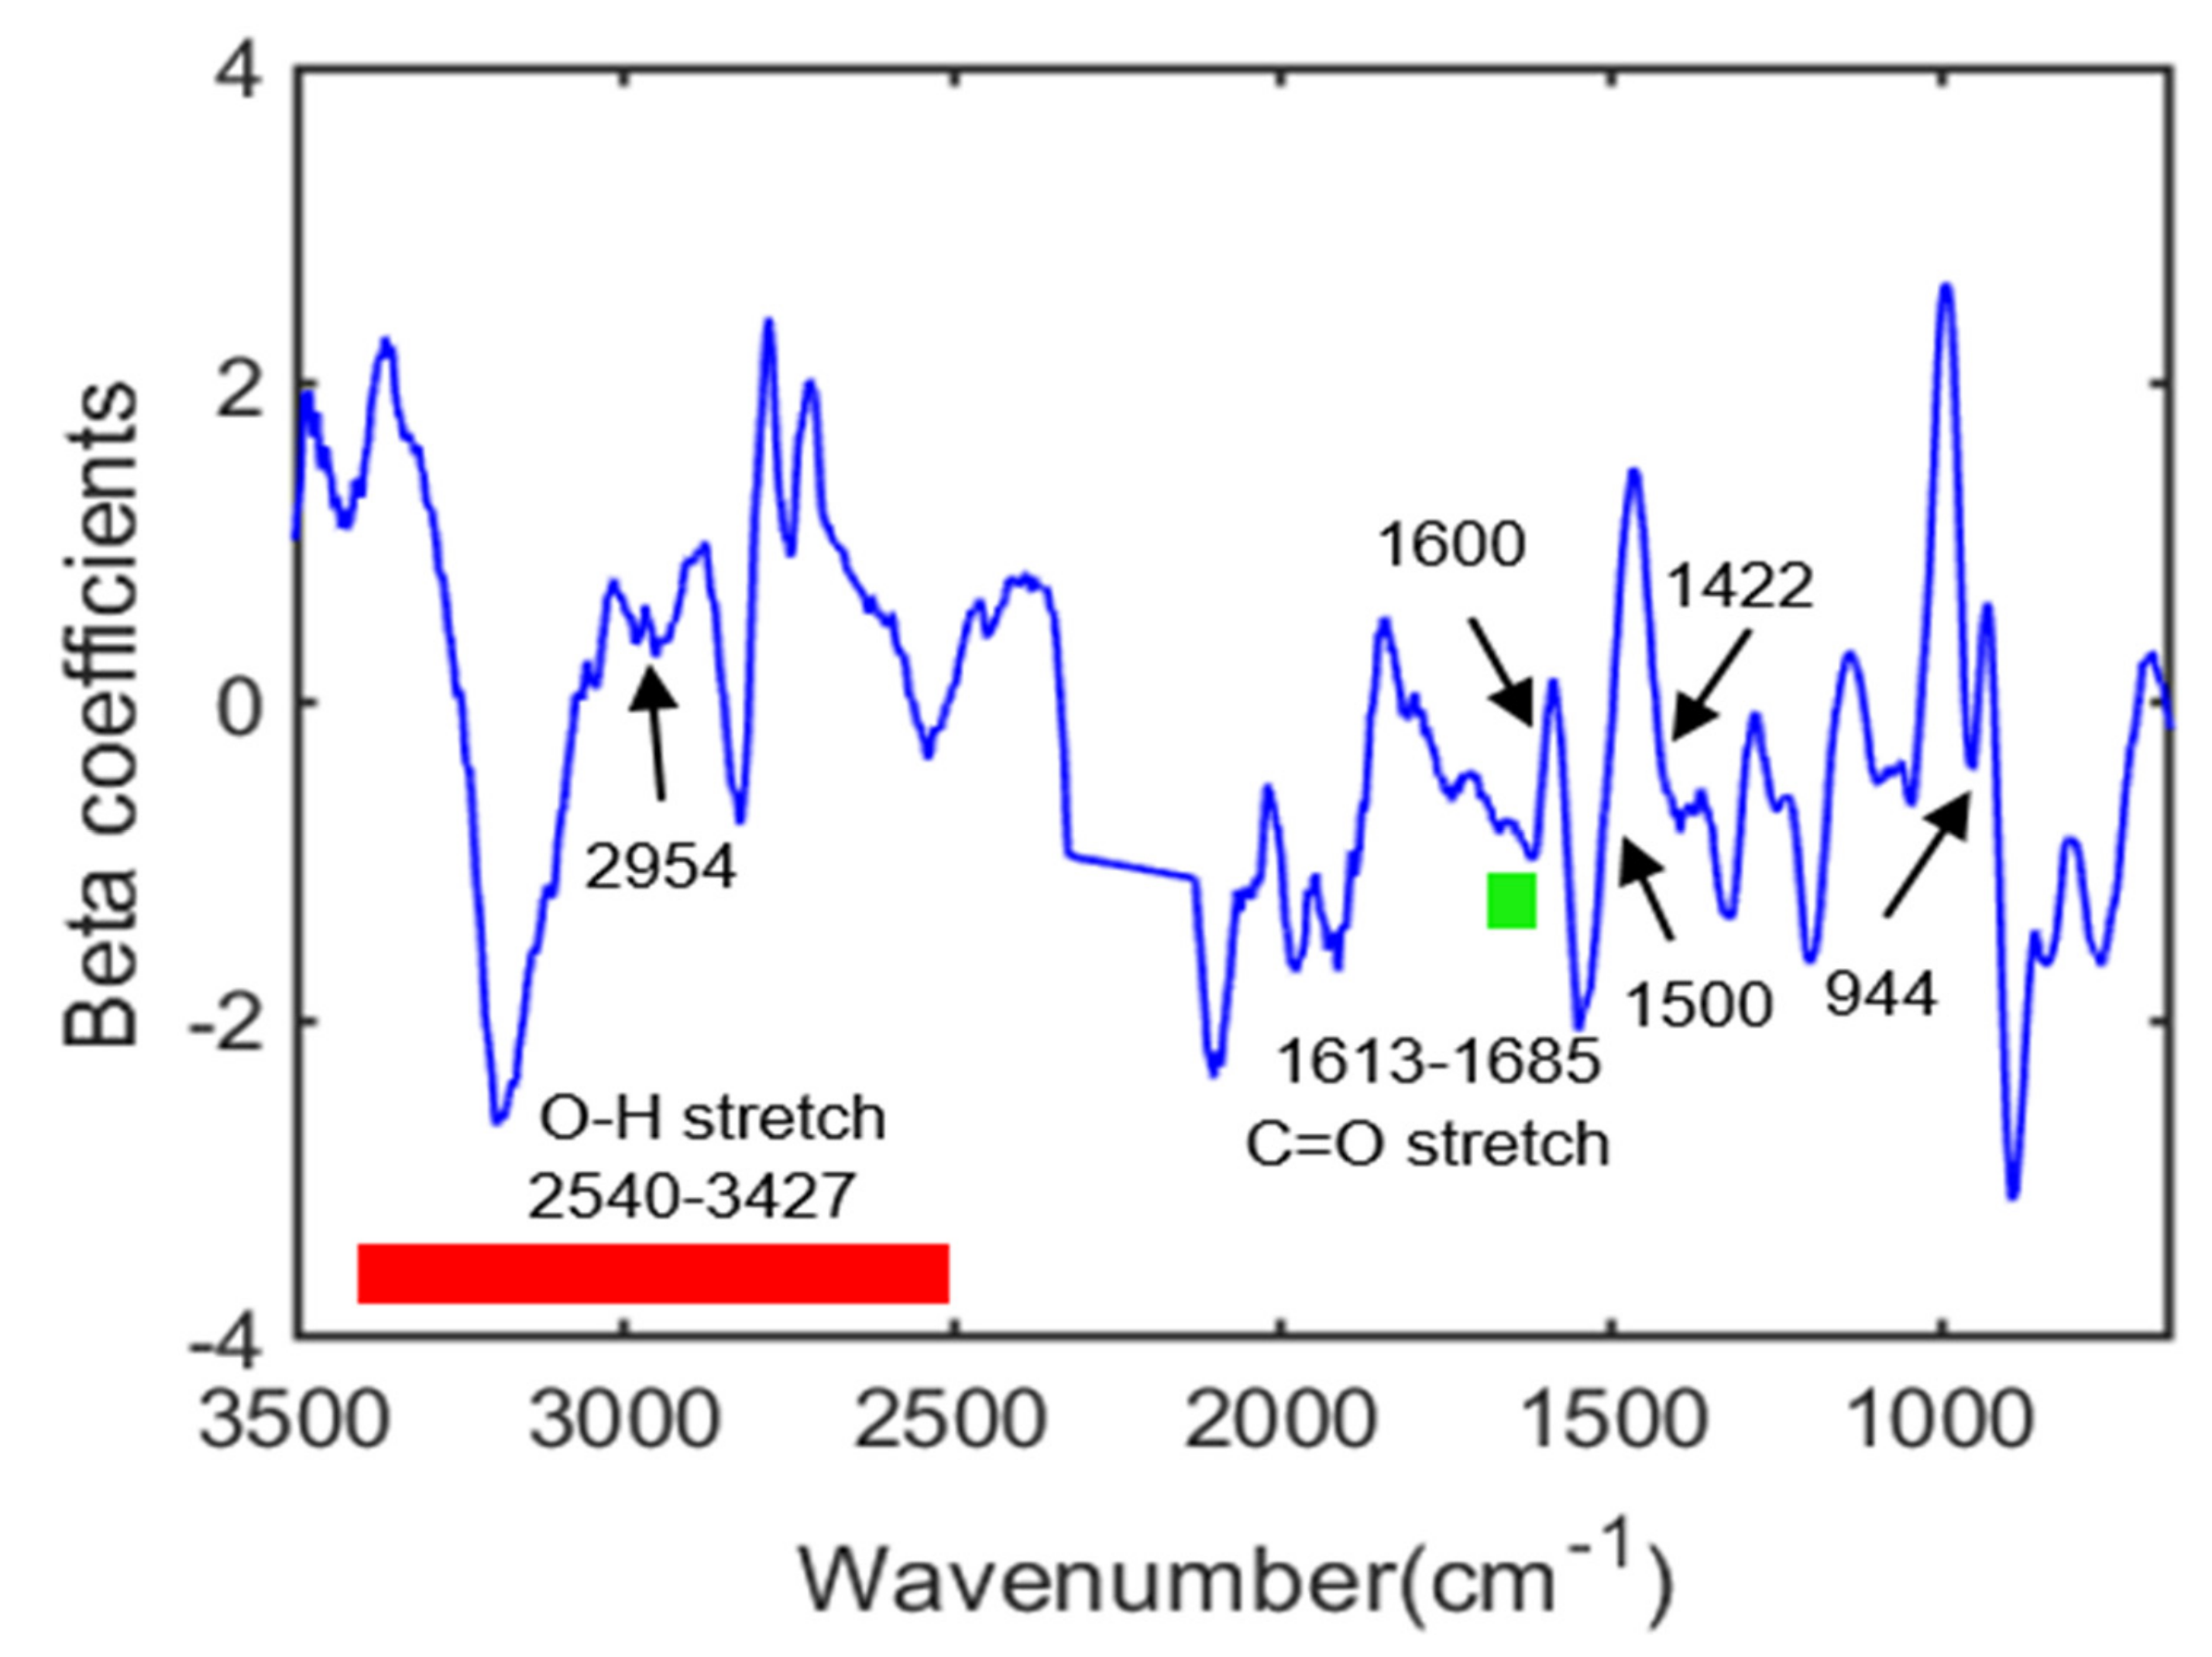
3.4. Beta Coefficients for the Developed PLSR Model

The beta coefficient shown in Figure 7 was plotted to support the developed PLSR model. The beta-coefficient plot in Figure 7 exhibits the significant spectral differences between various groups of samples. In the multivariate analysis method, this plot plays an important role in the localization of wavenumbers, which have a direct relationship with the various chemical features of compounds. The spectral region obtained from 2540–3427 cm−1 and 1613–1685 cm−1 is due to the presence of O-H and C=O stretching vibrations of phenolic compounds. Furthermore, additional peaks were observed around 944, 2954, 1600, 1422, and 1505 cm−1, which were in a similar spectral region shown in (Figure 2a) and under extended spectral regions (I, ii, iii, iv, and v). These peaks highlighted the sensitive regions of three different phenolic compounds identified, and therefore, the beta-coefficient obtained from the PLSR method supports the prediction of phenolic compounds in moringa powder samples. The results obtained through the PLSR model, therefore, suggested that FT-IR spectroscopy, when combined with the PLS regression and SNV preprocessing method, could be a rapid and alternative analytical tool for the non-destructive measurement of phenolic compounds in moringa powder samples. Johnson [36] measured the antioxidant and phenolic contents in powdered plant matrices using FT-IR spectroscopy and acquired lower prediction accuracy of 0.96 using PLSR regression. Since the plants consists of several kinds of phenolic compounds, this study cannot provide sufficient information regarding the major phenolic compounds in the powder matrices measured. Furthermore, Zhang [37] utilized an application of the near-infrared reflectance spectroscopic technique for the evaluation of chemical components, including crude protein, crude fiber, and crude fat in moringa leaves. All these components are macro components and near infrared spectroscopic data are often affected by overtone and combination bands, which reduce its effectiveness in a real time scale. Additionally, Okechukwu [38] measured phytochemical constituents using FT-IR spectroscopy in moringa oleifera leaves by combining Gas Chromatography-Mass Spectrometry. Although this study utilized a more advanced reference analysis method using FT-IR spectroscopy and identified phenolic compounds, this study did not give a deeper explanation regarding the kinds of phenolic compounds identified and their total concentrations present in moringa powder. Apart from this, Makita [39] also evaluated the flavonoid content in moringa oleifera using UHPLC-qTOF-MS fingerprinting. Even though this research is highly precise for measuring the flavonoid content, they are often time consuming and destructive. The limitations of these papers have been solved in our study by providing more detailed information regarding the types and amount of phenolic compounds present in moringa powder samples with a higher correlation coefficient (R2) value of 0.99 for prediction and the lowest root mean square error values of 0.035 mg/g for prediction. Hence, the obtained results confirmed that when combined with suitable multivariate regression analysis methods, FT-IR spectroscopy could replace destructive chemical approaches such as HPLC and Mass spectrometry to perform the prediction analysis of the phenolic compounds in moringa powder samples.

3.5. Validation of the Presence of Phenolic Compounds in the Mixed Powder Samples Using HPLC

In order to assure the presence of phenolic compounds in the mixed moringa powder samples with 14 different concentrations, which were measured through FT-IR spectroscopy, HPLC was performed a second time to validate our study. During the extraction and analysis of phenolic compounds, the entire process was similar to the protocol explained in Section 2.3. The concentration values of phenolic compounds are explained below in Table 6.
Based on the accomplished second HPLC results, rutin content was highest in all the mixed variety concentrations, followed by benzoic acid and kaempferol, which show a similar trend with the first HPLC analysis. The second HPLC analysis, therefore, supports the presence of similar phenolic compounds, which were identified before though this study.

4. Conclusions

In this study, FT-IR spectroscopy was investigated for the non-destructive evaluation of three significant phenolic compounds, namely kaempferol, benzoic acid, and rutin, in moringa powder samples, measured in five different varieties of moringa powder, which was further validated with the HPLC method. The prediction analysis was performed using three different regression methods, i.e., the PLSR, PCR, and NAS-based HLA/GO method. FT-IR spectroscopy in combination with the PLSR model resulted in a higher correlation coefficient ( R p 2 ) value of 0.997 and a lower error (RMSEP) value of 0.035 mg/g using the SNV preprocessing method and resulted in a better performance than the PCR and HLA/GO model, which acquired correlation coefficient ( R p 2 ) values of 0.963 and 0.971 and error (RMSEP) values of 0.134 mg/g and 0.120 mg/g, respectively. To confirm the presence of phenolic compounds in the mixed moringa powder samples, HPLC treatment was performed a second time, which showed a similar trend, i.e., rutin is present in the highest concentration range among the other two phenolic compounds, similar to the results acquired with the first HPLC analysis results. Therefore, the results concluded that FT-IR spectroscopy combined with suitable regression analysis methods could be an alternative analytical tool for the rapid measurement of phenolic compounds in moringa powder and could replace destructive chemical methods. This research will be continued with different plant powder samples to check the validity of the constructed model to identify phytochemicals in real-time applications.

Author Contributions

R.J. performed the experiment; R.S. and S.U.P. performed the HPLC analysis, R.J., H.L., I.B. and M.S.K. analyzed the data; R.J. and B.-K.C. wrote the paper. All authors have read and agreed to the published version of the manuscript.

Funding

This research was funded by the National Institute of Crop Science (Project No. PJ0156892021) of the Rural Development Administration, Korea.

Institutional Review Board Statement

Not applicable.

Informed Consent Statement

Not applicable.

Data Availability Statement

All the necessary data were contained in the paper.

Conflicts of Interest

The authors declare no conflict of interest.

References

  1. Padayachee, B.; Baijnath, H. An overview of the medicinal importance of Moringaceae. J. Med. Plants Res. 2012, 6, 5831–5839. [Google Scholar]
  2. Fahey, J.W. Moringa oleifera: A Review of the Medical Evidence for Its Nutritional, Therapeutic, and Prophylactic Properties. Part 1. Trees Life J. 2005, 1, 1–15. [Google Scholar]
  3. Iqbal, S.; Bhanger, M.I. Effect of season and production location on antioxidant activity of Moringa oleifera leaves grown in Pakistan. J. Food Compos. Anal. 2006, 19, 544–551. [Google Scholar] [CrossRef]
  4. Adebayo, I.A.; Arsad, H.; Samian, M.R. Total phenolics, total flavonoids, antioxidant capacities, and volatile compounds gas chromatography-mass spectrometry profiling of Moringa oleifera ripe seed polar fractions. Pharmacogn. Mag. 2018, 14, 191–194. [Google Scholar] [CrossRef]
  5. Stohs, S.J.; Hartman, M.J. Review of the Safety and Efficacy ofMoringa oleifera. Phytother. Res. 2015, 29, 796–804. [Google Scholar] [CrossRef]
  6. Saini, R.K.; Sivanesan, I.; Keum, Y.-S. Phytochemicals of Moringa oleifera: A review of their nutritional, therapeutic and industrial significance. 3 Biotech 2016, 6, 1–14. [Google Scholar] [CrossRef] [Green Version]
  7. Mbikay, M. Therapeutic Potential of Moringa oleifera Leaves in Chronic Hyperglycemia and Dyslipidemia: A Review. Front. Pharmacol. 2012, 3, 24. [Google Scholar] [CrossRef] [Green Version]
  8. Leone, A.; Spada, A.; Battezzati, A.; Schiraldi, A.; Aristil, J.; Bertoli, S. Cultivation, Genetic, Ethnopharmacology, Phytochemistry and Pharmacology of Moringa oleifera Leaves: An Overview. Int. J. Mol. Sci. 2015, 16, 12791–12835. [Google Scholar] [CrossRef]
  9. Aberoumand, A.; Deokule, S.S. Comparison of Phenolic Compounds of Some Edible Plants of Iran and India. Pak. J. Nutr. 2008, 7, 582–585. [Google Scholar] [CrossRef] [Green Version]
  10. Khoddami, A.; Wilkes, M.A.; Roberts, T.H. Techniques for Analysis of Plant Phenolic Compounds. Molecules 2013, 18, 2328–2375. [Google Scholar] [CrossRef]
  11. Cheynier, V. Phenolic compounds: From plants to foods. Phytochem. Rev. 2012, 11, 153–177. [Google Scholar] [CrossRef]
  12. Nowak, D.; Gośliński, M.; Wojtowicz, E.; Przygoński, K. Antioxidant Properties and Phenolic Compounds of Vitamin C-Rich Juices. J. Food Sci. 2018, 83, 2237–2246. [Google Scholar] [CrossRef]
  13. Maldini, M.; Maksoud, S.A.; Natella, F.; Montoro, P.; Petretto, G.L.; Foddai, M.; De Nicola, G.R.; Chessa, M.; Pintore, G. Moringa oleifera: Study of phenolics and glucosinolates by mass spectrometry. J. Mass Spectrom. 2014, 49, 900–910. [Google Scholar] [CrossRef]
  14. Seal, T. Quantitative HPLC analysis of phenolic acids, flavonoids and ascorbic acid in four different solvent extracts of two wild edible leaves, Sonchus arvensis and Oenanthe linearis of North-Eastern region in India. J. Appl. Pharm. Sci. 2016, 6, 157–166. [Google Scholar] [CrossRef] [Green Version]
  15. Clark, I.T. Gas Chromatographic Analysis of Phenols from Lignin. J. Chromatogr. Sci. 1968, 6, 53–55. [Google Scholar] [CrossRef]
  16. Joshi, R.; Joshi, R.; Mo, C.; Faqeerzada, M.A.; Amanah, H.Z.; Masithoh, R.E.; Kim, M.S.; Cho, B.-K. Raman Spectral Analysis for Quality Determination of Grignard Reagent. Appl. Sci. 2020, 10, 3545. [Google Scholar] [CrossRef]
  17. Amanah, H.Z.; Joshi, R.; Masithoh, R.E.; Choung, M.-G.; Kim, K.-H.; Kim, G.; Cho, B.-K. Nondestructive measurement of anthocyanin in intact soybean seed using Fourier Transform Near-Infrared (FT-NIR) and Fourier Transform Infrared (FT-IR) spectroscopy. Infrared Phys. Technol. 2020, 111, 103477. [Google Scholar] [CrossRef]
  18. Joshi, R.; Cho, B.-K.; Lohumi, S.; Joshi, R.; Lee, J.; Lee, H.; Mo, C. Evaluation of benzene residue in edible oils using Fourier transform infrared (FTIR) spectroscopy. Korean J. Agric. Sci. 2019, 46, 257–271. [Google Scholar]
  19. Access, O. Quantitative analysis of glycerol concentration in red wine using Fourier transform infrared spectroscopy and chemometrics analysis. Korean J. Agric. Sci. 2021, 48, 299–310. [Google Scholar]
  20. Rébufa, C.; Pany, I.; Dupuy, N.; Bombarda, I. Infrared spectroscopy for the characterization and quality control of Moringa oleifera: A multivariate approach. Acta Hortic. 2017, 1158, 397–404. [Google Scholar] [CrossRef] [Green Version]
  21. Araújo, C.S.T.; Melo, E.I.; Alves, V.N.; Coelho, N.M.M. Moringa oleifera Lam. seeds as a natural solid adsorbent for removal of AgI in aqueous solutions. J. Braz. Chem. Soc. 2010, 21, 1727–1732. [Google Scholar] [CrossRef]
  22. Yeo, H.J.; Baek, S.-A.; Sathasivam, R.; Kim, J.K.; Park, S.U. Metabolomic analysis reveals the interaction of primary and secondary metabolism in white, pale green, and green pak choi (Brassica rapa subsp. chinensis). Appl. Biol. Chem. 2021, 64, 1–16. [Google Scholar] [CrossRef]
  23. Storme-Paris, I.; Clarot, I.; Esposito, S.; Chaumeil, J.C.; Nicolas, A.; Brion, F.; Rieutord, A.; Chaminade, P. Near InfraRed Spectroscopy homogeneity evaluation of complex powder blends in a small-scale pharmaceutical preformulation process, a real-life application. Eur. J. Pharm. Biopharm. 2009, 72, 189–198. [Google Scholar] [CrossRef]
  24. Kandpal, L.M.; Lee, H.; Kim, M.S.; Mo, C.; Cho, B.-K. Hyperspectral Reflectance Imaging Technique for Visualization of Moisture Distribution in Cooked Chicken Breast. Sensors 2013, 13, 13289–13300. [Google Scholar] [CrossRef] [PubMed] [Green Version]
  25. Joshi, R.; Lohumi, S.; Joshi, R.; Kim, M.S.; Qin, J.; Baek, I.; Cho, B.-K. Raman spectral analysis for non-invasive detection of external and internal parameters of fake eggs. Sens. Actuators B Chem. 2020, 303, 127243. [Google Scholar] [CrossRef]
  26. Shin, J.K.; Moon, S.H. Numerical Investigations in Choosing the Number of Principal Components in Principal Component Regression—CASE I.pdf. J. Stat. Theory Methods 1997, 8, 127–134. [Google Scholar]
  27. Goicoechea, H.C.; Olivieri, A.C. Wavelength selection by net analyte signals calculated with multivariate factor-based hybrid linear analysis (HLA). A theoretical and experimental comparison with partial least-squares (PLS). Analyst 1999, 124, 725–731. [Google Scholar] [CrossRef]
  28. Lorber, A. Error propagation and figures of merit for quantification by solving matrix equations. Anal. Chem. 1986, 58, 1167–1172. [Google Scholar] [CrossRef]
  29. Marsili, N.R.; Sobrero, M.S.; Goicoechea, H.C. Spectrophotometric determination of sorbic and benzoic acids in fruit juices by a net analyte signal-based method with selection of the wavelength range to avoid non-modelled interferences. Anal. Bioanal. Chem. 2003, 376, 126–133. [Google Scholar] [CrossRef]
  30. Telang, D.R.; Patil, A.T.; Pethe, A.M.; Tatode, A.A.; Anand, S.; Dave, V.S. Kaempferol-phospholipid complex: Formulation, and evaluation of improved solubility, in vivo bioavailability, and antioxidant potential of kaempferol. J. Excip. Food Chem. 2016, 7, 89–116. [Google Scholar]
  31. Priyanka, S.; Renu, S. Isolation and characterization of quercetin and kaempferol in vivo and in vitro from Pedalium murex. Int. Res. J. Pharm. 2012, 3, 184–187. [Google Scholar]
  32. Ilk, S.; Saglam, N.; Özgen, M. Kaempferol loaded lecithin/chitosan nanoparticles: Preparation, characterization, and their potential applications as a sustainable antifungal agent. Artif. Cells Nanomed. Biotechnol. 2017, 45, 907–916. [Google Scholar] [CrossRef] [Green Version]
  33. A Rodríguez-Rodríguez, W.; Colón, J.; Guzmán, R.; Rivera, H.; Santiago, M. Synthesis, characterization and electrochemical characterization of lead selenide sub-micron particles capped with a benzoate ligand and prepared at different temperatures. Mater. Res. Express 2014, 1, 035906. [Google Scholar] [CrossRef]
  34. Samsonowicz, M.; Kamińska, I.; Kalinowska, M.; Lewandowski, W. Alkali metal salts of rutin—Synthesis, spectroscopic (FT-IR, FT-Raman, UV-VIS), antioxidant and antimicrobial studies. Spectrochim. Acta Part A Mol. Biomol. Spectrosc. 2015, 151, 926–938. [Google Scholar] [CrossRef]
  35. Wang, M.; Zhao, M.; Chen, J.; Rahardja, S. Nonlinear Unmixing of Hyperspectral Data via Deep Autoencoder Networks. IEEE Geosci. Remote. Sens. Lett. 2019, 16, 1467–1471. [Google Scholar] [CrossRef]
  36. Johnson, J.; Mani, J.; Ashwath, N.; Naiker, M. Potential for Fourier transform infrared (FTIR) spectroscopy toward predicting antioxidant and phenolic contents in powdered plant matrices. Spectrochim. Acta Part A Mol. Biomol. Spectrosc. 2020, 233, 118228. [Google Scholar] [CrossRef]
  37. Zhang, J.; Li, M.; Lin, M.; Yang, E.; Chen, X. A near-infrared reflectance spectroscopic method for the direct analysis of several fodder-related chemical components in drumstick (Moringa oleifera Lam.) leaves. Biosci. Biotechnol. Biochem. 2018, 82, 768–774. [Google Scholar] [CrossRef] [Green Version]
  38. Okechukwu, V.U.; Eze, S.O.; Omokpariola, D.O.; Okereke, J.C. Evaluation of phytochemical constituents of Methanol extract of Moringa oleifera Lam. whole leaf by Gas Chromatography-Mass Spectrometry and Fourier transform infrared spectroscopy analysis. World News Nat. Sci. 2021, 37, 18–30. [Google Scholar]
  39. Makita, C.; Chimuka, L.; Steenkamp, P.; Cukrowska, E.; Madala, E. Comparative analyses of flavonoid content in Moringa oleifera and Moringa ovalifolia with the aid of UHPLC-qTOF-MS fingerprinting. S. Afr. J. Bot. 2016, 105, 116–122. [Google Scholar] [CrossRef]
Figure 1. FT-IR raw spectra of moringa powder samples.
Agriculture 12 00010 g001
Figure 2. FT-IR SNV preprocessed spectra (a). (iv) are the extended spectral regions related to different phenolics compounds.
Agriculture 12 00010 g002
Figure 3. Chemical structures of (a) kaempferol, (b) benzoic acid, and (c) rutin.
Agriculture 12 00010 g003
Figure 4. FT-IR spectra developed between two replicates (1.95_1 and 1.95_5) for one variety of concentrations, i.e., 1.95 (a). A total of 100 mixed samples spectra of moringa powder for one concentration generated by the Dirichlet distribution (b).
Agriculture 12 00010 g004aAgriculture 12 00010 g004b
Figure 5. PLSR graphs of actual versus predicted concentration for the phenolic compounds in moringa powder for the calibration (a) and prediction (b) datasets. RMSEC and RMSEP represent the root mean square error of calibration and prediction.
Agriculture 12 00010 g005
Figure 6. PCR (a) and hybrid linear analysis (HLA/GO) (b) graphs of actual versus predicted concentration for the phenolic compounds in moringa powder for the calibration and prediction datasets (a). RMSEC and RMSEP represent the root mean square error of calibration and prediction.
Agriculture 12 00010 g006
Figure 7. Beta coefficient plot for PLSR model in predicting the total phenolic content in moringa powder samples.
Agriculture 12 00010 g007
Table 1. List of moringa powder samples belonging to different geographical locations.
Moringa
Varieties
Country of
Heritage
Manufacturing Company
Variety (1)IndiaMRM Nutrition, CA, USA
Variety (2)Zambia (Africa)Dongbang International, Gyeonggi-do, South Korea
Variety (3)IndiaGreen BIO Pam, Seoul, South Korea
Variety (4)South KoreaAgricultural corporation Purunsan, Seoul, South Korea
Variety (5)USAKuli Kuli Oakland, CA, USA
Table 2. Principal characteristics IR vibrations in the phenolics compounds.
Phenolic CompoundsAssignmentAbsorption Frequency, ν (cm−1)
KaempferolPhenolic O-H stretching3427 & 3317
C-H stretching2954 & 2850b
C=O stretching1613
Benzoic AcidO-H stretching3427 & 3317
C=O aromatic stretching1500
C=O stretching1670
RutinO-H stretching3426s
C=O stretching1656vs
Benzene ring skeleton1600s
C=C stretching vibration1505s
Here, s, strong; vs, very strong; b, broad.
Table 3. Range of values derived through HPLC analysis for moringa samples.
Phenolic CompoundsVar. 1Var. 2Var. 3Var. 4Var. 5
Benzoic acid75.44 ± 4.6919.76 ± 4.1082.31 ± 1.50103.32 ± 5.0736.22 ± 2.61
Rutin1537.30 ± 94.443758.31 ± 129.943535.31 ± 23.161950.17 ± 27.452027.80 ± 56.14
Kaempferol6.42 ± 1.5610.79 ± 1.5514.51 ± 1.5413.04 ± 1.4428.30 ± 4.71
total1619.16 ± 100.693788.86 ± 135.593632.13 ± 26.202066.53 ± 33.9620927.32 ± 63.46
Average ± STDE (ug/g dry wt.), ND: not detected.
Table 4. Datasets used during model construction.
Technique (n = 1400)SamplesNumber of Samples (Calibration)Number of Samples (Prediction)
FT-IR spectroscopyMoringa Powder samples840560
Table 5. Predicted phenolics in moringa powder samples using the PLSR, PCR, and HLA/GO model.
Model/Preprocessing R c 2 RMSEC (mg/g) R p 2 RMSEP (mg/g)
PLSR/Mean norm0.9960.0410.9960.039
PLSR/MSC0.9950.0390.9950.036
PLSR/SNV0.9960.0380.9970.035
PLSR/SG-10.9780.1010.9750.11
PLSR/SG-20.9820.0930.9770.105
PLSR/Raw0.9230.1920.9170.201
PCR/Mean Norm.0.9320.180.9260.18
PCR/Max Norm.0.9670.1250.9630.134
PCR/MSC0.9660.1270.9610.136
PCR/SNV0.9660.1270.9610.136
PCR/SG-20.9520.1520.9430.166
HLA/GO/Mean Norm.0.9730.1150.9710.120
HLA/GO/Max Norm.0.9690.1220.9670.128
HLA/GO/MSC0.9720.1160.9700.121
HLA/GO/SNV0.9720.1170.9700.122
HLA/GO/SG-20.80250.3850.790.396
RMSEC represents the root mean square error of calibration, while RMSEP is the root mean square error of prediction.
Table 6. Concentration range of values obtained through the second HPLC reference analysis for moringa samples.
Phenolic CompoundsC-1
(1.95)
C-2
(2.50)
C-3
(3.10)
C-4
(3.70)
C-5
(4.42)
C-6
(2.51)
C-7
(2.95)
C-8
(3.40)
C-9
(3.82)
C-10
(4.20)
C-11
(2.44)
C-12
(2.90)
C-13
(3.30)
C-14
(3.80)
Benzoic acid0.14 ± 0.010.12 ± 0.010.18 ± 0.070.12 ± 0.030.22 ± 0.080.16 ± 0.010.16 ± 0.000.14 ± 0.020.14 ± 0.020.19 ± 0.010.11 ± 0.000.14 ± 0.030.17 ± 0.020.20 ± 0.00
Rutin3.00 ± 0.543.12 ± 0.855.91 ± 3.393.41 ± 1.527.56 ± 3.382.94 ± 0.755.48 ± 0.054.86 ± 1.516.09 ± 1.077.29 ± 0.101.72 ± 0.43.49 ± 1.745.88 ± 1.107.40 ± 0.01
Kaempferol0.06 ± 0.000.06 ± 0.000.06 ± 0.000.06 ± 0.000.06 ± 0.000.06 ± 0.000.06 ± 0.000.06 ± 0.000.06 ± 0.000.06 ± 0.000.06 ± 0.000.06 ± 0.000.06 ± 0.000.06 ± 0.00
Total4.81 ± 0.784.76 ± 1.248.47 ± 4.495.06 ± 2.1510.68 ± 4.914.54 ± 1.098.08 ± 0.227.21 ± 2.108.94 ± 1.5110.60 ± 0.072.83 ± 0.805.39 ± 2.608.62 ± 1.6210.62 ± 0.18
C-1 to C-14 represent the 14 different concentrations that were prepared during spectral measurements. Average ± STDE (μg/g dry wt.), ND: not detected.
Publisher’s Note: MDPI stays neutral with regard to jurisdictional claims in published maps and institutional affiliations.

