Article

Assessing Nitrogen Availability in Biobased Fertilizers: Effect of Vegetation on Mineralization Patterns

Department of Green Chemistry & Technology, Faculty of Bioscience Engineering, Ghent University, 9000 Ghent, Belgium
*
Author to whom correspondence should be addressed.
Agriculture 2021, 11(9), 870; https://doi.org/10.3390/agriculture11090870
Submission received: 10 August 2021 / Revised: 2 September 2021 / Accepted: 6 September 2021 / Published: 10 September 2021
(This article belongs to the Special Issue Fertilizer Use, Soil Health and Agricultural Sustainability)

Abstract

:
Biobased nitrogen (N) fertilizers derived from animal manure can substitute synthetic mineral N fertilizer and contribute to more sustainable agriculture. Practitioners need to obtain a reliable estimation of the biobased fertilizers’ N value. This study compared the estimates for pig slurry (PS) and liquid fraction of digestate (LFD) using laboratory incubation and plant-growing experiments. A no-N treatment was used as control and calcium ammonium nitrate (CAN) as synthetic mineral fertilizer. After 100 days of incubation, the addition of PS and LFD resulted in a net N mineralization rate of 10.6 ± 0.3% and 20.6 ± 0.4% of the total applied N, respectively. The addition of CAN showed no significant net mineralization or immobilization (net N release 96 ± 6%). In the pot experiment under vegetation, all fertilized treatments caused N immobilization with a negative net N mineralization rate of −51 ± 11%, −9 ± 4%, and −27 ± 10% of the total applied N in CAN, PS, and LFD treatments, respectively. Compared to the pot experiment, the laboratory incubation without vegetation may have overestimated the N value of biobased fertilizers. Vegetation resulted in a lower estimation of available N from fertilizers, probably due to intensified competition with soil microbes or increased N loss via denitrification.

1. Introduction

Synthetic mineral nitrogen (N) fertilizers have made an essential contribution in maintaining an adequate food supply for the growing world population. However, the production of synthetic mineral N fertilizers via the Haber–Bosch process is high energy and fossil-fuel dependent [1]. The N applied to crop is only partly used due to N losses through leaching, emission, and non-harvested crop residues left in the field [2]. Moreover, the N cycles in agro-systems are no longer closed because of the growing independence between crop production and animal husbandry, resulting in unbalanced N flows, which threaten the sustainability of agriculture both environmentally and economically. To help close the N loop, biobased N fertilizers derived from animal manure could substitute synthetic mineral N fertilizer [3,4,5,6] and contribute to more sustainable agriculture in line with a circular economy.
While N supplied by synthetic mineral N fertilizers is 100% in mineral form, most biobased N fertilizers also partly provide organic N, which can be directly taken up by plants [7] or become available for plants via microbial N mineralization and immobilization turnover (NMIT) [8]. Furthermore, biobased fertilizers usually provide additional organic carbon (C) to the soil, accelerating the NMIT process [9]. Therefore, the actual value of biobased N fertilizers depends on the content of mineral N, which is directly plant-available, and the mineralizable organic N whose availability can be affected by the product characteristics (C/N ratio, organic C and N quality, etc.) [10,11], the target plants [12,13], and the soil microbial communities [14,15].
The nitrogen use efficiency of fertilizers is most accurately assessed by tracing the transformation, absorption, transfer, and transport of nitrogen fertilizer in the soil–crop system using 15N isotope labeling technology. However, this technology is not usually applicable due to the high cost of 15N materials and 15N measurements. Therefore, a straightforward and cost-effective approach was used by calculating the difference between N uptake by crop in fertilized and unfertilized treatment divided by the total applied N in a single season, defined as apparent N recovery (ANR) [16]. The potential value of biobased N fertilizers in substituting synthetic mineral N fertilizers is evaluated by N fertilizer replacement value (NFRV), which is calculated as the ratio between the ANRs of the biobased fertilizers and those of the reference synthetic mineral N fertilizer. Fields represent the ideal scale for NFRV estimation. However, conducting a field trial is expensive and laborious, which makes it not always practical. As an alternative, laboratory incubation at controlled conditions can monitor the N release from organic fertilizers in the absence of plants. It is considered an effective and reliable tool for the initial estimation of N release in a relatively short term (varying from a few days to a few months) [17,18]. However, this method does not take into consideration the effect of vegetation on the N dynamics in the soil through biological activities like plant N uptake [8], rhizodeposits [19], rhizosphere microbial turnover [20], and their interactions [21,22], or physical amendments by roots development on soil which affects the water holding capacity (WHC) and the N diffusion in soil [23]. To date, very few studies provided a direct comparison between planted and unplanted experiments to show the effect of vegetation on N dynamics, still less under biobased fertilization. Cheng [12] observed that the presence of soybean (excluding N2-fixation) and wheat resulted in higher soil net N mineralization (balance between immobilization and mineralization as measured with 15N isotopic labelling technology) by 21% and 9%, respectively, than that in unplanted soil. Canarini and Dijkstra [24] also found more significant N mineralization rates and higher N loss in planted soil under constant moisture (60% WHC) but not under drying-rewetting condition.
In contrast, Qian et al. [25] concluded in a maize-growing experiment that the presence of plants resulted in increased microbial N immobilization (+67%) and accumulated denitrification (+77%) in planted soil compared with unplanted soil, whereas Grunert et al. [13] found vegetation with tomato plants enhanced the N release from recovered struvite but no significant effect on N mineralization of the tested commercial organic fertilizer. Further investigation is needed to assess the effect of vegetation on the N mineralization pattern of biobased fertilizers as substitutions for synthetic mineral N fertilizers.
In this study, parallel observations were conducted in a laboratory incubation experiment (without vegetation) and in a pot experiment (with plant growing) to assess the potential N value of two biobased fertilizers: pig slurry (PS) and liquid fraction of digestate (LFD). PS was selected as a raw biobased N fertilizer that usually requires processing due to high water content and limited land disposal surrounding pig farms [26]. Correspondingly, the anaerobic digestion process was reported to reduce the soil C supply unilaterally and increase the amounts of readily available N, leading to a more balanced soil C and N supply [27]. Therefore, the LFD, produced from PS-based biowaste through anaerobic digestion and subsequent physical separation, was selected as a merging biobased N fertilizer. It was hypothesized that (i) vegetation with maize plant can result in an increased net N release compared to unplanted incubation; and (ii) the addition of LFD with a reduced C/N ratio can lead to higher N mineralization and thus show higher potential N value than unprocessed PS.

2. Materials and Methods

2.1. Experiment Setup

An incubation experiment was conducted in 10-cm-deep poly vinyl chloride (PVC) tubes in parallel with a plant-growing experiment using maize (Zea mays LG31220, France) in 45-cm-deep tubes for 100 days. Maize was used because it is widely grown throughout the world and it serves as one of the most important sources for food, fuel, and animal feed [28]. The tested fertilizers, i.e., calcium ammonium nitrate (CAN, 30% N, as synthetic N fertilizer), pig slurry (PS), and liquid fraction of digestate (LFD), were applied at a rate of 150 kg total N ha−1 in the two experimental setups, by manually mixing them with soil before incubation or planting. For the control, no N fertilizer was applied. The moisture content of the soil was adjusted to 70% of WHC by adding deionized water. The P and K fertilizers were applied in all treatments at the same dosages, compensating with triple superphosphate (TSP, 40% P2O5) and patentkali (PAT, consisting of 30% K2O, 10% MgO, and 42% SO3) to the highest supplies of 77 kg P2O5 ha−1 by PS and 148 kg K2O ha−1 by LFD. All fertilizers were applied on a surface basis. Considering a soil density of 1400 kg m−3 and a soil depth of 0–30 cm, the applied dosages corresponded to 35 mg N kg−1, 18 mg P2O5 kg−1, and 34 mg K2O kg−1 soil dry weight (DW).

2.2. Soil Collection and Analyses

The soil was collected from the surface layer (0–30 cm) of an arable field at Bottelare, Belgium (50°58′0” N, 3°45′0” E). It contained 40% sand, 7% clay, and 53% silt, and the texture was classified as silty-loam (USDA texture triangle). The collected soil was air-dried and sieved through a 2-mm mesh. To reduce the potential interference in the net N mineralization from the soil mineral N supply, which was relatively high (22 mg N kg−1 DW) compared to the fertilizer N supply (150 kg N ha−1, equal to 35 mg N kg−1 DW), the air-dried soil was mixed with oven-dried river sand at a ratio of 1:1 w/w. A subsample of the mixture (from now on stated as ‘soil’) was taken for determination of the moisture content, organic matter (OM), pH-H2O, and mineral N (NO3-N and NH4+-N). The WHC of the soil was determined by the addition of demineralized water to oven-dried soil until it became saturated and excess water was draining freely [29]. The mass of added water was recorded. The DW was determined by weight loss after drying the soil sample to constant weight at 105 °C for at least 24 h. The OM was measured using a muffle furnace for four hours at 550 °C. Soil actual acidity (pH-H2O) was measured using a pH electrode (Orion-520A USA) and the electrical conductivity (EC) was measured using a WTW-LF537 (GE) conductivity electrode after 10 g of soil was allowed to equilibrate in 50 mL demineralized water for 16 h [30]. Total N and C content in soil was determined using a CN analyzer (Skalar Analytical BV, Breda, The Netherlands). Nitrate N (NO3-N) (ISO 13395:1996) and ammonium N (NH4+-N) (ISO 11732:1997) in soil were analyzed from 1 M KCl extract using a continuous flow auto-analyzer (Chemlab System 4, Skalar, Breda, The Netherlands).
The characteristics of the tested soil were sandy loam texture (70% sand, 4% clay, and 26% silt); DW = 98.8%; WHC = 305 g water per kg dried soil; pH-H2O = 7.1; EC = 68 μS cm−1; OM = 3%; total C = 0.4%; total N = 0.36 g kg−1; NH4+-N = 4.9 mg kg−1; and NO3-N = 6.6 mg kg−1. The N and C contents were within the recommended criteria (NO3-N < 20 mg kg−1 soil and organic C < 1.5%) for mineralization experiments according to the Flemish Institute for Technological Research [31].

2.3. Biobased Fertilizer Collection and Analyses

The tested biobased fertilizers were collected from a biogas plant in Gistel, Belgium (51°10′0” N, 2°57′0” E). The biogas plant runs at 37–40 °C with a hydraulic retention time (HRT) of 30 days and a total volume of 1000 m3. Pig slurry is the primary input material for the biogas plant, accounting for 71%, supplemented with 8% raw cow manure, 12% solid pig manure, and 9% fried potato waste. After anaerobic digestion, the digestate is separated into liquid and solid fractions by centrifugation. Two liters of PS and LFD were collected in plastic bottles and stored at 4 °C before analysis and application.
The two biobased fertilizers were characterized in triplicate (Table 1). The values of DW, OM, total N, total C, NH4+-N, and NO3-N were determined as described in Section 2.2. The EC and pH values were determined on the fresh sample, using a WTW-LF537 (GE) conductivity electrode and an Orion-520A pH-meter (USA). The concentration of total phosphorus (P) and total potassium (K) were analyzed by inductively coupled plasma optical emission spectrometry (ICP-OES) (Varian Vista MPX, Varian Palo Alto, CA, USA) after microwave digestion using 13% HNO3.

2.4. Laboratory Incubation and Sampling

The incubation experiment was conducted in PVC tubes with a diameter of 4.6 cm and a height of 18 cm, containing 243 g of soil-sand mixture homogeneously mixed with fertilizers at the rates mentioned in Section 2.1. The PVC tubes were closed at the bottom; thus, no leaching happened. The soil was brought to a bulk density of 1400 kg m−3 by compacting the mixture to a height of 10 cm. The soil moisture content for the incubations was adjusted to 70% of WHC, and the tubes were covered with a single layer of pin-holed gas permeable parafilm to minimize water loss whilst allowing air exchange. The total weight of the tubes was recorded. The tubes were subsequently incubated in a growth chamber in the dark. The average temperature during the experiment was 19.3 ± 0.3 °C during the day and 18.5 ± 0.3 °C at night, and the relative humidity was 75 ± 6% during the day and 70 ± 6% at night. Four replicates of each treatment were destructively sampled for soil analysis every 20 days until day 100.

2.5. Maize-Growing Experiment and Sampling

The maize-growing experiment was conducted in PVC tubes with a diameter of 11 cm and 45 cm in height containing 5 kg of soil-sand mixture homogeneously mixed with fertilizers at the rates mentioned in Section 2.1. Five maize seeds were planted in each tube and thinned to one plant after germination. The PVC tubes were placed in a growth chamber under intensive red and blue light providing a total daily light period of 13 h. The average temperature and relative humidity were the same as in incubation. The pots were weighed every 3–5 days and deionized water was added to maintain the WHC at around 70%. The water leached from the maize-growing pots was recovered by a plate on the bottom and returned to the soil surface; thus, we assumed no N loss through leaching from the pot experiment.
Four replicates of each treatment were destructively harvested on 20, 40, 60, 80, and 100 days after sowing. During each harvest, the shoots were cut with a knife from the soil surface and the fresh weight (FW) was recorded. Roots were separated from the soil and washed with deionized water. The FW of roots was measured after being dried with paper tissue. Afterwards, all shoot and root samples were dried at 65 °C in a forced-draft oven until the DW was constant. Then, the dried biomass was homogeneously ground. The soil samples from tubes with maize growing were collected to analyze mineral N (NH4+-N + NO3--N) and DW. Total N was measured for each dried plant sample using a CN analyzer (Skalar Analytical BV, Breda, The Netherlands).

2.6. Calculation on N Release and Mineralization

In this experiment, the “two-pool” model [32] was used: one of the pools contained the plant-available N (i.e., NO3-N, NH4+-N) and the other one had the non-available N (i.e., organic-N, fixed NH4+). For laboratory incubation, the potential N value of tested fertilizers was evaluated by net N release (Nrel, net), which is the difference between the mineral N measured in the fertilized soil minus the mineral N measured in the control (i.e., unfertilized soil), calculated as Equation (1) [33]:
Nrel, net (%) = [(NH4+-N)treatment + (NO3-N)treatment − (NH4+-N)control − (NO3-N)control]/total applied N × 100
At t = 0, the Nrel, net (%) equals the product mineral N to total N ratio × 100.
In the maize-growing experiment, the plant N uptake was included and Nrel, net was calculated as Equation (2) adapted from Equation (1):
Nrel, net (%) = [ShootNtreatment + RootNtreatment + (NH4+-N)treatment + (NO3-N)treatment − (shootNcontrol − RootNcontrol − (NH4+-N)control − (NO3-N)control]/total applied N × 100
Net N mineralization (Nmin, net (%)) is the N mineralized from the organic fraction of the biobased fertilizers and is calculated by subtracting the amount of mineral N already present in the biobased fertilizers at t = 0, as Equation (3) according to [33]:
Nmin, net (t, %) = Nrel, net (t, %) − Nrel, net (t = 0, %)
A positive Nmin, net value indicates net N mineralization, whereas a negative Nmin, net value indicates net N immobilization.

2.7. Mass Balance Calculation

Based on the mean N concentration in soil and plant samples on day 0 and day 100, a mass balance for N flows under the different fertilizer treatments was established respectively for the incubation and the pot experiment. In incubation, the plant-available N pool referred to the mineral N pool (hypothetically plant-available), while in the pot, it referred to the plant N uptake plus the mineral N residue in the soil. The plant-available N in both setups can come from soil mineral N, fertilizer mineral N, as well as mineralized N from soil organic matter (SOM) and fertilizer organic N. The soil mineral N supply was calculated as the mineral N in the soil before fertilization, while the mineralized N from the SOM was calculated as the difference of mineral N contents in control treatment between day 100 and day 0. Here, the possibility of additional SOM decomposition (priming effect) that might be brought by fertilization was not considered. Thus, the mineralized N from the SOM was assumed to be the same in all treatments. In fertilizer treatments, the extra mineralized N was attributed to the mineralization of fertilizer organic N. The remaining fertilizer-derived N that cannot be included in the above-mentioned N flows was counted as unmeasured.

2.8. Statistical Analyses

Statistical analyses were performed using SPSS statistical software (version 26.0; SPSS Inc., Chicago, IL, USA). The data from the incubation and field measurements were first subjected to one-way ANOVA for each sampling moment to evaluate the effect of vegetation and fertilization separately. To analyze the trends in time, a three-way ANOVA was conducted to compare the main effect of vegetation, fertilization, and sampling moment, as well as their interactions, on the plant-available N concentration and the calculated Nrel, net. When significant differences between means were observed, additional post hoc assessment was performed using Tukey’s test (p < 0.05, n = 4). These differences are indicated by the different lower-case letters. Normality was checked using the Shapiro–Wilk test, whereas homogeneity was tested with the Levene test.
Linear regressions were calculated to (i) predict the N availability in the maize-growing pot based on that in incubation experiment and (ii) predict the Nrel, net in incubation or ANR in pot and field trials based on the mineral N to total N ratio of the applied biobased fertilizers.

3. Results

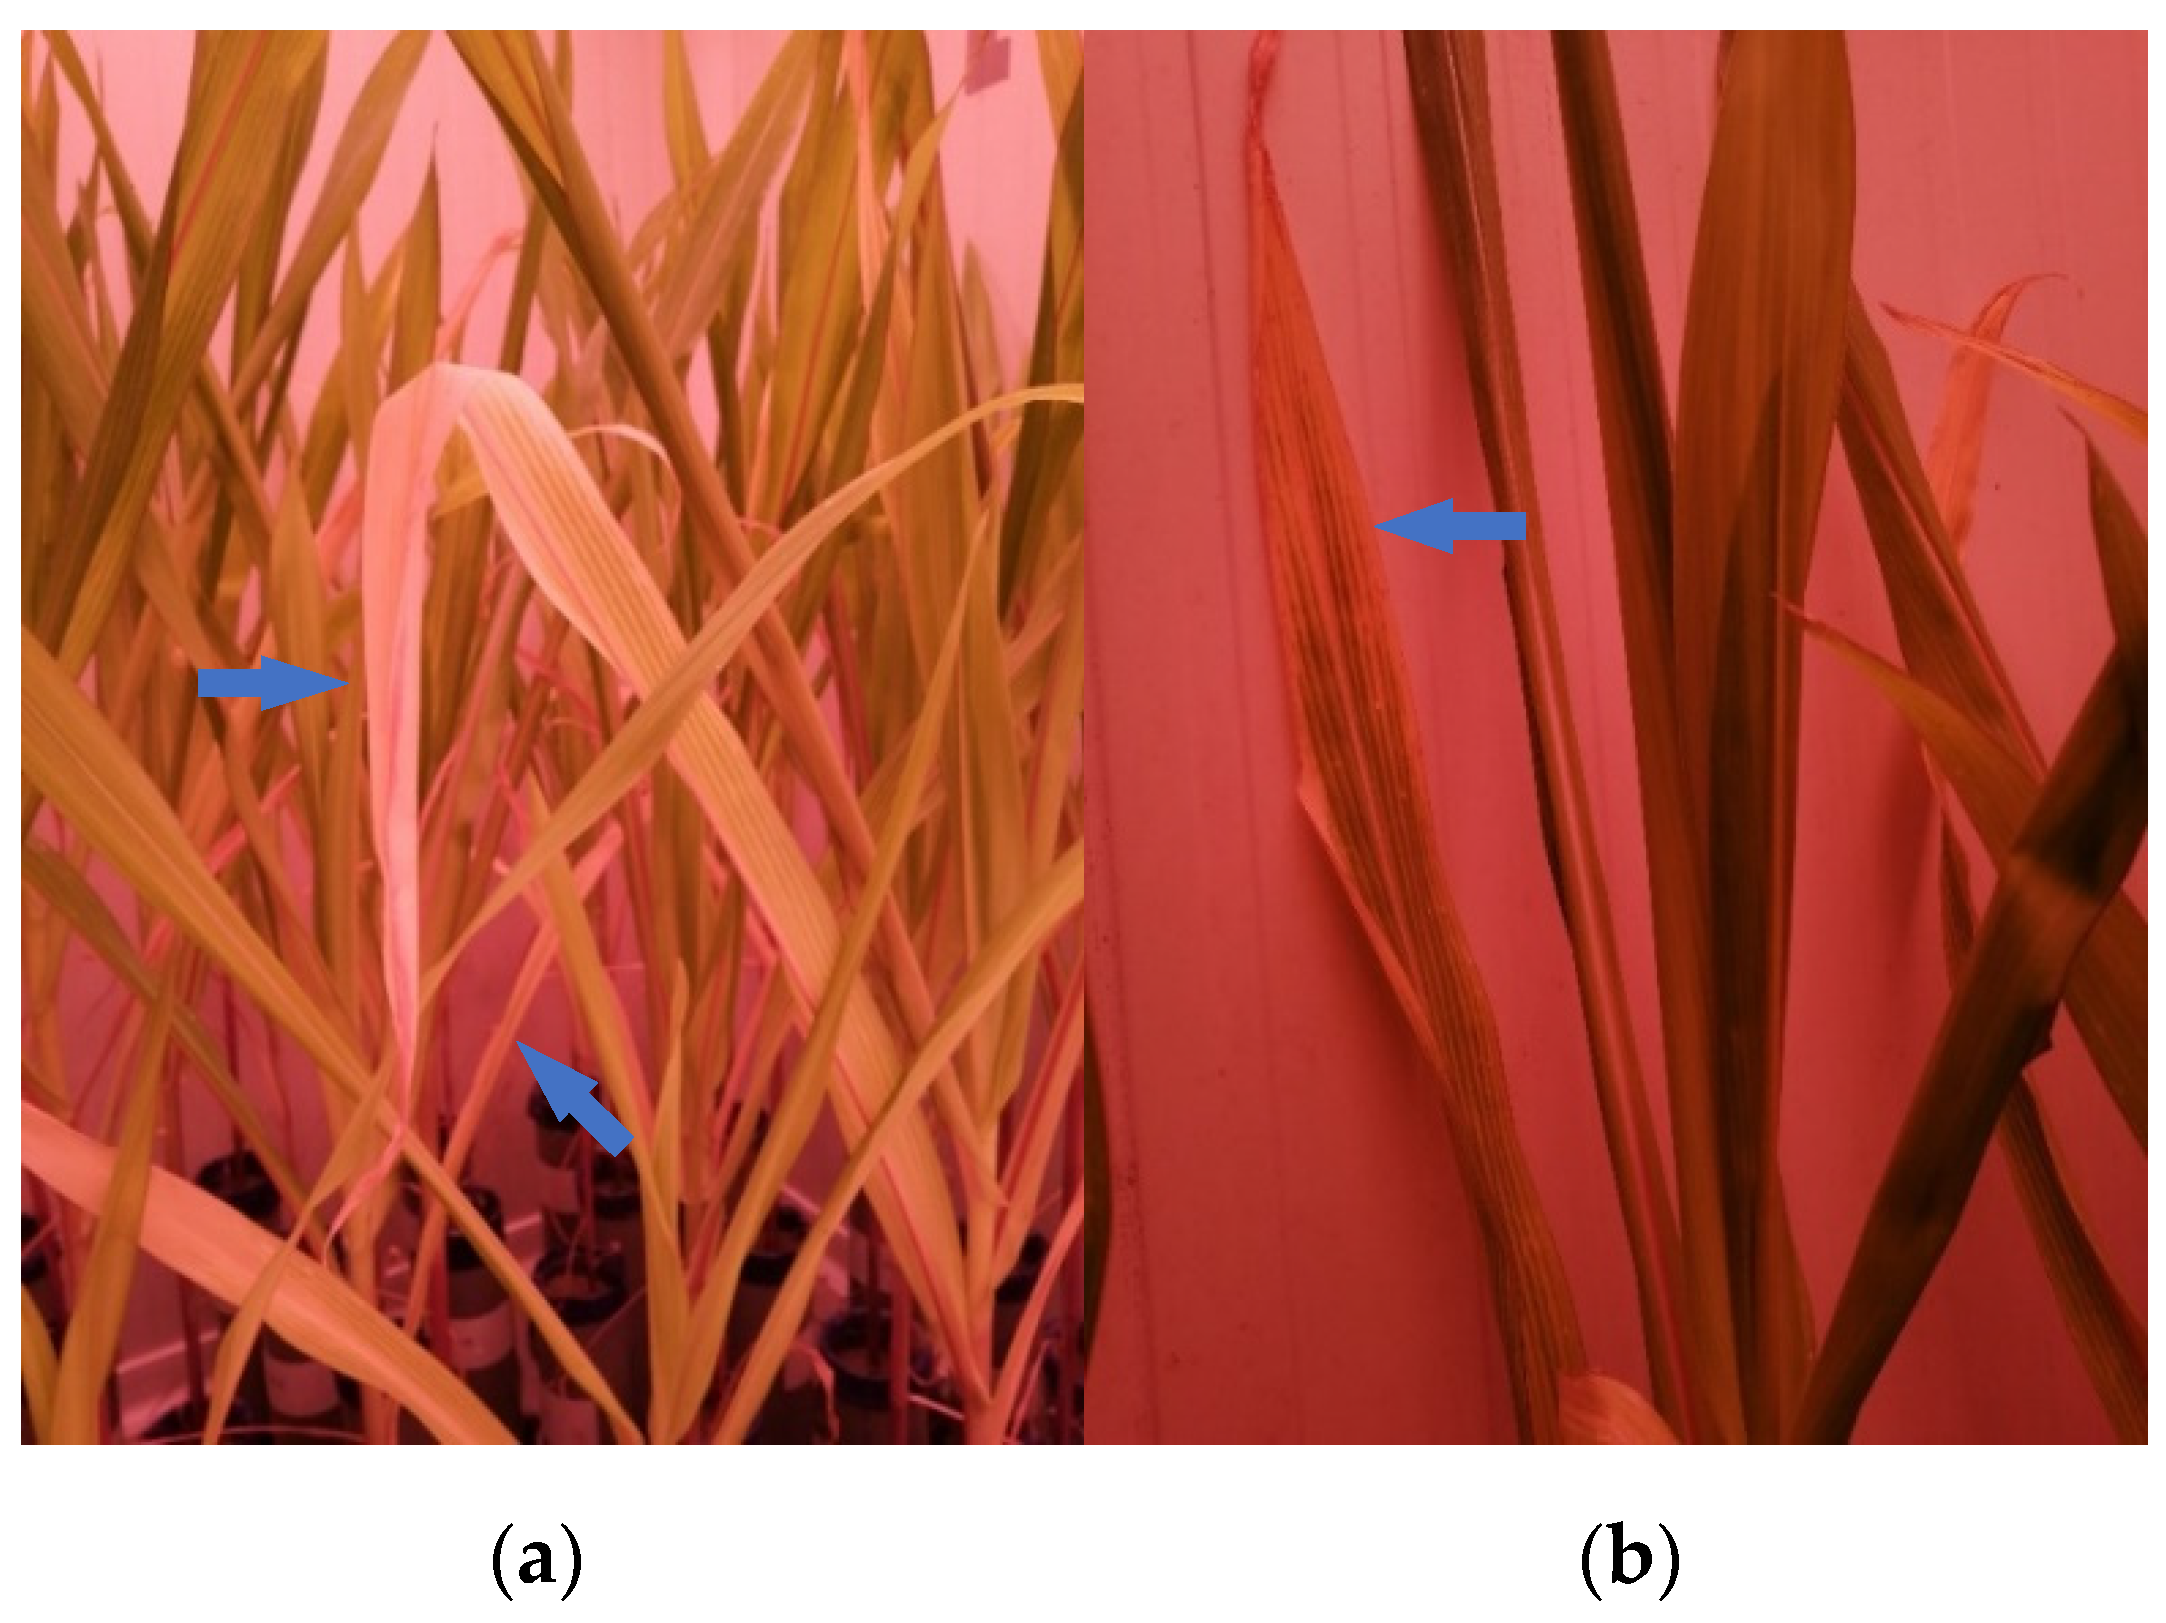
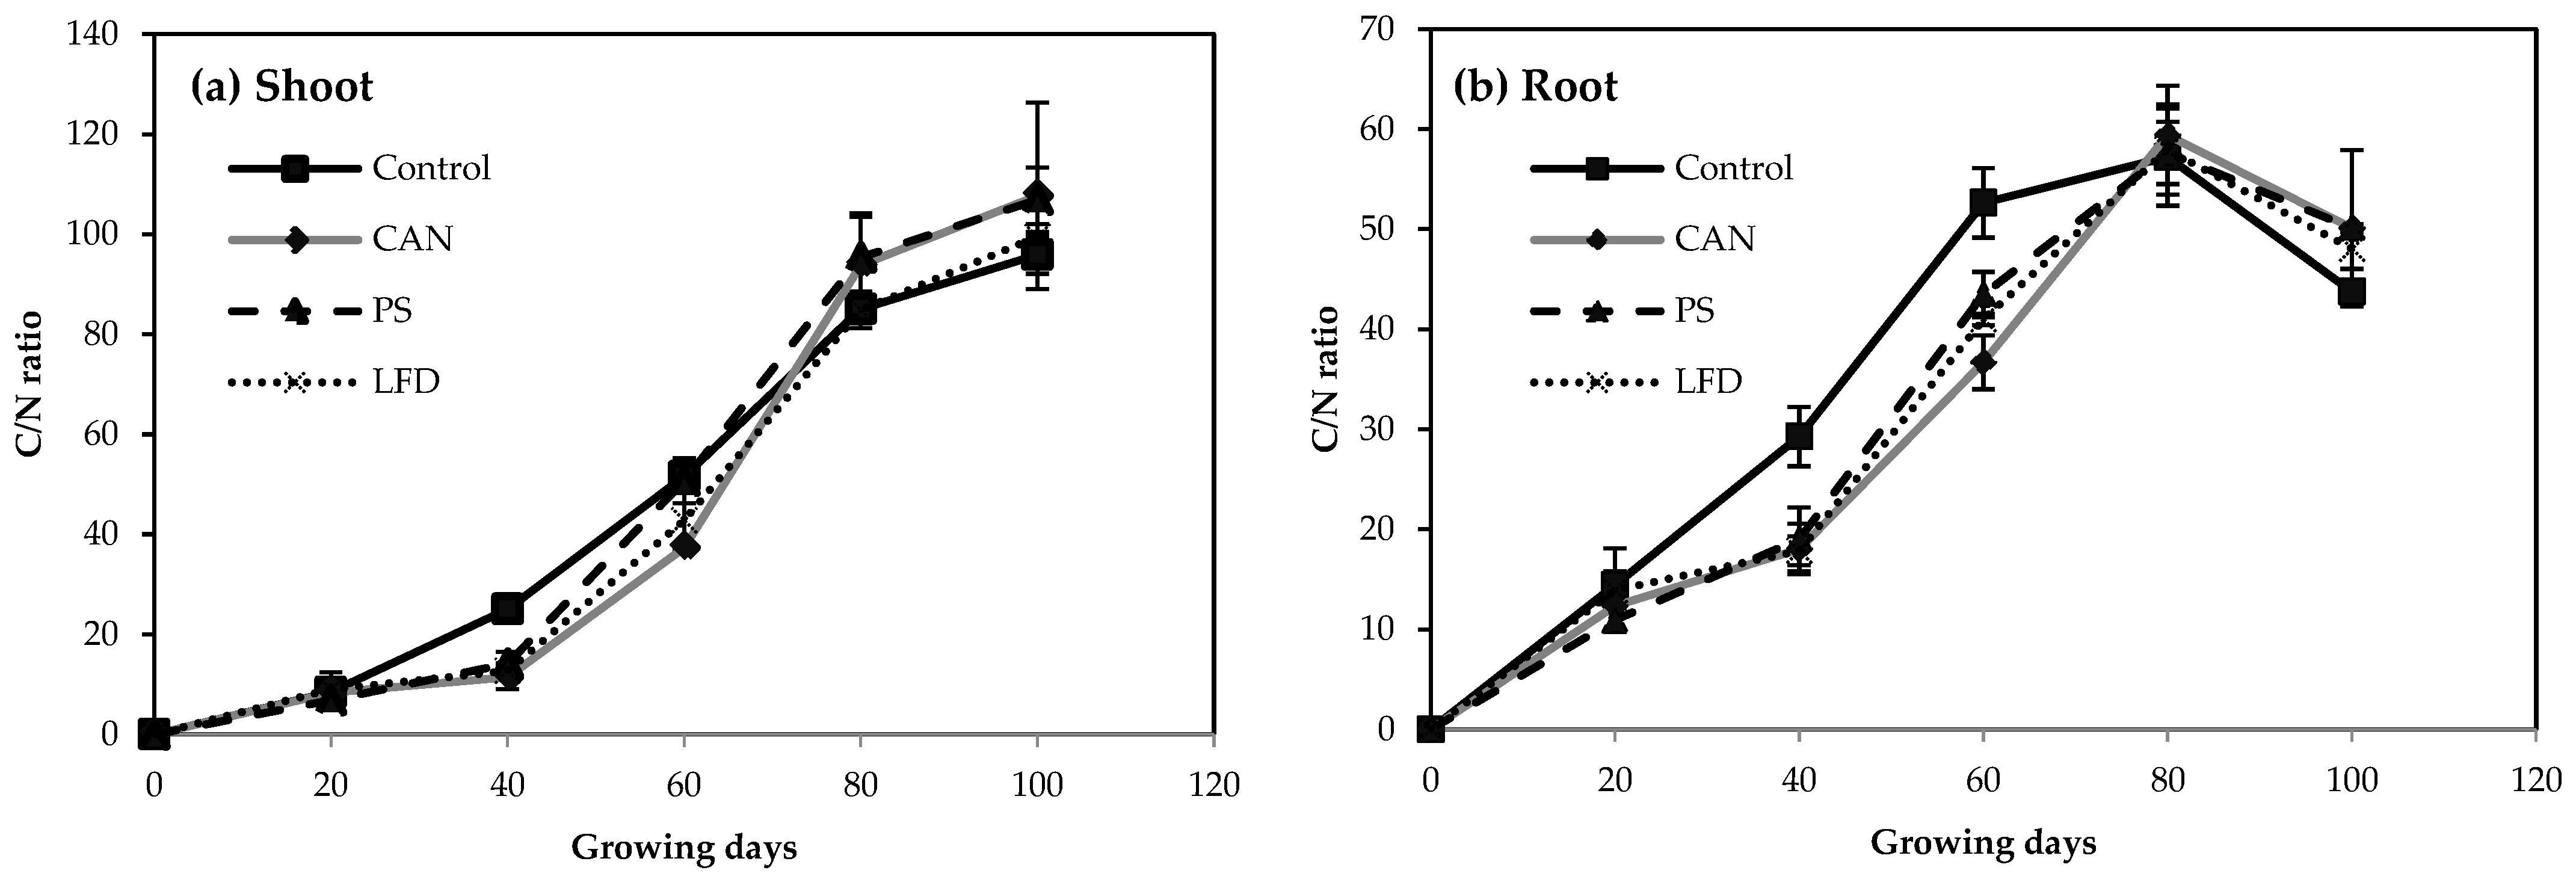
3.1. Root and Shoot Development of Plants

At the early stage (0–20 days), the FW and DW biomass yields of CAN and LFD treated maize plants were on average lower than those of control and PS treatment. From day 20 to day 80, the fresh biomass yield of maize plant shoots under control, CAN, PS, and LFD treatment increased by 21, 77, 47, and 80 times, respectively. After that, some leaves turned yellow and started to dry out, resulting in a slight increase (−10% to 5.5%) of shoots FW on day 100 compared to day 80 (Table 2). As indicated in Figure 1, since day 70, the maize plant showed symptoms as the old leaves turned pale or yellowish-green and developed an inverted “V” or spear-shaped discoloration starting at the tip of the leaf and extending toward the leaf base. Nevertheless, the DW of the shoot in all treatments kept increasing until the end of the experiment, with rapid growth rates (0.21–0.78 g day−1) in fertilized treatments and a relatively constant increase (0.12–0.18 g day−1) in control treatment from day 60 (Table 2). By the end of the experiment, fertilizer treatments showed a significant (p < 0.05) increase on both FW and DW biomass yield of maize shoot compared to control. Addition of CAN and PS resulted in the highest biomass yields, being FW 148 ± 7 g pot−1, DW 32 ± 1 g pot−1 in CAN treatment, and FW 141 ± 8 g pot−1, DW 32 ± 2 g pot−1 in PS treatment, while the addition of LFD (FW 109 ± 15 g pot−1, DW 24 ± 3 g pot−1) led to around two times higher biomass yield than control (FW 52 ± 4 g pot−1, DW 11 ± 1 g pot−1).
The root biomass showed a similar trend as that of the shoot (Table 2). From day 20 to day 60, the FW of roots in all treatments continuously increased to 14–16 g per pot, while the DW of roots increased by 4, 9, 9, and 10 times in control, CAN, PS, and LFD treatment, respectively. From day 60, the root FW in control treatment suffered a decrease (Table 2). There was no significant increase in FW or DW from day 80 to the end in fertilized treatments.
Consistent with the DW, N continuously accumulated in shoots and roots under all treatments, with significantly (p < 0.05) higher N uptake (calculated from Table 2) in fertilized treatments than control by day 100. However, together with the rapid growth of plant biomass from day 40 to day 80, the N concentrations in shoots decreased dramatically. In all treatments, the N accumulation in shoots showed a much lower rate (0–3 mg pot−1 day−1) than that of C (2–338 mg pot−1 day−1) as indicated by the increased C/N ratio (Figure 2a). The decrease in N concentration also occurred in roots from day 20 to day 80 (Table 2) but was followed by a significant (p < 0.05) increase in the last 20 days.

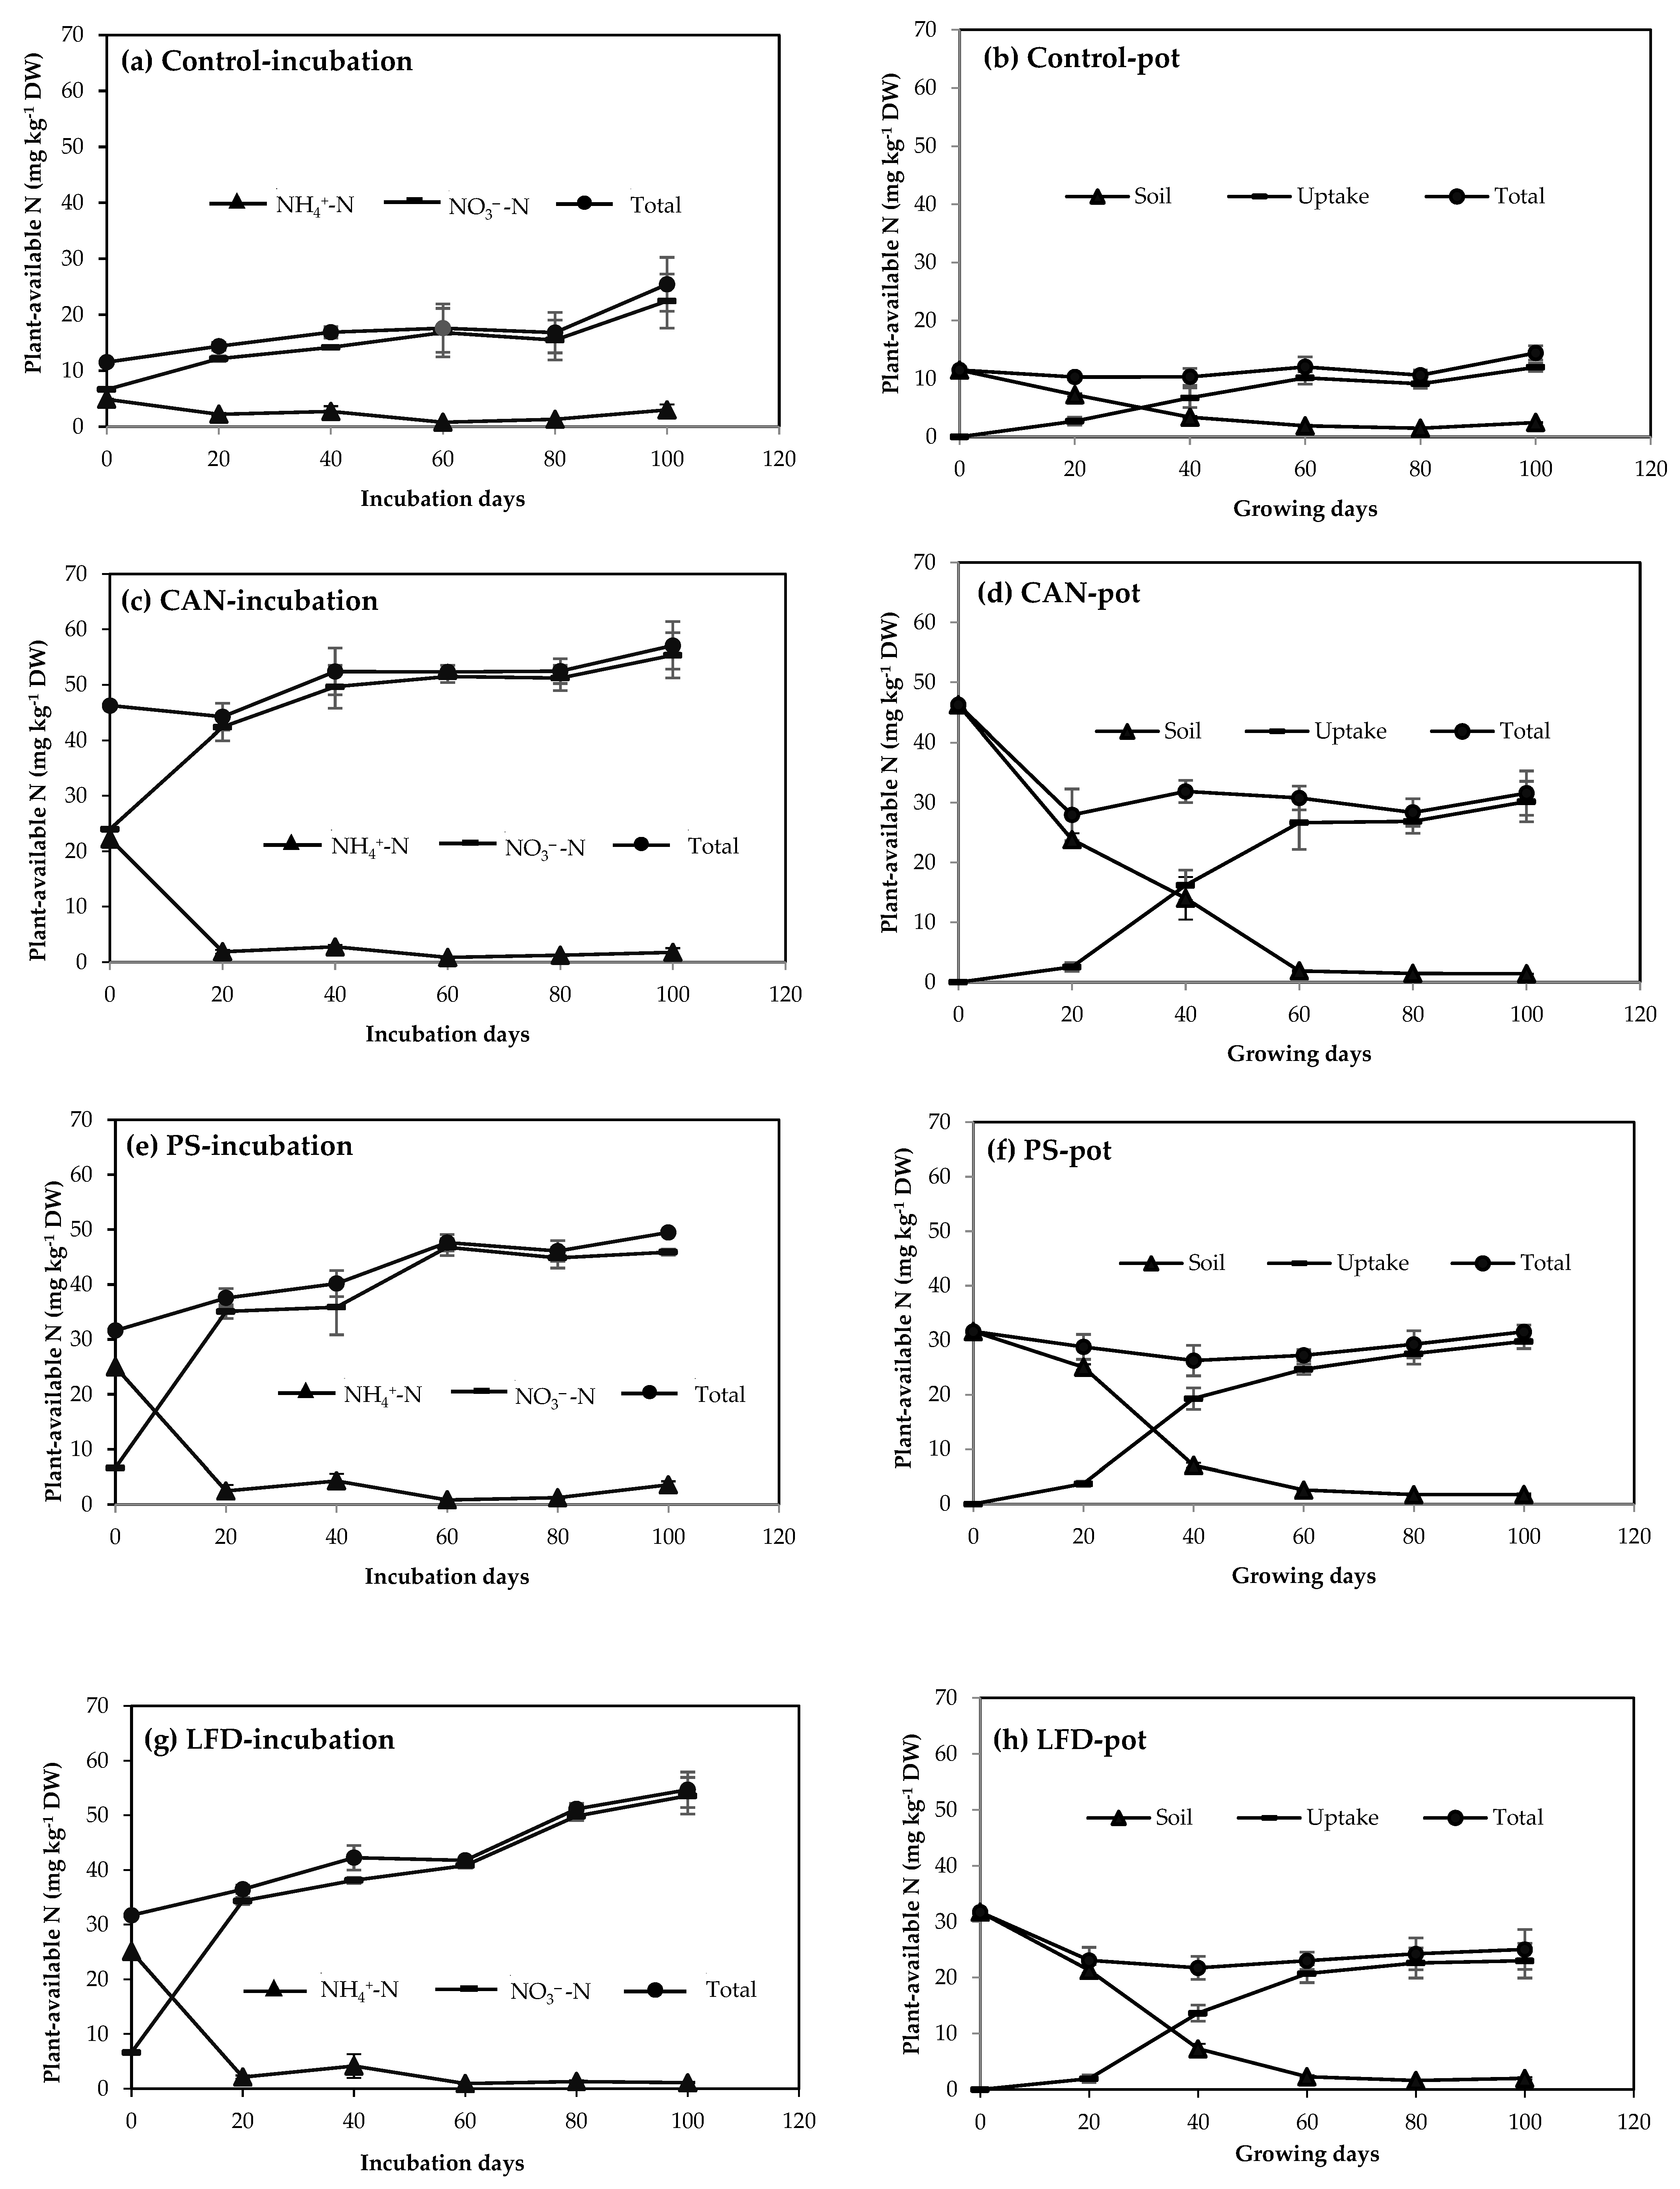
3.2. N Mineralization in Soil with and without Vegetation

During the first 20 days of the incubation period without vegetation, over 90% of NH4+-N in soil was nitrified to NO3--N in all treatments (Figure 3a,c,e,g). By day 20, CAN treatment resulted in a negative Nmin, net (−14 ± 7%), indicating a net immobilization by soil microorganisms. Later on, the net N release increased and reached 106 ± 1% of applied N by day 80 (Figure 4). In PS and LFD treatments, the Nmin, net(%) kept positive, and the net N release reached 84.4 ± 5.5% and 99.0 ± 2.9%, respectively, of the total N applied by day 80. During the last 20 days of incubation, the mineral N concentration in the control treatment increased by 51% and consequently decreased net N release in all fertilized treatments. The net N release on day 100 was 96.9 ± 5.8%, 68.5 ± 0.3%, and 78.8 ± 0.4% in CAN, PS, and LFD treatment.
In soil with maize growing, the NH4+-N concentrations in fertilized treatments declined while the NO3-N concentrations increased significantly (p < 0.05) in the first 20 days (data not shown), which is consistent with the nitrification happening in incubated soil without plant growing. At the early growing stage (0–20 days), the N uptake of maize plants were less than 11% of the applied amount (Figure 3b,d,f,h), which led to a high accumulation of mineral N in fertilized soil compared to unfertilized treatment. Surprisingly, a significant (p < 0.05) decrease of mineral N was observed in soil under CAN (39%) and LFD (27%) treatment in the first 20 days, but only 7% and 6%, respectively, of applied N was taken up by maize plants (Figure 3d,h). From day 40 to day 60, maize plants in all treatments went through a rapid growth stage. Consequently, 62–81% of the N in shoots and roots was taken up during these 40 days. The calculated Nrel, net (%) in planted soil was lower than the initial mineral N to total N ratio (presented as red lines in Figure 4), indicating a net N immobilization effect under vegetation. The three-way ANOVA showed a significant difference (p < 0.01) in the concentration of plant-available N as the main effect of vegetation, fertilizing treatment, or sampling moment. The interaction effect was significant (p < 0.01) between vegetation and fertilizing treatment or sampling moment as well as among these three factors, indicating a combined effect for vegetation and fertilization on the N release pattern. However, the interaction effect was not significant (p = 0.122) between fertilizing treatment and sampling moment due to the strong influence of vegetation.

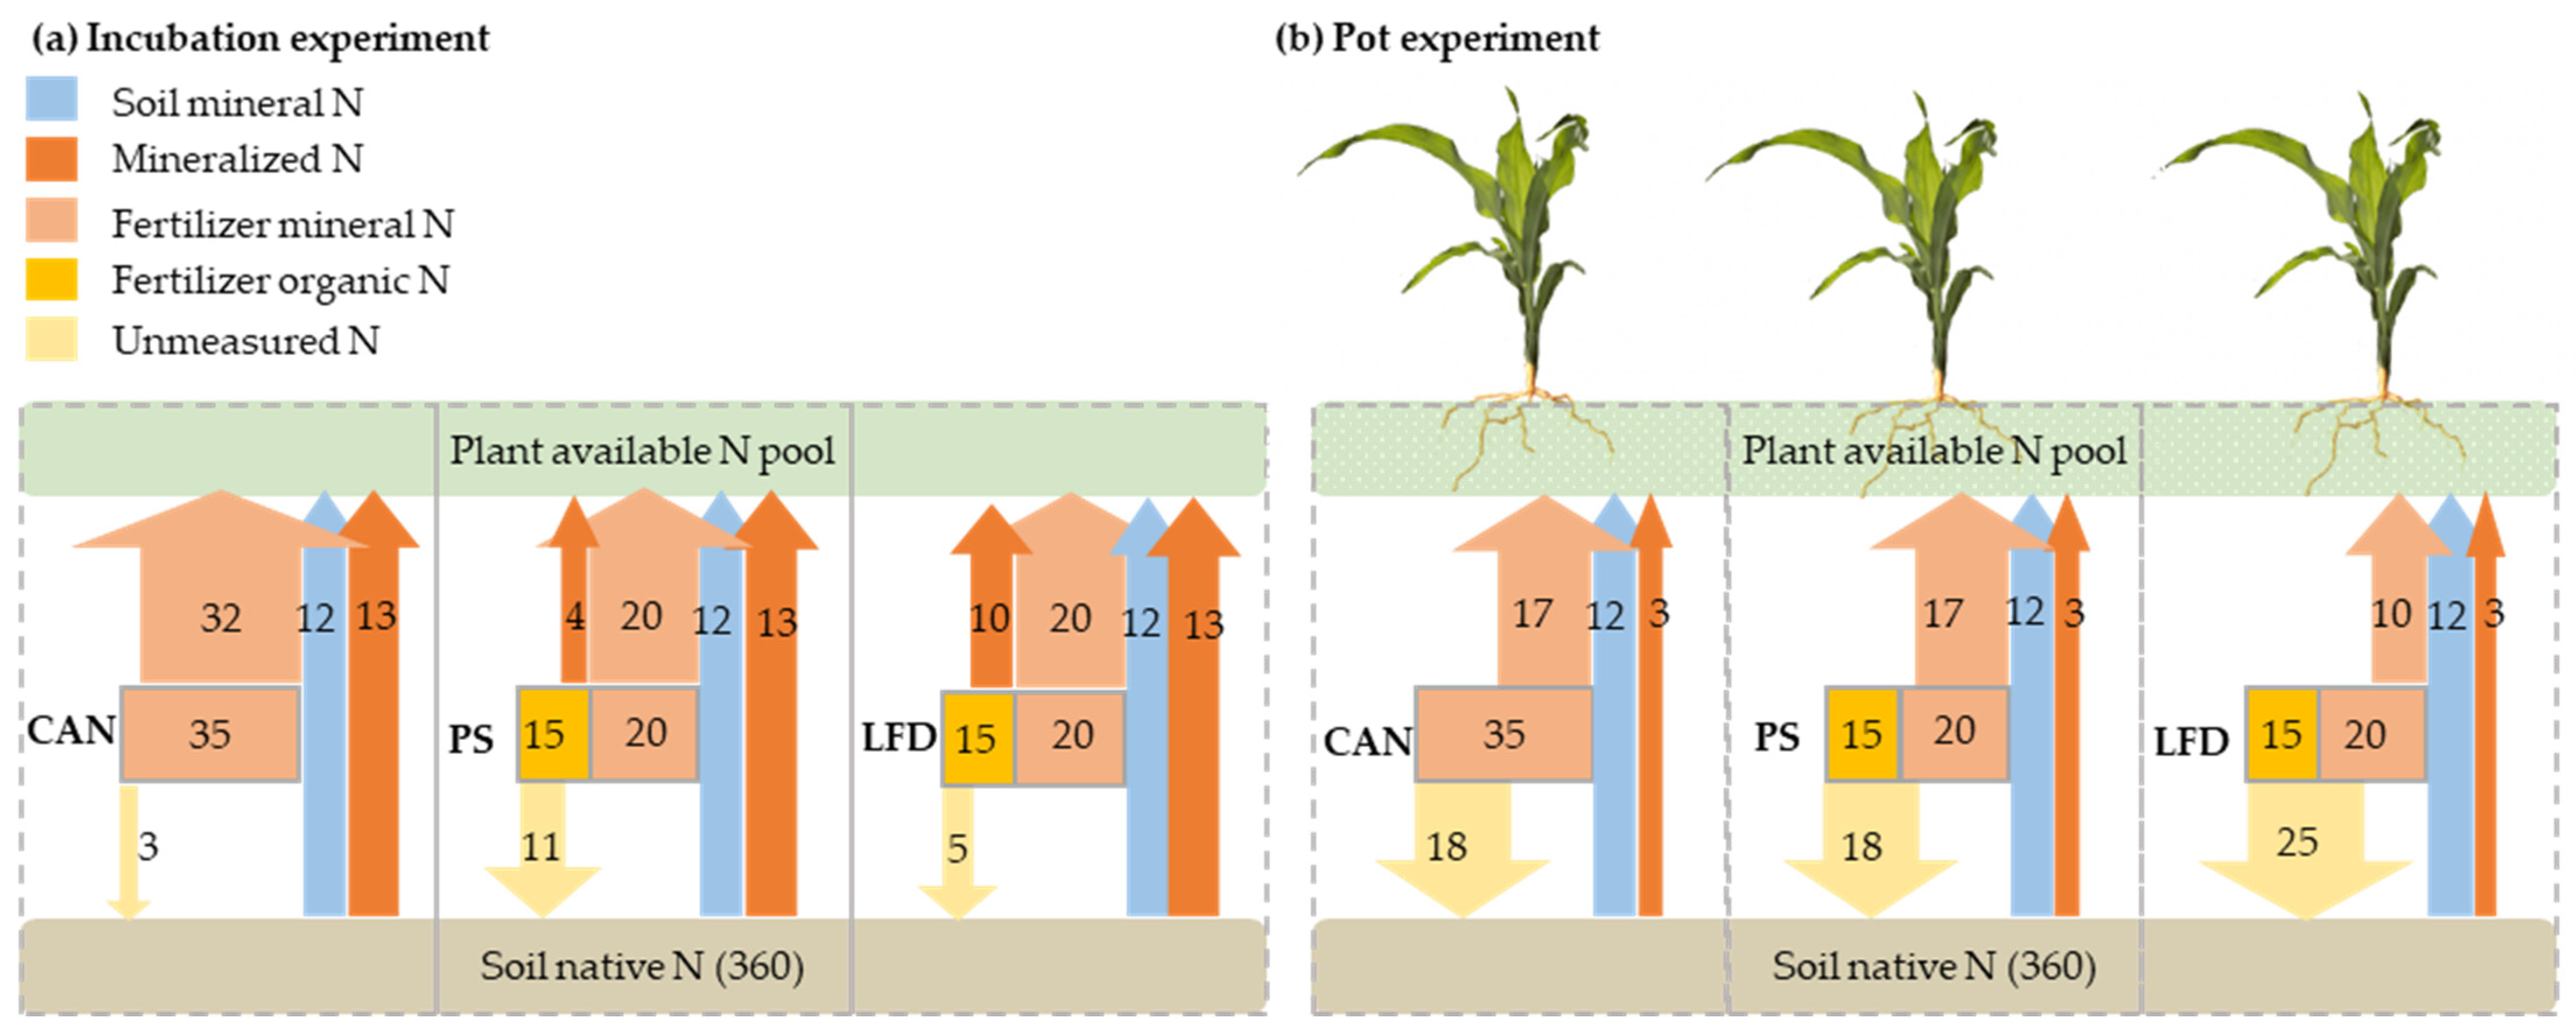
3.3. Nitrogen Mass Balance

In the N mass balance of incubation and pot experiment, respectively (Figure 5), the original soil mineral N supply was measured as 12 mg N kg−1 soil DW, which was the same in all the treatments. By day 100, the mineralized N from SOM in incubation was calculated as 13 mg N kg−1 soil DW, which was higher than that in maize-growing pots (3 mg N kg−1 soil DW). With fertilizers applied, mineral N released from added CAN, PS, and LFD to plant-available N pool of incubation experiment was 15, 7, and 20 mg N kg−1 soil DW higher than the fertilizer N supply in the pot experiment. Consequently, the unmeasured N was 18, 18, and 25 mg N kg−1 soil DW in CAN, PS, and LFD treatment, respectively, counting for 51%, 51%, and 71% of the total N applied. This unmeasured N was assumed to be immobilized by soil microbes or lost via pathways like NH3 volatilization, NO3 leaning, and denitrification.

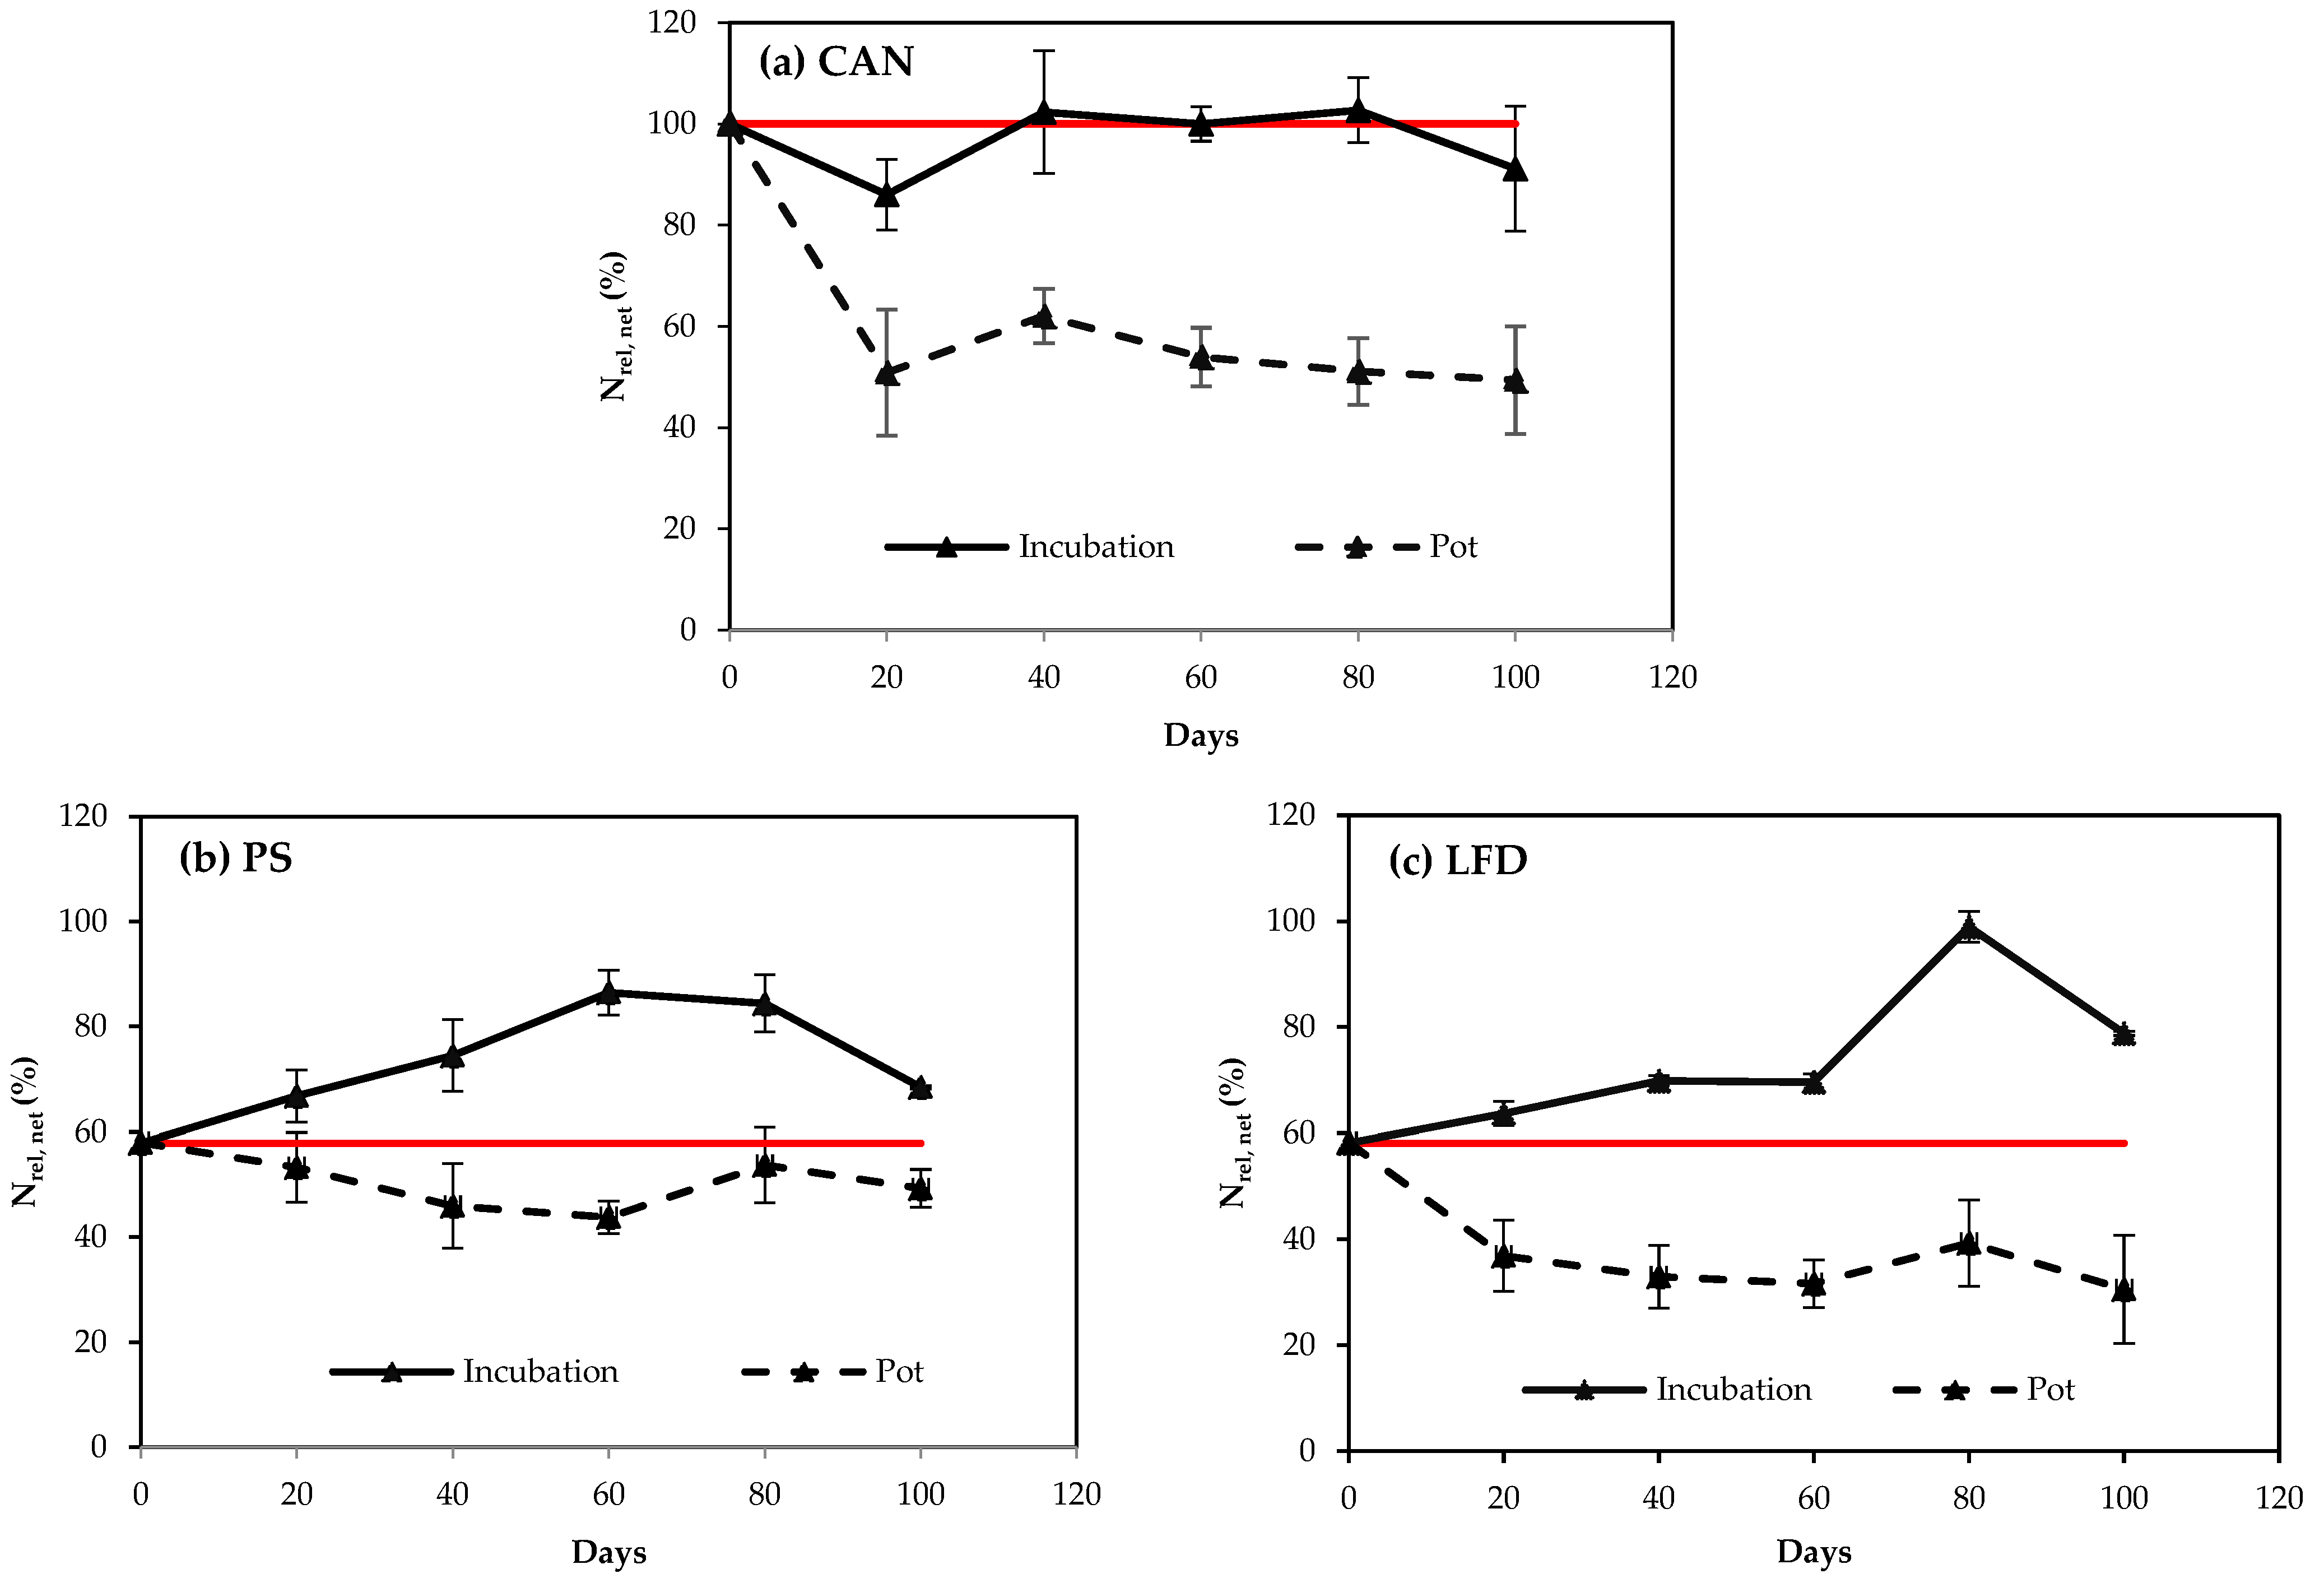
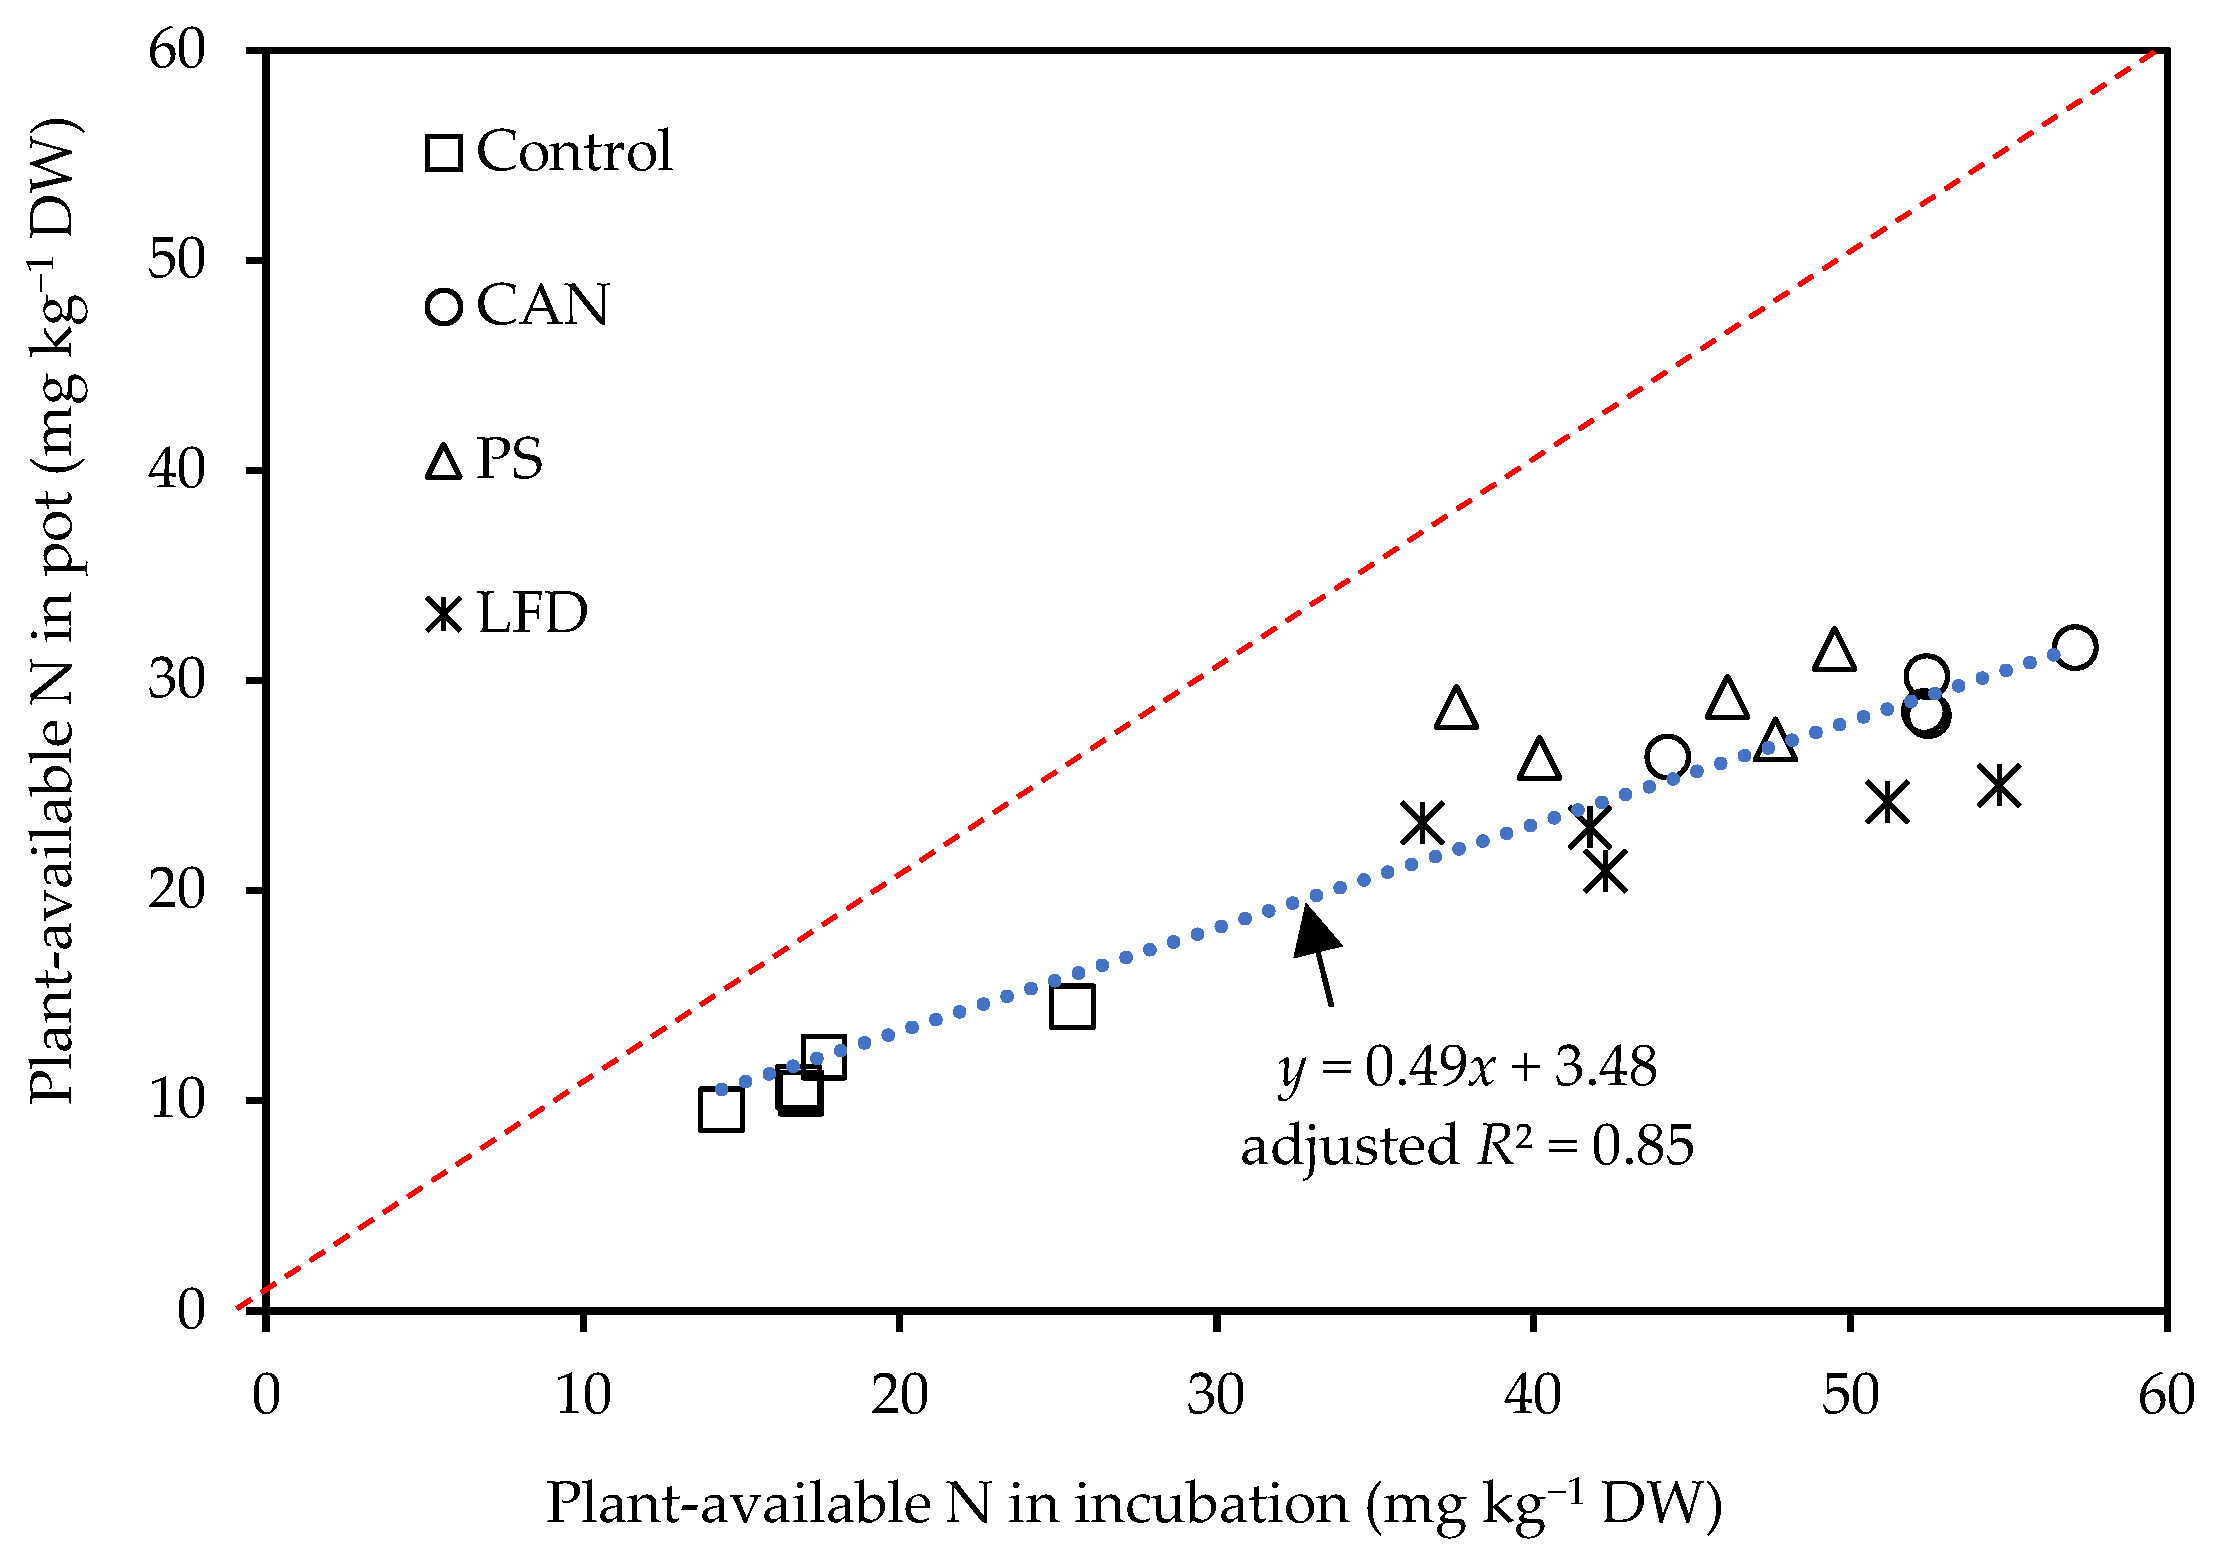
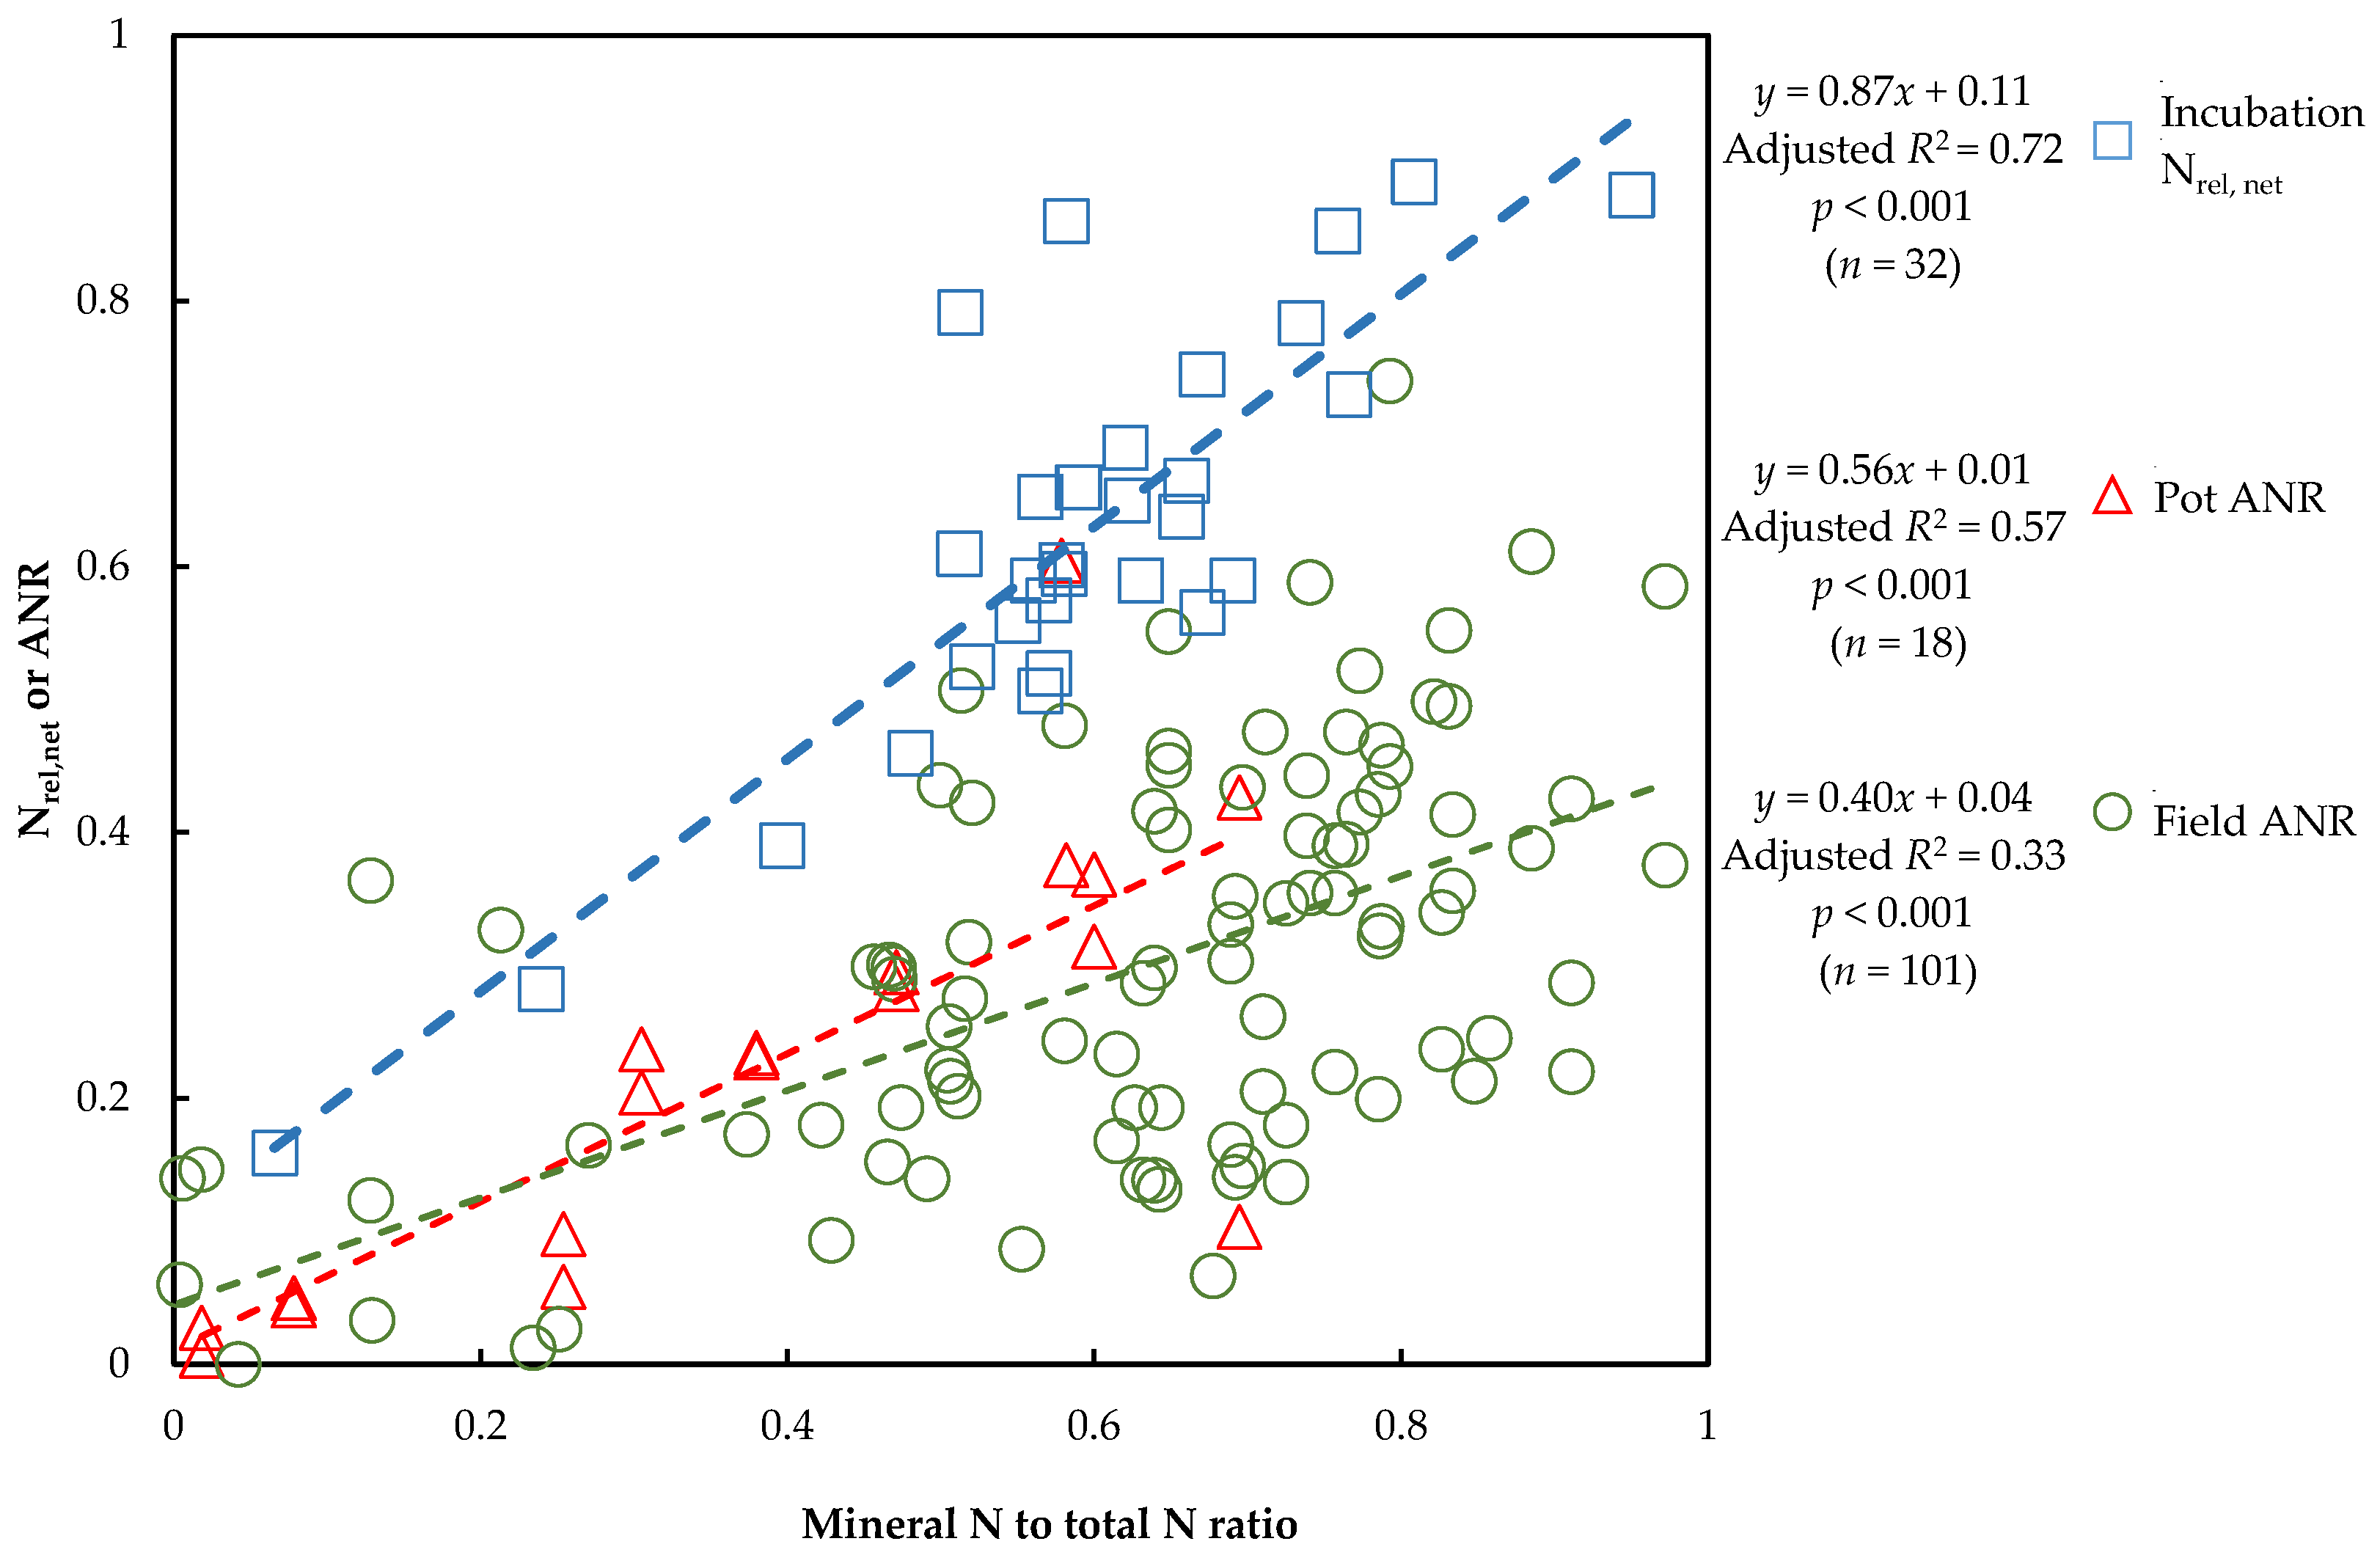
3.4. Link of N Availability between Vegetation and Non-Vegetation

The result of the linear regression (Figure 6) indicated that there was a significant (p < 0.001) relationship between plant-available N in incubation and maize-growing pot. The adjusted R2 value was 0.85, indicating that this model (y = 0.49x + 3.48) could explain 85% of the prediction of the actual N value of applied fertilizers in the planted pot based on mineral N release in laboratory incubation. However, the model estimated that for each unit (mg N kg−1 DW) of the plant-available N released in incubation, there was only 0.49 mg N kg−1 DW increase in the plant-available pool of maize-growing pot.
Apart from the results in this study, we also compiled data from other published studies (Table 3) to compare the estimated N availability from incubation, pot, and field experiments. Linear regression was used to estimate the relationships between the mineral N to total N ratio of biobased fertilizers and the Nrel, net determined by incubation method or ANR determined by plant experiments (pot or field). Significant (p < 0.001) linear regressions were found in all three estimation methods (Figure 7). The value of Nrel, net determined in incubation experiments showed the highest coefficient (y = 0.87x + 0.11) with the mineral N to total N ratio of biobased fertilizers, followed by ANR from pot (y = 0.56x + 0.01) and field (y = 0.40x + 0.04). These models indicated that the estimated N availability of biobased fertilizers based on the mineral N to total N ratio was higher in non-vegetated incubation than plant experiments (pot or field), consistent with the observation in this study.

4. Discussion

4.1. Effect of Vegetation on N Mineralization

In this study, a direct comparison of N dynamics between conditions with and without vegetation was achieved through synchronous investigation using laboratory incubation and maize-growing pots. It ended up with net N mineralization (in PS and LFD treatments) or equilibrium (in CAN treatment) in unplanted incubation but net N immobilization in all fertilized treatments of the maize-growing pot (Figure 4). This indicated a relatively low N recovery from fertilizers to plants (Figure 6), which is in line with the relatively low N use efficiency globally (approximately 40% on average) [48]. This was further confirmed in the literature data (Figure 7) as the ANRs calculated in plant experiments are mostly lower than 0.6 (except one dataset collected from field application of liquid swine manure). The incubation method indicated relatively higher N values at most mineral N to total N ratios than the pot and field experiments. The differences of estimated N availability between the methods mentioned above can be attributed to the higher potential of N loss under field (uncontrolled, with vegetation) conditions than pot trials (controlled, with vegetation) and the least in incubation experiments (controlled, without vegetation). As shown by the N mass balance (Figure 5), a higher amount of N from fertilizers remained unmeasured in the pot rather than in incubation, which indicated the possibility of higher fertilizer N loss under vegetation. Therefore, it suggested that the mineral N to total N ratio or unplanted soil incubation method may not be a realistic predictor for quantitative estimation on the N value of biobased fertilizers (and synthetic mineral N fertilizers) in plant experiments (field or pot).
In a short-term investigation as this experiment, the main pathways for plant-available N loss can include NO3 leaching, NH3 volatilization, denitrification, and microbial immobilization. In the case of this experiment, no N leaching occurred in either incubation or pot setups. The NH3 volatilization loss was assumed to be negligible due to the homogenous mixing of fertilizers and soil [10,49] and the high soil moisture (70% WHC) [50]. However, the presence of maize plants might have increased the losses via microbial immobilization and denitrification. It was reported that the contribution of immobilization to N loss might account for 15–21% of applied N from PS as reported in field application by Sørensen and Amato [51]. Their study also demonstrated by parallel incubation that the N immobilization mainly occurs within the first two weeks after application. Using the 15N isotopic labeling technique, Qian et al. [25] found in a maize-growing experiment that on average, 23% of the 15N (applied as 15NH415NO3) remaining in unplanted soil was assimilated in microbial biomass, with another 13% as non-biomass organic N resulted from the NMIT process; these rates were 16% and 82% in planted soil. This suggested the presence of maize plant enhanced the NMIT rate and resulted in higher microbial immobilization. In the same experiment, increased denitrification losses by 19–57% were also observed under vegetation [25] during early growth stages when the release of root-derived C was the highest. Similarly, Malique et al. [52] observed up to 5.3-fold higher denitrification rates in planted soil than unplanted soil, which was most pronounced on day 10 after transplantation. This is consistent with the high mineral N reductions in maize-growing pots during the first 20 days in this study (Figure 3d,f,h), where the favorable conditions (70% WHC, ~20 °C) together with the high availability of soil NO3 and low uptake by young maize plant may have further promoted the microbial metabolism [53] and denitrification [54,55]. In addition, the rewetting of the air-dried soil at the beginning of this experiment might have reactivated the soil microbial metabolism [56,57] and thus resulted in increased N immobilization under vegetation. Therefore, most of the fertilizer N that remained unmeasured in maize-growing pots (Figure 5b) could be a result of the combined effect of microbial immobilization and denitrification under vegetation. However, it is difficult to conclude the relative contributions of immobilization and denitrification. The mechanism underlying is not fully understood, and more effort is needed to investigate the plant-microorganism interactions on soil N cycle at the root level.

4.2. Effect of Fertilization on N Mineralization

As expected, by the end of incubation, CAN treatment reached the highest Nrel, net (%) as 96.9 ± 5.8%, meaning no significant net N mineralization or immobilization effect. However, the Nrel, net (%) of PS and LFD were higher than the initial mineral N to total N ratio, indicating net N mineralization. These observations are in the range of reported Nrel, net (44–94% of total N) in other studies [10,36,37,58]. The higher Nrel, net (%) of LFD compared to PS can be attributed to the more recalcitrant organic matter presented in LFD due to the decomposition and stabilization of organic matter in the anaerobic digestion process [59]. Dilly [60] suggested that the input of readily decomposable organic matter to soil can increase the proportion of fast-growing microorganisms (r-strategists) that tend to utilize labile C and mineral N to meet their requirements [61,62]. Kirchmann and Lundvall [34] also demonstrated this correlation, concluding that fatty acids acted as an easily decomposable C source for microorganisms, stimulating assimilation of N upon application to soil. Conversely, the input of recalcitrant organic matter can stimulate the growth of slow-growing microorganisms (K-strategists), which increase the decomposition rate of organic matter [63]. Therefore, in the case of incubation, PS might have led to a higher proportion of r-strategists than in LFD treatment, resulting in more mineral N assimilated in microbial biomass.
In the case under vegetation, CAN treatment reached the highest Nrel, net (%) as 49.4 ± 10.7% by the end of the experiment. However, in contrast to incubation, PS treatment under vegetation reached a comparable Nrel, net (%) (49.3 ± 3.6%) to CAN but higher than LFD (30.6 ± 10.2%) (Figure 4). A possible explanation is that root exudates appeared to be a labile C source more favorable for microorganisms than the SOM or added organic matters via fertilizers [20]. Therefore, the easily degradable organic matter from PS performed as an N source and provided more N for microorganisms and plants in the later growth stages, which resulted in higher N uptake in PS treatment than LFD treatment (Figure 3). Overall, as discussed above, the plant-available N in fertilized pots decreased in the initial 20 days. This is consistent with the observation by Alburquerque et al. [10], Abubaker et al. [64], and Kirchmann and Lundvall [34], who reported it as the potential microbial assimilation or denitrification loss due to high microbial activities. Therefore, it is suggested to postpone the application of fertilizers with high mineral N (e.g., CAN in this experiment) to avoid high denitrification loss in the early stages and to better synchronize with the plant N demand [65]. However, in the case of microbial N immobilization, the assimilated N in the initial phase can also benefit by reducing the potential long-term NO3 leaching losses from mineralized N and the residual fertilizer-N effects in the years after application [66].

4.3. Effect of N Deficiency on Plant Growth and N Dynamics

As shown in Section 3.1, pale or drying symptoms starting from leave tips were observed in the maize-growing pot experiment from day 70, which may indicate N deficiency [67]. As proposed by Plénet and Lemaire [68], the critical N concentration required to produce the maximum aerial biomass should reach 3.40% when DW yield is lower than 1 t ha−1 or 3.40 × (DW)−0.37 when DW yield is in the range of 1–22 t ha−1. If converting the unit of DW yields (g plant−1) of maize plant in this experiment into kg ha−1 based on the occupied soil surface (0.008 m2 per plant), the critical N concentrations for this experiment can be calculated (data not shown). It indicated that the shoot N concentrations in all treatments (Table 2) were lower than the calculated critical N concentrations since day 60. These low N concentrations indicated that all the maize plants suffered from N deficiency in the following growth stages. In the unfertilized control treatment, as indicated by the significantly lower N uptake since day 40 (Table 2), the required N for maize plant growth was never met by the released N from the decomposition of SOM from day 20. For fertilized treatments, though a rate of 150 kg total N ha−1 was applied as recommended by the Belgian Soil Service, the total amount of N available for each maize plant in the pot (maximum 235.4 mg in CAN treatment) was less than what might be received in the field (1875–2500 mg calculated from 6–8 plants m−2) due to the less occupied surface area (0.008 m2) in the pot compared to the 0.125–0.167 m2 in the field.
Moreover, there was a possibility that a non-synchronized timing of N mineralization and crop N demand happened due to the N immobilization or denitrification at the early stage when the N uptake was low. Therefore, shortly after day 40, the soil N in this pot experiment was insufficient to support the optimal growth of the maize plant. Therefore, N deficiency and its potential impact on the soil N dynamics suggested that the results from the pot-scale experiment should be taken with caution when transferring to open field practice.
Uptake of mineral nutrients by roots strongly influences the vegetative and reproductive development of the shoots. Usually, nutrient uptake is regulated in response to the demand of shoots [69]. However, when a nutrient is deficient compared to the root uptake capacity, the uptake rate is governed by the nutrient supply rather than by the ability of plants to take up nutrients [70]. Suffering from severe N deficiency, most maize leaves became completely yellow or dried out which resulted in no significant change in FW biomass yields from day 80 to day 100 while the DW yields significantly (p < 0.05) increased (Table 2). Compared to shoots, plant roots exhibit considerable plasticity to the changes in nutrient availability [71] by modifying root growth [72] or root physiological traits [73]. When soil N supply is limited, the length of primary roots, seminal roots, and nodal roots increased to explore a larger soil volume, thus increasing spatial N availability [74]. This was verified by the rapid increase of root FW and DW in control treatment from germination to day 60 (Table 2). As the N-deficient condition becomes severe, the roots focus more on the enhanced growth in primary and nodal roots rather than the elongation of lateral root [75,76]. This resulted in increased assimilation of nutrients in roots, as indicated by the negligible increase of DW (Table 2) but increased N concentrations and significant drops in C/N ratio (Figure 2b) from day 80 to the end.

5. Conclusions

By conducting a laboratory incubation parallel to a maize-growing experiment, this study compared the N dynamics in soil with and without vegetation. Both incubation and pot experiments showed a high potential value of biobased fertilizers to replace synthetic fertilizers. The higher Nrel, net (%) of LFD treatment compared to PS treatment in laboratory incubation supported our second hypothesis. However, further comparison with the maize-growing experiment indicated that the incubation method might have overestimated the N fertilizer value of biobased fertilizer, especially at favorable conditions (70% WHC, ~20 °C) where maize plants growing may have stimulated the microbial activities and led to high N immobilization and denitrification. This led to the inverse order of biomass yields and N uptake as CAN ≥ PS > LFD despite CAN > LFD > PS in incubation N release. The different performances of biobased fertilizers could be attributed to the higher labile C in PS that induced the microbial competition for N in N-rich incubations while serving as an easy decomposable N source in pots. For improved N management in the application of biobased fertilizers, further investigation is needed on the interactions among soil microbes, plants, and the various characteristics of biobased fertilizers.

Author Contributions

Conceptualization, H.L., A.A.R.-A., I.S. and E.M. (Erik Meers); data curation, H.L. and A.A.R.-A.; formal analysis, H.L.; funding acquisition, E.M. (Evi Michels) and E.M. (Erik Meers); investigation, H.L.; methodology, H.L., A.A.R.-A. and I.S.; Project administration, E.M. (Evi Michels) and E.M. (Erik Meers); resources, H.L., A.A.R.-A., I.S., E.M. (Evi Michels), and E.M. (Erik Meers); software, H.L. and I.S.; supervision, A.A.R.-A., I.S., E.M. (Evi Michels), and E.M. (Erik Meers); validation, H.L., A.A.R.-A., I.S. and E.M. (Erik Meers); visualization, H.L.; writing—original draft, H.L.; writing—review and editing, H.L., A.A.R.-A., I.S., E.M. (Evi Michels), and E.M. (Erik Meers). All authors have read and agreed to the published version of the manuscript.

Funding

The research was done as a part of the Nutri2 Cycle project that receives funding from the European Union’s Horizon 2020 Framework Programme for Research and Innovation under Grant Agreement no 773682.

Institutional Review Board Statement

Not applicable.

Informed Consent Statement

Not applicable.

Data Availability Statement

The data presented in this study are openly available in ZENODO at 10.5281/zenodo.5498305.

Conflicts of Interest

The authors declare no conflict of interest.

References

  1. Gilland, B. Is a Haber-Bosch World sustainable? Population, nutrition, cereals, nitrogen and environment. J. Soc. Political Econ. Stud. 2014, 39, 166. [Google Scholar]
  2. Leip, A.; Weiss, F.; Lesschen, J.P.; Westhoek, H. The nitrogen footprint of food products in the European Union. J. Agric. Sci. 2014, 152, 20–33. [Google Scholar] [CrossRef] [Green Version]
  3. Klop, G.; Velthof, G.L.; Van Groenigen, J.W. Application technique affects the potential of mineral concentrates from livestock manure to replace inorganic nitrogen fertilizer. Soil Use Manag. 2012, 28, 468–477. [Google Scholar] [CrossRef]
  4. Sigurnjak, I. Animal Manure Derivatives as Alternatives for Synthetic Nitrogen Fertilizers. Ph.D. Thesis, Faculty of Bioscience Engineering, Ghent University, Ghent, Belgium, 2017. [Google Scholar]
  5. Vaneeckhaute, C.; Meers, E.; Michels, E.; Buysse, J.; Tack, F.M.G. Ecological and economic benefits of the application of bio-based mineral fertilizers in modern agriculture. Biomass Bioenergy 2013, 49, 239–248. [Google Scholar] [CrossRef] [Green Version]
  6. Vaneeckhaute, C.; Ghekiere, G.; Michels, E.; Vanrolleghem, P.A.; Tack, F.M.; Meers, E. Assessing nutrient use efficiency and environmental pressure of macronutrients in biobased mineral fertilizers: A review of recent advances and best practices at field scale. Adv. Agron. 2014, 128, 137–180. [Google Scholar] [CrossRef] [Green Version]
  7. Ma, Q.; Wu, L.; Wang, J.; Ma, J.; Zheng, N.; Hill, P.W.; Chadwick, D.R.; Jones, D.L. Fertilizer regime changes the competitive uptake of organic nitrogen by wheat and soil microorganisms: An in-situ uptake test using 13C, 15N labelling, and 13C-PLFA analysis. Soil Biol. Biochem. 2018, 125, 319–327. [Google Scholar] [CrossRef]
  8. Inselsbacher, E.; Umana, N.H.N.; Stange, F.C.; Gorfer, M.; Schüller, E.; Ripka, K.; Wanek, W. Short-term competition between crop plants and soil microbes for inorganic N fertilizer. Soil Biol. Biochem. 2010, 42, 360–372. [Google Scholar] [CrossRef]
  9. Fontaine, S.; Mariotti, A.; Abbadie, L. The priming effect of organic matter: A question of microbial competition? Soil Biol. Biochem. 2003, 35, 837–843. [Google Scholar] [CrossRef]
  10. Alburquerque, J.A.; de la Fuente, C.; Bernal, M.P. Chemical properties of anaerobic digestates affecting C and N dynamics in amended soils. Agric. Ecosyst. Environ. 2012, 160, 15–22. [Google Scholar] [CrossRef]
  11. Bonanomi, G.; Sarker, T.C.; Zotti, M.; Cesarano, G.; Allevato, E.; Mazzoleni, S. Predicting nitrogen mineralization from organic amendments: Beyond C/N ratio by 13 C-CPMAS NMR approach. Plant Soil 2019, 441, 129–146. [Google Scholar] [CrossRef]
  12. Cheng, W. Rhizosphere priming effect: Its functional relationships with microbial turnover, evapotranspiration, and C–N budgets. Soil Biol. Biochem. 2009, 41, 1795–1801. [Google Scholar] [CrossRef]
  13. Grunert, O.; Robles-Aguilar, A.A.; Hernandez-Sanabria, E.; Schrey, S.D.; Reheul, D.; Van Labeke, M.C.; Vlaeminck, S.E.; Vandekerckhove, T.G.; Mysara, M.; Monsieurs, P.; et al. Tomato plants rather than fertilizers drive microbial community structure in horticultural growing media. Sci. Rep. 2019, 9, 9561. [Google Scholar] [CrossRef] [PubMed]
  14. Bardgett, R.D.; Streeter, T.C.; Bol, R. Soil microbes compete effectively with plants for organic-nitrogen inputs to temperate grasslands. Ecology 2003, 84, 1277–1287. [Google Scholar] [CrossRef]
  15. Ninh, H.T.; Grandy, A.S.; Wickings, K.; Snapp, S.S.; Kirk, W.; Hao, J. Organic amendment effects on potato productivity and quality are related to soil microbial activity. Plant Soil 2015, 386, 223–236. [Google Scholar] [CrossRef]
  16. Vellinga, T.V.; André, G. Sixty years of Dutch nitrogen fertiliser experiments an overview of the effects of soil type fertiliser input management and of developments in time. NJAS Wagening. J. Life Sci. 1999, 47, 215–241. [Google Scholar] [CrossRef]
  17. De Neve, S. Organic matter mineralization as a source of nitrogen. In Advances in Research on Fertilization Management of Vegetable Crops; Springer: Cham, Switzerland, 2017; pp. 65–83. [Google Scholar] [CrossRef]
  18. Rigby, H.; Clarke, B.O.; Pritchard, D.L.; Meehan, B.; Beshah, F.; Smith, S.R.; Porter, N.A. A critical review of nitrogen mineralization in biosolids-amended soil, the associated fertilizer value for crop production and potential for emissions to the environment. Sci. Total Environ. 2016, 541, 1310–1338. [Google Scholar] [CrossRef] [PubMed]
  19. Coskun, D.; Britto, D.T.; Shi, W.; Kronzucker, H.J. How plant root exudates shape the nitrogen cycle. Trends Plant Sci. 2017, 22, 661–673. [Google Scholar] [CrossRef]
  20. Meier, I.C.; Finzi, A.C.; Phillips, R.P. Root exudates increase N availability by stimulating microbial turnover of fast-cycling N pools. Soil Biol. Biochem. 2017, 106, 119–128. [Google Scholar] [CrossRef] [Green Version]
  21. Cesco, S.; Mimmo, T.; Tonon, G.; Tomasi, N.; Pinton, R.; Terzano, R.; Neumann, G.; Weisskopf, L.; Renella, G.; Landi, L.; et al. Plant-borne flavonoids released into the rhizosphere: Impact on soil bio-activities related to plant nutrition. A review. Biol. Fertil. Soils 2012, 48, 123–149. [Google Scholar] [CrossRef]
  22. Palacios, O.A.; Bashan, Y.; de-Bashan, L.E. Proven and potential involvement of vitamins in interactions of plants with plant growth-promoting bacteria—An overview. Biol. Fertil. Soils 2014, 50, 415–432. [Google Scholar] [CrossRef]
  23. Czarnes, S.; Hallett, P.D.; Bengough, A.G.; Young, I.M. Root- and microbial-derived mucilages affect soil structure and water transport. Eur. J. Soil Sci. 2000, 51, 435–443. [Google Scholar] [CrossRef]
  24. Canarini, A.; Dijkstra, F.A. Dry-rewetting cycles regulate wheat carbon rhizodeposition stabilization and nitrogen cycling. Soil Biol. Biochem. 2015, 81, 195–203. [Google Scholar] [CrossRef]
  25. Qian, J.H.; Doran, J.W.; Walters, D.T. Maize plant contributions to root zone available carbon and microbial transformations of nitrogen. Soil Biol. Biochem. 1997, 29, 1451–1462. [Google Scholar] [CrossRef]
  26. Buckwell, A.; Nadeu, E. Nutrient Recovery and Reuse (NRR) in European Agriculture. A Review of the Issues, Opportunities, and Actions; RISE Foundation: Brussels, Belgium, 2016. [Google Scholar]
  27. Möller, K.; Stinner, W.; Deuker, A.; Leithold, G. Effects of different manuring systems with and without biogas digestion on nitrogen cycle and crop yield in mixed organic dairy farming systems. Nutr. Cycl. Agroecosyst. 2008, 82, 209–232. [Google Scholar] [CrossRef]
  28. Shiferaw, B.; Prasanna, B.M.; Hellin, J.; Bänziger, M. Crops that feed the world 6. Past successes and future challenges to the role played by maize in global food security. Food Secur. 2011, 3, 307. [Google Scholar] [CrossRef] [Green Version]
  29. Anderson, J.M.; Ingram, J.S.I. Tropical Soil Biology and Fertility. A Handbook of Methods, 2nd ed.; CAB International: Wallingford, UK, 1993. [Google Scholar]
  30. Van Ranst, E.; Verloo, M.; Demeyer, A.; Pauwels, J.M. Manual for the Soil Chemistry and Fertility Laboratory: Analytical Methods of Soils and Plants, Equipment, and Management of Consumables; NUGI 835: Ghent, Belgium, 1999; pp. 1–243. ISBN 90-76603-01-4. [Google Scholar]
  31. VITO. Bodem-Bepaling van Snel Vrijkomende Organische Stikstof. Available online: https://esites.vito.be/sites/reflabos/2019/Online%20documenten/BAM-deel1-12.pdf (accessed on 7 September 2021).
  32. Kirkham, D.O.N.; Bartholomew, W.V. Equations for following nutrient transformations in soil, utilizing tracer data. Soil Sci. Soc. Am. J. 1954, 18, 33–34. [Google Scholar] [CrossRef]
  33. De Neve, S.; Hofman, G. Modelling N mineralization of vegetable crop residues during laboratory incubations. Soil Biol. Biochem. 1996, 8, 1451–1457. [Google Scholar] [CrossRef]
  34. Kirchmann, H.; Lundvall, A. Relationship between N immobilization and volatile fatty acids in soil after application of pig and cattle slurry. Biol. Fertil. Soils 1993, 15, 161–164. [Google Scholar] [CrossRef]
  35. Sørensen, P.; Weisbjerg, M.R.; Lund, P. Dietary effects on the composition and plant utilization of nitrogen in dairy cattle manure. J. Agric. Sci. 2003, 141, 79–91. [Google Scholar] [CrossRef]
  36. Morvan, T.; Nicolardot, B. Role of organic fractions on C decomposition and N mineralization of animal wastes in soil. Biol. Fertil. Soils 2009, 45, 477–486. [Google Scholar] [CrossRef]
  37. Sigurnjak, I.; De Waele, J.; Michels, E.; Tack, F.; Meers, E.; De Neve, S. Nitrogen release and mineralization potential of derivatives from nutrient recovery processes as substitutes for fossil fuel-based nitrogen fertilizers. Soil Use Manag. 2017, 33, 437–446. [Google Scholar] [CrossRef]
  38. Cavalli, D.; Bechini, L.; Di Matteo, A.; Corti, M.; Ceccon, P.; Marino Gallina, P. Nitrogen availability after repeated additions of raw and anaerobically digested 15N-labelled pig slurry. Eur. J. Soil Sci. 2018, 69, 1044–1055. [Google Scholar] [CrossRef]
  39. Maurer, C.; Seiler-Petzold, J.; Schulz, R.; Müller, J. Short-Term Nitrogen Uptake of Barley from Differently Processed Biogas Digestate in Pot Experiments. Energies 2019, 12, 696. [Google Scholar] [CrossRef] [Green Version]
  40. Díez, J.A.; Hernaiz, P.; Muñoz, M.J.; De la Torre, A.; Vallejo, A. Impact of pig slurry on soil properties water salinization nitrate leaching and crop yield in a four-year experiment in Central Spain. Soil Use Manag. 2004, 20, 444–450. [Google Scholar] [CrossRef] [Green Version]
  41. Chantigny, M.H.; Angers, D.A.; Rochette, P.; Bélanger, G.; Massé, D.; Côté, D. Gaseous nitrogen emissions and forage nitrogen uptake on soils fertilized with raw and treated swine manure. J. Environ. Qual. 2007, 36, 1864–1872. [Google Scholar] [CrossRef] [Green Version]
  42. Chantigny, M.H.; Angers, D.A.; Bélanger, G.; Rochette, P.; Eriksen-Hamel, N.; Bittman, S.; Gasser, M.O. Yield and nutrient export of grain corn fertilized with raw and treated liquid swine manure. Agron. J. 2008, 100, 1303–1309. [Google Scholar] [CrossRef]
  43. Saunders, O.E.; Fortuna, A.M.; Harrison, J.H.; Whitefield, E.; Cogger, C.G.; Kennedy, A.C.; Bary, A.I. Comparison of raw dairy manure slurry and anaerobically digested slurry as N sources for grass forage production. Int. J. Agron. 2012, 2012, 101074. [Google Scholar] [CrossRef]
  44. Gagnon, B.; Ziadi, N.; Chantigny, M.H.; Bélanger, G.; Massé, D.I. Biosolids from treated swine manure and papermill residues affect corn fertilizer value. Agron. J. 2012, 104, 483–492. [Google Scholar] [CrossRef]
  45. Cavalli, D.; Cabassi, G.; Borrelli, L.; Geromel, G.; Bechini, L.; Degano, L.; Gallina, P.M. Nitrogen fertilizer replacement value of undigested liquid cattle manure and digestates. Eur. J. Agron. 2016, 73, 34–41. [Google Scholar] [CrossRef]
  46. Tampio, E.; Salo, T.; Rintala, J. Agronomic characteristics of five different urban waste digestates. J. Environ. Manag. 2016, 169, 293–302. [Google Scholar] [CrossRef] [PubMed]
  47. Federolf, C.P.; Westerschulte, M.; Olfs, H.W.; Broll, G.; Trautz, D. Nitrogen dynamics following slurry injection in maize: Crop development. Nutr. Cycl. Agroecosyst. 2017, 107, 19–31. [Google Scholar] [CrossRef]
  48. Zhang, X.; Davidson, E.A.; Mauzerall, D.L.; Searchinger, T.D.; Dumas, P.; Shen, Y. Managing nitrogen for sustainable development. Nature 2015, 528, 51–59. [Google Scholar] [CrossRef] [PubMed] [Green Version]
  49. de la Fuente, C.; Clemente, R.; Martinez, J.; Bernal, M.P. Optimization of pig slurry application to heavy polluted soils monitoring nitrification processes. Chemosphere 2010, 81, 603–610. [Google Scholar] [CrossRef]
  50. Liu, G.D.; Li, Y.C.; Alva, A.K. High Water Regime Can Reduce Ammonia Volatilization from Soils under Potato Production. Commun. Soil Sci. Plant Anal. 2007, 38, 1203–1220. [Google Scholar] [CrossRef]
  51. Sørensen, P.; Amato, M. Remineralisation and residual effects of N after application of pig slurry to soil. Eur. J. Agron. 2002, 16, 81–95. [Google Scholar] [CrossRef]
  52. Malique, F.; Ke, P.; Boettcher, J.; Dannenmann, M.; Butterbach-Bahl, K. Plant and soil effects on denitrification potential in agricultural soils. Plant Soil 2019, 439, 459–474. [Google Scholar] [CrossRef]
  53. Sierra, J. Temperature and soil moisture dependence of N mineralization in intact soil cores. Soil Biol. Biochem. 1997, 29, 1557–1563. [Google Scholar] [CrossRef]
  54. Philippot, L.; Hallin, S.; Borjesson, G.; Baggs, E.M. Biochemical cycling in the rhizosphere having an impact on global change. Plant Soil 2009, 321, 61–81. [Google Scholar] [CrossRef]
  55. Rummel, P.S.; Well, R.; Pfeiffer, B.; Dittert, K.; Floßmann, S.; Pausch, J. Nitrate uptake and carbon exudation–do plant roots stimulate or inhibit denitrification? Plant Soil 2021, 459, 217–233. [Google Scholar] [CrossRef]
  56. D’haene, K.; Moreels, E.; De Neve, S.; Daguilar, B.C.; Boeckx, P.; Hofman, G.; Van Cleemput, O. Soil properties influencing the denitrification potential of Flemish agricultural soils. Biol. Fertil. Soils 2003, 38, 358–366. [Google Scholar] [CrossRef]
  57. Mikha, M.M.; Rice, C.W.; Milliken, G.A. Carbon and nitrogen mineralization as affected by drying and wetting cycles. Soil Biol. Biochem. 2005, 37, 339–347. [Google Scholar] [CrossRef]
  58. Sigurnjak, I.; Michels, E.; Crappé, S.; Buysens, S.; Biswas, J.K.; Tack, F.M.; De Neve, S.; Meers, E. Does acidification increase the nitrogen fertilizer replacement value of bio-based fertilizers? J. Plant Nutr. Soil Sci. 2017, 180, 800–810. [Google Scholar] [CrossRef]
  59. Möller, K. Effects of anaerobic digestion on soil carbon and nitrogen turnover, N emissions, and soil biological activity. A review. Agron. Sustain. Dev. 2015, 35, 1021–1041. [Google Scholar] [CrossRef]
  60. Dilly, O. Ratios of microbial biomass estimates to evaluate microbial physiology in soil. Biol. Fertil. Soils 2006, 42, 241–246. [Google Scholar] [CrossRef]
  61. Cheng, W.; Johnson, D.W.; Fu, S. Rhizosphere Effects on Decomposition: Controls of Plant Species, Phenology, and Fertilization. Soil Sci. Soc. Am. J. 2003, 67, 1418–1427. [Google Scholar] [CrossRef]
  62. Dijkstra, F.A.; Carrillo, Y.; Pendall, E.; Morgan, J.A. Rhizosphere priming: A nutrient perspective. Front. Microbiol. 2013, 4, 216. [Google Scholar] [CrossRef] [Green Version]
  63. Banerjee, S.; Walder, F.; Büchi, L.; Meyer, M.; Held, A.Y.; Gattinger, A.; Keller, T.; Charles, R.; Van Der Heijden, M.G. Agricultural intensification reduces microbial network complexity and the abundance of keystone taxa in roots. ISME J. 2019, 13, 1722–1736. [Google Scholar] [CrossRef] [PubMed] [Green Version]
  64. Abubaker, J.; Risberg, K.; Jönsson, E.; Dahlin, A.S.; Cederlund, H.; Pell, M. Short-term effects of biogas digestates and pig slurry application on soil microbial activity. Appl. Environ. Soil Sci. 2015. [Google Scholar] [CrossRef] [Green Version]
  65. Maciel de Oliveira, S.; Almeida, R.E.M.D.; Ciampitti, I.A.; Pierozan Junior, C.; Lago, B.C.; Trivelin, P.C.O.; Favarin, J.L. Understanding N timing in corn yield and fertilizer N recovery: An insight from an isotopic labeled-N determination. PLoS ONE 2018, 13, e0192776. [Google Scholar] [CrossRef] [Green Version]
  66. Schröder, J.J.; Uenk, D.; Hilhorst, G.J. Long-term nitrogen fertilizer replacement value of cattle manures applied to cut grassland. Plant Soil 2007, 299, 83–99. [Google Scholar] [CrossRef] [Green Version]
  67. Kumar, P.; Sharma, M.K. Nutrient deficiencies in cereal crops: Maize (Zea mays Linn.). In Nutrient Deficiencies of Field Crops: Guide to Diagnosis and Management; CABI: Rajasthan, India, 2013; pp. 25–45. ISBN 9781780642789. [Google Scholar]
  68. Plénet, D.; Lemaire, G. Relationships between dynamics of nitrogen uptake and dry matter accumulation in maize crops. Determination of critical N concentration. Plant Soil 1999, 216, 65–82. [Google Scholar] [CrossRef]
  69. Peng, Y.; Niu, J.; Peng, Z.; Zhang, F.; Li, C. Shoot growth potential drives N uptake in maize plants and correlates with root growth in the soil. Field Crops Res. 2010, 115, 85–93. [Google Scholar] [CrossRef]
  70. Rengel, Z.; Marschner, P. Nutrient availability and management in the rhizosphere: Exploiting genotypic differences. New Phytol. 2005, 168, 305–312. [Google Scholar] [CrossRef]
  71. Yu, P.; White, P.J.; Hochholdinger, F.; Li, C. Phenotypic plasticity of the maize root system in response to heterogeneous nitrogen availability. Planta 2014, 240, 667–678. [Google Scholar] [CrossRef]
  72. Olmo, M.; Villar, R.; Salazar, P.; Alburquerque, J.A. Changes in soil nutrient availability explain biochar’s impact on wheat root development. Plant Soil 2016, 399, 333–343. [Google Scholar] [CrossRef]
  73. Kou, L.; Guo, D.; Yang, H.; Gao, W.; Li, S. Growth, morphological traits and mycorrhizal colonization of fine roots respond differently to nitrogen addition in a slash pine plantation in subtropical China. Plant Soil 2015, 391, 207–218. [Google Scholar] [CrossRef]
  74. Tian, Q.; Chen, F.; Zhang, F.; Mi, G. Genotypic difference in nitrogen acquisition ability in maize plants is related to the coordination of leaf and root growth. J. Plant Nutr. 2006, 29, 317–330. [Google Scholar] [CrossRef]
  75. Gao, K.; Chen, F.; Yuan, L.; Zhang, F.; Mi, G. A comprehensive analysis of root morphological changes and nitrogen allocation in maize in response to low nitrogen stress. Plant Cell Environ. 2015, 38, 740–750. [Google Scholar] [CrossRef]
  76. Zhang, Y.; Li, T.; Bei, S.; Zhang, J.; Li, X. Growth and Distribution of Maize Roots in Response to Nitrogen Accumulation in Soil Profiles after Long-Term Fertilization Management on a Calcareous Soil. Sustainability 2018, 10, 4315. [Google Scholar] [CrossRef] [Green Version]
Figure 1. Images of maize leaves photographed on day 70. The blue arrows show the yellow and dried leaves. (a) old leaves turned pale or yellowish-green; (b) an inverted “V” or spear-shaped discoloration starting at the tip of the leaf.
Agriculture 11 00870 g001
Figure 2. The C/N ratio (mean ± standard deviation; n = 4) of the shoot (a) and root (b) in maize growing pots, control = no N fertilizer, CAN = calcium ammonium nitrate, PS = pig slurry, LFD = liquid fraction of digestate.
Agriculture 11 00870 g002
Figure 3. Dynamics of plant-available N (mg kg−1 dry weight (DW), mean ± standard deviation; n = 4) in the soil of incubation (a,c,e,g) and maize-growing pot (b,d,f,h) in 100 days. No N fertilizer-control (a,b), calcium ammonium nitrate—CAN (c,d), pig slurry—PS (e,f), and liquid fraction of digestate—LFD (g,h). Data at t = 0 were estimations according to measurements in the control and the fertilizer application rate. In maize-growing pots, total plant-available N was calculated as the sum of mineral N in the soil and N uptake in the roots and shoots.
Agriculture 11 00870 g003
Figure 4. Net N release (%, mean ± standard deviation; n = 4) in laboratory incubation (solid line) and in maize-growing pots (dotted line) under fertilization for 100 days. The red line indicated the values of the initial mineral N to total N ratio. Values observed above the line indicate net N mineralization, while values below the line indicate net N immobilization. CAN = calcium ammonium nitrate (a), PS = pig slurry (b), LFD = liquid fraction of digestate (c).
Agriculture 11 00870 g004
Figure 5. Mass balance of N flow in incubation experiment (a) and maize-growing pot experiment (b) on day 100. The numbers represent the mean value of N concentration (mg N kg−1 soil dry weight (DW)). The soil native N was measured as 360 mg N kg−1 soil DW. The soil mineral N was the mineral N in soil before fertilization, while the mineralized N from soil was calculated from the difference of mineral N content in control and fertilizer treatments between day 100 and day 0. CAN = calcium ammonium nitrate, PS = pig slurry, LFD = liquid fraction of digestate.
Agriculture 11 00870 g005
Figure 6. Regression of the mean concentrations of plant-available N (mg kg−1 DW) in incubation and maize-growing pot. The linear line in red indicates the expected correlation while the linear line in blue indicates the actual correlation. Control = no N fertilizer, CAN = calcium ammonium nitrate, PS = pig slurry, LFD = liquid fraction of digestate.
Agriculture 11 00870 g006
Figure 7. Regressions of the Nrel, net determined by incubation method or ANR determined by plant experiments (field or pot) against the mineral N to total N ratio of biobased fertilizers. The dotted lines indicate their relationship estimated by linear regression. Data were collected from published studies and this study (see Table 3).
Agriculture 11 00870 g007
Table 1. Characterization of biobased fertilizers in fresh weight (FW) basis (mean ± standard deviation; n = 3).
ParametersPig SlurryLiquid Fraction of Digestate
DW (g kg−1)94.0 ± 0.443.0 ± 0.4
OM (g kg−1)63.3 ± 0.625.9 ± 0.1
Total C (g kg−1)23.6 ± 0.511.6 ± 0.2
pH7.07.4
EC (mS cm−1)38.9 ± 0.330.4 ± 0.5
Total N (g kg−1)7.80 ± 0.074.77 ± 0.02
NH4+-N (g kg−1)4.51 ± 0.072.77 ± 0.02
NO3-N (g kg−1)<0.002<0.002
Total P (g kg−1)1.75 ± 0.170.42 ± 0.03
Total K (g kg−1)4.24 ± 0.183.90 ± 0.41
Mineral N to total N ratio0.580.58
Total C to total N ratio3.02.4
DW: dry weight; OM: organic matter; EC: electrical conductivity.
Table 2. Fresh weight (FW), dry weight (DW), and the C assimilation and N uptake of the maize shoots and roots on DW basis (mean ± standard deviation; n = 4). The small letters refer to statistical analyses for each sampling date using one-way ANOVA and post-hoc pair-wise comparisons with a significant difference at the 5% level. Parameters without letter assigned showed no significant difference between treatments. Control = no N fertilizer; CAN = calcium ammonium nitrate, PS = pig slurry, LFD = liquid fraction of digestate.
Growing Days
(Approximate Phenological Stages)
ShootRoot
TreatmentFW (g pot−1)DW (g pot−1)N (mg g−1)C (mg g−1)FW (g pot−1)DW (g pot−1)N (mg g−1)C (mg g−1)
20
(V2)
Control2.3 ± 0.80.18 ± 0.0646 ± 2 b384 ± 22.1 ± 0.70.30 ± 0.0619 ± 3 b276 ± 24 ab
CAN1.9 ± 0.60.15 ± 0.0450 ± 11 ab396 ± 261.6 ± 0.30.22 ± 0.0122 ± 3 ab287 ± 16 ab
PS3.0 ± 0.70.23 ± 0.0556 ± 4 a381 ± 81.8 ± 0.30.25 ± 0.0425 ± 3 a266 ± 18 b
LFD1.5 ± 0.60.12 ± 0.0447 ± 12 b396 ± 161.1 ± 0.50.17 ± 0.0323 ± 6 a300 ± 7 a
40
(V3–V4)
Control18 ± 6 b1.5 ± 0.616 ± 1 b409 ± 48.1 ± 2.10.90 ± 0.2711 ± 1 b327 ± 21
CAN26 ± 9 ab1.9 ± 0.836 ± 6 a405 ± 107.5 ± 1.90.83 ± 0.1919 ± 3 a316 ± 17
PS38 ± 7 a2.9 ± 0.530 ± 5 a415 ± 59.5 ± 1.61.15 ± 0.2217 ± 3 a317 ± 20
LFD29 ± 7 ab1.7 ± 0.333 ± 4 a409 ± 56.8 ± 1.00.75 ± 0.0919 ± 2 a329 ± 14
60
(V5–V6)
Control43 ± 6 c5 ± 1 c8.1 ± 0.4415 ± 215 ± 11.4 ± 0.2 b7.6 ± 0.6381 ± 8 a
CAN85 ± 20 ab10 ± 2 ab11.4 ± 0.1426 ± 314 ± 22.2 ± 0.5 ab9.4 ± 0.6335 ± 17 b
PS100 ± 7 a13 ± 1 a8.4 ± 0.7422 ± 515 ± 12.5 ± 0.3 a8.0 ± 0.2348 ± 12 b
LFD79 ± 10 b9 ± 2 b9.9 ± 1.3420 ± 316 ± 21.9 ± 0.3 b8.8 ± 0.9356 ± 7 ab
80
(VT)
Control49 ± 4 c8 ± 1 c4.9 ± 0.1420 ± 39 ± 1 c1.3 ± 0.3 c6.9 ± 0.6395 ± 8
CAN147 ± 18 a26 ± 4 a4.6 ± 0.5429 ± 120 ± 2 a3.1 ± 0.3 ab6.3 ± 0.3372 ± 21
PS146 ± 4 a26 ± 1 a4.5 ± 0.4430 ± 122 ± 3 a3.5 ± 0.7 a6.5 ± 0.3374 ± 18
LFD122 ± 15 b19 ± 2 b5.1 ± 0.2430 ± 116 ± 3 b2.5 ± 0.5 b6.4 ± 0.1371 ± 21
100
(R1–R3)
Control52 ± 4 c11 ± 1 c4.2 ± 0.1403 ± 10 b10 ± 1 c1.6 ± 0.1 c8.6 ± 0.2377 ± 11
CAN148 ± 7 a32 ± 1 a4.0 ± 0.7423 ± 3 a20 ± 3 a3.3 ± 0.3 a7.4 ± 0.7365 ± 18
PS141 ± 8 a32 ± 2 a4.0 ± 0.3424 ± 1 a21 ± 1 a3.4 ± 0.5 a7.6 ± 0.2382 ± 18
LFD109 ± 15 b24 ± 3 b4.2 ± 0.1418 ± 4 a14 ± 4 b2.2 ± 0.5 b8.1 ± 0.3389 ± 16
Table 3. Literature data source for Figure 7 referring to the estimation of the N value of biobased fertilizer via laboratory incubations and plant experiments (field or pot).
Estimation MethodBiobased FertilizersDurationReferences
Laboratory incubationPig slurry, digested pig slurry, and digested cattle slurry70 days[34]
Dairy cattle slurry84 days[35]
Pig slurry, cattle slurry, farmyard cattle manure, and composted farmyard cattle manure107 days[36]
Pig manure, digestate, liquid fraction of digestate, and mineral concentrate120 days[37]
Pig slurry, and digested pig slurry56 days[38]
Pig slurry and liquid fraction of digestate100 daysThis study
Pot
experiment
Unseparated digestate, and liquid fraction and solid fraction of digestate derived from animal manure or energy crops56 days[39]
Pig slurry and liquid fraction of digestate100 daysThis study
Field
experiment
Pig slurry3 years[40]
Raw or digested liquid swine manure3 years[41]
Raw or digested liquid swine manure3 years[42]
Raw dairy manure slurry and anaerobically digested slurry3 years[43]
Raw liquid swine manure, solid fraction of swine manure, and digestate swine manure3 years[44]
Pig slurry and mineral concentrate2 years[3]
Raw cattle slurry, unseparated digestate, and liquid fraction and solid fraction of digestate3 years[45]
Digestate derived from food waste or municipal solid waste2 years[46]
Liquid fraction of pig manure2 years[47]
Publisher’s Note: MDPI stays neutral with regard to jurisdictional claims in published maps and institutional affiliations.

