Article

Sentinel-2 Imagery Monitoring Vine Growth Related to Topography in a Protected Designation of Origin Region

GIS Research Unit, Laboratory of Soils and Agricultural Chemistry, Department of Natural Resources and Agricultural Engineering, Agricultural University of Athens, 118 55 Athina, Greece
*
Author to whom correspondence should be addressed.
Agriculture 2021, 11(8), 785; https://doi.org/10.3390/agriculture11080785
Submission received: 15 June 2021 / Revised: 29 July 2021 / Accepted: 12 August 2021 / Published: 17 August 2021

Abstract

:
Remote sensing satellite platforms provide accurate temporal and spatial information useful in viticulture with an increasing interest in their use. This study aims to identify the possibilities of freely available and with frequent revisit time Sentinel-2 satellites, to monitor vine growth at regional scale on a vine-growing Protected Designation of Origin (PDO) zone during the growing season of the year 2019. This study aims to: (i) investigate through several Vegetation Indices (VIs) the vine growth differences across the zone and relations with topographic parameters; (ii) identify VIs that best recognize differences on subzones of different climatic conditions; (iii) explore the effectiveness of the Sentinel-2 data monitoring management applications. A total of 27 vineyards were selected for field and satellite data collection. Several VIs have been calculated per vineyard from a 20-date time series dataset. VIs showed high negative correlation with topographic parameter of elevation on the flowering stage. The analysis of variance between the VIs of the subzones showed that these regions have statistically significant differences, that most VIs can expose on the flowering and harvest stage, and only Normalized Difference Vegetation Index (NDVI) and VIs using Red-Edge bands during the veraison period. Sentinel-2 data show great effectiveness on monitoring management applications (tillage and trimming).

1. Introduction

Grapevine (Vitis vinifera L.) is one of the oldest plants cultivated around the world and viticulture, as the sum of the actions needed to produce grapes for wine making, is a significant economic activity in the agriculture sector. Viticulture takes place between the annual isotherms of 10 and 20 °C with Mediterranean climates the best suited for grape cultivation [1]. Agiorgitiko is among the most widely planted red grapes varieties in Greece and one of the more commercially important indigenous Greek varieties [2]. Viticulture of “Agiorgitiko” in the region of Nemea in southern Greece, has been designated as a Protected Designation of Origin (PDO) zone. Product names registered as PDO are those that have the strongest links to the place in which they are made. EU quality policy aims at protecting the names of specific products to promote their unique characteristics linked to their geographical origin as well as traditional know-how [3,4]. According to the E.U. Council Regulation (EC No 510/2006 of 20 March 2006) on the protection of geographical indications and designations of origin, in order for an agricultural product to have the PDO status it must originate and be produced, processed and prepared in that specific geographical area and also have the quality or characteristics of which are essentially or exclusively due to a particular geographical environment with its inherent natural and human factors. According to Brillante et al. [5] designation of origin it refers to a strict regulation with production standards and evaluations in order for PDO products to maintain characteristics of the place and the traditional practices. It is clear that they bring a sense of place, although they most commonly follow political boundaries and not the bowndaries derived from scientific understanding. Vaudour et al. [6] notes that these PDO zones are generally based on pre-existing boundaries and that terroir is sometimes confused with PDO zones, when one or several terroir units may be included in a PDO zone. It is commonplace that geography of the viticulture is important. Each geographical location has a history of producing a unique style of wine made from a particular grape variety [1]. What makes location important is the specific natural environmental and cultural conditions occurring in this place. The French word “terroir” is used to describe homogeneity of all these environmental conditions [5,6], from the soil and its physical and chemical properties [7,8,9] to the local climate [10,11] and the topographic parameters [4,12], along with the cultural environment [13]. Resolution of the International Organization of Vine and Wine (OIV) 333/2010 defines vitivinicultural “terroir” as a concept which refers to an area in which collective knowledge of the interactions between the identifiable physical and biological environment and applied vitivinicultural practices developed, provide distinctive characteristics for the products originating from this area. Hence, the concept of “terroir” has been a subject of research for its relation with viticulture and wine-grape characteristics for many researchers that have conducted studies on the delineation of terroir zones based on the natural environment in a range of scales [6,14], regional [4,15,16,17] and site specific [18,19,20]. Carey et al. [15] show that the main predictors of Cabernet-Sauvignon performance in the Stellenbosch Wine of Origin District were elevation and soil type origin. Towards this point, Fraga et al. [21] found clear distinctions between low- and high-elevation vineyard vigor in Iberian viticultural regions and state that this could be due to the climate-elevation relationship along with the soil water holding capacity reason. Terroir of “Agiorgitiko” in Nemea presents differences in soil and climatic factors between high and low elevation in the study of three vineyards that represent the major soil and climate types of the region [22]. Vine growth could be monitored by remote sensing techniques in order to measure their vegetation status and delineate zones of different growth. Remote sensing in viticulture mainly uses reflectance spectroscopy to measure reflectance electromagnetic radiation at different wavelengths (bands) in the visible region (400–700 nm), near infrared (700–1300 nm), and thermal infrared (7500–15,000 nm). The sensors are mounted on satellites, aircraft and UAVs and produce images of different resolution scales with one pixel representing a few tens of meters to centimeters on the ground. Remote sensing techniques provide a description of grapevine shape, size, and vigor and allow their spatial variability assessment [23]. Over other monitoring techniques, remotely sensed data present advantages, providing data that reflect actual crop conditions over large areas during the whole season, in a punctual, synoptic, and up-to-date manner [24]. Remotely sensed data describe the plant physiology by means of Vegetation Indices (Vis) calculation, such as the most commonly used normalized difference vegetation index (NDVI) [25]. NDVI of vineyards from satellite data have shown strong relation [26] with ground measurements of vineyard leaf area index (LAI) and also, have shown to be sensitive to differences in soil brightness [26]. Soil-adjusted vegetation index (SAVI) [27] and modified soil-adjusted vegetation index (MSAVI) [28] reduce the soil interference and produce more accurate vegetation assessment on low vegetation cover. Furthermore, several VIs such as normalized difference Red-Edge index (NDRE) among others which use the red-edge spectral domain (700–800 nm) have shown to be more sensitive to chlorophyll concentration [29,30,31]. Vegetation indices have been used in some cases to describe and delineate vineyards terroir on regional scale [32,33] and more often to examine vineyard spatial variability [34,35,36,37,38]. Satellite platforms have been used in precision farming for more than three decades. From Landsat 1 launched in 1972 with spatial resolution of 80 m to WorldView 3 in 2014, capable of providing resolutions of 0.30 m in the visible spectra, earth monitoring satellites have been always improving in sensor performance [39]. The constellation of Sentinel-2 satellites (Sentinel-2A and Sentinel-2B) which belong to the Copernicus land monitoring program of ESA, brought spatial resolution of 10 m to free of access multispectral images on a global range [40] and combined with a revisit time of 5 days and great spectral resolution including 3 bands on the Red-Edge spectrum and have set new perspectives in the field of crops monitoring and management [41]. However, the spatial resolution of 10 m sets some limits on crops cultivated in rows because soil and inter-row vegetation introduce additional noise to spectral data. Several studies have been conducted in order to evaluate the effectiveness of Sentinel-2 for monitoring vineyard variability [42,43,44,45,46].
In this study, we use free sentinel-2 data and compare several VIs in order to estimate the usefulness of these satellites in the viticulture sector for operational and monitoring issues in the extent of a PDO zone. In particular, this study has tried to give answers to three different questions. First, to investigate through VIs the vine growth differences across the PDO zone and to explore relations in between topographic parameters, VIs and phenology stages of the studied vineyards. Second, VIs that use Red-Edge (RE) spectrum bands have not been used for delineation of different vineyard terroir in a regional scale; hence we aim to give efforts in this direction and investigate for possible differences of VIs between three subzones of the Nemea PDO zone. Third, we explore the effectiveness of sentinel-2 spatial and temporal resolution to monitor the management applications on vineyards extended in regions with different environment conditions.

2. Materials and Methods
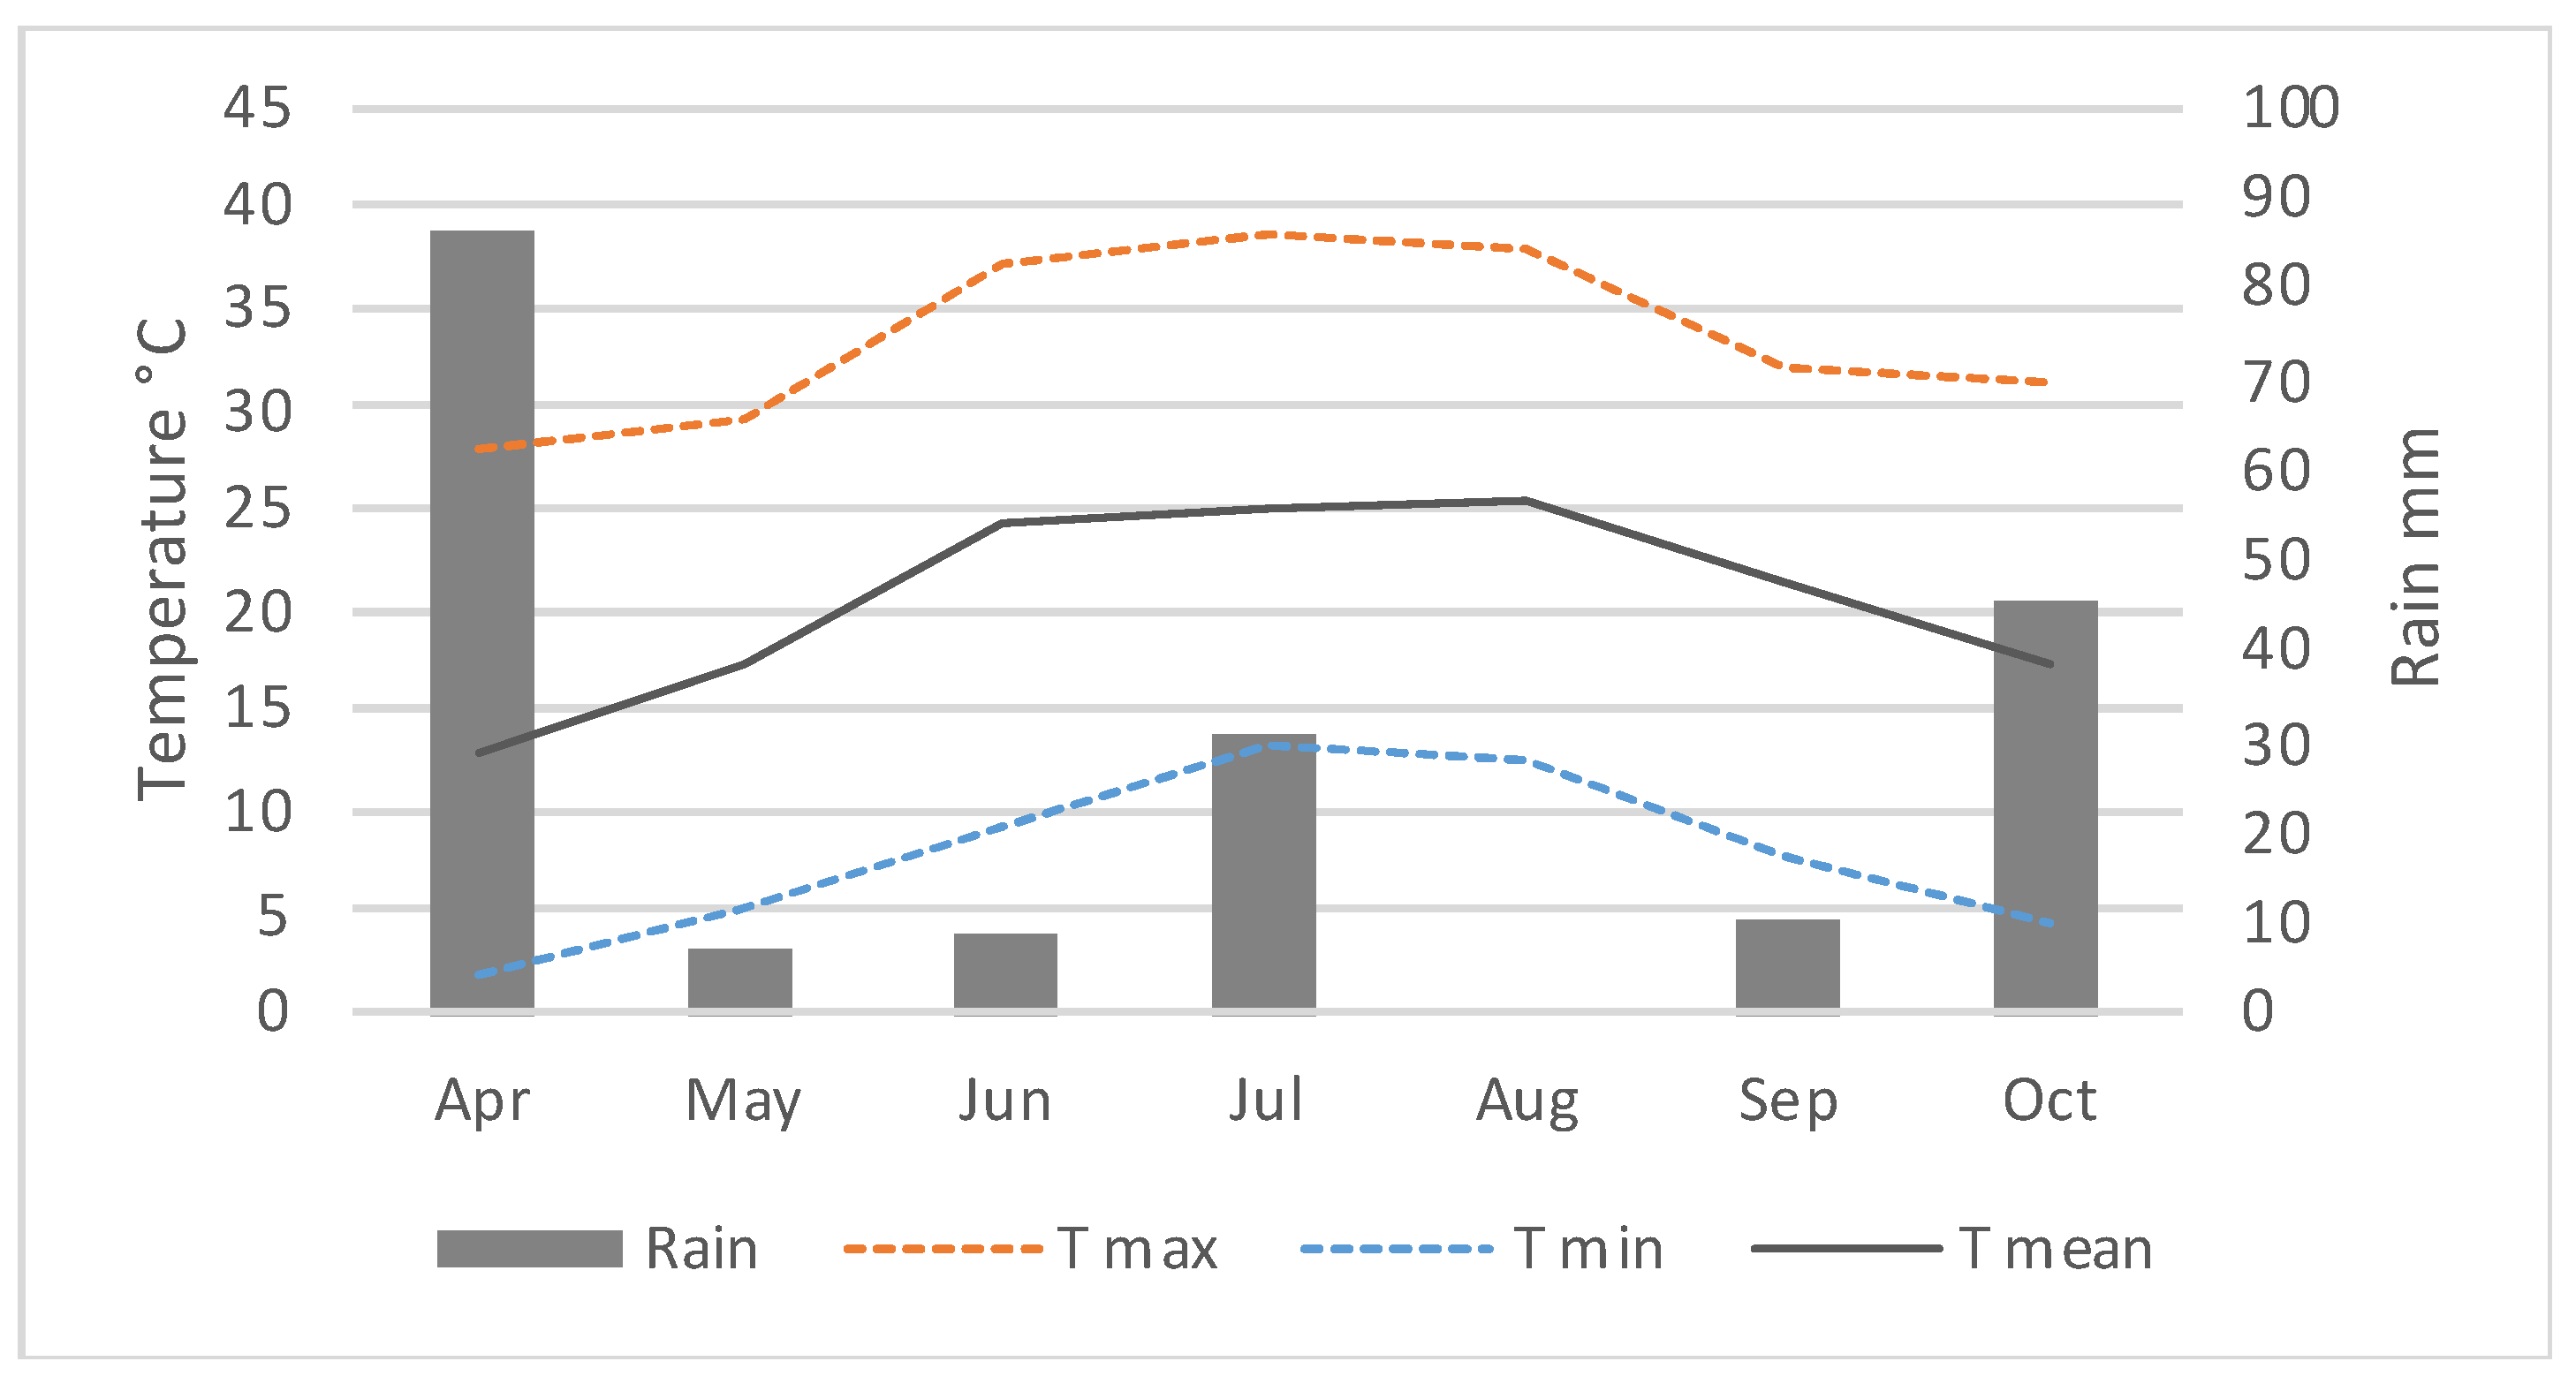
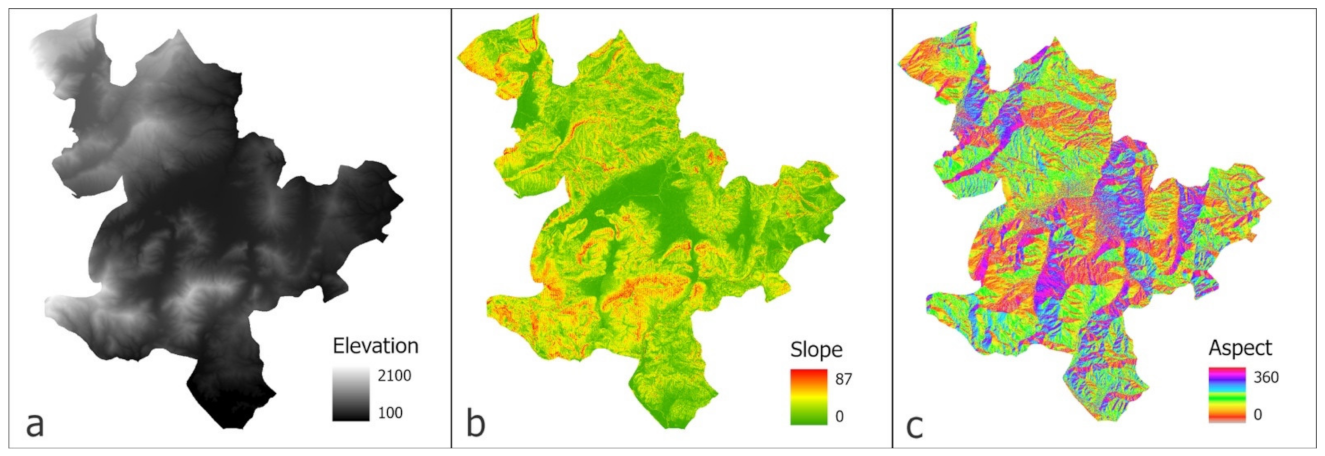
2.1. Study Zone

The study was conducted for the year 2019 at the PDO Nemea vine-growing zone (37°41′–37°57′ N, 22°28′–22°47′ E, WGS 1984) at the Peloponnese peninsula in southern Greece (Figure 1), which is among the most important vine-growing regions in Greece and the largest one for red wines in the country, with a significant network of wineries, 74 in total. The wine-making variety of the zone is “Agiorgitiko”, a variety with great reputation in the wine sector and the main one that this study is based on. The region of the Nemea PDO is characterized by a great variance in topographic attributes and climatic conditions, from viticulture flat areas with elevation of 250 m a.s.l. (above sea level) to inclined areas with steep slopes and elevation of 800 m. The Nemea area has a Mediterranean-type climate with a mean temperature for the growth period of 21.4 °C and a mean annual rainfall of 809 mm (2009–2018). Meteorological data have been provided by the meteorological station of the National Observatory of Athens (NOA) based in the Nemea region. Data for the growth period of the year 2019 (Figure 2) show the typical diverse temporal change of rains and temperatures, along with some incidents of rain in July. Low temperatures with a high rain height give their place to high temperatures in summer with absence of rains and first rains of autumn along with lower temperatures.
All vine parcels selected for this study grow the variety of “Agiorgitiko”, use the same training system with 2.5 m average row interval, they are not irrigated, their age is 20 years on average, while all are older than 10 years. Their selection was equally distributed across the PDO zone, in order to cover all major viticulture areas, along with all the different abiotic characteristics present in these areas, from soil and climate parameters to topographic ones (elevation, slope, aspect). We also took under consideration the vineyards extent in means of total cultivar area and the shape of it. Finally, the absence of extreme conditions, problems of production disturbances and also the viticulture producers’ cooperation also taken into account. In order to meet all the above criteria, 27 parcels were selected.

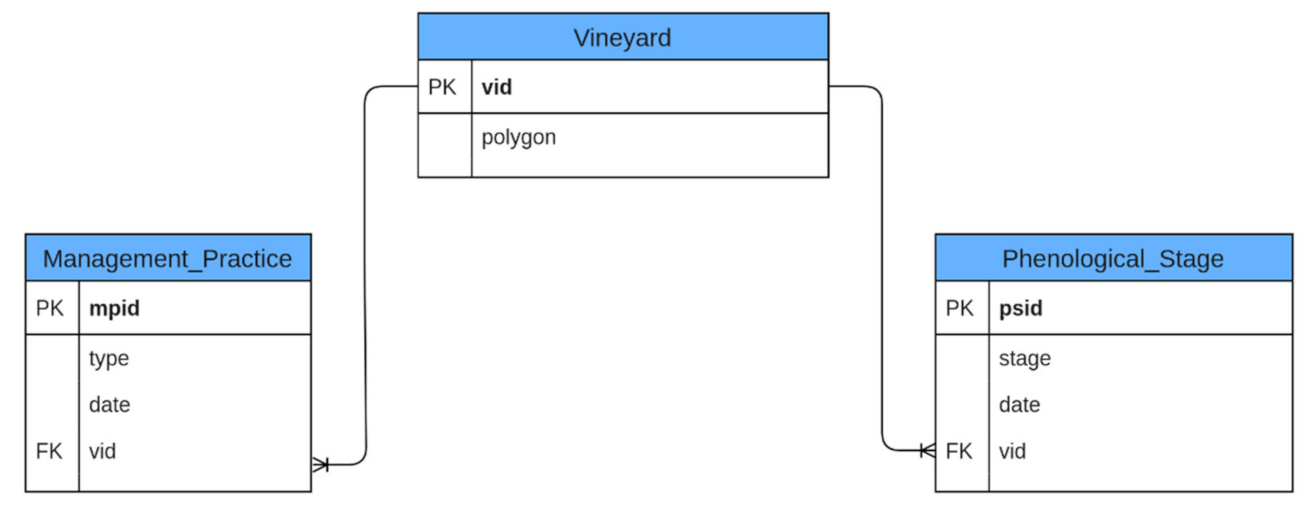
2.2. Vineyards Data Collection

Data collection campaigns of the vine parcels were carried out throughout the growing season of the year 2019. Data collection was conducted by the means of a Vineyard Management Information System (VMIS), in order to have an infrastructure with the same database and all data secure and accessible through this infrastructure.
Data on the main management applications and on phenology events were among the information stored in a Data Base Management System (DBMS). The major phenological events [47,48] of budbreak, flowering, veraison and harvest were recorded. Vine phenology events days were noted when 50% of vine parcels have reached the given phenological event and they are expressed as “day of the year” (DOY), which is the number of days after 1 January. Harvest days have been determined for each vine parcel by the viticulturist or wineries when the sugar concentration has reached the desirable limit.
Figure 3 depicts the relational schema of the database. The Vineyard relation represents a single vine parcel, where the vid is the primary key and the polygon field holds the spatial information of a vineyard. The Management_Practice relation corresponds to a management application taken during the season, where mpid is the primary key, type values can be one of: tillage and trimming, date represents an ISO 8601 formatted date and vid is the foreign key which refers to the Vineyard relation. The Phenological_Stage relation is used to store phenological events, where psid is the primary key and stage values can be one of: budbreak, flowering, veraison and harvest. The use of a database for the collected data was selected because a database: (a) can handle tasks that avoid data redundancy and (b) create a secure and robust environment for the data.

2.3. Satellite Multispectral Imagery

All the imagery data used for this study have been acquired from the constellation of Sentinel-2A and Sentinel-2B. These satellites carry multispectral image sensors for 13 bands in the visible, near infrared (VNIR) and shortwave infrared (SWIR) range of the electromagnetic spectrum, with a high spatial resolution of 10 m, 20 m and 60 m depending on the band [40]; Table 1 presents the bands that have been used in this study. Both satellites combined have a high revisit time of five days under the same viewing conditions, a feature that brings help to precision viticulture [35,38,43,44,45,46] to give insights into spatio-temporal change of vine parcel vigor. With a wide field of view (295 km), they are capable to monitor large areas and provide images to compare vegetation growth in a regional scale [47], at same time with a site-specific monitoring due to their high spatial resolution.
For the studied year 2019 a great number of multispectral images were obtained from the Copernicus Open Access Hub as Level 2A product which are surface reflectance products and are generated with Sen2Cor processor whose main purpose is to correct Sentinel-2 Level-1C products from the effects of the atmosphere [40,49]. The vine growing cycle in the region of Nemea is from April to October. In this period, we were able to obtain a total of 20 datasets of multispectral images referring to 20 dates of the year 2019 without clouds covering the 27 vine parcels of this study. Table 2 presents the dates and the corresponding DOY of the obtained images for 2019. We aim to investigate if this temporal resolution is enough in order to monitor vine management applications of that season.

2.4. Vegetation Indices

Ιn this study, 16 VIs have been calculated using spectral reflectance across the electromagnetic spectrum, from visible (Red, Green, Blue) to near infrared; 10 of them using the Red-Edge bands of Sentinel-2 (Table 3). Specific VIs have been chosen based on reports from the literature for applications on viticulture and also for using the Red-Edge multispectral bands of Sentinel-2.
NDVI is one of the most used vegetation indices for vegetation growth monitoring and studying plant phenology [25,50] it reduces spectral noise caused by certain illumination conditions, topographic variations or cloud shadows [51]. NDVI is strongly affected by the variation of soil optical properties, particularly important for low vegetation cover [26,52]. NDVI has shown strong correlation with vines canopy chlorophyll content and Leaf Area Index (LAI) [30].
MSAVI is a modified version of the SAVI index, which is based on NDVI [28]. These indices use soil-modifying factors (L) to mitigate the soil interference on the index depending to the vegetation cover, with the difference that the SAVI needs to set the factor manually, while MSAVI uses self-adjustment factor and replaces the constant L of SAVI with an empirical function of L [53]. As Wu et al. [53] has noted MSAVI may be more applicable in practice because soil effects are implicitly adjusted according to different vegetation densities and it does not require for calculation any soil parameters. MSAVI was used in this study due to the ability to adjust for the different vegetation coverage between vine parcels and multitemporal images without the requirement of the L factor. Visible and NIR bands of Sentinel-2 have a spatial resolution of 10 m pixel while Red-Edge bands have a resolution of 20 m and because of the classic vine canopy structure cultivated in rows, 10 m pixel is mixed with reflectance from plant vegetation, bare soil and soil covered with herbaceous vegetation that affects biomass estimation with vegetation index [43,54]. Hence, the ability of MSAVI to reduce soil background effects is important for this study.
EVI [55] is an improved vegetation index for monitoring with high sensitivity in high biomass regions. EVI reduces the atmospheric influences with the combination of the Red and Blue band that help to minimize the atmospheric effects. In vines EVI has been used in order to monitor the water stress impact of heat waves [56] and to monitor irrigation [57].
GNDVI [58] is a vegetation index that is based on normalized difference, is more sensitive to chlorophyll concentration than NDVI and it uses the Green band instead of Red. GNDVI is correlated with vineyard yield and quality of grapes [36]. It was used to monitor the recovery after frost in vineyards [59] and to quantify the impact of heat waves on a vineyard [56].
NGRDI is a simple vegetation index with sensitivity in canopy factors, mainly in vegetation density [60]. It uses the Green and Red bands and is sensitive before canopy closure. With the usage of visible spectrum NGRDI was used for detection of vine disease with UAV imagery [61,62].
IRECI [30] is linearly related with chlorophyll vegetation index and was developed for its application in Sentinel-2 imagery. It uses Red and the three Red-Edge bands of Sentinel, capturing the slope in the Red-Edge section.
S2REP (Sentinel Red-Edge position) [30] is sensitive and highly correlated with chlorophyll content and provide accurate characterization of red-edge slope by using Red and the three Red-Edge bands of Sentinel-2.
PSSR [30,63] is linearly correlated with chlorophyll content and with LAI of vines vegetation.
NDI45 [31] uses Red and Red-Edge (band 4 and 5 of Sentinel-2) and has shown linearly high correlation with vines LAI (R = 0.84) and canopy chlorophyll content (R = 0.78) [30].
NDRE is a similar vegetation index to NDVI. Instead of the Red band it uses the Red-Edge. NDRE was shown to be more sensitive for capturing the differences of vegetation in mid-season and harvest time [64]. NDRE shows a phenology related trend after mid-season in vineyard, when NDVI is saturated [65]. Sentinel-2 offers three bands in the Red-Edge region which is important for the retrieval of chlorophyll content and LAI [31]. NDRE2 [66] and NDRE3 [67] are based on normalized difference formula; instead of band 8 of Sentinel-2 they use B6 and B7, respectively. Normalized Red-Edge differences have been used for stress monitoring on rice [68] and they are sensitive to chlorophyll content [69].
Cl Red-Edge [66] and Cl green [70] are used for estimation of various pigments such as total chlorophyll, carotenoid and anthocyanin. The Cl Red-Edge is more sensitive to chlorophyll content of leaves, while Cl green is more sensitive to carotenoid and anthocyanin. Cl Red-Edge and GNDVI were used on vineyard to estimate pigments and chlorophyll absorption [65]. In addition, Cl green was used to identify vineyards and is related to the growth cycle and biophysical parameters of the plant [71].
NDRE6 and Cl Red-Edge6 computed in this study use RE2 (Sentinel-2 B6) which has wavelength center at 740 nm (Table 1) and differs from NDRE and Cl Red-Edge that use RE1 (Sentinel-2 B5).
Table 3. Vegetation indices (VIs) calculations with Sentinel-2 bands and the spectral region of the bands.
VIsSentinel-2 BandsReferenceSpectral Region
NDVI B 8     B 4 B 8 + B 4 [24]NIR, Red
MSAVI 2     B 8   +   1     2     B 8   +   1 2     8     B 8     B 4 2 [25]NIR, Red
EVI 2.5     B 8     B 4 B 8   +   6     B 4     7.5     B 2 + 1 [55]NIR, Red, Blue
Cl green B 8 B 3     1 [70]NIR, Green
GNDVI B 8     B 3 B 8   +   B 3 [58]NIR, Green
NGRDI B 3     B 4 B 3   +   B 4 [60]Red, Green
IRECI B 7     B 4 B 5 / B 6 [30]Red, RE1, RE2, RE3
S2REP 705 + 30     B 4   +   B 7 2     B 5 B 6     B 5 [30]Red, RE1, RE2, RE3
PSSR B 7 B 4 [63]Red, RE3
NDI45 B 5     B 4 B 5   +   B 4 [64]Red, RE1
NDRE B 8     B 5 B 8   +   B 5 [58]NIR, RE1
NDRE6 B 8     B 6 B 8   +   B 6 This studyNIR, RE2
NDRE2 B 6 B 5 B 6   +   B 5 [66]RE1, RE2
NDRE3 B 7     B 5 B 7   +   B 5 [67]RE1, RE3
Cl Red-Edge B 8 B 5     1 [66]NIR, RE1
Cl Red-Edge6 B 8 B 6     1 This studyNIR, RE2

2.5. Data Processing and Statistical Analysis

Each image has been downloaded and checked for disturbances and clouds that would affect the vineyard’s VIs calculation. Resampling of bands with 20 m spatial resolution have been applied with SNAP software using the nearest neighbor method. Sentinel-2 ortho-images come in a UTM34/WGS84 projection for this study area and all of the georeferenced data have been processed in this projection. Sentinel-2 bands have been cropped with a 10 m inner buffer of the vineyards polygons to minimize the effect of pixels that include roads, soil area or other vegetation not belonging to vines plants. In addition, VIs have been calculated only for the inner buffer polygons in order to reduce the processing time of the whole procedure. Furthermore, statistical mean values of each vine parcel’s VI have been generated for each image creating a dataset of VIs statistical mean values time-series for every parcel (Figure 4). Image and spatial data processing have performed with ArcGIS Pro 2.8.1 software (Environmental Systems Research Institute, ESRI).
Since topography plays a significant role in vine growth, a DEM (Digital elevation model) that have been acquired from the Hellenic Cadastre with a spatial resolution of 2 m was used to analyze topographic conditions (Figure 5) in the vineyards participating in this study. Slope and aspect data were derived (using ArcGIS Pro) from the DEM. Statistical mean values of surface elevation, slope and aspect or exposure (the compass direction that a terrain surface faces) for each vine parcel were calculated.
We investigate the spatial distribution of vine growth in the extent of the study region and how topography affect that. The statistical relationship between remote sensing data (VIs time-series dataset) and topographic factors influencing terroir (elevation, slope, aspect, etc.) were examined by Pearson correlation coefficient using linear relationships in order to estimate which VIs show significant correlation with topography and also in which phenology stage. For this reason, we performed analysis on the VIs of the dates that coincide with the four major phenological stages (11 dates).
The high variability on topographic parameters of the PDO zone that affect vine growth have contribute to the discrimination of three subzones based on elevation, according to the specifications of the PDO wine product of the zone [72,73]. Hence, we have grouped the vine parcels accordingly, “group L” up to 380 m, “group M” from 380 m to 600 m and “group H” over 600 m, in order to examine the vegetation status of the vineyards on these 3 elevation groups for statistically significant differences, using descriptive statistics and one-way ANOVA on each VI dataset. The SPSS statistical software (SPSS Inc., Chicago, IL, USA) was used in order to calculate the above statistical data.

3. Results and Discussion

3.1. Vine Parcels Topography, Phenology and Management Applications

A great variability in the studied vineyards topographic characteristics appears (Figure 6). As the elevation parameter is considered, there are 11 parcels from 200 to 380 m, 8 parcels from 380 to 600 m, 6 parcels from 600 to 800 m and finally, from 800 to 1000 m there are 2 parcels, due to the fact that this region is rarely cultivated compared to the other areas. To keep an equal spatial distribution across the PDO zone and the fact that the larger cultivated area of the zone is characterized by lower elevation (200 m to 400 m), we have chosen 11 parcels for this range of elevation. Regarding the slope parameter, ranging 0 to 5 degrees (9 parcels), 5 to 9 degrees (8 parcels) and 9 to 12 degrees (10 parcels) are observed. The analysis of these parameters reveals, as expected, a positive trend of mean slope, as elevation is increased and due to some plateaus on high elevation, some parcels with medium slopes appear. On the contrary, the mean aspect of the 27 parcels shows variability with different orientation aspects across the elevation ranges but with no trend. It is clear that these parcels represent the whole spectrum of elevation appearing in the zone (Figure 6), and thus the different climatic conditions, following an equal distribution across the topographic attributes of the zone.
Phenology stages show amplitude of one month between the 27 study parcels which is in line with the variance of the climate between high and low elevation areas of the PDO zone. This study indicates that the budbreak stage occurs on DOY (day of the year) 102 on average across the zone with a range of 35 days and flowering period on DOY 148 with a range of 36 days. Furthermore, the veraison period of the zone appears to have 31 days range, occurring on DOY 213 on average and the harvest period lasts for 34 days, occurring on DOY 269 on average. Tillage applications duration is 60 days, April to May (DOY 93–153) and last until trimming application in June, which has a duration of 36 days (DOY 145–181).

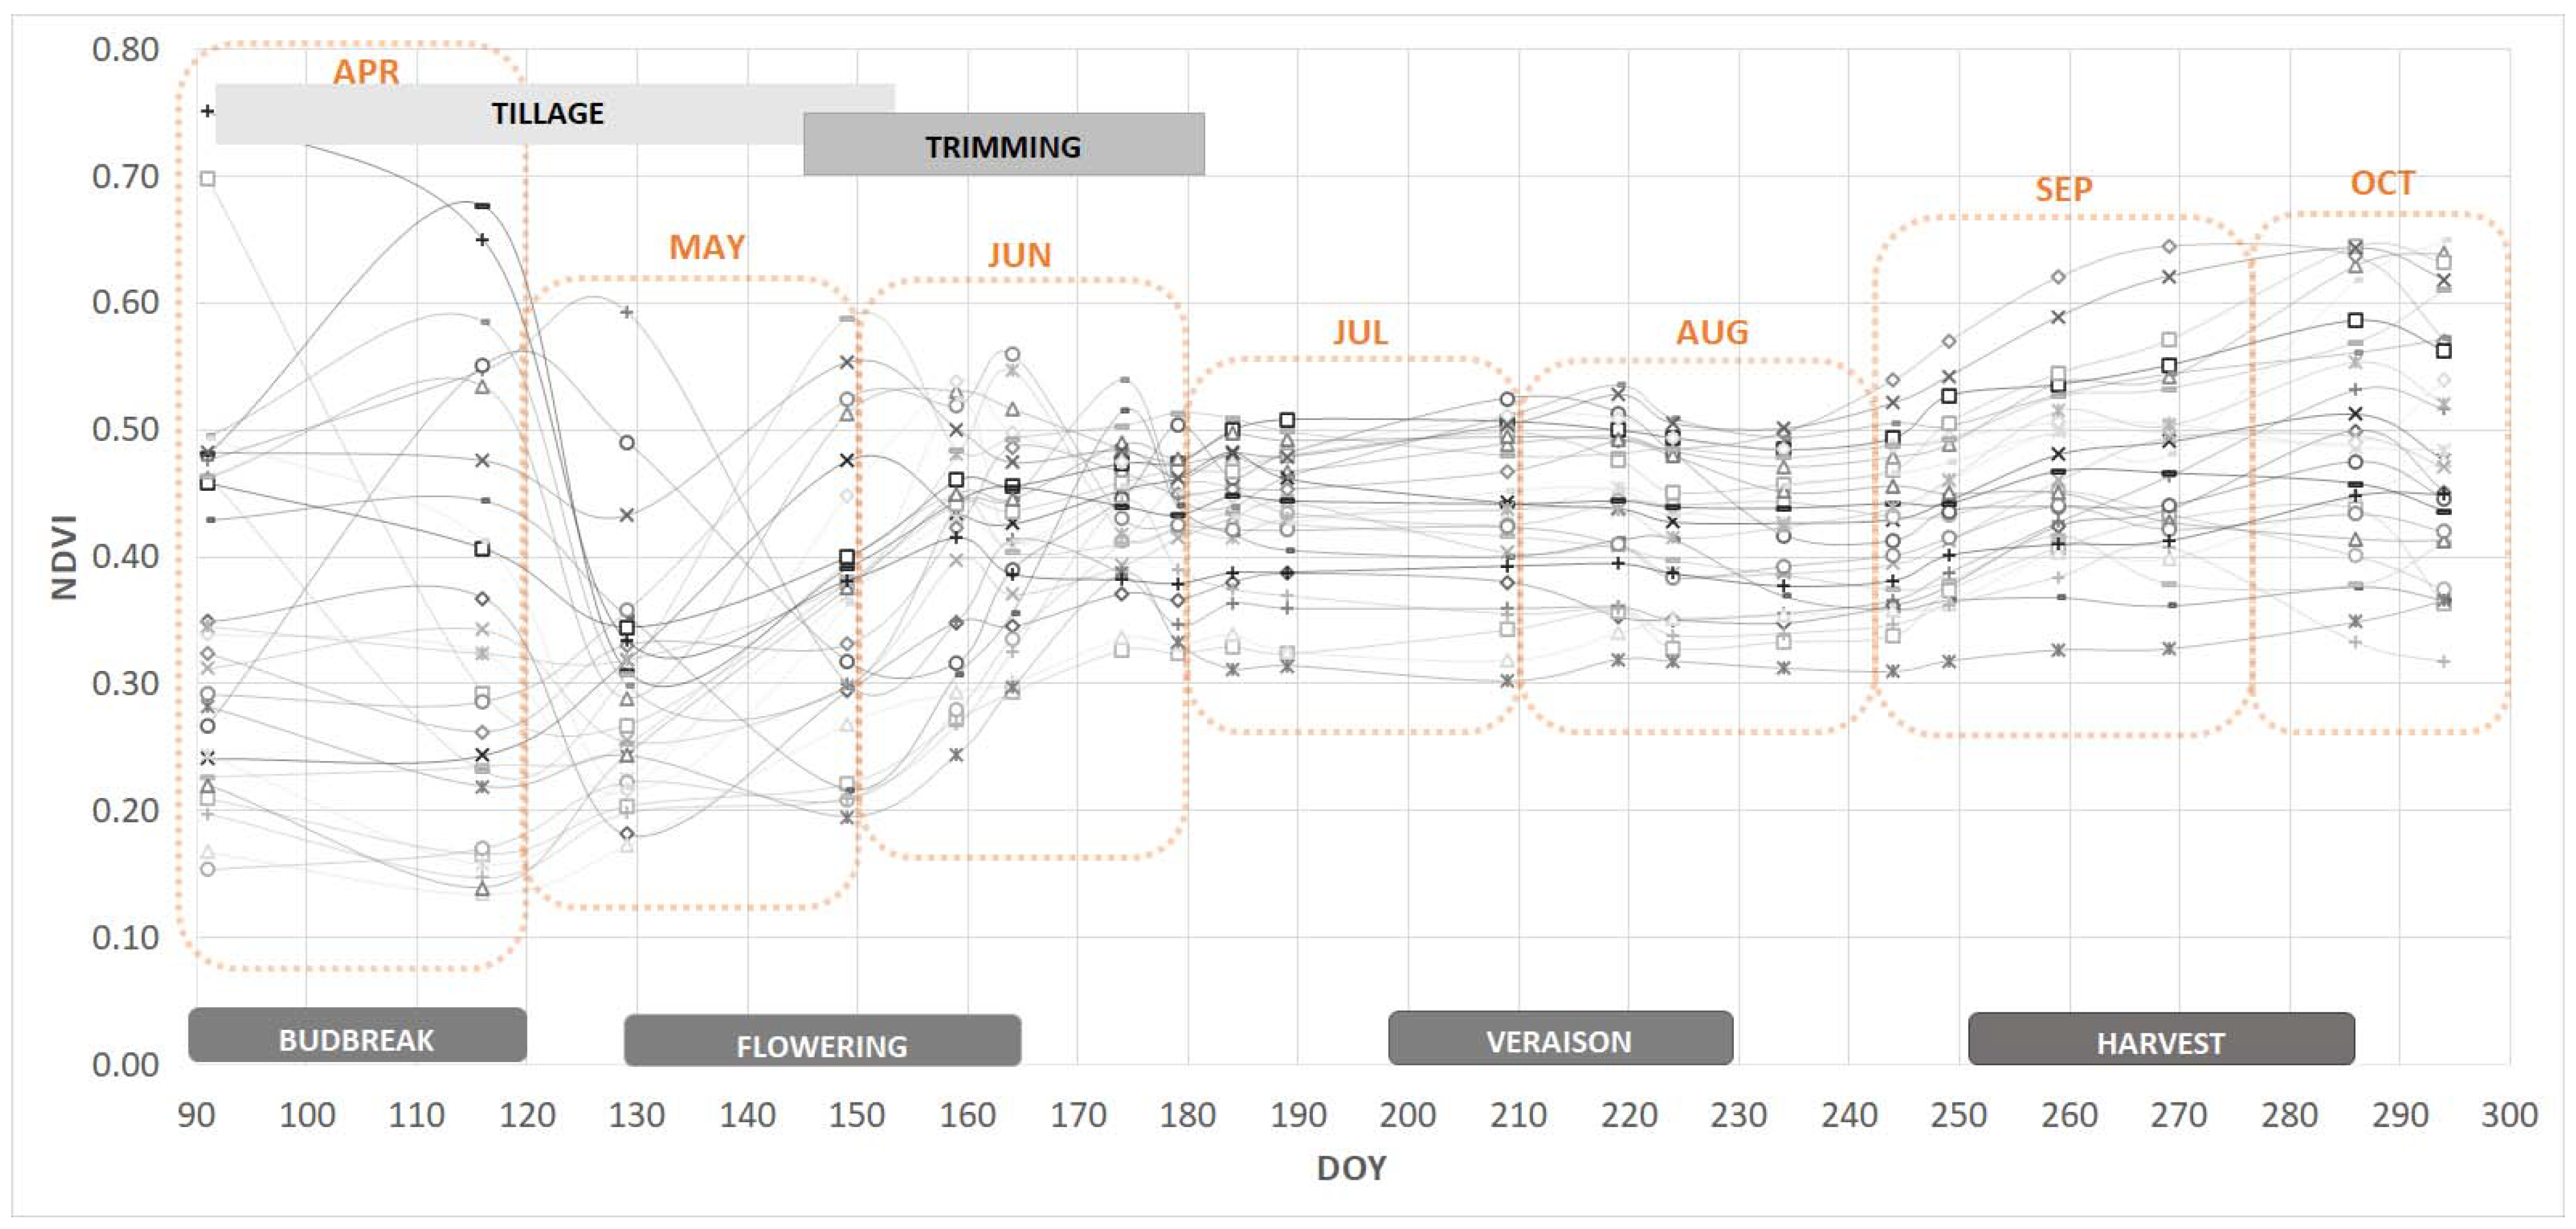
3.2. NDVI Time Series Analysis

At the beginning of the growing season in April (DOY 91) during the phenology stage of budbreak the range of the NDVI91 values of the 27 vine parcels is 0.50 (Figure 7), which is considered to be reasonable concerning the time of the year, when herbaceous vegetation is present between the rows of the vineyards in case that no tillage or other herbicide management practice has been applied. Similar findings between vine parcels have been observed at the beginning of the season by Devaux et al., 2019. The presence of this vegetation varies between parcels and different areas of the PDO zone because of the great differences at elevation but also due to the exact time tillage has been applied.
Furthermore, at DOY 129 in May NDVI129 range is much shorter due to tillage applications and row interval vegetation removal, with most of the parcels between values of 0.17 and 0.36, and only three parcels, which have not been cultivated during that moment, observed with values above this range. Sentinel-2 images appear to be reliable for monitoring soil and herb management tillage practices, in spite of image scarcity at this time of the year due to cloud interference. The next available image at the end of May reveals that the increase in both indices on most of the parcels due to vine vegetation growth coincides with the beginning of the flowering period. Phenology stage of flowering, which begins in May for the study area, follows this increase in NDVI: each parcel’s flowering event day occurs when NDVI is increasing. At the end of May (DOY 149) when tillage applications are ending and vine trimming applications began, the NDVI149 range is between 0.19 and 0.59. All vine parcels at DOY 149 seem to be distributed across the whole range of each index and form groups of low, medium and high values (Figure 7) with no outliers to be observed. This coincides with the average flowering events day (DOY 148) of the studied parcels.
Later in the season at June, when vine trimming was applied, NDVI values range (DOY 159, 164, 174, 179) has been shortened (0.30, 0.26, 0.21, 0.19). This range shortening of NDVI is expected, due to the vine trimming and the growth of parcels which are on higher elevation and have late growth, in contrast to the parcels of lower elevation. Vine trimming as a vine management practice is mandatory so that viticulturists could manage and slow down vines vegetation growth. Vine trimming appears to have affected NDVI temporal dynamic ranges and have produced a stabilization effect from DOY 149 to 179 which refers to the time period of June.
In July and August during the veraison phenology stage NDVI seems to maintain the same range of values (0.20) that had at the beginning of July. In the beginning of September and harvest period NDVI244 has a range of 0.23 and shows a great increase on the next days with NDVI269 to have a range of 0.31, which is similar to the ranges of October. The increase of NDVI is probably due to autumn’s first rains (Figure 2), typical Mediterranean climatic conditions that cause plant growth.

3.3. Vineyard Management Applications Monitoring

All 27 parcels of this study were evaluated as long as the main management operations related to weed and canopy (tillage and trimming) are considered and six parcels were selected for further analysis. The selection was based on the spatial distribution of the parcels across the PDO zone and also according to the elevation variability of the zone in order to cover the major topographic factors of the study area.
NDVI temporal dynamic responses to vine growth for the six parcels of interest (Figure 8) shows decrease when tillage application applied (circles) mostly at the beginning of the season. VIs decrease due to tillage application is reasonable concerning the inter-row vegetation that has been removed. Viticulturists leave parcels 17 and 64 with no tillage appliance at the beginning of the season thus the same NDVI values on the first two images. When vine trimming is implemented (triangles) the next available Sentinel-2 images show this vegetation removal effect, with reduced biomass bringing a decrease in the NDVI value on every parcel. Similar results were found by Devaux et al., 2019 on management applications affecting NDVI temporal changes. The phenology stage of flowering appeared with a time delay between the parcels and coincide with the time period of each parcels NDVI great increase due to vine growth. Hence, the phenology stage of flowering between the parcels of interest could be monitor by the NDVI. The overall performance of the NDVI for the other 21 parcels of this study (graphs not shown here) is quite similar to the six parcels of interest. In these cases, similar observations on reduced NDVI values after tillage and trimming applications have been noticed by this study.

3.4. Relations of Topography and Phenology

Furthermore, among topographic parameters the main driver of phenology event days was the elevation (Table 4), with strong correlation for flowering days (0.720) and medium for budbreak (0.476), veraison (0.411) and harvest (0.554). Similar comments on vine’s phenology relation with elevation have been made also by Rienth et al. [12] at a steep slope viticulture region. Other topographic parameters of slope and aspect did not show any relation with another analysis factor. Between the vine management applications only trimming shows significant correlation with elevation (0.673) and flowering days (0.599), which is rational concerning that trimming follows after the flowering phenology stage has occurred. Results also show that between the phenology events the strongest correlation (0.795) was the one of budbreak with flowering.
All the above support that elevation have great relation with parcels VIs and phenology events days of flowering and veraison, at the late spring early summer period, when the middle of the flowering stage appears and vines vegetation status across the study area have noticeable differences.

3.5. Relations of VIs and Topography

Pearson correlation coefficient analysis between VIs values (mean value per vineyard) and topographic parameters (Table 5) reveals relationship of elevation and slope with most of the VIs. Results show a statistically significant negative relationship (Table 5) between elevation and VIs values for several dates (DOY). Strong negative correlation with elevation values appeared at the flowering stage on DOY 149, DOY 159 and DOY 164 at VIs which use NIR, Red and Red-Edge spectral bands. MSAVI149 (−0.82), Cl Red-Edge6164 (−0.82) and NDRE6164 (−0.82) have shown the most negative results. In addition, GNDVI and Cl green which use NIR and Green spectral bands showed lower correlation coefficient values. These results are in agreement with the relationship of elevation and vegetation growth which is based on the climate and therefore temperature variability, which affect vine growth, while vineyards on lower elevation regions start to grow earlier than vineyards on higher elevation [22].
At veraison (DOY: 209, 219 and 224) the viticulturist have already applied trimming on vines vegetation in order to manage the vine growth in desirable limits that would affect products quality, therefore there is no relation between elevation and VIs. However, only Cl Red-Edge6 and NDRE6 which use the NIR and RE2 spectral bands showed significant correlation with elevation. NDRE6 differs from NDRE only at the Red-Edge band, using RE2 which has wavelength center at 740 nm instead of RE1 at 705 nm of NDRE. These results shows that VIs that use NIR and RE2 can express the influence of elevation on vines vegetation across all the phenology stages, probably due to differences on chlorophyll content of vines vegetation that these bands can capture.
At harvest period (DOY: 259, 269 and 286), vine vegetation has been left to grow again, temperature synergized by the first rains of autumn excel vine growth; therefore, several VIs have again significant correlation with elevation.
Mean slope of vineyards shows a moderate correlation with most VIs at several dates except indices MSAVI and EVI which have as their main feature to reduce soil and atmospheric influences accordingly. GNDVI, Cl green, Cl Red-Edge6, NDRE6 and S2REP showed also statistically significant negative correlation with parcels slope on the dates of veraison (DOY: 209, 219 and 224). Parcels of flat terrains (Figure 9) have deeper and more fertile soils, compared to parcels with high slopes. These negative correlation of VIs with parcels slope might be the consequence of soil parameters variability, where deeper soils give higher water holding capacity, producing more vigorous vine development, such as the findings of Fraga et al. [21] for Iberian viticultural regions. On the contrary, mean aspect of vine parcels did not show any correlation with any of the VIs.

3.6. Subzones VIs Differences

The spatial distribution of the three groups of parcels across the PDO zone (Figure 9) shows parcels of group L accumulating in the valleys, at the center and west region of the PDO zone, areas with flat terrain and low elevation. Parcels of group M appear on the hills with medium elevation and steep slopes at the north-center region and also in the south of the PDO zone. Parcels of group H cover areas of the north-east region, where the highest elevation of the PDO zone appears.
One-way ANOVA analysis between the VIs parcels of each group for every DOY have been conducted and evaluated as for their statistical significance. Table 6 presents VIs that show statistically significant differences between the three groups on at least one DOY of each phenology stage.
At the flowering period (DOY: 149, 159 and 164), all VIs except NGRDI show significant different mean values between the three groups. These results are reasonable since the three subzones correspond to different elevation and therefore to latency on vine growth due to temperature differences between them.
At veraison (DOY: 209, 219 and 224) only NDVI and VIs that use Red-Edge bands show significant differences between the subzones at level of confidence (p < 0.05). VIs of NIR and RE2 show significant confidence at level (p < 0.01). These results show that VIs which use Red-Edge bands and have been shown to capture the chlorophyll content better than others, along with the classic NDVI can identify differences on vines vegetation of the subzones during the veraison period.
At harvest period (DOY: 259, 269 and 286) the differences on vines vegetation between the subzones are significant for most of the VIs except the GNDVI and Cl green which use Green band.

4. Conclusions

This study has used Sentinel-2 imagery to compute several VIs in order to investigate the spatio-temporal vine growth differences across the Nemea PDO zone during the 2019 growing period.
We have computed 16 VIs based on different spectral regions from visual to near infrared; and especially focused on those which use the RE spectral region that Sentinel-2 provide, in contrast with other satellite platforms.
Results show a great variability of the VIs in space and in time, over the PDO zone, which is in line with the great variance of the zone’s topographic parameters. VIs showed high negative correlation with topographic parameter of elevation and slope on the flowering stage. Therefore, VIs have been shown to be an effective way to monitor the spatial distribution of vine growth over the zone, where topography’s role is important and elevation is the main predictor of these vine growth differences. However, at veraison, due to management application that have been applied earlier to the vine canopy, the correlation with topography parameters disappears and only Cl Red-Edge6 and NDRE6 which use NIR and RE2 spectral bands showed significant correlation with elevation and slope. Those two VIs seems to be more sensitive and show relation with topographic parameters for the entire season.
Phenology events days of the vine parcels were also recorded and showed correlation with the elevation of the parcels for budbreak (0.48), flowering (0.72), veraison (0.41) and harvest (0.55) correspondingly. These results are reasonable concerning the relation of elevation with temperature and the effect of the latter on vine phenology, that is responsible for vine growth latency on higher elevation.
Sentinel-2 was useful in order to monitor at regional scale because one image could capture all vineyards at the same time and in the same atmospheric conditions. The multispectral data of Sentinel-2 are robust and freely available, with a temporal resolution suitable for monitoring and assessing vine growth. Spatial resolution of Sentinel-2 (10 m) initial data gave statistical mean values of the whole vine parcel scale that was sufficient enough to monitor the vegetation dynamic responses to management applications (tillage, trimming) and also to discriminate the spatial variability of vine growth on a regional scale between the three subzones. The one-way ANOVA analysis between the VIs of the subzones showed that these regions have statistically significant differences, that most VIs can expose the flowering and harvest stage. In contrast, in the veraison stage, only NDVI and VIs that use Red-Edge bands showed statistically significant differences between the subzones. These results show that Sentinel-2 data with Red-Edge bands can expose differences in the vine vegetation conditions between regions of different topography inside the PDO zone.
Future studies could further examine in more detail the three elevation subzones of the PDO zone as for climate (bioclimatic indices), soil parameters and their possible relations with remote sensing VIs. In addition, VIs that use RE2 of Sentinel-2 need to be examined for correlation with in situ biophysical parameters of vine vegetation.

Author Contributions

Conceptualization, D.T., D.K. and R.G.; methodology, D.T. and D.K.; software, D.T., R.G. and N.L.; formal analysis D.T. and R.G.; investigation, D.T. and N.L.; data curation, D.T. and R.G.; writing—original draft preparation, D.T.; writing—review and editing, D.K.; visualization, D.T. and A.P.; supervision and project administration D.K. All authors have read and agreed to the published version of the manuscript.

Funding

This research has been co-financed by the European Regional Development Fund of the European Union and Greek national funds through the Operational Program Competitiveness, Entrepreneurship and Innovation, under the call RESEARCH—CREATE—INNOVATE (project code: T1EDK-04202).

Institutional Review Board Statement

Not applicable.

Informed Consent Statement

Not applicable.

Conflicts of Interest

The authors declare no conflict of interest.

References

  1. The Geography of Wine; Dougherty, P.H. (Ed.) Springer: Dordrecht, The Netherlands, 2012. [Google Scholar] [CrossRef]
  2. Lazarakis, K. The Wines of Greece; Mitchell Beazley: London, UK, 2005. [Google Scholar]
  3. European Commission Quality Schemes Explained. Available online: https://ec.europa.eu/info/food-farming-fisheries/food-safety-and-quality/certification/quality-labels/quality-schemes-explained_en (accessed on 2 March 2021).
  4. Karlik, L.; Marián, G.; Falťan, V.; Havlíček, M. Vineyard Zonation Based on Natural Terroir Factors Using Multivariate Statistics—Case Study Burgenland (Austria). OENO One 2018, 52, 105–117. [Google Scholar] [CrossRef]
  5. Brillante, L.; Bonfante, A.; Bramley, R.G.V.; Tardaguila, J.; Priori, S. Unbiased Scientific Approaches to the Study of Terroir Are Needed! Front. Earth Sci. 2020, 8, 539377. [Google Scholar] [CrossRef]
  6. Vaudour, E.; Costantini, E.; Jones, G.V.; Mocali, S. An Overview of the Recent Approaches to Terroir Functional Modelling, Footprinting and Zoning. Soil 2015, 1, 287–312. [Google Scholar] [CrossRef] [Green Version]
  7. Bonfante, A.; Basile, A.; Langella, G.; Manna, P.; Terribile, F. A Physically Oriented Approach to Analysis and Mapping of Terroirs. Geoderma 2011, 167–168, 103–117. [Google Scholar] [CrossRef]
  8. Costantini, E.A.C.; Bucelli, P.; Priori, S. Quaternary Landscape History Determines the Soil Functional Characters of Terroir. Quat. Int. 2012, 265, 63–73. [Google Scholar] [CrossRef]
  9. Van Leeuwen, C.; Roby, J.-P.; De Rességuier, L. Soil-Related Terroir Factors: A Review. OENO One 2018, 52, 173–188. [Google Scholar] [CrossRef] [Green Version]
  10. Winkler, A.J. General Viticulture, Rev. and enl. ed.; University of California Press: Berkeley, CA, USA, 1974; ISBN 0-520-02591-1. [Google Scholar]
  11. Gladstones, J.S. Wine, Terroir and Climate Change; Wakefield Press: Kent Town, SA, Australia, 2011; ISBN 978-1-86254-924-1. [Google Scholar]
  12. Rienth, M.; Lamy, F.; Schoenenberger, P.; Noll, D.; Lorenzini, F.; Viret, O.; Zufferey, V. A Vine Physiology-Based Terroir Study in the AOC-Lavaux Region in Switzerland: ITC2020. OENO One 2020, 54, 699–716. [Google Scholar] [CrossRef]
  13. Vaudour, E. The Quality of Grapes and Wine in Relation to Geography: Notions of Terroir at Various Scales. Journal of Wine Research 2002, 13, 117–141. [Google Scholar] [CrossRef]
  14. Bramley, R.G.V.; Ouzman, J.; Trought, M.C.T. Making Sense of a Sense of Place: Precision Viticulture Approaches to the Analysis of Terroir at Different Scales: This Article Is Published in Cooperation with the XIIIth International Terroir Congress 17–18 November 2020, Adelaide, Australia. OENO One 2020, 54, 903–917. [Google Scholar] [CrossRef]
  15. Carey, V.A.; Archer, E.; Barbeau, G.; Saayman, D. Viticultural Terroirs in Stellenbosch, South Africa. III. Spatialisation of Vinicultural and Oenological Potential for Cabernet-Sauvignon and Sauvignon Blanc by Means of a Preliminary Model. OENO One 2009, 43, 1. [Google Scholar] [CrossRef]
  16. Cardoso, A.S.; Alonso, J.; Rodrigues, A.S.; Araújo-Paredes, C.; Mendes, S.; Valín, M.I. Agro-Ecological Terroir Units in the North West Iberian Peninsula Wine Regions. Appl. Geogr. 2019, 107, 51–62. [Google Scholar] [CrossRef]
  17. Czigány, S.; Novák, T.J.; Pirkhoffer, E.; Nagy, G.; Lóczy, D.; Dezső, J.; Fábián, S.Á.; Świtoniak, M.; Charzyński, P. Application of a Topographic Pedosequence in the Villány Hills for Terroir Characterization. HunGeoBull 2020, 69, 245–261. [Google Scholar] [CrossRef]
  18. Bramley, R.G.V.; Hamilton, R.P. Terroir and Precision Viticulture: Are They Compatible ? OENO One 2007, 41, 1. [Google Scholar] [CrossRef]
  19. Bramley, R.G.V.; Ouzman, J.; Boss, P.K. Variation in Vine Vigour, Grape Yield and Vineyard Soils and Topography as Indicators of Variation in the Chemical Composition of Grapes, Wine and Wine Sensory Attributes. Aust. J. Grape Wine Res. 2011, 17, 217–229. [Google Scholar] [CrossRef]
  20. Marciniak, M.; Brown, R.; Reynolds, A.; Jollineau, M. Use of Remote Sensing to Understand the Terroir of the Niagara Peninsula. Applications in a Riesling Vineyard. OENO One 2015, 49, 1. [Google Scholar] [CrossRef] [Green Version]
  21. Fraga, H.; Malheiro, A.C.; Moutinho-Pereira, J.; Cardoso, R.M.; Soares, P.M.M.; Cancela, J.J.; Pinto, J.G.; Santos, J.A. Integrated Analysis of Climate, Soil, Topography and Vegetative Growth in Iberian Viticultural Regions. PLoS ONE 2014, 9, e108078. [Google Scholar] [CrossRef]
  22. Koundouras, S.; Marinos, V.; Gkoulioti, A.; Kotseridis, Y.; van Leeuwen, C. Influence of Vineyard Location and Vine Water Status on Fruit Maturation of Nonirrigated Cv. Agiorgitiko ( Vitis vinifera L.). Effects on Wine Phenolic and Aroma Components. J. Agric. Food Chem. 2006, 54, 5077–5086. [Google Scholar] [CrossRef]
  23. Hall, A.; Lamb, D.W.; Holzapfel, B.; Louis, J. Optical Remote Sensing Applications in Viticulture—A Review. Aust. J. Grape Wine Res. 2002, 8, 36–47. [Google Scholar] [CrossRef]
  24. Sun, L.; Gao, F.; Anderson, M.; Kustas, W.; Alsina, M.; Sanchez, L.; Sams, B.; McKee, L.; Dulaney, W.; White, W.; et al. Daily Mapping of 30 m LAI and NDVI for Grape Yield Prediction in California Vineyards. Remote Sens. 2017, 9, 317. [Google Scholar] [CrossRef] [Green Version]
  25. Rouse, J.W., Jr.; Haas, R.H.; Schell, J.A.; Deering, D.W. Monitoring Vegetation Systems in the Great Plains with ERTS; NASA Special Publication: Washington, DC, USA, 1974; Volume 351, p. 309. [Google Scholar]
  26. Johnson, L.F.; Roczen, D.E.; Youkhana, S.K.; Nemani, R.R.; Bosch, D.F. Mapping Vineyard Leaf Area with Multispectral Satellite Imagery. Comput. Electron. Agric. 2003, 38, 33–44. [Google Scholar] [CrossRef]
  27. Huete, A.R. A Soil-Adjusted Vegetation Index (SAVI). Remote Sens. Environ. 1988, 25, 295–309. [Google Scholar] [CrossRef]
  28. Qi, J.; Chehbouni, A.; Huete, A.R.; Kerr, Y.H.; Sorooshian, S. A Modified Soil Adjusted Vegetation Index. Remote Sens. Environ. 1994, 48, 119–126. [Google Scholar] [CrossRef]
  29. Giovos, R.; Tassopoulos, D.; Kalivas, D.; Lougkos, N.; Priovolou, A. Remote Sensing Vegetation Indices in Viticulture: A Critical Review. Agriculture 2021, 11, 457. [Google Scholar] [CrossRef]
  30. Frampton, W.J.; Dash, J.; Watmough, G.; Milton, E.J. Evaluating the Capabilities of Sentinel-2 for Quantitative Estimation of Biophysical Variables in Vegetation. ISPRS J. Photogramm. Remote Sens. 2013, 82, 83–92. [Google Scholar] [CrossRef] [Green Version]
  31. Delegido, J.; Verrelst, J.; Alonso, L.; Moreno, J. Evaluation of Sentinel-2 Red-Edge Bands for Empirical Estimation of Green LAI and Chlorophyll Content. Sensors 2011, 11, 7063–7081. [Google Scholar] [CrossRef] [Green Version]
  32. Vaudour, E.; Carey, V.A.; Gilliot, J.M. Digital Zoning of South African Viticultural Terroirs Using Bootstrapped Decision Trees on Morphometric Data and Multitemporal SPOT Images. Remote Sens. Environ. 2010, 114, 2940–2950. [Google Scholar] [CrossRef]
  33. Martínez, A.; Gomez-Miguel, V.D. Vegetation Index Cartography as a Methodology Complement to the Terroir Zoning for Its Use in Precision Viticulture. OENO One 2017, 51, 289. [Google Scholar] [CrossRef] [Green Version]
  34. Vélez, S.; Rubio, J.A.; Andrés, M.I.; Barajas, E. Agronomic Classification between Vineyards (’Verdejo’) Using NDVI and Sentinel-2 and Evaluation of Their Wines. VITIS J. Grapevine Res. 2019, 58, 33–38. [Google Scholar] [CrossRef]
  35. Khaliq, A.; Comba, L.; Biglia, A.; Ricauda Aimonino, D.; Chiaberge, M.; Gay, P. Comparison of Satellite and UAV-Based Multispectral Imagery for Vineyard Variability Assessment. Remote Sens. 2019, 11, 436. [Google Scholar] [CrossRef] [Green Version]
  36. Anastasiou, E.; Balafoutis, A.; Darra, N.; Psiroukis, V.; Biniari, A.; Xanthopoulos, G.; Fountas, S. Satellite and Proximal Sensing to Estimate the Yield and Quality of Table Grapes. Agriculture 2018, 8, 94. [Google Scholar] [CrossRef] [Green Version]
  37. Martínez, Á.; Gómez-Miguel, V.D. Terroir Zoning: Influence on Grapevine Response (Vitis vinifera L.) at Within-Vineyard and Between-Vineyard Scale. In Plant Communities and Their Environment; Oliveira, M.T., Candan, F., Fernandes-Silva, A., Eds.; IntechOpen: London, UK, 2020. [Google Scholar] [CrossRef] [Green Version]
  38. Pastonchi, L.; Di Gennaro, S.F.; Toscano, P.; Matese, A. Comparison between Satellite and Ground Data with UAV-Based Information to Analyse Vineyard Spatio-Temporal Variability: This Article Is Published in Cooperation with the XIIIth International Terroir Congress 17–18 November 2020, Adelaide, Australia. Guests Editors: Cassandra Collins and Roberta De Bei. OENO One 2020, 54, 919–934. [Google Scholar] [CrossRef]
  39. Matese, A.; Di Gennaro, S.F. Technology in Precision Viticulture: A State of the Art Review. IJWR 2015, 7, 69–81. [Google Scholar] [CrossRef] [Green Version]
  40. Gascon, F.; Bouzinac, C.; Thépaut, O.; Jung, M.; Francesconi, B.; Louis, J.; Lonjou, V.; Lafrance, B.; Massera, S.; Gaudel-Vacaresse, A.; et al. Copernicus Sentinel-2A Calibration and Products Validation Status. Remote Sens. 2017, 9, 584. [Google Scholar] [CrossRef] [Green Version]
  41. Segarra, J.; Buchaillot, M.L.; Araus, J.L.; Kefauver, S.C. Remote Sensing for Precision Agriculture: Sentinel-2 Improved Features and Applications. Agronomy 2020, 10, 641. [Google Scholar] [CrossRef]
  42. Darra, N.; Psomiadis, E.; Kasimati, A.; Anastasiou, A.; Anastasiou, E.; Fountas, S. Remote and Proximal Sensing-Derived Spectral Indices and Biophysical Variables for Spatial Variation Determination in Vineyards. Agronomy 2021, 11, 741. [Google Scholar] [CrossRef]
  43. Di Gennaro, S.; Dainelli, R.; Palliotti, A.; Toscano, P.; Matese, A. Sentinel-2 Validation for Spatial Variability Assessment in Overhead Trellis System Viticulture Versus UAV and Agronomic Data. Remote Sens. 2019, 11, 2573. [Google Scholar] [CrossRef] [Green Version]
  44. Devaux, N.; Crestey, T.; Leroux, C.; Tisseyre, B. Potential of Sentinel-2 Satellite Images to Monitor Vine Fields Grown at a Territorial Scale. OENO One 2019, 53, 52–59. [Google Scholar] [CrossRef]
  45. Sozzi, M.; Kayad, A.; Marinello, F.; Taylor, J.; Tisseyre, B. Comparing Vineyard Imagery Acquired from Sentinel-2 and Unmanned Aerial Vehicle (UAV) Platform. OENO One 2020, 54, 189–197. [Google Scholar] [CrossRef] [Green Version]
  46. Vélez, S.; Barajas, E.; Rubio, J.A.; Vacas, R.; Poblete-Echeverría, C. Effect of Missing Vines on Total Leaf Area Determined by NDVI Calculated from Sentinel Satellite Data: Progressive Vine Removal Experiments. Appl. Sci. 2020, 10, 3612. [Google Scholar] [CrossRef]
  47. Jones, G.V.; Davis, R.E. Climate Influences on Grapevine Phenology, Grape Composition, and Wine Production and Quality for Bordeaux, France. Am. J. Enol. Vitic. 2000, 51, 249–261. [Google Scholar]
  48. De Rességuier, L.; Mary, S.; Le Roux, R.; Petitjean, T.; Quénol, H.; van Leeuwen, C. Temperature Variability at Local Scale in the Bordeaux Area. Relations with Environmental Factors and Impact on Vine Phenology. Front. Plant Sci. 2020, 11, 515. [Google Scholar] [CrossRef]
  49. Revel, C.; Lonjou, V.; Marcq, S.; Desjardins, C.; Fougnie, B.; Coppolani-Delle Luche, C.; Guilleminot, N.; Lacamp, A.-S.; Lourme, E.; Miquel, C.; et al. Sentinel-2A and 2B Absolute Calibration Monitoring. Eur. J. Remote Sens. 2019, 52, 122–137. [Google Scholar] [CrossRef] [Green Version]
  50. Yan, L.; Roy, D.P. Automated Crop Field Extraction from Multi-Temporal Web Enabled Landsat Data. Remote Sens. Environ. 2014, 144, 42–64. [Google Scholar] [CrossRef] [Green Version]
  51. Huete, A.; Didan, K.; Miura, T.; Rodriguez, E.P.; Gao, X.; Ferreira, L.G. Overview of the Radiometric and Biophysical Performance of the MODIS Vegetation Indices. Remote Sens. Environ. 2002, 83, 195–213. [Google Scholar] [CrossRef]
  52. Baret, F.; Guyot, G. Potentials and Limits of Vegetation Indices for LAI and APAR Assessment. Remote Sens. Environ. 1991, 35, 161–173. [Google Scholar] [CrossRef]
  53. Wu, J.; Wang, D.; Bauer, M.E. Assessing Broadband Vegetation Indices and QuickBird Data in Estimating Leaf Area Index of Corn and Potato Canopies. Field Crops Res. 2007, 102, 33–42. [Google Scholar] [CrossRef]
  54. Wang, Y.; Ryu, D.; Park, S.; Fuentes, S.; O’Connell, M. Upscaling UAV-Borne High Resolution Vegetation Index to Satellite Resolutions over a Vineyard. In Proceeding of 22nd International Congress on Modelling and Simulation, Hobart, Tasmania, Australia, 3–8 December 2017. [Google Scholar]
  55. Huete, A.; Didan, K.; Leeuwen, W.; Jacobson, A.; Solanos, R.; Laing, T. MODIS Vegetation Index (MOD13) Algorithm Theoretical Basis Document. 1999. Available online: https://www.cen.uni-hamburg.de/en/icdc/data/land/docs-land/modis-collection6-vegetation-index-atbd-mod13-v03-1.pdf(accessed (accessed on 9 March 2021).
  56. Cogato, A.; Pagay, V.; Marinello, F.; Meggio, F.; Grace, P.; De Antoni Migliorati, M. Assessing the Feasibility of Using Sentinel-2 Imagery to Quantify the Impact of Heatwaves on Irrigated Vineyards. Remote Sens. 2019, 11, 2869. [Google Scholar] [CrossRef] [Green Version]
  57. Bretreger, D.; Yeo, I.-Y.; Quijano, J.; Awad, J.; Hancock, G.; Willgoose, G. Monitoring Irrigation Water Use over Paddock Scales Using Climate Data and Landsat Observations. Agric. Water Manag. 2019, 221, 175–191. [Google Scholar] [CrossRef]
  58. Gitelson, A.A.; Merzlyak, M.N. Remote Sensing of Chlorophyll Concentration in Higher Plant Leaves. Adv. Space Res. 1998, 22, 689–692. [Google Scholar] [CrossRef]
  59. Cogato, A.; Meggio, F.; Collins, C.; Marinello, F. Medium-Resolution Multispectral Data from Sentinel-2 to Assess the Damage and the Recovery Time of Late Frost on Vineyards. Remote Sens. 2020, 12, 1896. [Google Scholar] [CrossRef]
  60. Hunt, E.R.; Cavigelli, M.; Daughtry, C.S.T.; Mcmurtrey, J.E.; Walthall, C.L. Evaluation of Digital Photography from Model Aircraft for Remote Sensing of Crop Biomass and Nitrogen Status. Precis. Agric. 2005, 6, 359–378. [Google Scholar] [CrossRef]
  61. Kerkech, M.; Hafiane, A.; Canals, R. Deep Leaning Approach with Colorimetric Spaces and Vegetation Indices for Vine Diseases Detection in UAV Images. Comput. Electron. Agric. 2018, 155, 237–243. [Google Scholar] [CrossRef]
  62. Albetis, J.; Duthoit, S.; Guttler, F.; Jacquin, A.; Goulard, M.; Poilvé, H.; Féret, J.-B.; Dedieu, G. Detection of Flavescence Dorée Grapevine Disease Using Unmanned Aerial Vehicle (UAV) Multispectral Imagery. Remote Sens. 2017, 9, 308. [Google Scholar] [CrossRef] [Green Version]
  63. Blackburn, G.A. Quantifying Chlorophylls and Caroteniods at Leaf and Canopy Scales. Remote Sens. Environ. 1998, 66, 273–285. [Google Scholar] [CrossRef]
  64. Maccioni, A.; Agati, G.; Mazzinghi, P. New Vegetation Indices for Remote Measurement of Chlorophylls Based on Leaf Directional Reflectance Spectra. J. Photochem. Photobiol. B Biol. 2001, 61, 52–61. [Google Scholar] [CrossRef]
  65. Brook, A.; De Micco, V.; Battipaglia, G.; Erbaggio, A.; Ludeno, G.; Catapano, I.; Bonfante, A. A Smart Multiple Spatial and Temporal Resolution System to Support Precision Agriculture from Satellite Images: Proof of Concept on Aglianico Vineyard. Remote Sens. Environ. 2020, 240, 111679. [Google Scholar] [CrossRef]
  66. Gitelson, A.A.; Gritz, Y.; Merzlyak, M.N. Relationships between Leaf Chlorophyll Content and Spectral Reflectance and Algorithms for Non-Destructive Chlorophyll Assessment in Higher Plant Leaves. J. Plant Physiol. 2003, 160, 271–282. [Google Scholar] [CrossRef]
  67. Barnes, E.; Clarke, T.; Richards, S.E.; Colaizzi, P.; Haberland, J.; Kostrzewski, M.; Waller, P.; Choi, C.; Riley, E.; Thompson, T.; et al. Coincident Detection of Crop Water Stress, Nitrogen Status and Canopy Density Using Ground-Based Multispectral Data. In Proceedings of the Fifth International Conference on Precision Agriculture; ASA-CSSA-SSSA: Madison, WI, USA, 2000. [Google Scholar]
  68. Liu, M.; Wang, T.; Skidmore, A.K.; Liu, X.; Li, M. Identifying Rice Stress on a Regional Scale from Multi-Temporal Satellite Images Using a Bayesian Method. Environ. Pollut. 2019, 247, 488–498. [Google Scholar] [CrossRef]
  69. Liu, M.; Wang, T.; Skidmore, A.K.; Liu, X. Heavy Metal-Induced Stress in Rice Crops Detected Using Multi-Temporal Sentinel-2 Satellite Images. Sci. Total Environ. 2018, 637–638, 18–29. [Google Scholar] [CrossRef]
  70. Gitelson, A.A.; Keydan, G.P.; Merzlyak, M.N. Three-band Model for Noninvasive Estimation of Chlorophyll, Carotenoids, and Anthocyanin Contents in Higher Plant Leaves. Geophys. Res. Lett. 2006, 33. [Google Scholar] [CrossRef] [Green Version]
  71. Zhao, L.; Li, Q.; Zhang, Y.; Wang, H.; Du, X. Integrating the Continuous Wavelet Transform and a Convolutional Neural Network to Identify Vineyard Using Time Series Satellite Images. Remote Sens. 2019, 11, 2641. [Google Scholar] [CrossRef] [Green Version]
  72. Υπουργείο Aγροτικής Aνάπτυξης και Τροφίμων. ΠΡOΔΙAΓΡAΦH ΤOΥ ΠΡOΪOΝΤOΣ (ΚAΝOΝΙΣΜOΣ (ΕΚ) 1234/2007 AΡΘΡO 118 γ, ΠAΡ/ΦOΣ 2). Available online: http://www.minagric.gr/images/stories/docs/agrotis/POP-PGE/TEXNIKOI%20FAKELOI%20OINON%20POP-PGE%20ENGLISH/PDO%2022/PDO%2022%20Nemea%20standards.pdf (accessed on 9 March 2021).
  73. Wineplus—WINE SCHOOL—Nemea. Available online: https://wineplus.gr/el/wine-school/Wine-Geography-%CE%9D%CE%B5%CE%BC%CE%AD%CE%B1.31/ (accessed on 9 March 2021).
Figure 1. Topographic map of Nemea PDO zone with viticulture areas and the 27 study vineyards.
Agriculture 11 00785 g001
Figure 2. Meteorological data for the study area (April–October 2019).
Agriculture 11 00785 g002
Figure 3. Relational schema of the database.
Agriculture 11 00785 g003
Figure 4. Data processing and analysis flow chart.
Agriculture 11 00785 g004
Figure 5. Topographic parameters (a) DEM (m), (b) slope (degrees), and (c) aspect (degrees).
Agriculture 11 00785 g005
Figure 6. Topographic parameters, Elevation (meters), Slope (degrees), Aspect (degrees) of the 27 parcels, ordered by elevation.
Agriculture 11 00785 g006
Figure 7. Temporal dynamic ranges of NDVI for the 27 vine parcels represented by lines with different symbols, time periods of phenological stages (budbreak, flowering, veraison, harvest) and time periods of management applications (tillage, trimming).
Agriculture 11 00785 g007
Figure 8. Temporal dynamic ranges of NDVI to vine growth for the six parcels of interest and main management applications related to weed and canopy management.
Agriculture 11 00785 g008
Figure 9. Spatial distribution of three groups on the PDO zone.
Agriculture 11 00785 g009
Table 1. Spectral bands of the Sentinel-2 sensors used in VIs of this study.
Sentinel-2
Band
Central Wavelength (nm)Bandwidth (nm)Spatial Resolution (m)
B2: Blue4906510
B3: Green5603510
B4: Red6653010
B5: Red-Edge (RE1)7051520
B6: Red-Edge (RE2)7401520
B7: Red-Edge (RE3)7832020
B8: NIR84211510
Table 2. Temporal resolution of Sentinel-2 images of year 2019 (DOY: day of year).
MonthAprilMayJuneJulyAugustSeptemberOctober
Date1/426/49/529/58/613/623/628/63/78/728/77/812/822/81/96/916/926/913/1021/10
DOY91116129149159164174179184189209219224234244249259269286294
Table 4. Pearson’s correlation matrix for the topographic factors, phenology event days.
Topographic FactorsPhenology DOY
SlopeAspectBudbreakFloweringVeraisonHarvest
Elevation0.482 *0.1620.476 *0.720 **0.411 *0.554 **
Slope 0.0230.1880.3470.3220.039
Aspect −0.287−0.2350.2810.100
Budbreak 0.795 **0.1350.614 **
Flowering 0.3140.543 *
Veraison 0.463 *
* Correlation is significant at the 0.05 level (2-tailed) ** Correlation is significant at the 0.01 level (2-tailed).
Table 5. Pearson’s correlation matrix for the topographic factors (Elevation, Slope) and VIs.
PhenologyBudbreakFloweringVeraisonHarvest
DOY91116149159164209219224259269286
NDVI
Elevation−0.445 *−0.210−0.769 **−0.782 **−0.640 **−0.326−0.251−0.264−0.540 **−0.500 **−0.628 **
Slope−0.421 *−0.166−0.507 **−0.559 **−0.505 ** −0.411 *−0.404 *−0.398 *−0.430 *−0.377−0.493 **
MSAVI
Elevation−0.376−0.179−0.824 **−0.782 **−0.627 **−0.148−0.114−0.137−0.536 **−0.424 *−0.035
Slope−0.335−0.066−0.357 −0.334 −0.218 0.0850.0520.070−0.1000.034−0.206
EVI
Elevation0.232−0.165−0.782 **−0.793 **−0.535 **−0.262−0.237−0.230−0.562 **−0.495 **−0.622 **
Slope−0.058−0.083−0.401 *−0.400 *−0.191−0.186−0.213−0.086−0.314 −0.270−0.448 *
Cl green
Elevation−0.464 *−0.178−0.484 *−0.498 **−0.445 *−0.235−0.170−0.130−0.355−0.377−0.421 *
Slope−0.376−0.269−0.585 **−0.593 **−0.577 **−0.497 ** −0.488 **−0.439 *−0.544 **−0.516 **−0.456 *
GNDVI
Elevation−0.607 **−0.226−0.508 **−0.520 **−0.459 *−0.273−0.221−0.197−0.392 *−0.410 *−0.458 *
Slope−0.420 *−0.359−0.596 **−0.594 **−0.594 **−0.530 **−0.527 **−0.483 *−0.580 **−0.576 **−0.541 **
IRECI
Elevation−0.332−0.152−0.770 **−0.731 **−0.538 **−0.057−0.018−0.011−0.581 **−0.463 *−0.512 **
Slope−0.283−0.049−0.355−0.313−0.1600.1070.0220.107−0.223−0.103−0.205
S2REP
Elevation−0.287−0.080−0.718 **−0.683 **−0.754 **−0.493 **−0.368−0.447 *−0.446 *−0.402 *−0.426 *
Slope−0.049−0.214−0.488 **−0.431 *−0.421 *−0.560 **−0.522 **−0.524 **−0.528 **−0.580 **−0.386 *
PSSR
Elevation−0.351−0.163−0.658 **−0.740 **−0.579 **−0.287−0.206−0.195−0.534 **−0.495 **−0.609 **
Slope−0.312−0.100−0.524 **−0.615 **−0.510 **−0.474 *−0.477 *−0.400 *−0.503 **−0.448 *−0.499 **
NDI45
Elevation−0.474 *−0.222−0.691 **−0.754 **−0.557 **−0.228−0.207−0.178−0.515 **−0.491 **−0.594 **
Slope−0.461 *−0.237−0.532 **−0.608 **−0.536 **−0.472 *−0.471 *−0.360−0.451 *−0.403 *−0.503 **
Cl Red-Edge
Elevation−0.374−0.191−0.744 **−0.750 **−0.642 **−0.351−0.249−0.242−0.544 **−0.507 **−0.608 **
Slope−0.291−0.130−0.557 **−0.608 **−0.521 **−0.504 **−0.499 **−0.442 *−0.570 **−0.530 **−0.527 **
Cl Red-Edge6
Elevation−0.409 *−0.461 *−0.789 **−0.756 **−0.824 **−0.638 **−0.576 **−0.543 **−0.579 **−0.597 **−0.403 *
Slope−0.072−0.356−0.535 **−0.523 **−0.499 **−0.561 **−0.561 **−0.531 **−0.545 **−0.564 **−0.397 *
NDRE
Elevation−0.427 *−0.221−0.775 **−0.759 **−0.640 **−0.354−0.258−0.254−0.547 **−0.516 **−0.627 **
Slope−0.324−0.179−0.553 **−0.585 **−0.527 **−0.522 **−0.518 **−0.461 *−0.595 **−0.561 **−0.558 **
NDRE6
Elevation−0.484 *−0.463 *−0.792 **−0.763 **−0.826 **−0.636 **−0.574 **−0.540 **−0.580 **−0.596 **−0.405 *
Slope−0.101−0.357−0.533 **−0.520 **−0.499 **−0.561 **−0.563 **−0.533 **−0.551 **−0.566 **−0.405 *
NDRE2
Elevation−0.391 *−0.182−0.718 **−0.711 **−0.494 **−0.216−0.111−0.105−0.502 **−0.458 *−0.635 **
Slope−0.337−0.148−0.523 **−0.573 **−0.474 *−0.459 *−0.448 *−0.376−0.575 **−0.527 **−0.552 **
NDRE3
Elevation−0.428 *−0.203−0.739 **−0.750 **−0.588 **−0.313−0.219−0.220−0.544 **−0.509 **−0.636 **
Slope−0.336−0.171−0.549 **−0.580 **−0.511 **−0.513 **−0.509 **−0.453 *−0.590 **−0.564 **−0.564 **
* Correlation is significant at the 0.05 level (2-tailed) ** Correlation is significant at the 0.01 level (2-tailed).
Table 6. One-way ANOVA statistically significant differences between the Vis values in the three subzones.
VIsFloweringVeraisonHarvestSpectral Region
NDVI*****NIR, Red
MSAVI**-**NIR, Red
EVI**-**NIR, Red, Blue
Cl green**--NIR, Green
GNDVI**-*NIR, Green
NGRDI---RED, Green
IRECI**-**RED, RE1, RE2, RE3
S2REP****RED, RE1, RE2, RE3
PSSR*****Red, RE3
NDI45*****Red, RE1
NDRE*****NIR, RE1
NDRE6******NIR, RE2
NDRE2*****RE1, RE2
NDRE3*****RE1, RE3
Cl Red-Edge*****NIR, RE1
Cl Red-Edge6******NIR, RE2
* p-value < 0.05 ** p-value < 0.01.
Publisher’s Note: MDPI stays neutral with regard to jurisdictional claims in published maps and institutional affiliations.

