Article

Microbial Interactions and Roles in Soil Fertility in Seasonal Freeze-Thaw Periods under Different Straw Returning Strategies

1
Institute of Agricultural Resources and Enviroment Research, Jilin Academy of Agricultural Sciences, Changchun 130033, China
2
Key Laboratory of Groundwater Resources and Environment of the Ministry of Education, Jilin Provincial Key Laboratory of Water Resource and Enviroment, College of New Energy and Environment, Jilin University, 2519 Jiefang Road, Changchun 130021, China
3
Cell Factory Research Center, Korea Research Institute of Bioscience and Biotechnology (KRIBB), Daejeon 34141, Korea
4
LMO Research Team, National Institute of Ecology, Seocheon 33657, Korea
*
Author to whom correspondence should be addressed.
Agriculture 2021, 11(8), 779; https://doi.org/10.3390/agriculture11080779
Submission received: 30 July 2021 / Revised: 13 August 2021 / Accepted: 13 August 2021 / Published: 15 August 2021
(This article belongs to the Special Issue Advanced Research of Crop Plant Interactions with Bacteria and Fungi)

Abstract

:
With the increase of world food demand, the intensity of cultivated land use also increased. To improve soil nutrient concentrations and crop yield, several straw returning techniques have been developed. Studies have shown that straw returning is beneficial to soil, but few studies have focused on the relationship between microbes and fertility in seasonal freeze-thaw periods. A two-year cropland experiment was set up that comprised three different straw return strategies, namely covering tillage with straw return for two years (CS), rotary tillage and straw return for two years (RS), rotary covering tillage with straw return (first year covering and the second year rotary tillage) (CRS), and conventional tillage with no straw return (CK). Illumina Miseq high throughput sequencing of 16S rRNA was applied to assess bacteria community structure. The relationship between bacteria community structure and changes in soil fertility induced by different straw incorporating during seasonal trends was studied. Our results showed that soil bacterial communities varied significantly during the soil seasonal freeze-thaw period in the northwest of Jilin province, China, and were influenced, to some extent, by the different straw returning procedures. Multidimensional analysis revealed that total phosphorus (TP), available nitrogen (AN), and total nitrogen (TN) were the major drivers of bacterial community structure. The co-occurrence network was divided into several modules. Notably, the major bacterial modules varied significantly in different sampling periods and different treatments. These results suggested that specific bacterial groups could contribute to soil fertility in relation to environmental fluctuations. Some bacterial groups (e.g., Pyrinomonadales, Rhizobiales, Sphingomonadales, and Xanthomonadales, in order level) were directly linked with specific environmental factors, indicating the key roles of these groups in soil fertility. In summary, the soil bacterial communities varied significantly during the freeze-thaw period and might play important roles in the degradation of straw. Thus, the straw return could enhance soil fertility.

1. Introduction

The soil microbiome is one of the most complex and dynamic microbiomes on earth [1]. Environmental conditions significantly influenced microbial community structure in the soil ecosystems. It has been revealed that an optimum condition for each microbe is the best for its growth and activities [2]. Seasonal soil temperature and moisture variations are the key factors in biomass and microbial activity fluctuations in ecosystems [3,4,5]. In addition, existing researches have recognized the importance of the N and P sources in the soil microbial community structure and enzyme activities [6,7,8,9,10]. Soil microbes can transform the organic matter in straw into the low-molecular organic matter during the decomposition of straw [11]. It has been reported that the major microbial groups vary during different decomposition processes. For example, Proteobacteria, Actinobacteria, and Acidobacteria were found to mediate the degradation of sugar and fat in straw [11,12]. Simultaneously, the incorporated straw could also alter the microbial community structure since its organic compounds could be used as carbon/nitrogen sources for specific microbes and increase their abundance [11,12,13]. Recently, Cong et al. (2020) reported that different straw incorporation systems, including chopped straw, pelletized straw, and straw biochar, could also influence the soil organic carbon (SOC) pool during microbial degradation. They also reported that different straw incorporation systems influenced the soil microbial diversity and altered the dominant microbial groups.
With the development of yet another next-generation sequencing approach, it is possible to explore microbial community structures that include information on numerous different microorganisms in a particular environment [14]. With the accumulation of microbial sequence information and progressive computational/statistical techniques, microbial association networks are becoming an essential tool for investigating high-throughput data in microbiology [15,16]. The advantages of microbial association networks are derived from their capacity to obtain new information about ecological interactions, establishments, keystone species, and microbial responses to environmental changes that traditional methods cannot otherwise evaluate.
Soil nutrients and microorganisms play a crucial role in material cycling and energy transformation in cropland ecosystems. Straw returning can effectively increase the content of soil organic matter, improve soil fertility, and affect the activity of soil microorganisms, which is conducive to the sustainable development of agricultural production [17]. Many studies have revealed that straw return methods could effectively increase soil nutrient concentrations and investigated the roles of microbes in the degradation of straw in agro-ecosystems in the lab and the field [12,18,19]. However, limited studies performed in frozen and thawed periods and/or investigated microbial interspecies interactions related to environmental fluctuations. In this study, the purpose was to (i) explore the effects of different straw returning procedures on soil nutrient contents; (ii) investigate the variations of microbial communities and construct microbial co-occurrence network in three treatments to explore how microbial communities contributed to the changes in soil fertility, and (iii) identify the keystone species of bacterial communities that directly affect soil fertility. This study will provide theoretical support and a reference basis for an in-depth understanding of the response of farmland soil ecosystem processes to seasonal freeze-thaw and the establishment of a suitable farming system in this area.

2. Materials and Methods

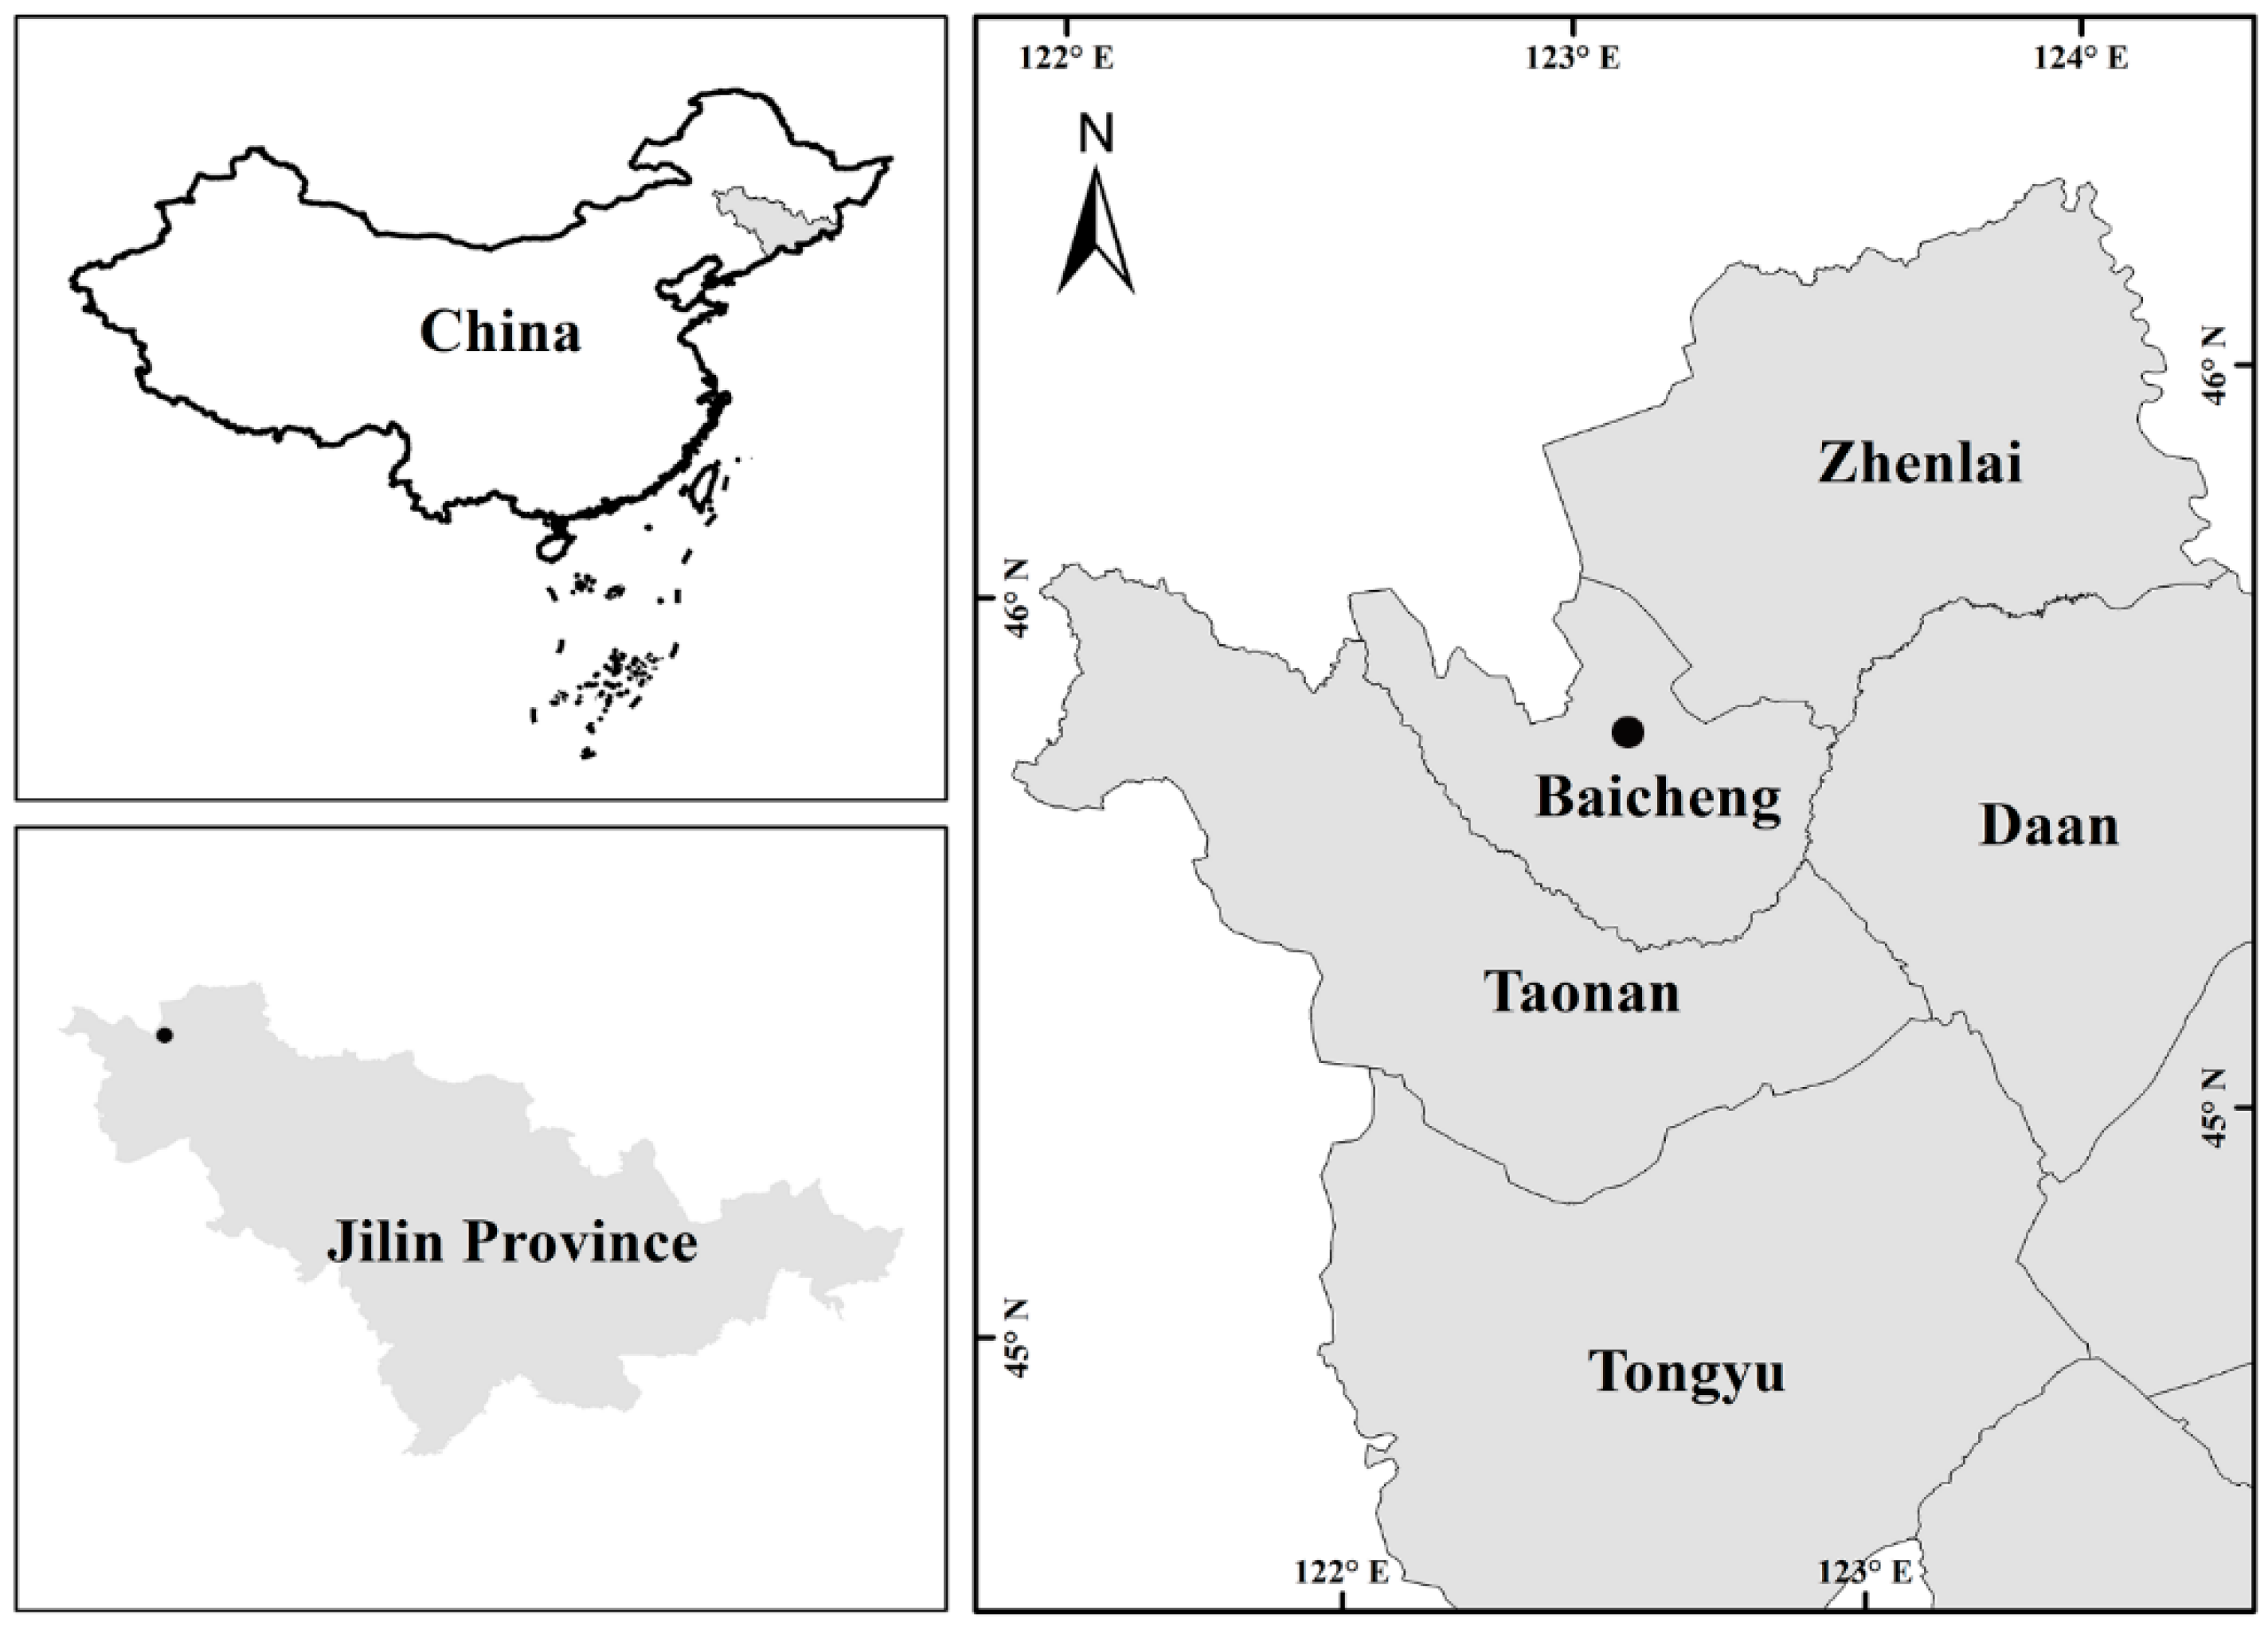
2.1. Site Description

The field experiment began in early 2017 at the experimental site of the Jilin Academy of Agricultural Sciences (45°69′ N, 122°86′ E), located in the northwest of Jilin province, China (Figure 1). The test area has a temperate continental monsoon climate, with an average annual precipitation of 399.9 mm, an average annual temperature of 5.2 °C, an average active accumulated temperature above 10 °C of 2996.2 °C·day, an average frost-free period of 144 days, and an average annual sunshine duration of 2915 h. The temperature and precipitation of sampling durations were shown in Figure S1. The soil type is light chernozem, and the essential chemical properties are as following TN 1.04 g kg−1, TP 0.31 g kg−1, total potassium (TK) 24.79 g kg−1, SOC 11.60 g kg−1, and pH 6.40.

2.2. Experimental Design and Sample Collection

A control and three different treatments were designed as follows: (i) conventional tillage—no straw returning (NT, as CK); total maize straw removed from the field, then rotary cultivating two times by using rotary cultivator (YTO Group Corporation, China, working depth was about 10–15 cm); (ii) covering + straw returning for two years continuously (CS); the straws were used to cover the field; (iii) rotary tillage + straw returning for two years continuously (RS); the straw was crushed and extruded into small pieces with less than 5 cm, then rotary cultivating two times by using IGQN-200K-QY rotary cultivator with a working depth of 10–15 cm; (iv) covering + rotary tillage + straw returning (CRS, first year CS and second year RS, straw incorporation treatment was repeated every year). Each treatment plot was 33 m long and 20 m wide in triplicate. In the present experiment, 9600 kg ha−1 of above-ground parts of maize were incorporated into the field. Maize (Zea mays L. cultivar Xiangyu ‘998′) was mono-cultured in early May at a density of 70,000 plants ha−1, and then harvested in October. The experimental field was managed in accordance with conventional management methods.
In order to evaluate the soil condition after two consecutive tillage seasons, soil samples were gathered randomly from every treated plot from August 2018 to May 2019. The specific sampling times were the growing season (20 August 2018), freezing period (12 December 2018 and 19 March 2019), thawing period (2 April 2019), and later thawing period (3 May 2019). We collected 20 samples from four tillage methods, including conventional tillage and straw returning cropland (CK, CS, RS, and CRS). Samples were collected from five different points per plot at a depth between 5 cm to 25 cm and then formed a mixed sample, representing one of the three replicates of each treatment. Debris of each mixed sample (plant tissues, rocks, and roots) was removed by sieving through a 2-mm mesh in the field (Ren et al. 2016) and kept in a sterilized plastic bag. Each sample was divided into two subsamples: one was for chemical analyses by air drying (n = 3); and the other was stored at −80 °C, then sent to Meiji Biomedical Technology Co., Ltd. (Shanghai, China) for Illumina MiSeq sequencing analysis.

2.3. Environmental Parameters

The soil samples TN and available nitrogen (AN) concentrations were determined using the Kjeldahl method with H2SO4 + H2O2 digestion and the alkaline KMnO4 method, respectively [20]. TP and available phosphorus (AP) were analyzed by using the molybdate colorimetric method [21]. TK and available K (AK) were measured by the flame photometer method [22]. The soil pH was determined with a pH meter at a soil: water ratio of 1:5 (DELTA 320, Mettler Toledo instruments Co., Ltd.(Shanghai, China)). The SOC concentration was measured through heating with an oil bath based on the Wlakley–Black chromic acid wet oxidation method [12].

2.4. DNA Extraction and Sequencing

The total microbial DNA was extracted by using the E.Z.N.A.® soil DNA Kit (Omega Bio-Tek, Norcross, GA, USA) following the manufacture’s protocol from the samples. The primer information was according to reference [23], and the PCR amlification and purification method were shown in Text S1.

2.5. Bacterial Community Analysis

The raw sequences of 16S genes were processed to calculate the Amplicon Sequence Variants (ASVs) by using DADA2 (version 1.8), on the basis of the pipeline tutorial 1.8 (https://benjjneb.github.io/dada2/tutorial_1_8.html (accessed on 14 October 2018)) in R [24]. The Silva database 138 was used to align and classify the sequences of the 16S rRNA gene [25]. Archaea, chloroplast, eukaryote, and mitochondria sequences were removed from the results after classifying the sequences. Furthermore, ASVs that contained only singletons, doubletons, and tripletons were removed from the dataset of the 16S rRNA gene. Each ASV of the 16S gene was defined as each different bacterial genotype in this study. The accompanying metadata and raw sequences are deposited in the Sequence Read Archive (SRA) of the NCBI with the project accession number SRP296995.

2.6. Correlation-Based Co-Occurrence Network and Topological Features

To reveal the relationships among different bacteria in relation to environmental fluctuations, a correlation-based co-occurrence network was established on the basis of Spearman’s rank correlation coefficient (ρ), which was calculated with R software. ASVs that met the following standard for every given data set was used to construct the network: (1) detected in 40% of the samples and (2) a relative proportion of >0.01% for at least one sample. Only positive correlations that had a p-value < 0.001 were selected to construct the network. The network was visualized by using Cytoscape 3.8.2 ( U.S. National Institute of General Medical Sciences (NIGMS) [26]. Network topological features (average shortest path length (L), average node degree, clustering coefficient (C), diameter, and modularity) were calculated using the “Networkanalyzer” plugin in Cytoscape and R software (package: igraph) [27,28]. A random undirected network with equal amounts of nodes and edges as the co-occurrence network was constructed with the Erdős–Rényi model using the Network Randomizer plugin in Cytoscape. Modules were identifying with the Louvain algorithm using R software (package: igraph) [27]. The small-world coefficient (σ) was worked out to investigate the small-world property of the networks (in other words, the degree of clustering and shortness of paths between nodes) [29]. All networks were visualized with Cytoscape 3.8.2 [26].

2.7. Variation Patterns of Treatment Modules

To explore the variation patterns of major modules under different treatments, we first normalized the relative abundance of ASVs in each module (including the control) using feature scaling. To calculate the transition patterns of each module, the normalized ASVs were averaged together after normalization [30]. Then, the obtained values of each treatment module (CRS, CS, and RS) were divided by those of the control (CK) to obtain the variation patterns of treatment modules.

2.8. Statistical Analysis

The samples were ordinated by using a non-metric multidimensional scaling (NMDS) analysis with Bray–Curtis distances that are based on their dissimilarity using the “metaMDS” function in Vegan [31]. The assemblage–environment relationships were defined by fitting vectors onto the ordination space using the Vegan function “envfit”. The consequence of the fitted vectors was evaluated using a permutation procedure (permutation999). The significance of soil chemical properties was analyzed with SPSS 22.0 software (IBM, Armonk, NY, USA)with two-way ANOVA.

3. Results

3.1. Chemical Properties of Soil

The chemical characteristics of soil samples from the control (CK) and three treatments (CS, RS, CRS) are shown in Table 1. The results of two-way ANOVA showed that control and different treatments, sampling periods, and their interaction had significant effects on most soil chemical properties (TN, AN, TP, AP, AK, pH, and SOC), except for TK (Table 2).
At the beginning of the experimental period (August 2018, the crop growing season), the concentrations of SOC and TN in CS were higher than those in CK, reaching 15.89 g kg−1 and 1.53 g kg−1, respectively. Therefore, the SOC concentrations in RS and CRS were 91% and 81% in CK, respectively, and the TN concentrations in RS and CRS were 89% and 82% in CK, respectively. The concentration of AN was the same in CS and CK and was lower in RS and CRS than in CK. In the case of TP and AP, the concentrations were lower in CS than in CK. The pH value of CK was lower than in the straw returning treatments.
The results differed before and after freeze-thawing (from December 2018 to May 2019), the off-growing season. The concentration of SOC was 12.65 g kg−1 in CS in December 2018; it increased by 3.24 g kg−1 and reached 15.89 g kg−1 in May 2019, which was higher than the changes in CK (2.84 g kg−1). Meanwhile, the increases of RS and CRS were lower than in CK, which were 1.22 g kg−1 and 0.29 g kg−1, respectively. In general, the concentration increments of nitrogen (TN and AN) and phosphorus (TP and AP) in the straw treatments (CS, RS, and CRS) were smaller than in CK. The increase in TN concentration in CK was 0.33 g kg−1, while the TN concentrations increased by 0.12 g kg−1, 0.04 g kg−1, and 0.02 g kg−1 in RS, CS, and CRS, respectively. The AN concentration in CS decreased by 8.81 g kg−1, while in CK it increased by 30.84 g kg−1. In the case of soil phosphorus concentrations, the TP and AP concentration increased in RS and CK, while they decreased in CS and CRS. The pH values of the treatments (CS, RS, and CRS) were 6.33, 6.31, and 6.38, respectively; these pH values were all higher than that of CK (6.04).

3.2. Bacterial Community Composition

At the class level, Alphaproteobacteria dominated in both the control and the straw return treatments during the experiment, while no apparent shifting patterns were observed (Figure 2A). Actinobacteria tended to increase toward the end of the experiment, especially in the control. This group comprised 35.5% of the control but 16.7–27.4% in the treatments in May. Gammaproteobacteria was approximately 1.5–3 times more enriched in the control than in the treatments. It tended to decrease to one-fifth of the proportion in May at the end of the experiment in the control. However, this group showed little variation in CS during the experiment. Thermoleophilia increased sharply until March and decreased again in both the control and the treatments. In winter, Blastocatellia made up 11.3% of the control, and this proportion was approximately twice as high as those in CS and RS.
At the order level, Rhizobiales always dominated in both the control (CK: 7.4–12.0%) and treatments (CS: 8.3–13.7%; CRS: 7.6–10.9%; RS: 6.9–12.8%) (Figure 2B). Xanthomonadales in the control was up to eight times higher than in the treatments in August 2018. Vicinamibacterales, Pyrinomonadales, and Rubrobacterales increased approximately 2–3 times compared to those in the control in CS and CRS, but showed no apparent variations in RS compared to the control. The proportions of Sphingomonadales, Propionibacteriales, Micromonosporales, Frankiales, and Streptomycetales decreased to 30% of those in the control in CS and CRS in May.

3.3. Multidimensional Analysis and the Potential Drivers of Bacterial Community Composition

NMDS constructed with the Bray–Curtis distance of obtained ASVs variations in bacterial community composition between samples and seasonal trends (Figure 3). Both ANOSIM and PERMANOVA also indicated that bacterial community structure showed strong seasonality (ANOSIM, R = 0.60, p = 0.001 and PERMANOVA, pseudo-F = 3.47, p = 0.01). A multidimensional analysis was performed to identify the key environmental drivers of bacterial communities (Figure 3). After fitting the environmental parameters to the NMDS ordination, it was revealed that AN, TN, and TP were significantly associated with the NMDS axes of bacterial community composition.

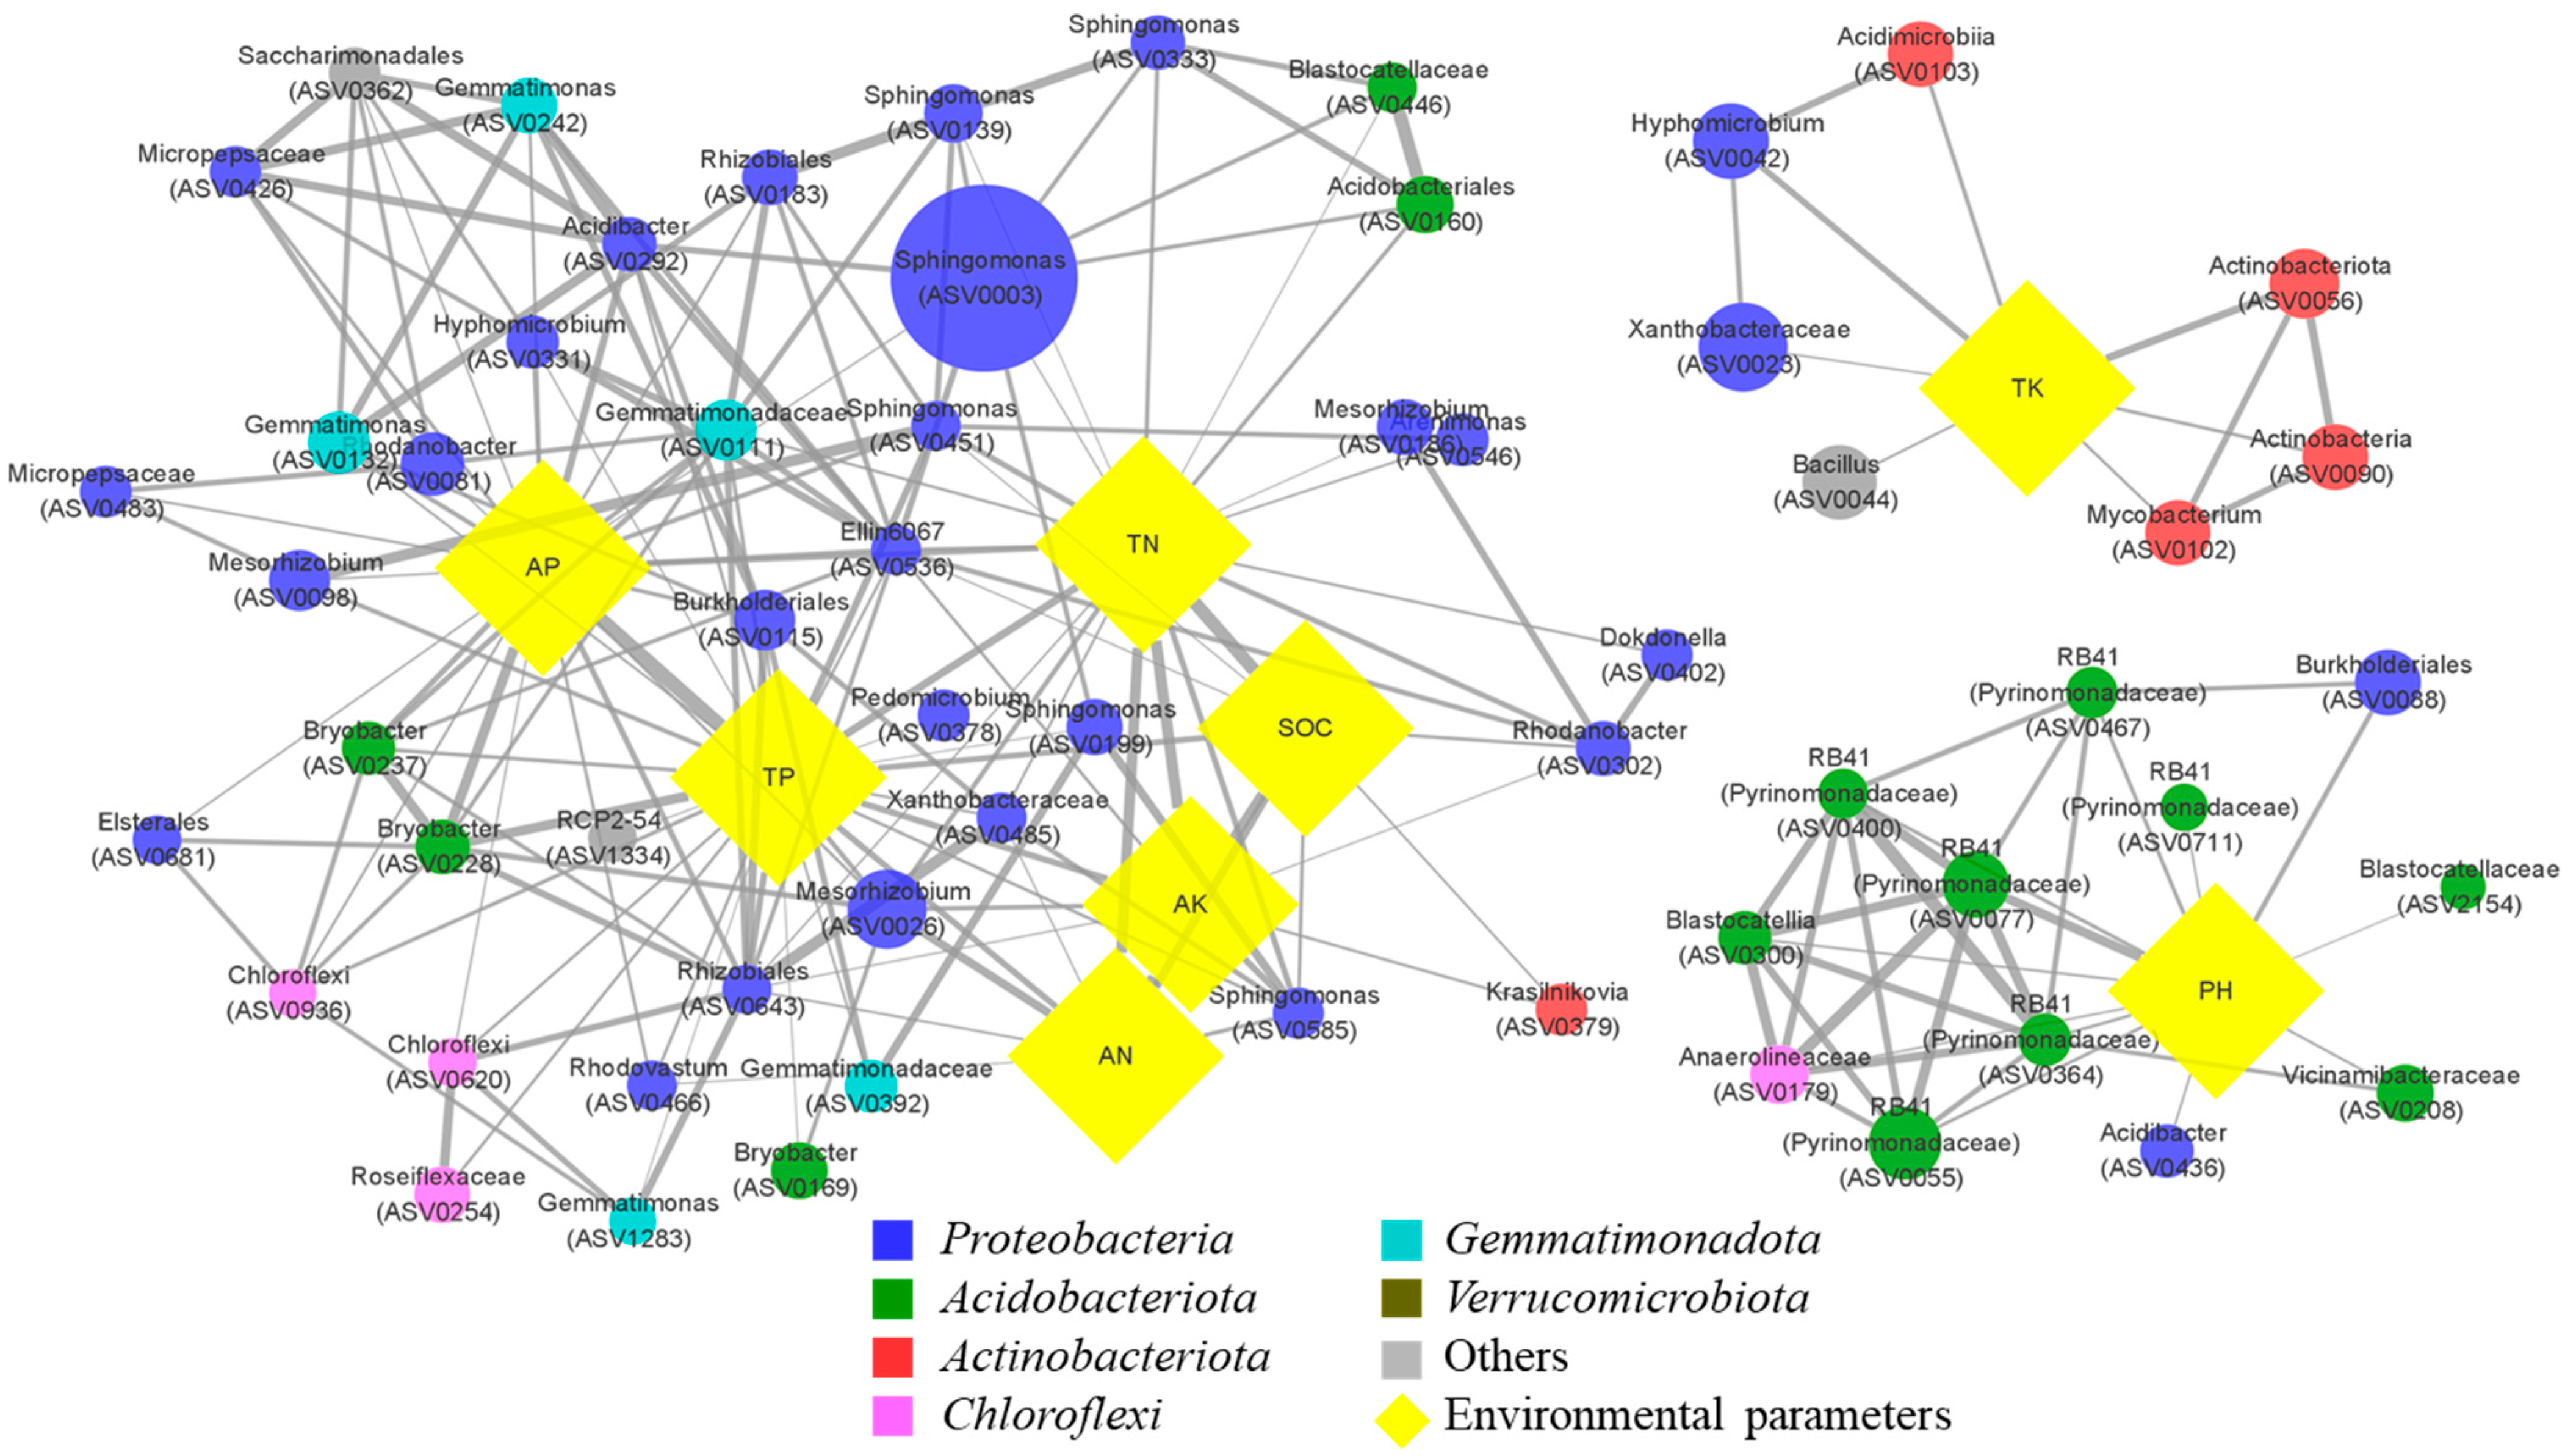
3.4. Co-Occurrence Networks, the Modular Structures, and the Taxonomic Features

A co-occurrence network was constructed to investigate the co-occurrence modes within bacterial ASVs related to environmental fluctuations. After filtering (ρ ≥ 0.6 and p < 0.01), we obtained a total of 4892 correlations (edges) that were statistically significant among 649 variables (nodes) (Figure 4A,B). The topological features of the co-occurrence networks are depicted in Table S1. Compared with the Erdös–Rényi random network, the co-occurrence networks (or real network) showed higher values of the clustering coefficient (C) (0.36), the average path length (L) (4.65), and the modularity (0.49). The small-world coefficient of the co-occurrence network was 8.97, which was much higher than 1, indicating that the bacterial network showed small-world properties with modular structures.
To explore how module composition varied under different treatments at each sampling time point, we calculated the variation patterns of modules (Var-M) under different treatments against the control (Figure 4C). Therefore, the Var-M could (1) represent the microbial transitions of a specific module in different sampling time points against the control and (2) indicate which distinctive module dominated under which treatment against the control. Compared to the control, the module I was only enriched in March (Var-M increased up to 461%) in all three treatments, and module IV was enriched remarkably in CS and CRS in August (Var-M of CS, 362%; Var-M of CRS, 630%) and May (Var-M of CS, 1311%; Var-M of CS, 1057%). Module III was enriched in many samples but was more apparently enriched in CRS in August (Var-M = 388%) and all three treatments in May (Var-M increased up to 515%). Similar to module III, module V was also enriched in many samples but was more noticeably enriched in CRS in August (Var-M = 375%) and in RS and CRS in December (Var-M of RS, 690%; Var-M of CRS, 373%).
The different modules comprised different microbial compositions taxonomically (Figure 4D). For instance, Rhizobiales dominated in modules I and II, while Gaiellales dominated in Module V. Micrococcales, Propionibacteriales, and Frankiales dominated in Module II, but Pyrinomonadales dominated in Module III. Rubrobacterales was more enriched in Module IV, but Solirubrobacterales was more enriched in Module V.

3.5. Distinctive Bacterial Associations with Environmental Parameters

The sub-network was extracted from the microbial association network to explore direct links between environmental factors and microbes (Figure 5). The sub-network was composed of eight environmental and 68 bacterial nodes as well as 208 edges. The bacteria belong to several phyla, including Proteobacteria, Gemmatimonadota, Acidobacteriota, Verrucomicrobiota, Actinobacteriota, Chloroflexi, and others, in the subnetwork. Different colors designated the different bacterial phyla; the names of phyla Acidobacteriota, Actinobacteriota, Verrucomicrobiota were not validly published but proposed recently [32]. Notably, Rhizobiales showed correlations with multiple environmental factors (AP, TP, AK, TK, AN, and TN), while Sphingomonadales (belonged to Proteobacteria) showed correlations with the abovementioned environmental factors and SOC. Xanthomonadales (belonged to Proteobacteria) correlated with AP, AK, TN, and SOC. Interestingly, Pyrinomonadales (which belonged to Acidobacteriota) only correlated with pH but not other environmental factors.

4. Discussion

Straw return could improve soil organic carbon, which could increase nutrient concentrations (including total nitrogen and total phosphorus) as the by-products of microbial metabolism, and shift the soil microbial community in agro-ecosystems. In this study, we obtained the following key results: (1) soil bacterial community structure varied significantly during the frozen and thawed periods and were mostly influenced by the concentrations of nitrogenous and phosphorus compounds; (2) network analysis revealed that the dominated bacterial modules varied in relation to the different treatments as well as in different sampling time points; and (3) the bacterial groups that were directly linked to the nutrient concentrations could contribute to the enhancement of soil fertility.
Microbial community variations and ecological functions in soil ecosystems could be caused by the seasonal fluctuations of environmental parameters [33,34]. During the winter, the soil microbes were reported to have more capacity to degrade organic materials, such as plant detritus, than during other seasons. Still, the utilization of these materials was lower in winter [34]. In addition, the shift of microbial community during the frozen and thawed periods could be one of the key points in the summer nitrogen cycle in the soil ecosystem [33]. In our test, the bacterial communities showed strong seasonality during the experimental period (Figure 2 and Figure 3), agreeing with previous studies [33,34]. They also varied in order level, to some extent, in different treatments and in the control (Figure 2). Rhizobiales occupied approximately 9.5 ± 1.8% of the microbial community in this study; accordingly, they dominated both the control and the treatments during the sampling period. Among Rhizobiales ASVs, 23 ~ 41% of ASVs were assigned Bradyrhizobium, Mesorhizobium, Microvirga, and Phyllobacterium. These bacteria were reported to have the capacity to fix nitrogen, and their abundance and communities were influenced by the surrounding carbon and nitrogen sources [35,36]. Therefore, Rhizobiales, one of the dominant groups in this study, could play crucial roles in nitrogen cycling in both the control and treatment systems. Sphingomonadales, by contrast, decreased during the frozen period, while they increased again in the warmer season. This group of bacteria was one of the plant growth promoters in the plant rhizosphere [37]. Sphingomonas species could promote plant growth via producing plant hormones including abscisic acid, gibberellins, indole-3-acetic acid (IAA), salicylic acid (SA), and zeatin [38,39,40]. Therefore, the increase of Sphigomonadales during the warmer season could be due to their interactions with the rhizosphere of plants and further promote plant growth.
Many previous studies have revealed the roles of N and P sources in soil microbial community structure and their enzyme activities [6,7,8,9,10]. Consistently, the multidimensional analysis showed that these two factors were the major drivers of the bacterial community structure in this study. The straw itself contained large amounts of biodegradable organic materials, including cellulose, lignin, and pentosan. These organic materials could be good carbon, nitrogen, and phosphorus sources for specific groups of bacteria. After the biodegradation of the added straw in the treatments, the concentrations of nitrogen and phosphorus increased, which affected the local microbial community structure further. In addition, the concentrations of N and P were higher in the summer and lowered in the winter. The high concentrations of N and P could have been partly caused by fertilizer application in early summer for crop cultivation. The high concentrations of N and P could be utilized and transformed into easy-to-use materials by specific groups of bacteria and further utilized by the crops to increase crop yields.
Consistent with previous reports in soil ecosystems [41,42,43,44], the co-occurrence patterns of bacterial communities in this study displayed modular structure with small-world properties, indicating that the interspecies interactions among bacteria were nonrandom but highly organized in accordance with their demands. Bacterial communities were divided into six major modules; specific modules dominated in different treatment systems as well as in the frozen and thawed periods compared with the control. For instance, Module V was more enriched in December in all three treatments, but Module VI was more enriched in treatment CS. Solirubrobacterales and Gaiellales, which belong to Actinobacteria, were two dominant groups in Module V, and Rhizobiales and Solirubrobacterales were dominated in Module VI. Solirubrobacterales and Gaiellales have been mentioned to have the capacity to degrade lignin [45]. A recent study pointed out that mainly fungi are involved in decomposing refractory substances in summer, while bacteria replace them in this role in winter in forest soils [46]. Since straw contains a large amount of lignin, which is also hard to degrade, we assumed that these bacteria could contribute to lignin degradation during the frozen season. Module II was more enriched in the warmer season than in the cold season. One of the major bacterial components of this module was Pyrinomonadales. The reason was unknown, but members belonging to this group seemed to be mesophiles or thermophiles [47,48], which could explain why they were more enriched in the warmer season. Module IV was highly enriched in the treatments with comparing the control in May and August during the crop growing period. Among many bacteria, members assigned to Actinobacteria, such as Rubrobacterales, dominated in this period. Past studies have shown that Actinobacteria can contribute to degrading organic matters, including cellulose and phytoplankton detritus [49,50]. The organic/inorganic materials released as their by-products could be used as a good energy source for crop growth. The treatment soils contained high amounts of straw that could be used as substrates and degraded by Actinobacteria, which explained the higher abundance of Actinobacteria in the spring and summer in the treatments than in the control. To sum up, the separation of the module formation could be derived from the differences in bacterial physiological and ecological characteristics in the ecosystem, which further forced bacterial species to establish interconnectivity with specific groups of bacteria and dominated in certain crop growing periods and/or frozen and thawed periods.
Environmental factors were directly linked with certain groups of bacteria in this study (Figure 5). ASVs assigned to Pyrinomonadales were only correlated with pH, indicating that the abundance of these mesophiles or thermophiles [47,48] was highly susceptible to pH variations, although the reasons remain unclear. Rhizobiales and Sphingomonadales correlated with most of the environmental factors, including the concentration of nitrogen sources. These two groups of bacteria were reported to contribute to the nitrogen cycle and acted as plant growth promoters, discussed in detail above. Because they could convert nitrogen (gas) to other forms of nitrogenous compounds and further influence the local N concentrations, we assumed that these two groups could play key roles in ecosystem soil fertility. Xanthomonadales correlated with N, P, and K sources as well as SOC. Huang et al. (2019) reported that Xanthomonadales increased with the concentrations of bio-organic fertilizer in cucumber farmland. Their biodegradation of bio-organic fertilizers could increase N, P, and K concentrations in the soil. Therefore, the direct links of Xanthomonadales with the abovementioned environmental factors suggested their key roles in soil fertility.

5. Conclusions

In our study, the soil bacterial communities varied significantly during the experimental period, and they also varied, to some extent, in different treatments. Among the environmental factors, AN, TN, and TP were the key drivers of bacterial community structure. The co-occurrence network constructed with bacterial and environmental data could be divided into several modules and showed nonrandom but small-world properties. Notably, the dominated bacterial modules varied in different months and different treatments, suggesting that specific microbial groups could contribute to soil fertility in relation to environmental fluctuations. Rhizobiales, Pyrinomonadales, Sphingomonadales, and Xanthomonadales showed correlations to specific nutrient concentrations and pH, indicated that they could play important roles in the changes in soil fertility. In this experiment, we elucidated the short-term responses of microbes to different straw returning procedures. As the relationships between soil fertility, microorganisms, and environmental factors remain unclear, a long-term study on these relationships will be conducted in the future.

Supplementary Materials

The following are available online at https://www.mdpi.com/article/10.3390/agriculture11080779/s1, Text S1: The information of primers and the method of PCR amplification and purification. Figure S1: Monthly temperature and precipitation of the test area during the sampling period. Table S1: Topological features and statistics of the microbial association networks.

Author Contributions

M.S., L.W., and B.C. contributed to conception and design, acquisition and analysis of data, and drafting and critical review of the manuscript; H.W., N.W., and T.M. collected the data; Y.C. and S.C. analyzed the data and drafting of the manuscript; T.L. and C.L. analyzed the data of chemical properties; all authors contributed critically to subsequent drafts. All authors have read and agreed to the published version of the manuscript.

Funding

This work was supported by the Agricultural Science and Technology Innovation Program and Postdoctoral Funding Project of Jilin Province, the National Key Research and Development Program of China (Grant No. 2016YFD0300807), and the Project of the Open Fund for the Key Laboratory of Plant Nutrition and Agricultural Environment in Northeast China (KLAE2018502-03). This research was also supported by the National Institute of Ecology (NIE), funded by the Ministry of Environment (MOE) of the Republic of Korea (NIE-A-2021-10). We thank LetPub (www.letpub.com) for its linguistic assistance during the preparation of this manuscript.

Institutional Review Board Statement

Not applicable.

Data Availability Statement

The data presented in this study are available within the article.

Conflicts of Interest

The authors declare no conflict of interest.

References

  1. Fierer, N. Embracing the unknown: Disentangling the complexities of the soil microbiome. Nat. Rev. Microbiol. 2017, 15, 579–590. [Google Scholar] [CrossRef]
  2. Paul, E.A.; Clark, F.E. Soil Microbiology and Biochemistry; Academic Press: San Diego, CA, USA, 1996. [Google Scholar]
  3. Van Gestel, M.; Ladd, J.; Amato, M. Microbial biomass responses to seasonal change and imposed drying regimes at increasing depths of undisturbed topsoil profiles. Soil Biol. Biochem. 1992, 24, 103–111. [Google Scholar] [CrossRef]
  4. Corre, M.D.; Schnabel, R.R.; Stout, W.L. Spatial and seasonal variation of gross nitrogen transformations and microbial biomass in a Northeastern US grassland. Soil Biol. Biochem. 2002, 34, 445–457. [Google Scholar] [CrossRef]
  5. Bell, C.; McIntyre, N.; Cox, S.; Tissue, D.; Zak, J. Soil microbial responses to temporal variations of moisture and temperature in a Chihuahuan Desert grassland. Microb. Ecol. 2008, 56, 153–167. [Google Scholar] [CrossRef] [PubMed]
  6. Fierer, N.; Lauber, C.L.; Ramirez, K.S.; Zaneveld, J.; Bradford, M.A.; Knight, R. Comparative metagenomic, phylogenetic and physiological analyses of soil microbial communities across nitrogen gradients. ISME J. 2012, 6, 1007–1017. [Google Scholar] [CrossRef] [Green Version]
  7. Ramirez, K.S.; Craine, J.M.; Fierer, N. Consistent effects of nitrogen amendments on soil microbial communities and processes across biomes. Glob. Chang. Biol. 2012, 18, 1918–1927. [Google Scholar] [CrossRef]
  8. Liu, L.; Zhang, T.; Gilliam, F.S.; Gundersen, P.; Zhang, W.; Chen, H.; Mo, J. Interactive effects of nitrogen and phosphorus on soil microbial communities in a tropical forest. PLoS ONE 2013, 8, e61188. [Google Scholar] [CrossRef] [Green Version]
  9. Dong, W.; Zhang, X.; Liu, X.; Fu, X.; Chen, F.; Wang, H.; Sun, X.; Wen, X. Responses of soil microbial communities and enzyme activities to nitrogen and phosphorus additions in Chinese fir plantations of subtropical China. Biogeosciences 2015, 12, 5537–5546. [Google Scholar] [CrossRef] [Green Version]
  10. Zhang, T.A.; Chen, H.Y.; Ruan, H. Global negative effects of nitrogen deposition on soil microbes. ISME J. 2018, 12, 1817–1825. [Google Scholar] [CrossRef] [Green Version]
  11. Marschner, P.; Umar, S.; Baumann, K. The microbial community composition changes rapidly in the early stages of decomposition of wheat residue. Soil Biol. Biochem. 2011, 43, 445–451. [Google Scholar] [CrossRef]
  12. Cong, P.; Wang, J.; Li, Y.; Liu, N.; Dong, J.; Pang, H.; Zhang, L.; Gao, Z. Changes in soil organic carbon and microbial community under varying straw incorporation strategies. Soil Tillage Res. 2020, 204, 104735. [Google Scholar] [CrossRef]
  13. Wang, J.; Zhang, H.; Li, X.; Su, Z.; Li, X.; Xu, M. Effects of tillage and residue incorporation on composition and abundance of microbial communities of a fluvo-aquic soil. Eur. J. Soil Biol. 2014, 65, 70–78. [Google Scholar] [CrossRef]
  14. Klindworth, A.; Pruesse, E.; Schweer, T.; Peplies, J.; Quast, C.; Horn, M.; Glöckner, F.O. Evaluation of general 16S ribosomal RNA gene PCR primers for classical and next-generation sequencing-based diversity studies. Nucleic Acids Res. 2013, 41, e1. [Google Scholar] [CrossRef] [PubMed]
  15. Faust, K.; Raes, J. Microbial interactions: From networks to models. Nat. Rev. Microbiol. 2012, 10, 538–550. [Google Scholar] [CrossRef]
  16. Röttjers, L.; Faust, K. From hairballs to hypotheses–biological insights from microbial networks. FEMS Microbiol. Rev. 2018, 42, 761–780. [Google Scholar] [CrossRef] [Green Version]
  17. Guan, X.-K.; Wei, L.; Turner, N.C.; Ma, S.-C.; Yang, M.-D.; Wang, T.-C. Improved straw management practices promote in situ straw decomposition and nutrient release, and increase crop production. J. Clean. Prod. 2020, 250, 119514. [Google Scholar] [CrossRef]
  18. Zhao, S.; Qiu, S.; Xu, X.; Ciampitti, I.A.; Zhang, S.; He, P. Change in straw decomposition rate and soil microbial community composition after straw addition in different long-term fertilization soils. Appl. Soil Ecol. 2019, 138, 123–133. [Google Scholar] [CrossRef]
  19. Zhang, H.; Hobbie, E.A.; Feng, P.; Zhou, Z.; Niu, L.A.; Duan, W.; Hao, J.; Hu, K. Responses of soil organic carbon and crop yields to 33-year mineral fertilizer and straw additions under different tillage systems. Soil Tillage Res. 2021, 209, 104943. [Google Scholar] [CrossRef]
  20. Marcó, A.; Rubio, R.; Compañó, R.; Casals, I. Comparison of the Kjeldahl method and a combustion method for total nitrogen determination in animal feed. Talanta 2002, 57, 1019–1026. [Google Scholar] [CrossRef]
  21. Joshi, S.R.; Morris, J.W.; Tfaily, M.M.; Young, R.P.; McNear, D.H. Low soil phosphorus availability triggers maize growth stage specific rhizosphere processes leading to mineralization of organic P. Plant Soil 2021, 459, 423–440. [Google Scholar] [CrossRef]
  22. Guo, A.; Zhao, Z.; Zhang, P.; Yang, Q.; Li, Y.; Wang, G. Linkage between soil nutrient and microbial characteristic in an opencast mine, China. Sci. Total Environ. 2019, 671, 905–913. [Google Scholar] [CrossRef] [PubMed]
  23. Xu, N.; Tan, G.; Wang, H.; Gai, X. Effect of biochar additions to soil on nitrogen leaching, microbiomass and bacterial community structure. Eur. J. Soil Biol. 2016, 74, 1–8. [Google Scholar] [CrossRef]
  24. Callahan, B.J.; McMurdie, P.J.; Rosen, M.J.; Han, A.W.; Johnson, A.J.; Holmes, S.P. DADA2: High-resolution sample inference from Illumina amplicon data. Nat. Methods 2016, 13, 581–583. [Google Scholar] [CrossRef] [Green Version]
  25. Quast, C.; Pruesse, E.; Yilmaz, P.; Gerken, J.; Schweer, T.; Yarza, P.; Peplies, J.; Glockner, F.O. The SILVA ribosomal RNA gene database project: Improved data processing and web-based tools. Nucleic Acids Res. 2013, 41, D590–D596. [Google Scholar] [CrossRef] [PubMed]
  26. Shannon, P.; Markiel, A.; Ozier, O.; Baliga, N.S.; Wang, J.T.; Ramage, D.; Amin, N.; Schwikowski, B.; Ideker, T. Cytoscape: A software environment for integrated models of biomolecular interaction networks. Genome Res. 2003, 13, 2498–2504. [Google Scholar] [CrossRef]
  27. Csardi, G.; Nepusz, T. The igraph software package for complex network research. Inter. J. Complex Syst. 2006, 1695, 1–9. [Google Scholar]
  28. Assenov, Y.; Ramirez, F.; Schelhorn, S.E.; Lengauer, T.; Albrecht, M. Computing topological parameters of biological networks. Bioinformatics 2008, 24, 282–284. [Google Scholar] [CrossRef] [Green Version]
  29. Telesford, Q.K.; Joyce, K.E.; Hayasaka, S.; Burdette, J.H.; Laurienti, P.J. The ubiquity of small-world networks. Brain Connect. 2011, 1, 367–375. [Google Scholar] [CrossRef] [Green Version]
  30. Chun, S.-J.; Cui, Y.; Lee, C.S.; Cho, A.R.; Baek, K.; Choi, A.; Ko, S.-R.; Lee, H.-G.; Hwang, S.; Oh, H.-M. Characterization of distinct cyanoHABs-related modules in microbial recurrent association network. Front. Microbiol. 2019, 10, 1637. [Google Scholar] [CrossRef] [PubMed] [Green Version]
  31. Oksanen, J.; Blanchet, F.G.; Kindt, R.; Legendre, P.; Minchin, P.R.; O’hara, R.B.; Simpson, G.L.; Solymos, P.; Stevens, M.H.H.; Wagner, H.H. Vegan: Community Ecology Package R Package Version 2.0-8. 2013. Available online: http://cran.r-project.org/package=vegan (accessed on 14 April 2021).
  32. Whitman, W.B.; Oren, A.; Chuvochina, M.; da Costa, M.S. Proposal of the suffix-ota to denote phyla. Addendum to ‘Proposal to include the rank of phylum in the International Code of Nomenclature of Prokaryotes’. Int. J. Syst. Evol. Microbiol. 2018, 68, 967–969. [Google Scholar] [CrossRef]
  33. Schmidt, S.; Costello, E.; Nemergut, D.; Cleveland, C.C.; Reed, S.; Weintraub, M.; Meyer, A.; Martin, A. Biogeochemical consequences of rapid microbial turnover and seasonal succession in soil. Ecology 2007, 88, 1379–1385. [Google Scholar] [CrossRef]
  34. Koranda, M.; Kaiser, C.; Fuchslueger, L.; Kitzler, B.; Sessitsch, A.; Zechmeister-Boltenstern, S.; Richter, A. Seasonal variation in functional properties of microbial communities in beech forest soil. Soil Biol. Biochem. 2013, 60, 95–104. [Google Scholar] [CrossRef] [Green Version]
  35. Will, C.; Thürmer, A.; Wollherr, A.; Nacke, H.; Herold, N.; Schrumpf, M.; Gutknecht, J.; Wubet, T.; Buscot, F.; Daniel, R. Horizon-specific bacterial community composition of German grassland soils, as revealed by pyrosequencing-based analysis of 16S rRNA genes. Appl. Environ. Microbiol. 2010, 76, 6751–6759. [Google Scholar] [CrossRef] [Green Version]
  36. Shu, W.; Pablo, G.P.; Jun, Y.; Danfeng, H. Abundance and diversity of nitrogen-fixing bacteria in rhizosphere and bulk paddy soil under different duration of organic management. World J. Microbiol. Biotechnol. 2012, 28, 493–503. [Google Scholar] [CrossRef]
  37. Asaf, S.; Numan, M.; Khan, A.L.; Al-Harrasi, A. Sphingomonas: From diversity and genomics to functional role in environmental remediation and plant growth. Crit. Rev. Biotechnol. 2020, 40, 138–152. [Google Scholar] [CrossRef]
  38. Khan, A.L.; Waqas, M.; Kang, S.-M.; Al-Harrasi, A.; Hussain, J.; Al-Rawahi, A.; Al-Khiziri, S.; Ullah, I.; Ali, L.; Jung, H.-Y. Bacterial endophyte Sphingomonas sp. LK11 produces gibberellins and IAA and promotes tomato plant growth. J. Microbiol. 2014, 52, 689–695. [Google Scholar] [CrossRef]
  39. Yang, S.; Zhang, X.; Cao, Z.; Zhao, K.; Wang, S.; Chen, M.; Hu, X. Growth-promoting Sphingomonas paucimobilis ZJSH 1 associated with Dendrobium officinale through phytohormone production and nitrogen fixation. Microb. Biotechnol. 2014, 7, 611–620. [Google Scholar] [CrossRef] [PubMed]
  40. Luo, Y.; Wang, F.; Huang, Y.; Zhou, M.; Gao, J.; Yan, T.; Sheng, H.; An, L. Sphingomonas sp. Cra20 increases plant growth rate and alters rhizosphere microbial community structure of Arabidopsis thaliana under drought stress. Front. Microbiol. 2019, 10, 1221. [Google Scholar] [CrossRef] [PubMed] [Green Version]
  41. Barberán, A.; Bates, S.T.; Casamayor, E.O.; Fierer, N. Using network analysis to explore co-occurrence patterns in soil microbial communities. ISME J. 2012, 6, 343–351. [Google Scholar] [CrossRef] [PubMed] [Green Version]
  42. Li, X.; Meng, D.; Li, J.; Yin, H.; Liu, H.; Liu, X.; Cheng, C.; Xiao, Y.; Liu, Z.; Yan, M. Response of soil microbial communities and microbial interactions to long-term heavy metal contamination. Environ. Pollut. 2017, 231, 908–917. [Google Scholar] [CrossRef]
  43. Sun, W.; Xiao, E.; Pu, Z.; Krumins, V.; Dong, Y.; Li, B.; Hu, M. Paddy soil microbial communities driven by environment-and microbe-microbe interactions: A case study of elevation-resolved microbial communities in a rice terrace. Sci. Total Environ. 2018, 612, 884–893. [Google Scholar] [CrossRef]
  44. Xue, M.; Guo, Z.; Gu, X.; Gao, H.; Weng, S.; Zhou, J.; Gu, D.; Lu, H.; Gu, D.; Lu, H.; et al. Rare rather than abundant microbial communities drive the effects of long-term greenhouse cultivation on ecosystem functions in subtropical agricultural soils. Sci. Total Environ. 2020, 706, 136004. [Google Scholar] [CrossRef]
  45. Wilhelm, R.C.; Singh, R.; Eltis, L.D.; Mohn, W.W. Bacterial contributions to delignification and lignocellulose degradation in forest soils with metagenomic and quantitative stable isotope probing. ISME J. 2019, 13, 413–429. [Google Scholar] [CrossRef] [Green Version]
  46. Žifčáková, L.; Větrovský, T.; Lombard, V.; Hebrussat, B.; Howe, A.; Baldrian, P. Feed in summer, rest in winter: Microbial carbon utilization in forest topsoil. Microbiome 2017, 5, 122. [Google Scholar] [CrossRef] [PubMed] [Green Version]
  47. Lee, K.C.; Morgan, X.C.; Power, J.F.; Dunfield, P.F.; Huttenhower, C.; Stott, M.B. Complete genome sequence of the thermophilic Acidobacteria, Pyrinomonas methylaliphatogenes type strain K22 T. Stand. Genom. Sci. 2015, 10, 1–8. [Google Scholar]
  48. Wüst, P.K.; Foesel, B.U.; Geppert, A.; Huber, K.J.; Luckner, M.; Wanner, G.; Overmann, J. Brevitalea aridisoli, B. deliciosa and Arenimicrobium luteum, three novel species of Acidobacteria subdivision 4 (class Blastocatellia) isolated from savanna soil and description of the novel family Pyrinomonadaceae. Int. J. Syst. Evol. Microbiol. 2016, 66, 3355–3366. [Google Scholar] [CrossRef]
  49. Cui, Y.; Jin, L.; Ko, S.-R.; Chun, S.-J.; Oh, H.-S.; Lee, C.S.; Srivastava, A.; Oh, H.-M.; Ahn, C.-Y. Periphyton effects on bacterial assemblages and harmful cyanobacterial blooms in a eutrophic freshwater lake: A mesocosm study. Sci. Rep. 2017, 7, 1–11. [Google Scholar] [CrossRef] [PubMed] [Green Version]
  50. Zhao, Y.; Lu, Q.; Wei, Y.; Cui, H.; Zhang, X.; Wang, X.; Shan, S.; Wei, Z. Effect of actinobacteria agent inoculation methods on cellulose degradation during composting based on redundancy analysis. Bioresour. Technol. 2016, 219, 196–203. [Google Scholar] [CrossRef]
Figure 1. The location of the experimental site.
Agriculture 11 00779 g001
Figure 2. The relative abundance of bacterial community structure at (A) class level and (B) order level.
Agriculture 11 00779 g002
Figure 3. Non-metric multidimensional scaling (NMDS) ordination plot of Bray–Curtis community dissimilarities based on bacterial ASVs (stress value = 0.14). Small gray circles represent ASVs. Environmental parameters were added to the NMDS plot using envfit (p < 0.01).
Agriculture 11 00779 g003
Figure 4. Co-occurrence network constructed with correlations among bacterial ASVs and environmental parameters (A,B). The size of each node is proportional to the node degree. Six major modules were designated with different colors. (C) The Var-M (variation patterns of modules) under different treatments (CS, RS, CRS) against those of control module (CK). (D) Major groups of bacteria at the order level and in the six major modules.
Agriculture 11 00779 g004
Figure 5. Bacterial ASVs that were directly linked with the environmental parameters. The size of the node is proportional to the relative abundance of each ASV.
Agriculture 11 00779 g005
Table 1. The chemical properties of different soil samples (n = 3).
Sampling MonthSample IDANAPAKTNTPTKpHSOC
(mg kg−1)(mg kg−1)(mg kg−1)(g kg−1)(g kg−1)(g kg−1) (g kg−1)
CKAugustCK201808136.72 ± 0.33 a35.99 ± 1.79 b134.00 ± 9.89 ab1.46 ± 0.08 a0.48 ± 0.09 ab22.75 ± 1.69 a6.59 ± 0.15 ab13.57 ± 0.16 a
DecemberCK20181288.12 ± 0.14 c11.34 ± 0.67 d85.00 ± 8.48 c1.04 ± 0.09 b0.31 ± 0.08 b24.37 ± 0.98 a6.72 ± 0.04 a10.79 ± 0.98 b
MarchCK20190388.12 ± 0.28 c10.70 ± 0.59 d91.00 ± 12.7 c1.04 ± 0.05 b0.31 ± 0.02 b24.79 ± 1.27 a6.40 ± 0.04 bc11.6 ± 0.82 b
AprilCK201904121.07 ± 2.00 b23.00 ± 1.47 c115.00 ± 11.3 bc1.10 ± 0.07 b0.39 ± 0.07 ab22.57 ± 0.86 a6.48 ± 0.02 b11.31 ± 0.45 b
MayCK201905118.96 ± 1.01 b54.06 ± 1.90 a156.00 ± 16.9 a1.37 ± 0.09 a0.55 ± 0.08 a23.56 ± 1.00 a6.04 ± 0.05 c13.63 ± 0.87 a
CSAugustCS201808136.72 ± 2.12 a28.34 ± 0.84 b150.00 ± 12.7 a1.53 ± 0.07 a0.46 ± 0.05 abc22.55 ± 0.86 a6.63 ± 0.08 ab15.89 ± 1.01 a
DecemberCS201812117.49 ± 1.96 c55.12 ± 1.13 a117.00 ± 15.5 b1.19 ± 0.11 bc0.54 ± 0.05 ab23.77 ± 1.24 a6.51 ± 0.09 bc12.65 ± 0.93 b
MarchCS201903110.15 ± 1.01 d56.18 ± 0.59 a118.00 ± 11.3 b1.23 ± 0.05 b0.57 ± 0.07 a25.98 ± 1.76 a6.12 ± 0.07d12.59 ± 0.80 b
AprilCS201904104.92 ± 1.32 a6.50 ± 0.26 d109.00 ± 8.48 b1.02 ± 0.05 c0.32 ± 0.04 c24.07 ± 1.52 a6.89 ± 0.15 a10.85 ± 0.48 b
MayCS201905108.68 ± 0.83 b21.33 ± 0.72 c98.00 ± 9.89 b1.23 ± 0.04 b0.41 ± 0.05 bc22.58 ± 0.86 a6.33 ± 0.08 cd15.89 ± 0.98 a
RSAugustRS201808120.37 ± 2.34 a40.24 ± 0.80 a116.00 ± 8.48 a1.30 ± 0.11 a0.49 ± 0.09 a22.57 ± 0.98 b6.68 ± 0.08 a12.35 ± 0.55 a
DecemberRS20181296.93 ± 0.84 c10.49 ± 0.29 d89.00 ± 15.5 a1.03 ± 0.05 b0.29 ± 0.02 b23.96 ± 1.51 ab6.29 ± 0.12 b10.79 ± 0.82 ab
MarchRS20190389.95 ± 0.25 d9.85 ± 0.25 d85.00 ± 9.89 a1.03 ± 0.07 b0.32 ± 0.04 ab25.58 ± 1.04 a6.44 ± 0.07 b10.09 ± 0.42 b
AprilRS201904118.24 ± 1.01 a13.3 ± 0.59 c116.00 ± 14.1 a1.07 ± 0.09 ab0.35 ± 0.08 ab23.56 ± 0.77 ab6.28 ± 0.09 b10.9 ± 0.90 ab
MayRS201905108.68 ± 0.91 b16.23 ± 0.45 b115.00 ± 12.7 a1.15 ± 0.08 ab0.38 ± 0.08 ab24.35 ± 0.65 ab6.31 ± 0.05 b12.01 ± 0.45 a
CRSAugustCRS201808103.67 ± 0.96 a13.89 ± 0.29 b100.00 ± 9.89 ab1.20 ± 0.04 a0.38 ± 0.05 a22.16 ± 0.25 b6.71 ± 0.08 a11.02 ± 0.76 a
DecemberCRS20181288.12 ± 0.22 b16.44 ± 0.60 a77.00 ± 5.65 c0.98 ± 0.05 b0.37 ± 0.04 a24.38 ± 0.65 a6.81 ± 0.04 a9.45 ± 0.69 a
MarchCRS20190388.12 ± 0.62 b14.74 ± 0.67 b82.00 ± 7.07 bc0.98 ± 0.08 b0.37 ± 0.05 a22.76 ± 0.82 ab6.45 ± 0.04 b10.03 ± 0.79 a
AprilCRS201904104.92 ± 1.01 a11.10 ± 0.43 c108.00 ± 9.89 a1.05 ± 0.08 ab0.33 ± 0.08 a23.29 ± 0.79 ab6.725 ± 0.12 a10.67 ± 0.67 a
MayCRS20190588.12 ± 0.26 b15.17 ± 0.56 ab75.00 ± 9.89 c1.00 ± 0.07 b0.35 ± 0.01 a23.14 ± 0.63 ab6.38 ± 0.14 b9.74 ± 0.72 a
Data are presented by mean value ± SD; different lowercase letters indicate significant differences among different times.
Table 2. The analysis of two-way ANOVA with the indices treatments, time, and chemical properties of soil.
FactorIndexDfF Valuep Value
Treatments *AN3577.3940.000
AK314.5700.000
AP3971.6500.000
TN312.7630.000
TP34.8130.011
TK31.1440.356
pH39.9680.000
SOC336.8680.000
MonthsAN4840.8290.000
AK411.6740.000
AP4380.1100.000
TN423.8290.000
TP42.9590.045
TK45.0310.006
pH426.8270.000
SOC417.9660.000
Treatment × MonthsAN12142.8010.000
AK124.9290.001
AP12704.0790.000
TN122.3020.048
TP123.1730.011
TK121.0670.433
pH127.7860.000
SOC123.5260.006
AN19358.3750.000
Calibration modelAK197.8710.000
AP19678.1230.000
TN198.4860.000
TP193.3870.005
TK191.9140.079
pH1912.1390.000
SOC1911.8310.000
* Treatments included CK, CS, RS and CRS.
Publisher’s Note: MDPI stays neutral with regard to jurisdictional claims in published maps and institutional affiliations.

