Article

Regulated Deficit Irrigation and Its Effects on Yield and Quality of Vitis vinifera L., Touriga Francesa in a Hot Climate Area (Douro Region, Portugal)

1
GreenUPorto—Research Centre for Sustainable Agrifood Production & DGAOT, Faculty of Sciences, Campus de Vairão, University of Porto, Rua da Agrária, 747, 4485-646 Vairão, Portugal
2
Quinta do Crasto, S.A., 5060-063 Gouvinhas, Portugal
*
Author to whom correspondence should be addressed.
Agriculture 2021, 11(8), 774; https://doi.org/10.3390/agriculture11080774
Submission received: 13 July 2021 / Revised: 8 August 2021 / Accepted: 9 August 2021 / Published: 13 August 2021

Abstract

:
Under a climate change scenario, vineyards will experience serious challenges in the future. In an attempt to overcome such difficulties, this experiment offers a study on the effect of regulated deficit irrigation as a method for short-term adaptation to climate change in cv. Touriga Francesa, grafted into the rootstock 110R in the Douro region during a three-year period. Water stress on the plant and its effects on canopy, production, and quality of musts were analyzed. Rainfed vines (R0) were compared to three deficit irrigation regimes as a function of estimated crop evapotranspiration (ETc): R25 (25% ETc), R50 (50% ETc), and R75 (75% ETc). Water was applied on a weekly basis whenever predawn water potential showed moderate water stress until 15 days prior to harvest. The results suggest that rainfed plants under these circumstances suffered, in general, a negative impact on vine performance, while moderate water stress had more favorable effects on fruit composition, as well as in yield. Nonetheless, further studies should be conducted as irrigation did not show consistent effects on yield or berry composition.

1. Introduction

The topic of climate change today is intrinsically connected to the growing concerns that natural disasters such as droughts, floods, soil erosion, and desertification may significantly affect nature, crops, food production, and ultimately humanity in years to come [1].
One of the major concerns with a potential change in climate, alongside the rising of average temperatures, is an intensification of extreme events, such as increases in temperature extremes, severe precipitation, and hail [2,3,4]. In viticulture, global warming is expected to advance grapevine phenological stages, meaning that the ripening period will occur earlier in hotter climatic conditions [3,5,6,7]. This shift will affect grape composition, in particular with respect to aroma compounds [4]. Moreover, temperatures play an important role in berry sugar accumulation. Although high temperatures usually lead to an acceleration of sugar accumulation in berries, enhancing, even more, the average wine alcohol content, together with a lower content of anthocyanins and acidity [8,9,10], in extremely hot regions, where temperatures exceed the photosynthetic optimum during a considerable part of the growing season, this trend may be absent [9]. Another path that might explain sugar concentration is related to the occurrence of berry dehydration and shrinkage [10].
Alongside these changes in fruit composition, the water stress reduces yield and, when excessive, can lead to damage on leaves and stuck grape ripening [4].
Hereupon, seasonal fluctuations in yield, grape composition, and wine attributes, largely driven by variable climatic conditions, are major challenges for the wine industry aiming to meet consumer expectations for consistent supply, wine style, and product quality [11,12]. These changing weather patterns can lead to significant changes in the distribution and practice of viticulture, rendering some regions progressively unsuitable for cultivation [12,13,14,15,16,17]. This way, it is central to address known causes for this variability and identify management techniques, together with their limitations, the potential to modulate responses and minimize the effects of climate change [1,4,14,18].
Viticulture is widely practiced in dry climate regions, where the grapevine can be subjected to water stress [19]. One of the strategies to tackle this water deficit is to irrigate vines. However, when applying water to crops, most is lost to the atmosphere, some from evaporation from the soil surface and some from the loss through the stomata (transpiration) [20]. There will also be other losses as a result of poor distribution of water to the crop, excessive runoff, and weed transpiration [20]. Optimizing plant water use efficiency without affecting crop yield, grape and wine quality is crucial to limiting the use of water for irrigation and significantly improving viticulture sustainability [19].
Future projections for viticultural yield in Portugal under climate change scenarios show decreases throughout the country, particularly in the innermost winemaking regions [20]. To overcome these losses, irrigation is seen as a possible adaptation measure, which may significantly reduce water stress and secure more regular and predictable yields [21,22]. Nonetheless, this option implies a delicate balance between yield and quality, which is clearly dependent on environmental conditions, cultivar, and agronomic practices, thus requiring widespread experiments on the relationships among grapevine water status, yield, and quality [21]. The expectation is that irrigation techniques may be designed to minimize this yield issue, but some difficulties are not easy to avoid. For example, the practice of irrigation, particularly if performed with poor-quality water, is responsible for concentrate salts in the root zone [4,23]. Vines are highly sensitive to salt, and this practice can turn soils unsuitable for grape production, especially when winter rain is insufficient for leaching it out of the soil [4,23].
Shrinking water resources have prompted a move toward micro-irrigation methods, including such techniques as sub-surface drippers and drip lines or trickle tape located below plastic mulches, techniques that substantially increase water productivity [23]. Deficit irrigation, defined as the application of water below full crop-water requirement, is an important means of increasing water productivity and ideally sustaining crop productivity (or financial return) by maintaining or increasing grape quality under water scarcity [21,23].
Two variants of this strategy have been developed: regulated deficit irrigation, based on the principle that plant sensitivity to water stress (yield, quality) is not constant during all the phenological stages. Another strategy, partial root-zone drying, involves wetting and drying approximately half of the root system of plants in cycles of 8–14 days, depending on the soil type [21].
Regarding the first technique, which was used in the present study, it can be applied to accomplish different other objectives at distinct phenological stages, i.e., reducing berry cell division/berry size (at berry set phase) or inducing an accumulation of anthocyanins (at veraison) [24].
Nonetheless, some authors report that no significant yield improvements were observed for irrigated plants, although the trend was to obtain slightly higher yields under irrigation in years with low rainfall amounts, which is important to stabilize yield from year to year [22]. In some warmer and dryer regions, such as inner Alentejo and Douro/Porto, yield levels are still projected to decrease, even with suitable irrigation [20].
Hence, given these projections, additional adaptation measures should also be envisioned for the future sustainability of the national winemaking sector [20]. These include new drought-tolerant varieties/genotypes and rootstocks or the use of particle film technology, among others [7,19,25]. Irrigation might also be accompanied by soil management practices to increase soil water availability [25]. Potentially suitable practices can include the establishment of new vineyards on north-exposed slopes (or higher in altitude if relevant) or the shading of the clusters, either artificially [26] or by the neighboring leaves; the latter could be achieved either by giving up leaf removal or by increasing vigor [3]. Mulch or cover crops, if properly used and selected, also show a favorable effect since they improve soil characteristics and compete for water resources until mid-spring, a fact that can benefit the vigor control of grapevines [21].
The aim of this work was to study the effect of irrigation as a method for short-term adaptation to climate change in cv. Touriga Francesa in the Douro region during a three-year period. The results of this investigation showed that rainfed plants had, in general, a negative performance, while moderate water stress had more favorable effects on fruit composition, as well as in yield. Still, irrigation did not have consistent results on yield or berry composition, suggesting that other parameters (e.g., radiation or temperature) can also have a strong impact on this experiment.

2. Materials and Methods

2.1. Experimental Details

The experiment was conducted over three consecutive growing seasons (2018–2020) in a commercial irrigated vineyard located in Douro superior sub-region, within the Douro demarcated region (41°03′37″ N 7°03′58″ W). Thirteen-year-old Vitis vinifera L. cv. Touriga Francesa grapevines, grafted onto 110 Richter rootstocks with rows oriented northwest-southwest and a plant distance of 2.2 × 1.0 m (4546 plants/ha), were used for the study. Vines were spur-pruned on a royat single cordon with a bud load of approximately 10 buds per vine and trained to a vertical shoot positioned trellis system. Plants are in terraces with two rows of vines, in a steep hillside, with 45% of slope and an average altitude of 240 m. The climate is the Mediterranean, characterized by summers with hot to very hot days, fresh nights, and low levels of precipitation. The soil is schistic and predominantly acidic.
The trial was conducted in a randomized block experiment, with four treatments and three replicates (blocks) per treatment. Treatments corresponded to 25% ETc (R25), 50% ETc (R50), 75% ETc (R75), and control, a rainfed modality (R0). Each experimental unit included 10 plants in a total of 120 vines (4 treatments × 3 replicates × 10 vines).
Irrigation was applied on a weekly basis, and irrigated treatments were drip-irrigated by pipes installed 0.4 m above the soil and with drippers spaced 1 m, with a flow rate of 2 L/h in R25; 4 L/h in R50 and 6 L/h in R75. Reference evapotranspiration (ET0) was estimated from weather parameters recorded at a meteorological station located in the plot (METOS®. Pssl Instruments, Weiz, Austria). ET0 along with constant crop coefficient (Kc = 0.8) were used to calculate the amount of water required by the plants (ETc) using the equation ETc = Kc × ET0. The constant Kc was chosen from previous studies, considering the months where irrigation occurred, the vineyard characteristics, and the values described in the literature [27]. Precipitation was deducted from ETc each week.
The decision on starting irrigation was based on data provided by the soil probe (Aquagri, Oeiras, Portugal) installed in the field, when the value of predawn leaf water potential (Ψpd) reached—0.4 MPa, as well as according to the climatic condition forecasts.

2.2. Leaf Water Status, Vegetative Growth, and Canopy Density

Predawn leaf water potential (Ψpd) was evaluated on mature leaves (one per vine) of four representative vines per replicate using a Schölander pressure chamber (PMS Instruments, Model 600, Albany, NY, USA). This assessment was carried out during the growing season, performed every 15 days, 2 h before sunrise, in a total of 7 measurements in 2018, 8 measurements in 2019, and 7 in 2020.
In each season, the number of buds retained at winter pruning was registered on a per vine basis. Total leaf area and primary leaf area were assessed at harvest by measuring 12 representative shoots (fruitful shoots of average length) per treatment (4 per replicate), following a previously defined method [28]. Canopy density was also assessed each season, at harvest, by point quadrat analysis (LLN) [29], using 48 insertions per treatment (16 per replicate) in vegetative and bunch zones. Canopy surface area (ECSA) was registered at harvest, applying [29] methodology, with 12 measurements per treatment (4 per replicate).
In winter, shoot number and fresh pruning mass were recorded on a per vine basis. Budburst rate was calculated using the ratio between the number of shoots and the number of buds.

2.3. Reproductive Traits, Yield and Berry Composition

The harvest occurred on 1 October 2018, on 9 October 2019, and on 16 October 2020 season. For each vine, the yield was assessed by recording the number of clusters and their total fresh mass. Berry samples were collected by picking 100 berries per replicate in a total of 300 berries per treatment. In each sample were determined the berry weight (g), probable alcohol (%), using a refractometer (ATAGO®, Tokyo, Japan), pH using Crison® (CRISON Instruments, Barcelona, Spain), titratable acidity (g/L) by titration, malic acid (g/L), anthocyanins (mg/L) and polyphenols (mg/L) using Miura One® (Lisbon, Portugal), following Organisation Internationale de la Vigne et du Vin procedures [30].
Ravaz Index was calculated by expressing the ratio between the yield and pruning weight.

2.4. Statistical Analysis

Each season, one-way ANOVA analysis was performed separately, followed by Tukey HSD test at p < 0.05 using GraphPad Prism version 8.0 for Windows (GraphPad Software, La Jolla, CA, USA). Data are presented as mean value ± standard deviation.
Principal component analysis (PCA) of vigor, yield, and quality traits data was performed in R software version 3.5.3 using the FactoMineR package 1.4.1(Free Software Foundation’s GNU General Public License), following a previous method [31], and PCA visualization was achieved with Factoextra package 1.0.5 (Free Software Foundation’s GNU General Public License) [32].

3. Results

3.1. Weather Conditions and Irrigation

The weather conditions over the three years of study were quite variable, as shown in the graph in Figure A1. The winter of 2018 registered low temperatures and low rainfall, the spring was extremely cold and rainy, and similar characteristics were observed in the initial part of the summer, followed by a second phase, very hot and extremely dry. In 2019, there was high variability in temperatures throughout the year, being the year with the highest cumulative rainfall of the three-year trial. On the other hand, in the last year, the period between January and April was quite variable in terms of temperature, whereas in the summer, the values of temperature were higher than the previous years (Appendix A, Figure A1).
Growing Degree Days were also calculated from April until the end of October, and values observed were: 2217.5 °C in 2018, 2165.6 °C in the 2019 season, and 2277.2 °C in 2020.
Due to the different climatic conditions along the three years of the trial, irrigation started on different days each season. The greater amount of precipitation observed between spring and summer of 2018 conditioned the watering schedule that only started in August and was applied until mid-September. On the other hand, it was during 2019 that more water was applied, in a total of 12 times of irrigation, between June and September. In 2020, irrigation started in July and ended at the beginning of September, that is, 15 days before the harvest (Appendix A, Table A1).

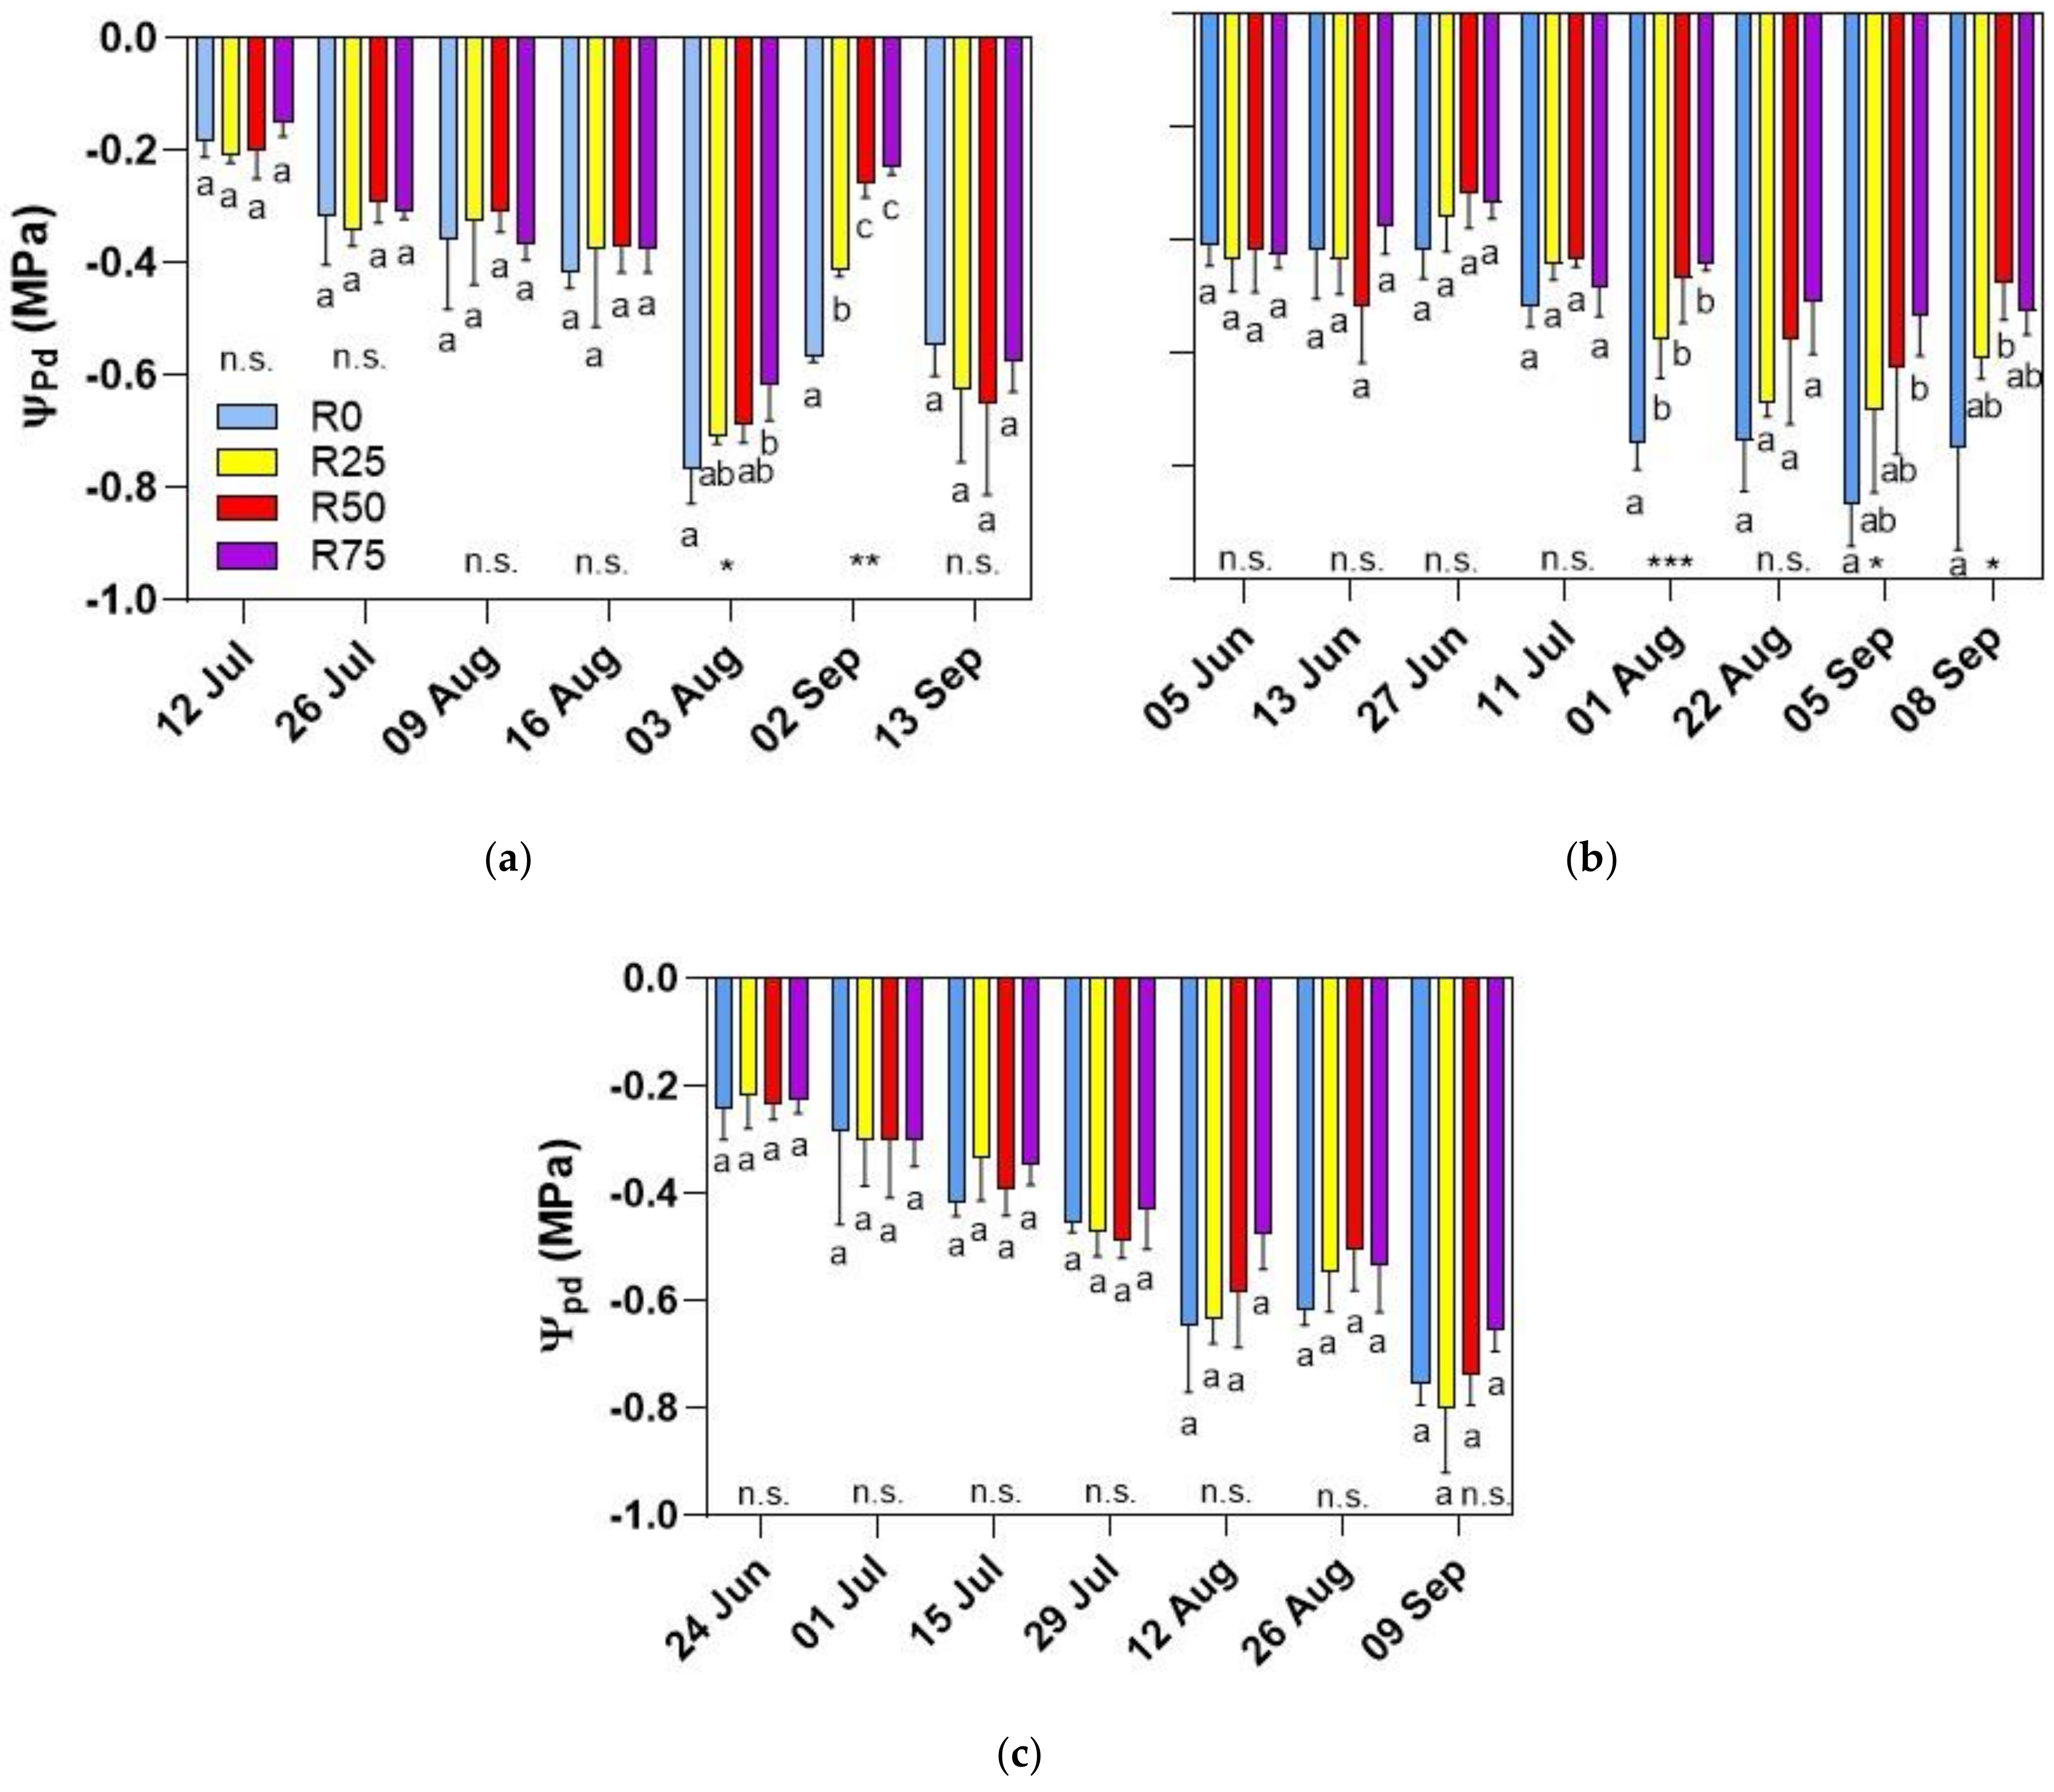
3.2. Leaf Water Status

The Ψpd measured along the growing season had, per usual, a decrease followed by a recovery at the end of the season, in September, when periods of precipitation frequently occur.
In 2018, the minimum value of Ψpd was measured on 30 August. On that day, the values measured were statistically different between treatment R0 and the one with the largest water supply. After that, water stress decreased due to the occurrence of rainfall in the previous days. Still, there were statistically significant differences between the two treatments with greater irrigation allocations and the two remaining treatments (R0 and R25) (Figure 1a).
In 2019, the values of the first four measurements were relatively similar, with moderated stress levels. As of August, there was a decrease in these potentials (except for R75). At the beginning of August, there were statistically significant differences between R0 and the watered treatments. In September, there were also more negative values in the control treatment, with results statistically different when compared to plants that were irrigated. The year 2019 was also the one in which the highest values of stress were observed throughout the season, as observed in Figure 1b, with values of Ψpd reaching—0.82 Mpa in R0 treatment in September.
In the last year of this experiment, 2020, a gradual decrease in water potentials was registered over time, thus increasing stress levels. However, there were no statistical differences in any of the records, from June until the last measurement, in September. The stress level increased around 50% at the end of the season when compared to the first registration (Figure 1c).

3.3. Vegetative Growth and Canopy Density

As the vineyard selected is located in a Mediterranean region, the deficit irrigation can be beneficial in order to allow the vine to develop plenty of canopy and leaf area to sustain berry growth and maturation. Irrigation had no significant impact on the primary leaf area or even on the total leaf area during the three years of this trial. Along the three seasons, there were no statistically significant differences between the four treatments, as observed in Table 1. However, the highest value of total leaf area was recorded in 2018, the year with higher levels of precipitation until a later stage, having a value that is 18% and 15% higher in comparison with 2019 and 2020, respectively. Regarding the leaf layer number, statistically significant differences were registered in 2020 between the non-irrigated treatment, which had a similar value to the R25 treatment when compared to R50 and R75. Thus, the two treatments with the greatest amount of irrigation had a value of about 31% higher than R0 and R25 (Table 1).
Regarding the exposed canopy surface area (ECSA), there were no statistically significant differences, as presented in Table 1, and the values are therefore very similar between treatments.
The pruning weight presented the lower value in 2019 and the highest in 2020 (Table 1). Differences were only recorded in 2019, between treatments R0 and R75, with the value of R0 being less than half of R75. However, there were no statistical differences in the remaining years, leading to the conclusion that irrigation did not have an impact on this parameter. The amount of precipitation that occurred during the period between the end of irrigation and the pruning season could also have some impact on these results, leading to differences between the three years of the trial.

3.4. Yield and Yield Components

As compared to the other three treatments, R0 had a lower yield in 2020 but similar values in 2018 and 2019. Significant differences were only detected in 2020, where higher values were recorded in R25 and R75 (Table 2).
The number of clusters per plant varied between seasons, and values were generally similar between treatments. In 2020, R0 presented a significantly lower number of clusters when compared to R25 and R75, and the R0 value was about 45% lower than those treatments, as observed in Table 2. Regarding the berry weight at harvest, there were no statistical differences between treatments. However, along the three seasons, R0 always presented lower values than the irrigated treatments (Table 2). In the three seasons, the ratio leaf area/yield had no significant differences between treatments. In the last year, R75 vines recorded the lowest ratio, as shown in Table 2. As for the Ravaz Index, no significant differences were observed when comparing the different treatments. The values in the first two years were, though, lower in the R50 plants (Table 2).

3.5. Berry Composition

At harvest, the results of potential alcohol were similar among the four treatments during the first two years. In 2020, potential alcohol was significantly higher at R0 and R25 compared to R75, which had the lowest value (Table 3). Along the trial, the pH measurements did not present significant differences, although the highest values were observed in the last year. Regarding titratable acidity, the same pattern was observed; therefore, there was no statistical difference in the three seasons between treatments. The values were still quite variable throughout the three years of the trial (Table 3).
On the other hand, as observed in Table 3, the anthocyanin and polyphenols content were higher in 2018, only presenting statistical differences in the last year of this experiment, between R75, which had the lowest value and R0 showing the highest, on both parameters.
As for the malic acid content, the highest values were recorded in 2020, but there were no significant differences between irrigated and non-irrigated plants (Table 3).

3.6. Principal Component Analysis of Vigor, Yield and Quality Analysis

As expected in a field trial, principal component analysis (Figure 2), revealed that biological replicates among different samples were dispersed, demonstrating a high variability over the years. The exception was observed in the R75 treatment, in which the biological replicates appeared quite clustered in the score plot, demonstrating low variability among the different blocks.
A clear separation between the extremes (R0 and R75), when compared to R25 and R50, is highly evident in the score plot (Figure 2). On the other hand, the various parameters evaluated are even more related to these two treatments, thus revealing greater benefits when compared to R0 and R75. Furthermore, R25 demonstrates an even greater benefit, presenting the highest average value in the score plot. Still, R75 demonstrates a less beneficial effect regarding the evaluated parameters during the three-year trial.

4. Discussion

4.1. Water Status and Vegetative Growth

The measurement of Ψpd provides an estimate of vine water status when leaf transpiration is greatly reduced and thus reflects the soil water availability in the wettest part of the soil, colonized by roots [33].
The seasonal variation of water status also had an impact on soil water availability, as well as the weather conditions at the beginning of the stress period, that affected the application of this irrigation methodology [34]. This way, the exact timing of water stress and its intensity had some variability between seasons, which can explain a weak correlation between vine performance or berry composition. Nevertheless, some other environmental factors, such as light intensity or temperature, in addition to water availability, could have an impact on these variables during the season [34,35].
The pattern of physiological responses to water deficits was similar in different treatments, either irrigated or non-irrigated. The water deficit was higher, especially in the middle/end of the season, even in well-irrigated vines (Figure 1), suggesting that these variations indicate that Ψpd is attributed to high vapor pressure deficit, wind speed, and solar radiation, characteristic of temporal variations in Mediterranean conditions, rather than soil water content [36]. Plant water status was also reduced in every treatment due to a combined effect of low humidity, higher temperatures and higher radiation, and soil water deficit [37].
Nevertheless, predawn leaf water potential was considered mild to moderate [38], thus slightly higher in R0, compared to the other treatments.
Water deficit did not have a significant impact on the vegetative growth or vigor in the conditions of the present study, suggesting that irrigation is not valuable to regulate vine vigor or controlling canopy development, since the water is applied after the end of vegetative growth, as opposed to water applied in more humid environments [39]. Since these vines suffer water stress and low water availability, especially R0 and R25, they are expected to be more acclimatized to periods of prolonged low water availability [40].
The leaf layer number and pruning weight were higher in irrigated vines, although these differences were not always significant. These results suggest that vine vegetative growth was stimulated by the water applied, as observed in other studies with different cultivars [41].

4.2. Reproductive Growth and Berry Composition

The small differences between treatments in water status seem to have a low impact on yield. As referred by Fraga et al., in Douro, due to rising temperatures and reduced rainfall, irrigation may not be sufficient to mitigate the decrease in yield [20].
Yield reduction could also be due to the carry-over effect of water stress on the number of clusters per shoot, as this parameter is determined during bud formation in the previous year [34]. Despite this effect not being clearly consistent across all the seasons, R75 treatment showed the highest average value in every season (Table 2). Yield had also shown differences in the last year of the trial, with non-irrigated vines showing the lowest value, but it did not impact berry weight, as Cooley et al. also observed [42]. Yield was only affected by irrigation in the third year of the experiment, in line with the results of other studies [43,44,45]. This can be explained by the fact that the number of potential clusters per vine had been determined during the previous year, before the introduction of the trial and irrigation treatments, not affecting the production of the first season of the study. In addition, carbohydrates held in the reserves can be mobilized under high plant demand, and, this way, the reserves from the previous year might be called upon in any growing cycle and masking the effects of the conditions in that cycle. On the other hand, under field conditions, rainfall events and soil characteristics explored by the root system may buffer the yield response under irrigation shortage [43]. The number of clusters per vine, leaf area to yield ratio, and berry weight did not present significant differences in most of the years, suggesting that the irrigation did not have a carry-over effect and, this way, did not affect bud fertility, a fact that is also reported by different authors, in other regions, with distinct cultivars [20,42,44]. This way, different factors, such as plant and soil characteristics, or even climatic factors, can heavily influence vine productivity of one year or have a cumulative effect on the following vintages.
According to the literature, berry development is intrinsically related to temperature, irrespective of the decision to irrigate or not [46]. The results of this trial are also in line with other works [42] since early berry development responses have been found when the mean seasonal temperature ranges from 15.5 to 20.5 °C [47], although in this study, the average temperature from budburst to harvest was slightly hotter, in two of the three years (21.0 °C in 2018, 20.1 °C in 2019, and 21.6 °C in 2020).
Yield was also similar in the first two seasons, which could be explained by the fact that dormant buds that carry the inflorescences of the following year are already present. The effect of applying water after the stage of inflorescence induction could be enough to sustain a normal sink supply, being responsible for maintaining the average number of clusters / vine [48]. The results also indicate that the differences in yield occurred only in 2020, the driest year. Differences in pruning weight were only registered in 2019, suggesting that except that season, vines had a suitable balance between vegetative growth and fruit yield.
No consistent pattern was observed in berry composition among irrigation treatments along the three seasons, suggesting that other climatic factors, as opposed to water status, might have affected these parameters. Probable alcohol only presented differences in the last season, in treatment R75, with the lowest value. This finding may be associated with the fact that by applying water when the berries start the ripening stage, a rise in phloem inflow occurs, which causes reverse drought-induced berry shrinkage and blocks sugar accumulation [49]. On the other hand, sugar accumulation can decrease under excessive irrigation, resulting in delayed fruit maturation [50]. No impacts in pH, titratable acidity, or malic acid were found, in contrast with those observed by other authors [51,52]. Values of pH were higher in 2020 compared to the previous seasons, but differences were small. This finding is opposite to the ones suggested by other authors that referred that malic acid metabolism and K+ uptake in berries were impacted by hot and dry years [53]. The sensitivity of pH was similar in other studies, suggesting that water status causes low impact in pH values and can be site- or variety-specific [54].
In the last season of the trial, higher polyphenol and anthocyanin concentration was observed in the non-irrigated treatment due to either a differential growth resource of skin and inner mesocarp tissue or to direct stimulation of biosynthesis [55,56,57]. Furthermore, higher anthocyanins content in berries of plants under water restrictions, in other words, the greater skin proportion, favors the extraction of total anthocyanins [37,58]. On the other hand, since no differences were found on berry weight between treatments, the difference in phenols could be an indirect effect of the cluster microclimate since a lower leaf layer number was recorded in R0 and R25, rather than a surface: volume ratio differential [50,51,59].
This way, according to our results, 25% ETc seems to be the most beneficial to guarantee the yield potential of the cultivar without compromising berry composition. This strategy is also a suitable option since it reduces water consumption, not altering canopy density or vegetative growth, and not affecting the quantity and quality of clusters.

5. Conclusions

The present study evaluated the performance of the Touriga Francesa cultivar under non-irrigated and three RDI regimes in the Mediterranean Douro region over a three-year period. Despite the variation from year to year in growing season temperatures, there were very few and only minor differences in vine physiology, growth, yield, and quality. Differences in vigor were only found in the 2019 vintage, where R75 was 45% higher concerning pruning weight when compared to R0. Leaf layer number in 2020 showed a value 20% higher in the two treatments with the highest amount of water supplied in comparison to the remaining.
Yield was different in the last year of the study, where R25 and R75 showed the highest values. When comparing quality traits, 2020 presented significant differences in probable alcohol (R75 was 8% lower than R0), as well as in anthocyanins and polyphenols (which were also higher in the rainfed treatment and significantly lower in R75).
Irrigation did not have consistent effects on yield or berry composition, suggesting that other parameters such as radiation or temperature can also have a strong impact, not only in that year but also in the following years. Still, rainfed plants showed, in general, a negative effect on vine performance, while moderate water stress had a more favorable effect on fruit composition, as well as in yield.
Regarding the amount of water supplied and its effects, when comparing all the analyzed parameters, the treatments R25 and R50 seem to be the most promising. However, R25 was the most efficient since it had a greater correlation between the parameters of yield, quality, and vigor/ vegetative expression. On the contrary, the treatment in which the greatest amount of water was supplied, R75, proved to be the least advantageous, with a lower relationship between the studied data, as also the one that showed a more negative score when observing the PCA biplot.
Interannual variability and extremes weather conditions, such as very high temperatures, may also have had a great influence on the results obtained in each season, as mentioned by other authors, and which may thus increase the variability over the years [16,60], regardless of the use of irrigation. Additionally, water use can be an effective technique to prevent irregular production and quality and thus be adapted from year to year, depending on the conditions that have occurred and those predicted.
Climate change in the Douro region is a cause of concern when referring to viticulture since a reduction in rainfall and an increase in evapotranspiration is expected to have a high socio-economic impact due to the current limitations in water suppliance and excessive heat. An increase in temperatures alongside the spatial and temporal changes in the rainfall distribution in this region [61] can have a negative impact on the flowering stage and berry set, leaf area, photosynthesis, flower set, and number of clusters. Even in a well-adapted cultivar to the region, as Touriga Francesa is, by reaching the maximum temperature threshold, these changes might lead to the loss of its specific organoleptic qualities and have detrimental effects on production.
In this context, considering the characteristics of the different “terroirs”, the need for conducting further field trials assessing the timing, the method, and the amount of water applied through irrigation in vineyards, considering has been highlighted [38,61,62,63,64,65] furthermore in such heterogeneous conditions as the ones observed in the Douro region.

Author Contributions

Conceptualization, I.L.C., J.Q. and T.N.; methodology I.L.C., J.Q. and A.C.; investigation, I.L.C., J.Q. and T.N.; resources, T.N. and I.L.C.; writing—original draft preparation, I.L.C., A.C. and J.Q.; writing—review and editing, I.L.C., A.C. and J.Q.; supervision, J.Q.; project administration, J.Q. and I.L.C.; funding acquisition. All authors have read and agreed to the published version of the manuscript.

Funding

This research received no external funding.

Institutional Review Board Statement

Not applicable.

Data Availability Statement

Data were obtained from a private company, Quinta do Crasto S.A., and are available from the authors with the permission of the company. Relevant data are contained within the article.

Acknowledgments

The authors acknowledge the support of Quinta do Crasto S.A. for allowing the performance of the experiment in their vineyards, in Quinta da Cabreira, as well as the possibility of carrying out all the analyzes in their facilities.

Conflicts of Interest

The authors declare no conflict of interest.

Appendix A

Figure A1. Monthly mean temperature (°C) and cumulative precipitation (mm) during the 2018 to 2020 seasons in the Douro superior sub-region.
Agriculture 11 00774 g0a1
Table A1. Day of irrigation and irrigation quantity (mm) in each treatment during each season in the Douro superior sub-region.
YearDayMonthQuantity (mm)Total/Day (mm)
R25R50R75
201803Aug3.527.0410.5621.12
17Aug4.378.7413.1126.22
24Aug3.116.239.3518.69
31Aug3.226.449.6619.31
201913Jun7.1314.2521.3842.76
21Jun2.364.737.0914.18
28Jun0.440.871.312.62
05Jul2.815.628.4316.85
12Jul3.557.0910.6421.27
19Jul3.356.6910.0420.07
26Jul4.198.3812.5725.15
01Aug3.246.479.7119.42
08Aug3.627.2410.8521.71
16Aug3.877.7511.6223.24
23Aug3.617.2210.8321.65
05Sep2.855.698.5417.07
202002Jul7.6615.3322.9945.98
09Jul3.436.8522.9920.56
16Jul2.464.9310.2814.78
23Jul4.118.227.3924.65
30Jul4.468.9312.3326.78
06Aug4.358.6913.3926.07
13Aug3.196.3813.0419.15
21Aug2.675.359.5716.04
28Aug3.557.098.0221.27
03Sep2.655.2910.6415.87

References

  1. Alonso, A.D.; O’Neill, M.A. Climate change from the perspective of Spanish wine growers: A three-region study. Br. Food J. 2011, 113, 205–221. [Google Scholar] [CrossRef]
  2. Easterling, D.R.; Meehl, G.A.; Parmesan, C.; Chagnon, S.A.; Karl, T.R.; Mearns, L.O. Climate extremes: Observations, modeling, and impacts. Science 2021, 289, 2068–2074. [Google Scholar] [CrossRef] [Green Version]
  3. Wu, J.; Drappier, J.; Hilbert, G.; Guillaumie, S.; Dai, Z.; Geny, L.; Delrot, S.; Darriet, P.; Thibon, C.; Pieri, P. The effects of a moderate grape temperature increase on berry secondary metabolites. OENO One 2019, 53, 321–333. [Google Scholar] [CrossRef]
  4. Van Leeuwen, C.; Darriet, P. The impact of climate change on viticulture and wine quality. J. Wine Econ. 2016, 11, 150–167. [Google Scholar] [CrossRef] [Green Version]
  5. Fraga, H.; Santos, J.A.; Moutinho-Pereira, J.; Carlos, C.; Silvestre, J.; Eiras-Dias, J.; Mota, T.; Malheiro, A.C. Statistical modelling of grapevine phenology in Portuguese wine regions: Observed trends and climate change projections. J. Agric. Sci. 2016, 154, 795–811. [Google Scholar] [CrossRef] [Green Version]
  6. Webb, L.B.; Whetton, P.H.; Barlow, E.W.R. Observed trends in winegrape maturity in Australia. Glob. Chang. Biol. 2011, 17, 2707–2719. [Google Scholar] [CrossRef]
  7. Duchêne, E.; Huard, F.; Dumas, V.; Schneider, C.; Merdinoglu, D. The challenge of adapting grapevine varieties to climate change. Clim. Res. 2010, 41, 193–204. [Google Scholar] [CrossRef] [Green Version]
  8. Gutiérrez-Gamboa, G.; Zheng, W.; Martínez de Toda, F. Current viticultural techniques to mitigate the effects of global warming on grape and wine quality: A comprehensive review. Food Res. Int. 2021, 139, 109946. [Google Scholar] [CrossRef] [PubMed]
  9. Greer, D.H.; Weston, C. Heat stress affects flowering, berry growth, sugar accumulation and photosynthesis of vitis vinifera cv. Semillon grapevines grown in a controlled environment. Funct. Plant Biol. 2010, 37, 206–214. [Google Scholar] [CrossRef]
  10. Keller, M. Managing grapevines to optimise fruit development in a challenging environment: A climate change primer for viticulturists. Aust. J. Grape Wine Res. 2010, 16, 56–69. [Google Scholar] [CrossRef]
  11. Clingeleffer, P.R. Plant management research: Status and what it can offer to address challenges and limitations. Aust. J. Grape Wine Res. 2010, 16, 25–32. [Google Scholar] [CrossRef]
  12. Jones, G.V.; White, M.A.; Cooper, O.R.; Storchmann, K. Climate change and global wine quality. Clim. Chang. 2005, 73, 319–343. [Google Scholar] [CrossRef]
  13. Ramos, M.C.; Martínez de Toda, F. Variability in the potential effects of climate change on phenology and on grape composition of tempranillo in three zones of the Rioja DOCa (Spain). Eur. J. Agron. 2020, 115, 126014. [Google Scholar] [CrossRef]
  14. Novello, V.; de Palma, L. Viticultural strategy to reduce alcohol levels in wine. In Alcohol Level Reduction in Wine; Vigne et Vin Publications Internationales: Bordeaux, France, 2013; pp. 3–8. [Google Scholar]
  15. Moriondo, M.; Jones, G.V.; Bois, B.; Dibari, C.; Ferrise, R.; Trombi, G.; Bindi, M. Projected shifts of wine regions in response to climate change. Clim. Chang. 2013, 119, 825–839. [Google Scholar] [CrossRef]
  16. Orduna, R.M. 2010. Climate change associated effects on grape and wine quality and production. Food Res. Int. 2010, 43, 1844–1855. [Google Scholar] [CrossRef]
  17. Nemani, R.R.; White, M.A.; Cayan, D.R.; Jones, G.V.; Running, S.W.; Coughlan, J.C.; Peterson, D.L. Asymmetric warming over coastal California and its impact on the premium wine industry. Clim. Res. 2001, 19, 25–34. [Google Scholar] [CrossRef] [Green Version]
  18. Battaglini, A.; Barbeau, G.; Bindi, M.; Badeck, F.-W. European winegrowers’ perceptions of climate change impact and options for adaptation. Reg. Environ. Chang. 2009, 9, 61–73. [Google Scholar] [CrossRef]
  19. Brillante, L.; Belfiore, N.; Gaiotti, F.; Lovat, L.; Sansone, L.; Poni, S.; Tomasi, D. Comparing kaolin and pinolene to improve sustainable grapevine production during drought. PLoS ONE 2016, 11, e0156631. [Google Scholar] [CrossRef]
  20. Fraga, H.; Garcia de Cortazar-Atauri, I.; Santos, J. Viticultural irrigation demands under climate change scenarios in Portugal. Agric. Water Manag. 2018, 196, 66–74. [Google Scholar] [CrossRef]
  21. Medrano, H.; Tomás, M.; Martorell, S.; Escalona, J.-M.; Pou, A.; Fuentes, S.; Flexax, J.; Bota, J. Improving water use efficiency of vineyards in semi-arid regions. A review. Agron. Sustain. Dev. 2015, 35, 499–517. [Google Scholar] [CrossRef] [Green Version]
  22. Miras-Avalos, J.M.; Fandino, M.; Trigo-Cordoba, E.; Martinez, E.M.; Moutinho-Pereira, J.; Correia, C.M.; Dinis, L.T.; Rey, B.J.; Malheiro, A.C.; Cancela, J.J. Effects of surface and subsurface drip irrigation on physiology and yield of ‘Godello’ grapevines grown in Galicia, NW Spain. Cienc. Tec. Vitivinic. 2017, 32, 42–52. [Google Scholar] [CrossRef] [Green Version]
  23. Davies, W.J.; Zhang, J.; Yang, J.; Dodd, I.C. Novel crop science to improve yield and resource use efficiency in water-limited agriculture. J. Agric. Sci. 2010, 149, 123–131. [Google Scholar] [CrossRef]
  24. Dry, P.R.; Longbottom, M.L.; Mcloughlin, S.; Johnson, T.E.; Collins, C. Classification of reproductive performance of ten winegrape varieties. Aust. J. Grape Wine Res. 2010, 16, 47–55. [Google Scholar] [CrossRef]
  25. Santillán, D.; Garrote, L.; Iglesias, A.; Sotes, V. Climate change risks and adaptation: New indicators for Mediterranean viticulture. Mitig. Adapt. Strateg. Glob. Chang. 2020, 25, 881–899. [Google Scholar] [CrossRef]
  26. Oliveira, M.; Teles, J.; Barbosa, P.; Olazabal, F.; Queiroz, J. Shading of the fruit zone to reduce grape yield and quality losses caused by sunburn. J. Int. Sci. Vigne Vin 2014, 48, 179–187. [Google Scholar] [CrossRef]
  27. Prichard, T.; Hanson, B.; Schwankl, L.; Verdegaal, P.; Smith, R. Deficit Irrigation of Quality Winegrapes Using Micro-Irrigation Techniques; University of California Davis: Lodi, CA, USA, 2004. [Google Scholar]
  28. Lopes, C.; Pinto, P. Easy and accurate estimation of grapevine leaf area with simple mathematical models. Vitis 2005, 44, 55–61. [Google Scholar] [CrossRef]
  29. Smart, R.; Robinson, M. Sunlight into Wine. A Handbook for Winegrape Canopy Management; Winetitles: Adelaide, Australia, 1991. [Google Scholar]
  30. Organisation Internationale de la Vigne et du Vin. Recueil des Méthodes Internationales D’analyses des Vins et des Moûts; Organisation Internationale de la Vigne et du Vin: Paris, France, 1990. [Google Scholar]
  31. Lê, S.; Josse, J.; Husson, F. FactoMineR: An R package for multivariate analysis. J. Stat. Softw. 2008, 25, 1–18. [Google Scholar] [CrossRef] [Green Version]
  32. Kassambra, A. Practical Guide to Principal Component Methods in R: PCA, M(CA), FAMD, HCPC, Factoextra STHDA; Free Software Foundation’s GNU General Public License. Volume 2. Available online: https://www.datanovia.com/en/wp-content/uploads/dn-tutorials/book-preview/principal-component-methods-in-r-preview.pdf (accessed on 10 March 2021).
  33. Améglio, T.; Archer, P.; Cohen, M.; Valancogne, C.; Daudet, F.; Dayau, S.; Cruiziat, P. Significance and limits in the use of predawn leaf water potential for tree irrigation. Plant Soil 1999, 207, 155–167. [Google Scholar] [CrossRef]
  34. Buesa, I.; Pérez, D.; Castel, J.; Intrigliolo, D.; Castel, J. Effect of deficit irrigation on vine performance and grape composition of vitis vinifera l. cv. muscat of Alexandria. Aust. J. Grape Wine Res. 2017, 23, 251–259. [Google Scholar] [CrossRef]
  35. Baeza, P.; Sanchéz-de-Miguel, P.; Centeno, A.; Junquera, P.; Linares, R.; Lissarrague, J. Water relations between leaf water potential, photosynthesis and agronomic vine response as a tool for establishing thresholds in irrigation scheduling. Scient. Hort. 2007, 114, 151–158. [Google Scholar] [CrossRef]
  36. Naor, A.; Bravdo, B.; Hepner, Y. Effect of postveraison irrigation level on sauvignon blanc yield, juice quality and water relations. S. Afr. J. Enol. 1993, 14, 19–25. [Google Scholar]
  37. Acevedo-Opazo, C.; Ortega-Farias, S.; Fuentes, S. Effects of grapevine (Vitis vinifera L.) water status on water consumption, vegetative growth and grape quality: An irrigation scheduling application to achieve regulated deficit irrigation. Agric. Water Manag. 2010, 97, 956–964. [Google Scholar] [CrossRef]
  38. van Leeuwen, C.; Trégoat, O.; Choné, X.; Bois, B.; Pernet, D.; Gaudillére, J.-P. Vine water status is a key factor in grape ripening and vintage quality for red Bordeaux wine. How can it be asssed for vineyard management purposes? Oeno One 2009, 43, 121–134. [Google Scholar] [CrossRef]
  39. Trigo-Córdoba, E.; Bouzas-Cid, Y.; Orriols-Fernández, I.; Díaz-Losada, E.; Mirás-Avalos, J. Influence of cover crop treatments on the performance of a vineyard in a humid region. Span. J. Agric. Res. 2015, 13, 1–12. [Google Scholar] [CrossRef] [Green Version]
  40. Munitz, S.; Schwartz, A.; Netzer, Y. Effect of timing of irrigation initiation on vegetative growth, physiology and yield parameters in cabernet sauvignon grape vines. Aust. J. Grape Wine Res. 2020, 26, 220–232. [Google Scholar] [CrossRef]
  41. Intrigliolo, D.; Castel, J. Response of grapevine cv. ‘Tempranillo’ to timing and amount of irrigation: Water relations, vine growth, yield and berry and wine composition. Irrig. Sci. 2010, 28, 113–125. [Google Scholar] [CrossRef]
  42. Cooley, N.; Clingeleffer, P.; Walker, R. Effect of water deficits and season on berry development and composition of cabernet sauvignon (Vitis vinifera L.) grown in a hot climate. Aust. J. Grape Wine Res. 2017, 23, 260–272. [Google Scholar] [CrossRef]
  43. Trigo-Córdoba, E.; Bouzas-Cid, Y.; Orriols-Fernández, I.; Mirás-Avalos, J. Effects of deficit irrigation on the performance of grapevine (Vitis vinifera L.) cv. ‘Godello’ and ‘Treixadura’ in Ribeiro, NW Spain. Agric. Water Manag. 2015, 161, 20–30. [Google Scholar] [CrossRef]
  44. Lanari, V.; Palliotti, A.; Sabbatini, P.; Howell, G.S.; Silvestroni, O. Optimizing deficit irrigation strategies to manage vine performance and fruit composition of field-grown ‘Sangiovese’ (Vitis vinifera L.) grapevines. Sci. Hortic. 2014, 179, 239–247. [Google Scholar] [CrossRef]
  45. Junquera, P.; Lissarrague, J.; Jiménez, L.; Linares, R.; Baeza, P. Long-term effects of different irrigation strategies on yield components, vine vigour, and grape composition in cv. cabernet-sauvignon (Vitis vinifera L.). Irrig. Sci. 2012, 30, 351–361. [Google Scholar] [CrossRef]
  46. Gouveia, J.; Lopes, C.; Pedroso, V.; Martins, S.; Rodrigues, P.; Alves, I. Effect of irrigation on soil water depletion, vegetative growth, yield and berry composition of the grapevine variety Touriga Nacional. Ciência Téc. Vitiv. 2012, 27, 115–122. Available online: http://hdl.handle.net/10400.5/6380 (accessed on 15 March 2021).
  47. Sadras, V.; Petrie, P. Quantifying the onset, rate and duration of sugar accumulation in berries from commercial vineyards in contrasting climates of Australia. Aust. J. Grape Wine Res. 2011, 17, 190–198. [Google Scholar] [CrossRef]
  48. Chaves, M.M.; Santos, T.P.; Souza, C.R.; Ortuño, M.F.; Rodrigues, M.L.; Lopes, C.M.; Maroco, J.P.; Pereira, J.S. Deficit irrigation in grapevine improves water-use efficiency while controlling vigour and production quality. Ann. Appl. Biol. 2007, 150, 237–252. [Google Scholar] [CrossRef]
  49. Keller, M.; Zhang, Y.; Shrestha, P.; Biondi, M.; Bondada, B. Sugar demand of ripening grape berries leads to recycling of surplus phloem water via the xylem. Plant Cell Environ. 2015, 38, 1048–1059. [Google Scholar] [CrossRef]
  50. Hepner, Y.; Bravdo, B.; Loinger, C.; Cohen, S.; Tabacman, H. Effect of drip irrigation schedules on growth, yield, must composition and wine quality of cabernet-sauvignon. Am. J. Enol. Vitic. 1985, 36, 77–85. [Google Scholar]
  51. Lopes, C.; Vicente-Paulo, J.; Santos, T.; Rodrigues, M.; Barroso, J.; Chaves, M. An attempt to quantify grapevine water stress in a mediterranean environment. In Proceedings of the XIIémes Journées GiESCO, AGRO, Montpellier, France, 3–7 July 2001; pp. 43–48. [Google Scholar]
  52. Pire, R.; Ojeda, M. Vegetative growth and quality of grapevine ‘chenin blanc’ irrigated under three pan evaporation oefficients. Fruits 1999, 54, 135–139. [Google Scholar]
  53. Sipiora, M.; Anderson, M.; Mathews, M. Composition of Vitis vinifera L. cv. Pinot noir fruit and wines from carneros appellation in response to potassium fertilization and supplemental irrigation. In Proceedings of the Soil Environment and Vine Mineral Nutrition Symposium, San Diego, CA, USA, 29–30 June 2004; Christensen, L.P., Smart, D.R., Eds.; American Society for Enology and Viticulture: Davis, CA, USA, 2005; pp. 185–192. [Google Scholar]
  54. Matthews, M.; Anderson, M. Fruit Ripening in vitis vinifera L.: Responses to Seasonal Water Deficits. Am. J. Enol. Vitic. 1988, 39, 313–320. [Google Scholar]
  55. Roby, G.; Matthews, M. Relative proportions of seed, skin and flesh, in ripe berries from Cabernet Sauvignon grapevines grown in a vineyard either well irrigated or under water deficit. Aust. J. Grape Wine Res. 2004, 10, 74–82. [Google Scholar] [CrossRef]
  56. Owen, S.; Lafond, M.; Bowen, P.; Bogdanoff, C.; Usher, K.; Abrams, S. Profiles of abscisic acid and its catabolites in developing Merlot grape (Vitis vinifera) berries. Am. J. Enol. Vitic. 2009, 60, 277–284. [Google Scholar]
  57. Gambetta, G.; Mathews, M.; Shaghasi, T.; McElrone, A.; Castellarin, S. Sugar and abscisic acid signalling orthologs are activated at the onset of ripening in grape. Planta 2010, 232, 219–234. [Google Scholar] [CrossRef] [Green Version]
  58. Ginestar, C.; Easthan, J.; Gray, S.; Iland, P. Use of sap-flow sensors to schedule vineyard irrigation. II. Effect of post-veraison water deficits on composition of Shiraz grape vines. Am. J. Enol. Vitic. 1998, 49, 421–428. [Google Scholar]
  59. Hardie, W.; O’Brien, T.; Jaudzens, V. Cell biology of grape secondary metabolism—A viticultural perspective. In Proceedings of the Ninth Austalian Wine Industry Technical Conference, Adelaide, Australia, 16–19 July 1995; Australian Wine Industry Technical Conference Inc.: Adelaide, Australia, 1997; pp. 78–82. [Google Scholar]
  60. Jones, G.; Davis, R. Using a synoptic climatological approach to understand climate-viticulture relationships. Int. J. Clim. 2000, 20, 813–837. [Google Scholar] [CrossRef]
  61. Pachauri, R.K.; Allen, M.R.; Barros, V.R.; Broome, J.; Cramer, W.; Christ, R.; Church, J.A.; Clarke, L.; Dahe, Q.; Dasgupta, P.; et al. Climate Change 2014: Synthesis Report. Contribution of Working Groups I, II and III to the Fofth Assessment Report of the Intergovernmental Panel on Climate Change; IPCC: Geneva, Switzerland, 2014. [Google Scholar]
  62. Jones, G.V.; Alves, F. Impact of climate change on wine production: A global overview and regional assessment in the douro valley of Portugal. Int. J. Global Warm. 2012, 4, 383–406. [Google Scholar] [CrossRef]
  63. Düring, H. Testing for drought tolerance in grapevine scions. Angew. Bot. 1986, 60, 103–111. [Google Scholar]
  64. dos Santos, T.P.; Lopes, C.M.; Lucília Rodrigues, M.; de Souza, C.R.; Ricardo-da-Silva, J.M.; Maroco, J.P.; Pereira, J.S.; Chaves, M.M. Effects of deficit irrigation strategies on cluster microclimate for improving fruit composition of moscatel field-grown grapevines. Sci. Hortic. 2007, 112, 321–330. [Google Scholar] [CrossRef]
  65. Intrigliolo, D.S.; Pérez, D.; Risco, D.; Yeves, A.; Castel, J.R. Yield components and grape composition responses to seasonal water deficits in Tempranillo grapevines. Irrig. Sci. 2012, 30, 339–349. [Google Scholar] [CrossRef]
Figure 1. Seasonal variation of predawn leaf water potentials for Touriga Francesa cultivar under rainfed and irrigation conditions in (a) 2018, (b) 2019, and (c) 2020. Values are represented as mean ± standard deviation. Asterisks indicate significant differences between treatments at p < 0.05; n.s.—non significative. Days represented by different letters indicate significant differences between treatments.
Agriculture 11 00774 g001
Figure 2. Principal component analysis biplot of vigor parameters, yield, and quality traits, from grape berries cv. “Touriga Francesa”, under rainfed and irrigation conditions in 2018 (18), 2019 (19), and 2020 (20) vintages. Biological replicates in the score plot, are shown with the same color within each sample type, and the length of the arrows associated with the different parameters is proportional to its contribution to the overall sample distribution. Vigor parameters: TLA—total leaf area, PW—pruning weight; yield parameters: Y—yield, CW—clusters weight; quality parameters: PA—probable alcohol, pH, TA—titratable acidity, A—anthocyanins, p—polyphenols, MA—malic acid. Gray dot represents the average value of the four treatments (R0, R25, R50, and R75).
Agriculture 11 00774 g002
Table 1. Primary leaf area, total leaf area, leaf layer number (LLN), exposed canopy surface area (ECSA), and pruning weight of rainfed and irrigated vines during each season. Values are represented as mean ± standard deviation. In each column, values with different letters show a statistical significance at p < 0.05 by Tukey HSD test. (¹) Assessed by point quadrat methodology [27]. (²) Assessed by exposed canopy surface area [27].
Year/TreatmentPrimary LA (m2/Vine)Total LA (m2/Vine)LLN (1)ECSA (m2) (2)Pruning Weight (kg/Vine)
2018
R01.54 ± 0.90 a3.46 ± 2.44 a1.79 ± 0.23 a13,026 ± 885.7 a0.54 ± 0.22 a
R251.39 ± 0.59 a2.94 ± 1.06 a2.04 ± 0.51 a12,548 ± 1068.0 a0.58 ± 0.21 a
R501.92 ± 0.71 a3.53 ± 1.38 a1.98 ± 0.18 a12,746 ± 1143.0 a0.56 ± 0.22 a
R751.49 ± 0.44 a3.17 ± 0.79 a2.02 ± 0.19 a12,459 ± 1309.0 a0.53 ± 0.20 a
p-value0.250.770.750.610.74
2019
R00.76 ± 0.40 a2.01 ± 1.06 a1.44 ± 0.41 a11,496 ± 1168.0 a0.36 ± 0.16 b
R250.89 ± 0.34 a2.48 ± 1.72 a1.56 ± 0.51 a11,103 ± 1589.0 a0.47 ± 0.17 ab
R501.20 ± 0.56 a3.54 ± 1.65 a1.96 ± 0.43 a10,628 ± 1580.0 a0.48 ± 0.18 ab
R750.96 ± 0.54 a2.73 ± 1.48 a2.04 ± 0.36 a11,151 ± 1715.0 a0.52 ± 0.23 a
p-value0.150.680.310.580.01
2020
R01.34 ± 0.52 a2.73 ± 1.29 a1.42 ± 0.25 b11,580 ± 1829.0 a0.52 ± 0.15 a
R251.61 ± 0.27 a2.69 ± 0.51 a1.44 ± 0.23 b12,618 ± 1259.0 a0.68 ± 0.15 a
R501.71 ± 1.09 a2.97 ± 1.82 a2.07 ± 0.16 a12,419 ± 1026.0 a0.71 ± 0.15 a
R751.55 ± 0.45 a2.78 ± 1.17 a2.06 ± 0.07 a12,201 ± 1343.0 a0.96 ± 0.38 a
p-value0.590.950.0030.300.21
Table 2. Number of clusters per vine, yield, berry weight leaf area to yield ratio, and Ravaz Index of rainfed and irrigated vines during each season. Values are represented as mean ± standard deviation. In each column, values with different letters show a statistical significance at p < 0.05 by Tukey HSD test.
Year/TreatmentClusters/VineYield (kg/Vine)Berry Weight (g)LA/Yield (m2/kg)Ravaz Index
2018
R09.73 ± 0.32 a1.70 ± 0.27 a1.70 ± 0.17 a2.51 ± 0.89 a3.17 ± 0.11 a
R259.57 ± 0.85 a1.74 ± 0.29 a1.87 ± 0.18 a1.70 ± 0.59 a3.06 ± 0.37 a
R509.13 ± 0.55 a1.57 ± 0.23 a1.77 ± 0.04 a2.23 ± 0.38 a2.80 ± 0.24 a
R759.53 ± 1.43 a1.83 ± 0.24 a1.81 ± 0.20 a1.78 ± 0.50 a3.49 ± 0.54 a
p-value0.860.680.620.380.19
2019
R013.23 ± 1.25 a1.68 ± 0.24 a1.58 ± 0.10 a1.23 ± 0.48 a4.63 ± 0.77 a
R2512.33 ± 0.38 a1.81 ± 0.50 a1.66 ± 0.08 a1.42 ± 0.56 a3.82 ± 0.35 a
R5012.40 ± 1.15 a1.82 ± 0.36 a1.63 ± 0.20 a1.87 ± 1.12 a3.79 ± 0.48 a
R7513.40 ± 0.85 a2.13 ± 0.42 a1.77 ± 0.12 a1.39 ± 0.81 a4.11 ± 0.42 a
p-value0.450.560.410.780.38
2020
R04.37 ± 0.55 b0.55 ± 0.23 b1.54 ± 0.11 a3.34 ± 1.44 a1.13 ± 0.68 a
R257.90 ± 1.21 a1.17 ± 0.35 a1.67 ± 0.11 a2.46 ± 0.84 a1.77 ± 0.64 a
R506.80 ± 1.15 ab1.13 ± 0.17 ab1.76 ± 0.16 a2.63 ± 0.52 a1.60 ± 0.09 a
R757.93 ± 0.78 a1.41 ± 0.05 a1.74 ± 0.10 a1.97 ± 0.63 a1.60 ± 0.52 a
p-value0.0060.0090.200.400.54
Table 3. Influence of rainfed and irrigated vines in grape composition during each season. Ant.—anthocyanin content; Pol.—polyphenol content. Values are represented as mean ± standard deviation. In each column, values with different letters show a statistical significance at p < 0.05 by Tukey HSD test.
Year/TreatmentProbable Alcohol (% v/v)pHTitratable Acidity (g/L)Ant. (mg/L)Pol. (mg/L)Malic Acid (g/L)
2018
R014.08 ± 0.83 a3.97 ± 0.07 a4.59 ± 0.32 a216.70 ± 13.53 a969.50 ± 26.97 a1.92 ± 0.47 a
R2514.85 ± 0.46 a3.98 ± 0.12 a4.22 ± 0.32 a234.70 ± 8.80 a1066.00 ± 72.97 a1.68 ± 0.50 a
R5014.60 ± 0.76 a3.98 ± 0.09 a4.36 ± 0.38 a228.30 ± 13.53 a1030.00 ± 48.30 a1.80 ± 0.42 a
R7513.95 ± 0.64 a3.83 ± 0.15 a4.31 ± 0.32 a203.30 ± 23.53 a954.40 ± 14.96 a1.42 ± 0.43 a
p-value0.390.320.600.150.120.60
2019
R012.58 ± 0.93 a3.78 ± 0.09 a4.90 ± 0.21 a112.30 ± 24.55 a673.90 ± 106.40 a1.24 ± 0.17 a
R2512.78 ± 0.30 a3.82 ± 0.10 a4.92 ± 0.04 a130.30 ± 10.49 a713.20 ± 13.38 a1.31 ± 0.32 a
R5012.50 ± 0.09 a3.73 ± 0.07 a5.10 ± 0.07 a105.70 ± 16.24 a654.30 ± 21.68 a1.26 ± 0.17 a
R7512.18 ± 0.25 a3.74 ± 0.07 a4.98 ± 0.17 a104.00 ± 12.53 a628.90 ± 78.99 a1.26 ± 0.17 a
p-value0.560.540.390.280.510.98
2020
R015.10 ± 0.35 a4.07 ± 0.05 a4.50 ± 0.08 a159.30 ± 18.15 a806.30 ± 64.90 a2.15 ± 0.18 a
R2515.07 ± 0.38 a4.00 ± 0.01 a4.45 ± 0.04 a149.70 ± 25.15 ab744.00 ± 56.53 ab1.89 ± 0.18 a
R5014.70 ± 0.46 ab4.00 ± 0.12 a4.43 ± 0.08 a116.70 ± 18.01 ab700.20 ± 49.25 ab2.03 ± 0.21 a
R7513.93 ± 0.25 b3.89 ± 0.08 a4.55 ± 0.09 a108.30 ± 7.64 b637.40 ± 15.92 b1.69 ± 0.32 a
p-value0.020.100.230.020.020.17
Publisher’s Note: MDPI stays neutral with regard to jurisdictional claims in published maps and institutional affiliations.

