Article

Effects of Short-Term Rice Straw Return on the Soil Microbial Community

1
Northeast Institute of Geography and Agroecology, Chinese Academy of Sciences, Changchun 130102, China
2
University of Chinese Academy of Sciences, Beijing 100049, China
3
College of Biotechnology, Tianjin University of Science and Technology, Tianjin 300457, China
4
Faculty of Agriculture, Jilin Agricultural University, Changchun 130102, China
*
Authors to whom correspondence should be addressed.
Agriculture 2021, 11(6), 561; https://doi.org/10.3390/agriculture11060561
Submission received: 1 June 2021 / Revised: 15 June 2021 / Accepted: 16 June 2021 / Published: 18 June 2021
(This article belongs to the Special Issue Advanced Research of Soil Microbial Functional Diversity)

Abstract

:
Rice straw is a byproduct of agricultural production and an important agricultural resource. However, rice straw has not yet been effectively used, and incorrect treatment methods (such as burning in the field) can cause serious damage to the environment. Studies have shown that straw returning is beneficial to soil, but there have been few studies focused on the effect of the amount of short-term straw returned on the soil microbial community. This study evaluates 0%, 50%, 75%, and 100% rice straw returned to the field on whether returning different amounts of straw in the short term would affect the diversity and composition of the soil microbial community and the correlation between bacteria and fungi. The results show that the amount of straw returned to the field is the main factor that triggers the changes in the abundance and composition of the microbial community in the paddy soil. A small amount of added straw (≤50% straw added) mainly affects the composition of the bacterial community, while a larger amount of added straw (>50% straw added) mainly affects the composition of the fungal community. Returning a large amount of straw increases the microbial abundance related to carbon and iron cycles in the paddy soil, thus promoting the carbon and iron cycle processes to a certain extent. In addition, network analysis shows that returning a large amount of straw also increases the complexity of the microbial network, which may encourage more microbes to be niche-sharing and comprehensively improve the ecological environment of paddy soil. This study may provide some useful guidance for rice straw returning in northeast China.

1. Introduction

Mollisols, also known as black soil, are one of the most precious soil resources in China [1,2], and original black soil is fertile and rich in organic matter. However, due to long-term anthropogenic and destructive cultivation, the organic matter content in the topsoil of black soil has decreased rapidly [3], leading to soil degradation [1], which has seriously affected the sustainability of agricultural development in the black soil area. Crop straw contains a lot of organic matter and nutrient elements that are essential for plant growth [4]. Returning straw to the field can input a large amount of organic matter into the soil [5], and in this process, a series of complex biochemical reactions would occur in the soil system, such as the mineralization of nitrogen and the priming effect from the decomposition of organic matter, which can significantly improve soil quality [6,7].
As a traditional agricultural country, China produces about 1.04 billion metric tons of crop straw every year [8]. Straw returning to fields is increasingly recommended by researchers based on its beneficial effects on crop yield and soil quality [9,10,11]. Microorganisms play a leading role in crop straw decomposition. When the appropriate amount of crop straw is incorporated into the soil, the nutrient content in the soil will increase to promote the growth of soil microorganisms [12]. However, microbial processes for crop straw decomposition are affected by the straw quality and other abiotic factors influencing soil microbial activity and community composition, such as soil type and temperature, nitrogen (N) and phosphorus (P) levels, pH, and the C/N ratio [13,14,15,16,17]. Therefore, microbial activities and communities will have different characteristics in different areas when the straw is returned to the field. Northeast China is a high-latitude region with obvious seasonality and is highly sensitive to climate change. The long-term low-temperature environment has seriously influenced microbial activity and community composition [18]. Most recent research has focused on the effect of straw returning on the physical and chemical properties of the soil, while studies focusing on the ecological effects of returned straw on the soil microbial community are relatively rare.
Soil types directly affect the composition of soil microorganisms. The flood-and-drain cycles that occur in the production of rice create shifts in reduced and oxidized environments, providing a suitable growth environment for a wide variety of microbes. Therefore, there are significant differences in microbial communities between upland and paddy fields [19,20,21]. For example, the abundance of bacteria in paddy soil is much higher than that in upland soil, especially nitrogen-fixing cyanobacteria. However, the abundance of fungi and actinomycetes in paddy fields is relatively low compared to upland soil [22]. Nitrification and denitrification in paddy soil regulate the ratio of carbon to nitrogen in the soil, thus having a certain positive effect on the decomposition process of rice straw [23,24,25].
In addition, the amount of straw returned to the field also affects the composition and diversity of soil microorganisms. Yang et al. found that straw returning altered the soil microbial community composition and increased the functional diversity [26]. Zhao et al. found that small amounts (≤4500 kg·ha−1) of long-term straw incorporation did not affect the soil microbial community, while the incorporation of large quantities (9000 kg·ha−1) of straw significantly altered the soil microbial community structure [27]. In this study, we aim to explore the effects of the quantity of rice straw returned on the diversity and co-occurrence pattern of soil microbial communities in northeast China. The findings may provide a reference for the practice of straw returning in northeast China.

2. Materials and Methods

2.1. Site Description

The study was carried out in Wanchang County, Jilin City, Jilin Province, China (43°73′ N, 125°89′ E). This site belongs to the continental dry-cold monsoon climate in the northern temperate zone, with an average annual temperature of 5.3 °C and an annual rainfall of approximately 677.4 mm. The precipitation is concentrated from June to August. The soil type in this area is Mollisol with a clay soil quality; the basic physical and chemical properties of the soil are as follows: The soil organic matter content is 13.34 g·kg−1, the total nitrogen content is 0.51 mg·kg−1, the available phosphorus content is 5.83 mg·kg−1, the available potassium content is 162.82 mg·kg−1, and the soil pH is 6.73.

2.2. Experimental Design

A randomized complete block designed field experiment was used to test the effect of four paddy straw treatments (0% straw returned, 50% returned [low level], 75% returned [middle level], and all aboveground straw returned [high level]) on soil microbial properties. The experiment had three blocks, and each block contained four paddy fields (12 total fields). They were then randomly assigned with one paddy straw treatment in October 2017. Fields were 300 square meters each (20 m long and 15 m wide). The straw used for returning to the paddy field was the rice variety straw Ji Hong 9, with a high yield and stress resistance (The carbon-nitrogen ratio of rice straw is 55:1). The specific process of returning straw to the paddy field was as follows: After the rice matured, the rice straw was cut into 5–10 cm segments and evenly covered on the surface of the farmland. Then, the mulched straw was rotated into the soil by a rotary tiller, and the returned depth was 0–20 cm. Rice was planted on the ground, and machine transplanting (sowing density was 30 × 13 cm) was performed. There was no other soil disturbance except straw returning and rice planting. Conventional fertilization (Urea 325 kg·hm−1, diamine 120 kg·hm−1, potassium chloride 120 kg·hm−1) and water management were used for rice planting. The paddy field was irrigated on 1 May, and the irrigation was cut off on September 10. The experiment was carried out for two years. In November 2019, the soil samples were collected from the paddy soil (0–20 cm). The soil extractor bit was an undisturbed soil extractor with a length of 20 cm and a diameter of 38 mm. Five drills of soil were taken from each field, evenly mixed into a sample, and then stored in a refrigerator at 4 °C. The samples for soil DNA extraction were stored in a refrigerator at −80 °C.

2.3. DNA Extraction and High-Throughput Sequencing

Soil microbial DNA was extracted from each sample (0.5 g) using a Fast DNA SPIN Kit (MP Bio Laboratories, Carlsbad, CA, USA) according to the manufacturer’s instructions. The obtained DNA was dissolved in sterile distilled water, and the quality and quantity of the DNA were checked by a NanoDrop 2000 (Thermo Scientific, Schwerte, Germany). For bacteria, the V3-V4 region of the 16S rRNA gene (the sequences of the primers used were 341F 5′-ACTCCTACGGGAGGCAGCA-3′ and 785R 5′-GGACTACHVGGGTWTCTAAT-3′) was amplified to determine the composition of the bacterial community [28]. For fungi, the ITS1 region (the sequences of the primers used were ITS1F 5′-CTTGGTCATTTAGAGGAAGTAA-3′ and ITS2R 5′-GCTGCGTTCTTCATCGATGC-3′) was amplified to determine the composition of the fungal community [29,30,31]. Finally, PCR amplicons were used to construct the library, which was sequenced by the Illumina NovaSeq platform (Illumina, San Diego, CA, USA).
QIIME2 (https://view.qiime2.org/, accessed on 30 January 2020) was used to analyze the raw sequencing data [32]. For bacterial data, the vsearch plug-in was used to merge the paired sequences, then the quality filter plug-in was used. The obtained effective sequencing was used to remove the redundancy of bacterial sequences to obtain representative sequences by the deblur plug-in; for fungi, the data2 plug-in was used to denoise the data and obtain the representative sequence and redundant sequence feature table. Then, a phylogenetic plug-in was used to construct a phylogenetic tree using representative sequences. The diversity plug-in was used to calculate the core diversity of the data, including the Shannon index, Bray-Curtis clustering, the UniFrac distance matrix, etc. Based on the representative sequence, the bacterial taxonomy refers to the Greengene database gg_13_8 with a 99% similarity, while the fungal taxonomy refers to the UNITE database version 7.1 with a 97% sequence similarity using the feature-classifier plug-in. Usearch v.10 was used to identify representative operational taxonomic units (OTUs) [33].

2.4. Data Analysis

Principal component analysis (PCA) was carried out according to the distance matrix of Bray-Curtis clustering strains through the PCoA function of the vegan package in R version 4.0.2 to represent the clustering of each group of samples [34,35]. The coinertia function of the ade4 package in R version 4.0.2 was used to calculate and plot the interaction between bacteria and fungi when different amounts of straw were returned to the field [36]. To prove the correlation between bacterial and fungal communities, Gephi 0.9.2 was used to analyze the Spearman correlation coefficients of total OTUs (|R| ≥ 0.8, p < 0.05), and the values of nodes and edges were calculated [37,38]. The correlation coefficient was calculated using the corr.test function in R software version 4.0.2 and the psych software package [37,39].

3. Results

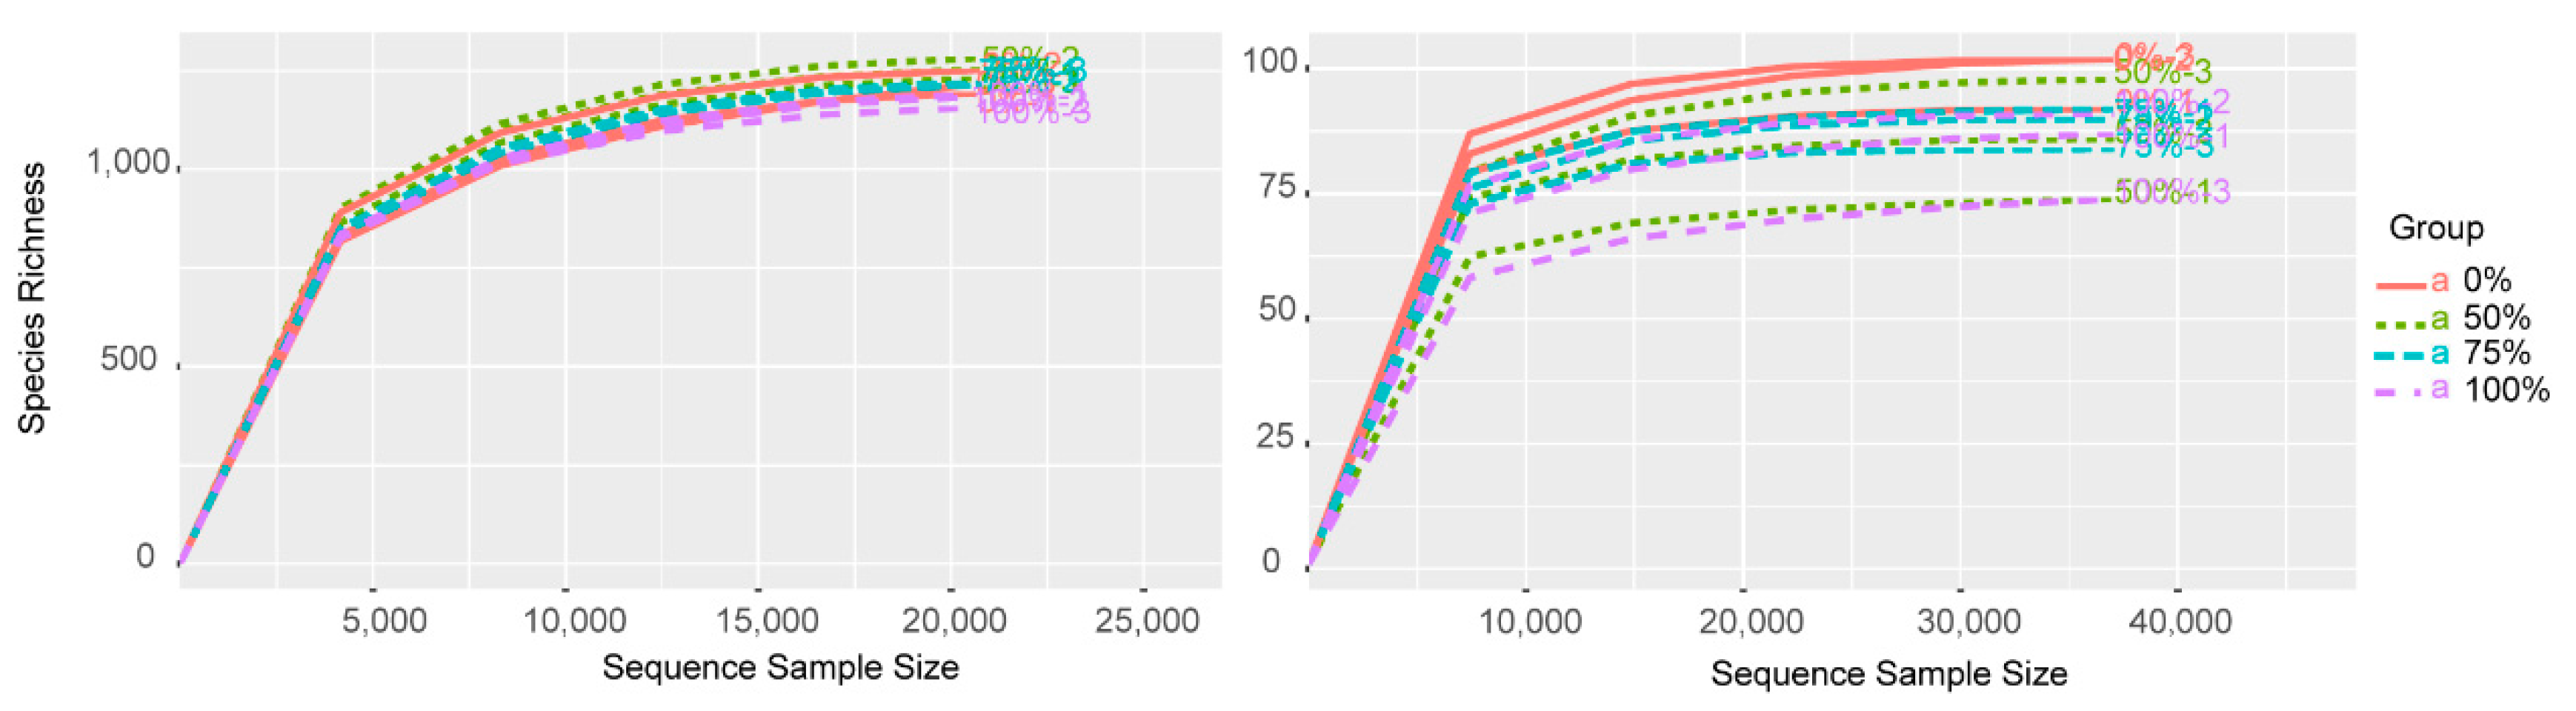
3.1. Alpha Diversity of the Microbial Communities

According to the results of the high-throughput sequencing data, a total of 1,883,851 reads were obtained for bacteria, and 1,695,371 reads were obtained for fungi from the samples after quality filtering and resampling. A total of 14,628 bacterial OTUs were obtained, while a total of 1246 fungal OTUs were obtained from the samples. The numbers of shared bacterial- and fungal-related OTUs were 6492 (44.38% of total) and 432 (34.67% of total), respectively. The rarefication curves of all the samples showed that the curves were saturated (Figure A1), indicating that the sequencing data were sufficient to represent the species obtained.
The alpha diversity indices (Chao1, ACE, Shannon, and Simpson indices) of the bacterial and fungal communities were calculated, as shown in Table 1. The results showed no significant difference among the treatments in terms of bacterial alpha diversity (Chao1, ACE, Simpson, and Shannon indices). However, the amount of straw returned to the paddy field significantly affected the richness of the fungal community. The Chao1 and ACE indices for the 75% straw returning and 100% straw returning treatments were significantly lower than those of the 0% straw returning treatment, while there were no significant differences among the treatments in terms of Shannon and Simpson index values. In addition, we also found that the number of fungal OTUs observed in the straw returning treatment was significantly lower than that of the treatment without straw returning, but there were no significant differences among the treatments in terms of bacterial OTUs. The results showed that the amount of straw returned to the paddy field had no influence on the bacterial alpha diversity, while increasing the amount of straw returned to the paddy field caused the richness of the fungal community and the number of OTUs to significantly decrease.

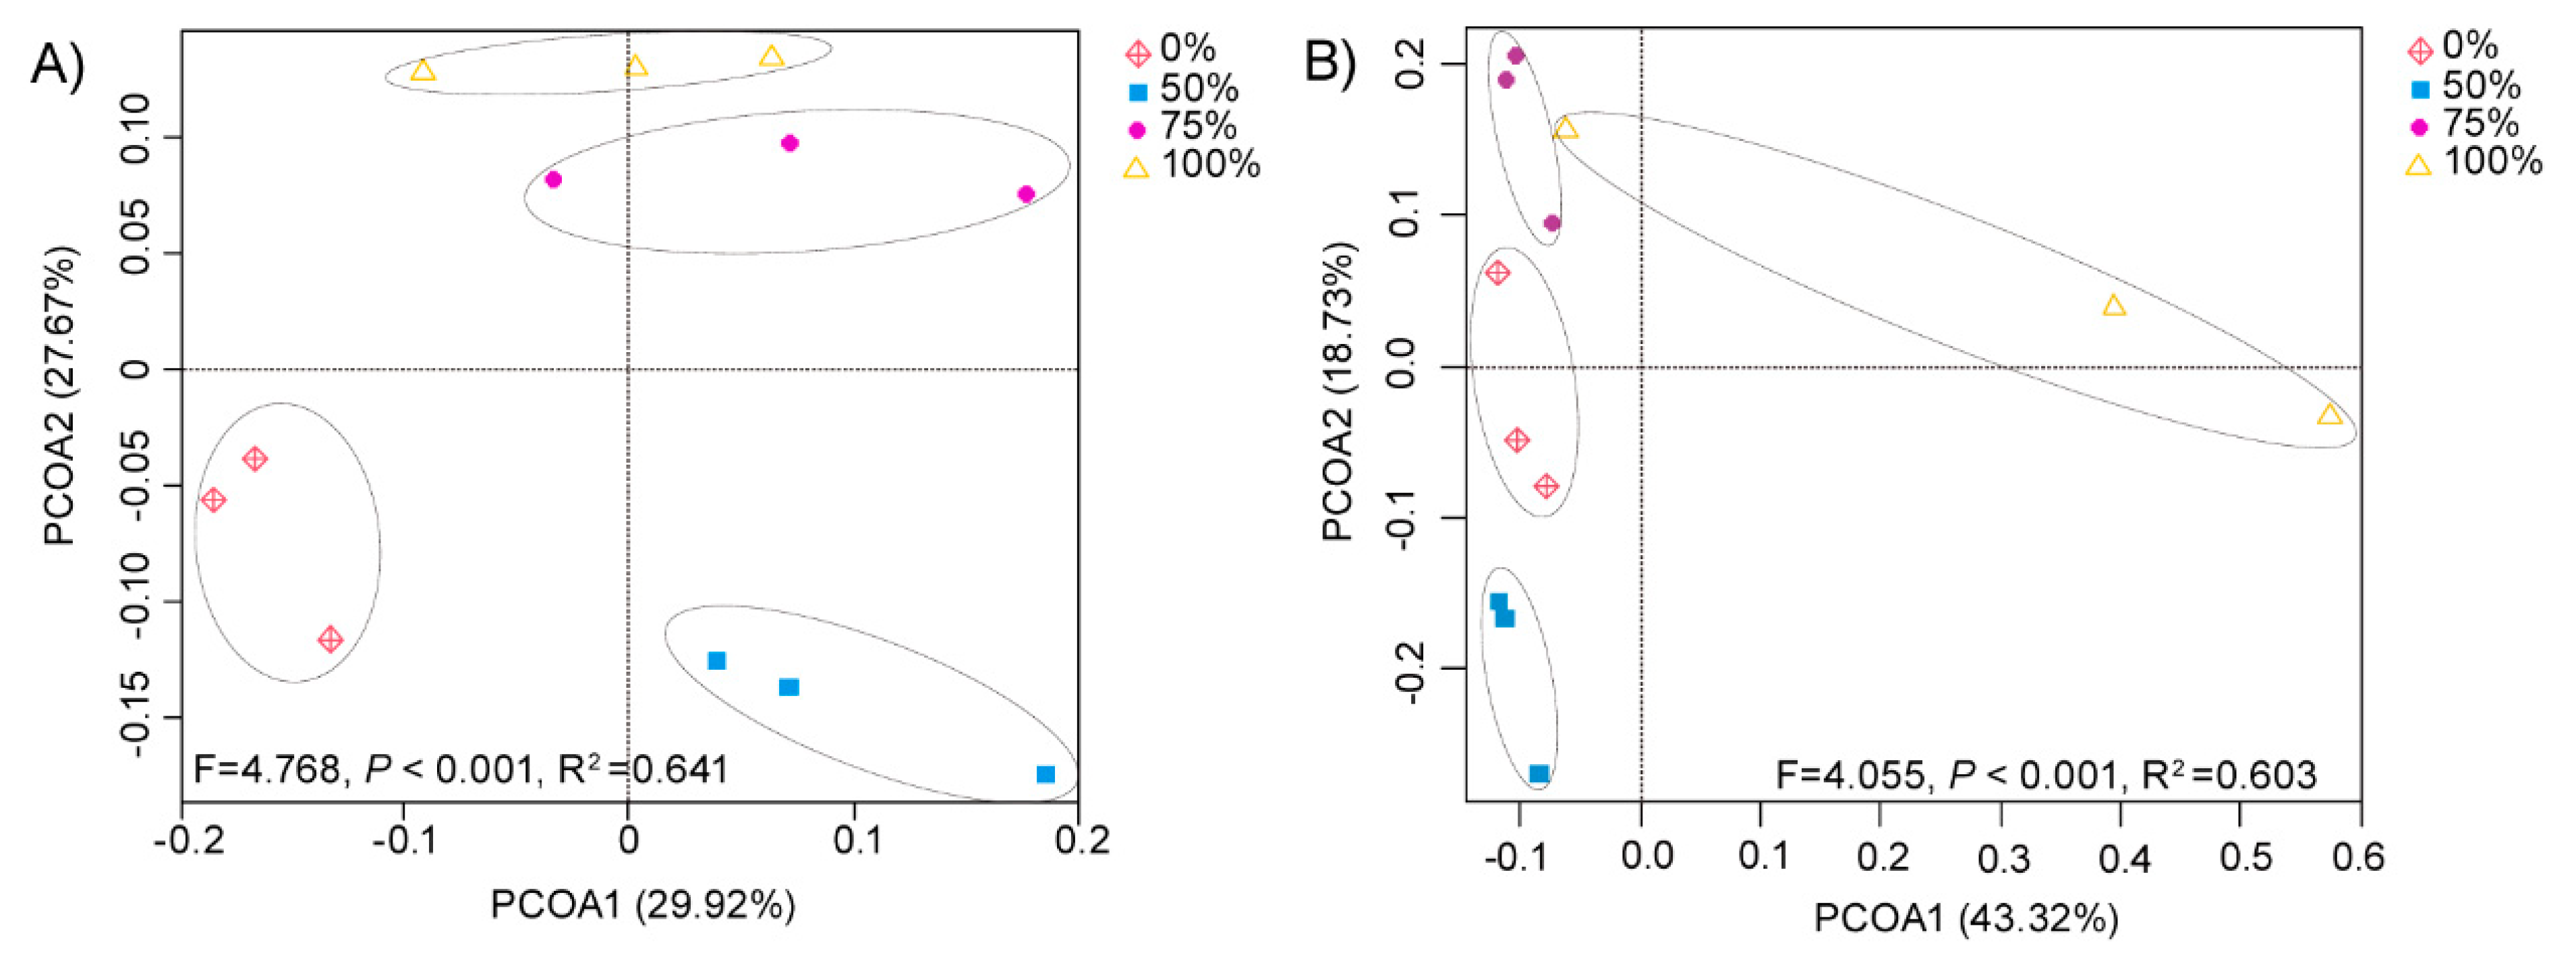
3.2. Effect of Rice Straw Returning on Bacterial and Fungal Beta Diversity

Based on the unweighted UniFrac distance (Figure 1), we found that the composition of soil communities varied among different treatments (p < 0.001). Specifically, relatively unique bacterial communities were observed for the control field (0% straw returning) and the field with a low level of straw addition (50% straw returning). The bacterial communities of fields treated with middle and high levels of straw additions (75% and 100% straw returning) were relatively similar to each other, but differed from those fields treated with smaller straw additions (Figure 1A). The amount of straw returned to the paddy fields had different effects on the fungal community compared with the bacterial community. We found that the fungal communities of medium and high levels of straw return (50% and 75% straw return) were relatively similar to the fungal communities without straw return (0% straw return). However, there were specific differences between the treatments of middle and high levels of straw return. Additionally, the fungal community of fields treated with 100% rice straw differed from those of the other three treatments (Figure 1B). The results showed that the composition of the bacterial community was more likely to be affected by a low level of straw addition, while the composition of the fungal community was more likely affected by a high level of straw addition.

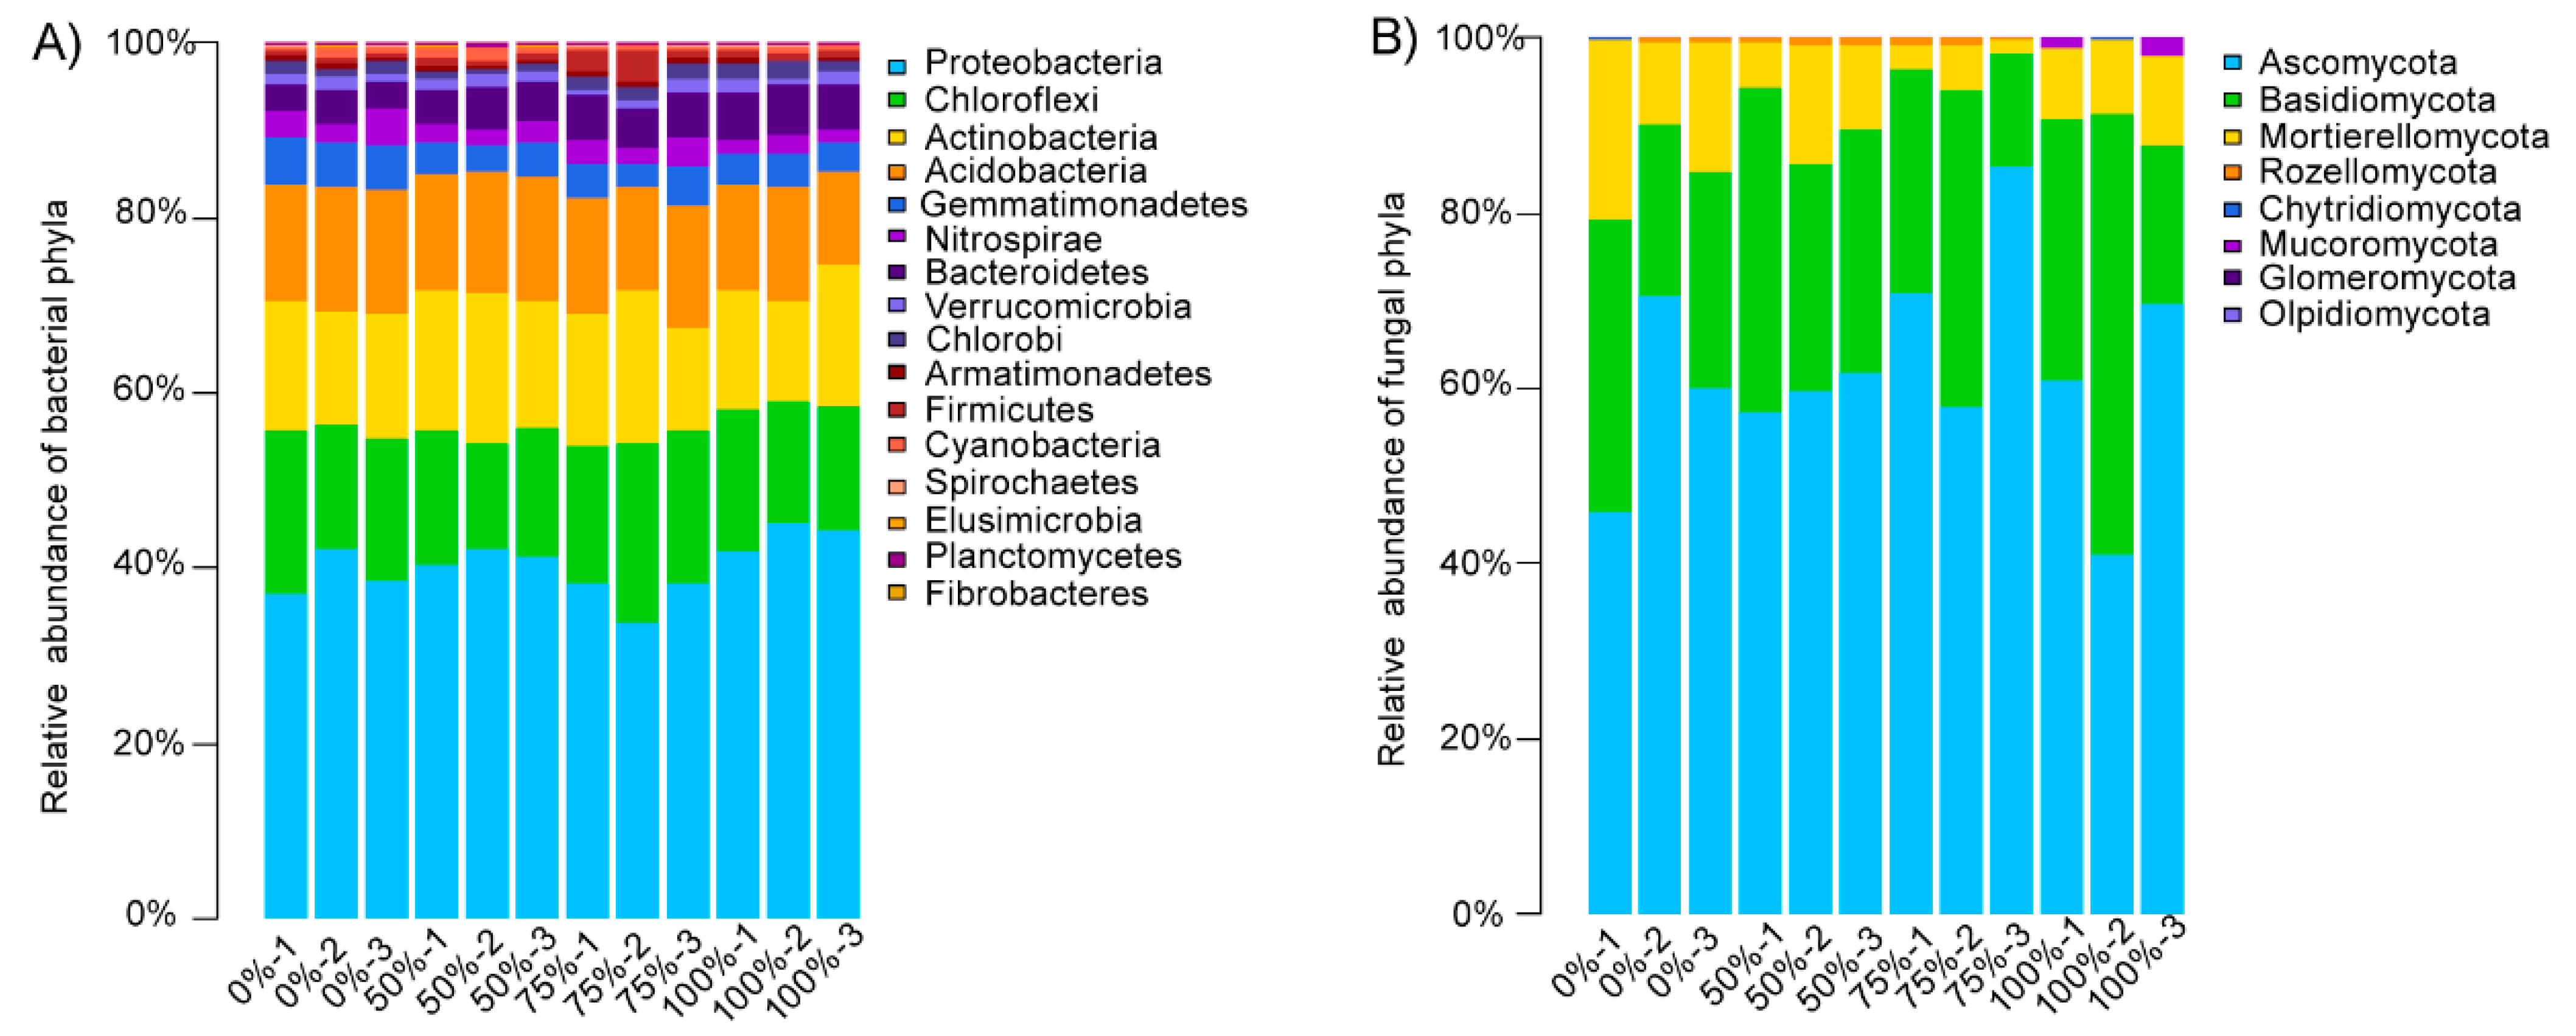
3.3. Compositional Characteristics of Soil Microbial Communities under Different Straw Addition Levels

3.3.1. Compositional Characteristics of Soil Bacterial Communities under Different Straw Addition Levels

The relative abundances of the bacteria phyla at different levels of straw addition were shown in Figure 2A. The main bacterial phyla were Proteobacteria (33.75–45.36%), Chloroflexi (12.27–20.47%), Actinobacteria (11.15–17.55%), Acidobacteria (10.64–14.19%), Gemmatimonadetes (2.91–5.47%), Nitrospirae (1.55–4.19%), and Bacteroidetes (2.84–5.76%). We found that the composition of the bacterial communities in the paddy soil was affected by the addition of straw and that different amounts of straw had different effects on the composition of the bacterial communities (Table 2). For example, the relative abundance of Bacteroidetes increased significantly as the amount of straw added increased. In addition, Acidobacteria, Cyanobacteria, and Nitrosoirae were more abundant in the treatments involving small amounts of straw additions (≤50% straw returning); Proteobacteria was the most abundant in the treatments involving high amounts of straw additions; and Gemmatimonadetes was the most abundant in the treatments with no straw addition.
We also tested the effect of straw treatments on the abundance of common (≥1%) bacteria genera (Table 3). The relative abundance of Flavobacterium in the phylum Bacteroidetes increased significantly after the addition of straw. In the treatment without straw addition, the relative abundance of Flavobacterium was only 0.45%, while the relative abundance of Flavobacterium increased to 2.02–2.62% after the addition of straw. The relative abundances of Candidatussolibacter (2.54–2.87%) and Candidatuskoribacter (2.06–2.56%), in the phylum Acidobacteria, tended to be lower in fields with large straw additions (>50% straw returning) than fields with low straw additions (3.37–4.36% and 3.17–3.81%, respectively). The relative abundance of Nitroospira in the phylum Nitrosoirae decreased with the addition of straw (decreased by 0.97–1.21%). The changes in the Proteobacteria sub-group were more complicated; for example, the relative abundance of Geobacter, Pseudomonas, and Crenohrix in the treatment involving a high level of straw addition increased significantly (increased by 5.10%, 2.09%, and 5.24%, respectively).

3.3.2. Compositional Characteristics of Soil Fungal Communities under Different Straw Addition Levels

The relative abundances of the fungal phyla at different levels of straw addition were shown in Figure 2B. The main fungal phyla were Ascomycota (20.92–85.20%), Basidiomycota (13.02–50.51%), and Mortierellomycota (15.88–20.42%). We found that the amount of straw added had no significant effect on the fungal phylum level. Only Mucoromycota became more abundant when high levels of straw were added (Table 2). Further analysis of the level of fungi with a relative abundance of more than 1% (Table 3) showed that the addition of straw had a particular effect on the fungi genus level. The addition of straw reduced the relative abundance of several genera of putative pathogens (Didymella, Candida, Articulospora, Microdochium, Nigrospora, Talaromyces, and Mortierella).

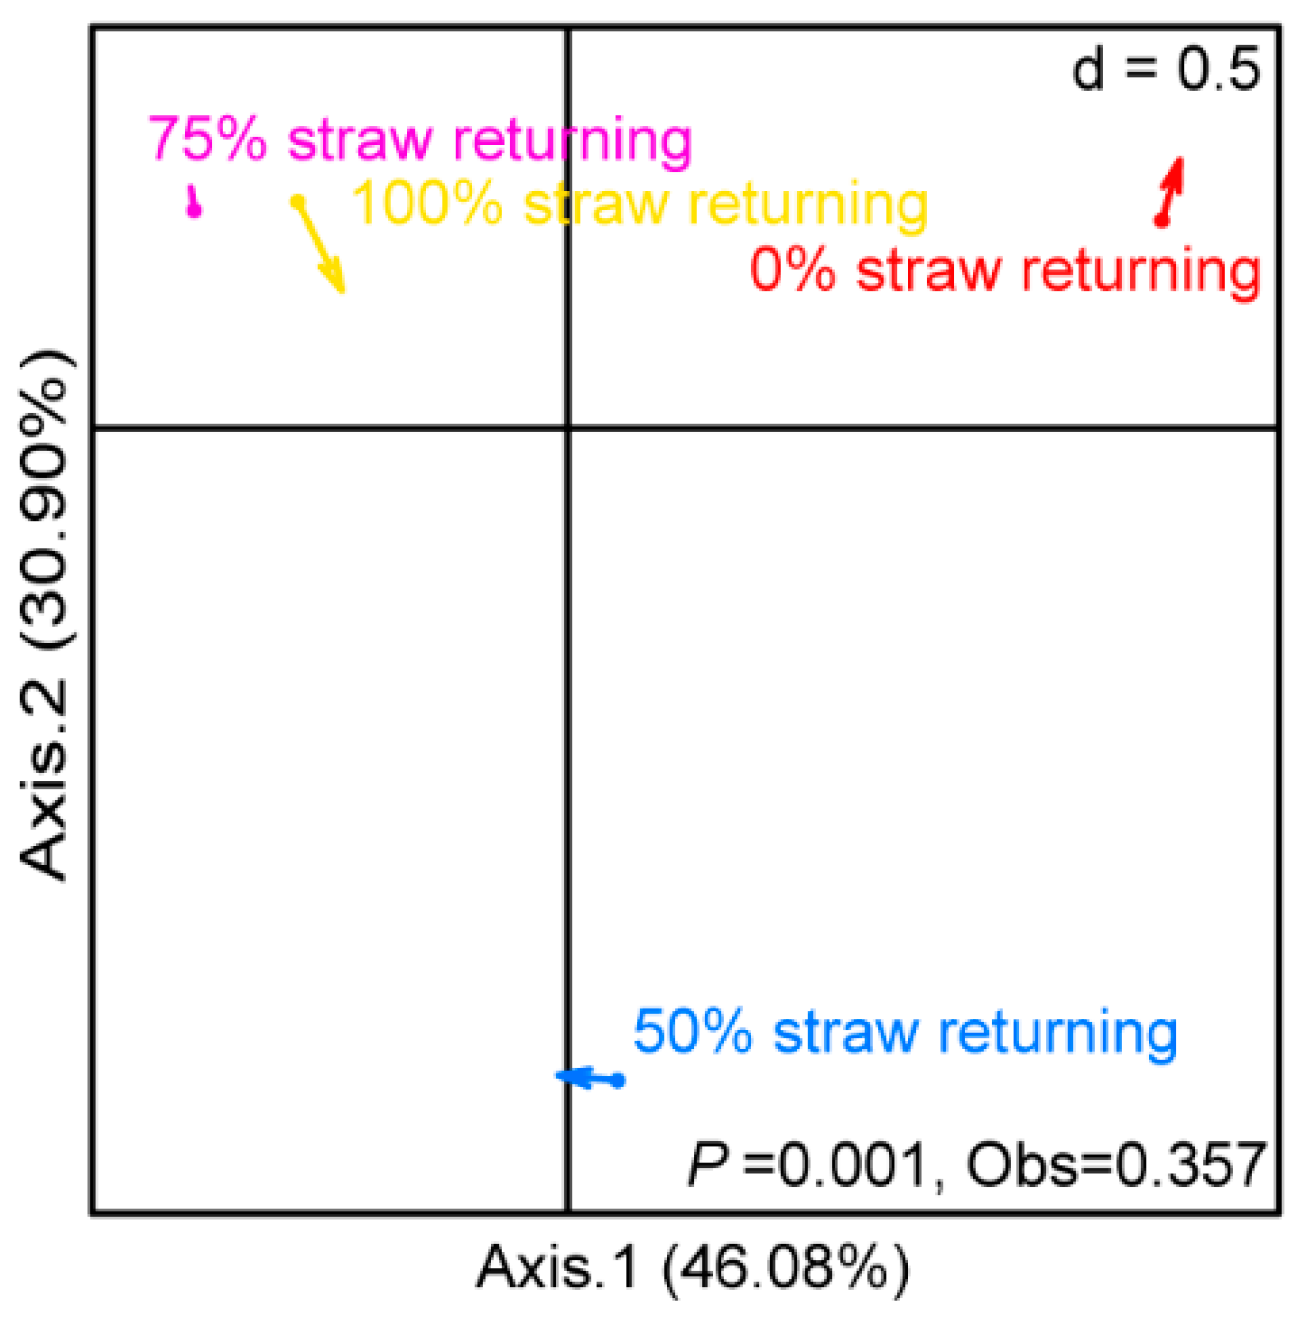
3.4. Correlation between Bacteria and Fungi under Different Straw Addition Levels

Co-inertial analysis (COIA) was used to investigate the covariance of the bacterial and fungal community structure in paddy soil under different straw additions (Figure 3). The plotting results of the bacterial and fungal communities were combined into a new ordination plot, in which the positions of the bacterial and fungal communities were linked using arrows. We observed that the variation between the bacterial and fungal communities significantly differed between treatments involving different straw additions (p = 0.001). When different amounts of straw were added, the synergistic correlation between bacterial communities and fungal communities in paddy soil showed different changes (the arrow directions indicated by the four treatments are not consistent). Among them, the arrow of the medium-level straw addition treatment was shorter than those of other treatments, indicating that the correlation between the bacterial and fungal communities in the paddy soil under a medium level of straw addition was the strongest among the four treatments. On the contrary, the correlation between the bacterial and fungal communities in the paddy soil with 100% straw returning was the weakest among the four treatments.

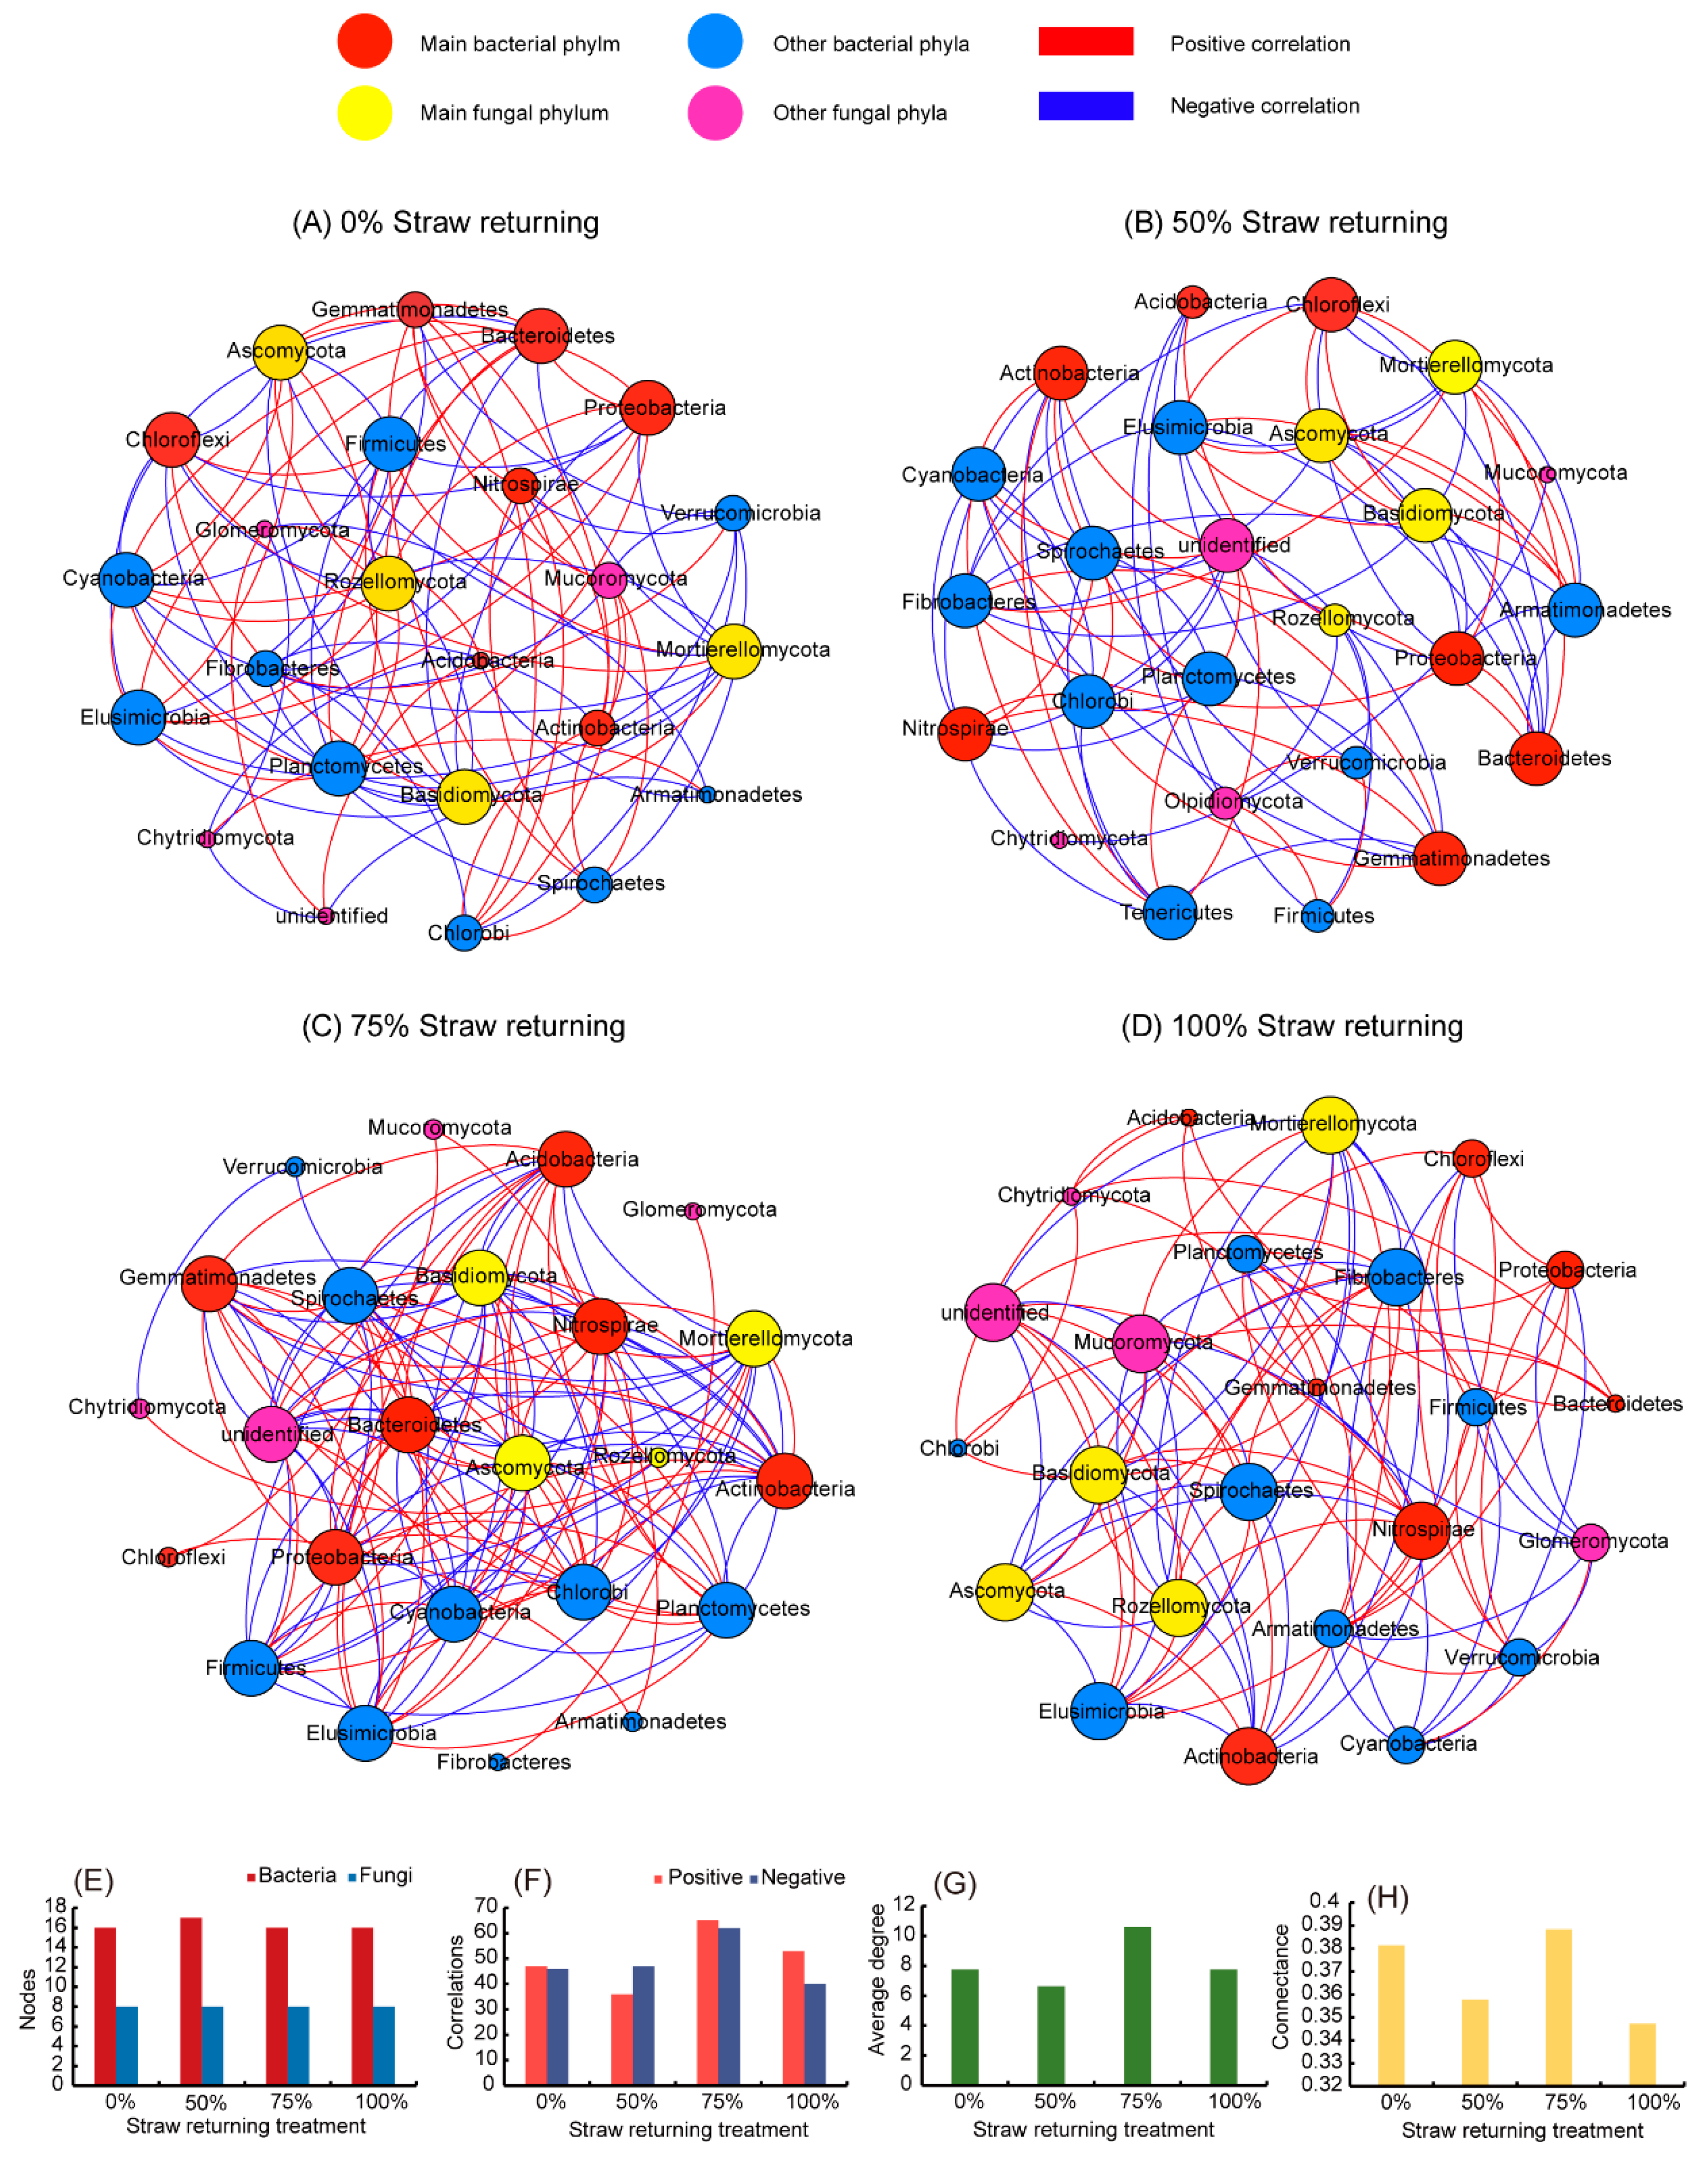
3.5. The Network Correlation between Bacteria and Fungi under Different Amounts of Straw Returning

In this study, we used network analysis (based on |R| = 0.8, p < 0.01) to explore the impact of returning different amounts of straw to paddy soil on the ecological correlation between bacteria and fungi (Figure 4). Multiple network topology indicators consistently showed that the networks of fields that had different amounts of straw added were obviously different. As shown in Figure 4, the number of edges of the co-occurrence network of the bacterial and fungal communities at the phylum level was affected by the amount of straw returned (Figure 4E,F). The network of the medium-level straw addition displayed the highest edge numbers among the four treatments, while the network treatment with only low-level straw addition displayed the most negligible edge numbers. With the exception of the low-level straw addition treatment, the bacterial and fungal communities of the other three treatment groups were more positively correlated (Figure 4E). The proportion of positive correlation out of the total correlation was specifically expressed as high-level straw addition (56.99%) > medium-level straw addition (51.18%) > no straw addition (50.53%) > low-level straw addition (43.37%). For the average degree (Figure 4G) and connectance (Figure 4H) of the network, the fungal community and bacterial community were more complex in fields treated with a medium-level straw addition than in fields of other treatments.
The size of each node is proportional to its correlations with other nodes. The bigger the size, the stronger and more significant were the correlations exhibited by the nodes [40]. We found that the effect of straw addition on the bacterial community was significantly higher than that on the fungal community. Figure 4 showed that the specific bacterial phyla had strong or weak correlations with other taxa under different amounts of straw additions. However, except for Rozellomycota, which had weak correlations with other groups in treatments with low and medium straw additions, the other major fungal phyla strongly correlated with other groups. In addition, Proteobacteria, Chloroflexi, and Bacteroidetes had a strong correlation with other taxa without straw additions (Figure 4A). Acidobacteria in low-level straw addition treatments and Chloroflexi in medium-level straw addition treatments had weak correlations with other taxa (Figure 4B,C), while Actinobacteria and Nitrospirae had strong correlations with other taxa in treatments with a high level of straw addition (Figure 4D).

4. Discussion

Rice cultivation has produced a large amount of rice straw. In order to promote the development of green agriculture, the practice of returning straw to fields has become more and more common in northeast China [9,10,11]. Previous studies have shown that returning straw to the field has significant effects on the physical and chemical properties of the soil and the microbial community [41,42,43]. However, research on the effect of the quantity of straw returned to the field on the soil microbial community is relatively scarce. In this study, we evaluated the effects of different amounts of straw additions on the microbial community in paddy soil and explored the relationship between the bacterial and fungal communities.
In this study, we kept the soil free from special factors as much as possible and ensured that the amount of straw added was the main factor affecting the soil microbial community. The results showed that the amount of straw added did not affect the diversity of the bacterial community, but did change the abundance of the fungal community (Table 1). The composition of the bacterial community is more susceptible to low levels of straw additions, while the composition of the fungal community is more susceptible to high levels of straw additions (Figure 1). Generally speaking, bacteria prefer to decompose unstable organic compounds and occupy a dominant position in the early stage of straw decomposition [44,45], while fungi prefer to decompose difficult-to-degrade organic compounds and occupy a dominant position in the later stage of straw decomposition [46]. Therefore, when the amount of returned straw is high, the amount of unstable organic matter will greatly increase, and more substrate will make the bacterial community multiply faster than the fungal community at the early stage of straw decomposition [47]. Due to the lack of oxygen in rice fields, the bacterial community consumes most of the oxygen in the early stage of straw decomposition, resulting in the inability of the fungal community to survive (most fungi are aerobic microorganisms) [48,49]. In addition, the fungal community is seemingly less competitive than the bacterial community under the cold climate in northeast China [50]. Therefore, the abundance and composition of the soil fungal community are significantly affected by the straw additions. It is worth noting that we found that there is a discrete point in the 100% straw return treatment group that is far away from the other discrete points (Figure 1B). This may be due to the uneven return of the straw to the paddy soil during the experiment, which caused this discrete point to be similar to the clustering of the 75% straw returning treatment group.
The composition of the microbial community is an important basis of microbial functions [51]. We found that the amount of straw added changed the composition of the microbial community (Figure 2). Specifically, the addition of straw has little effect on the relative abundance of fungal taxa, but significantly affects the relative abundances of some bacterial taxa (Bacteroidetes, Acidobacteria, Cyanobacteria, Nitrosoirae, Proteobacteria, and Gemmatimonadetes). In addition, adding different amounts of straw also has different enrichment effects. The relative abundance of Acidobacteria was higher in fields treated with low-level straw additions (50% straw returning) than that of fields treated with large amounts of straw additions (>50% straw returning). Studies have shown that the main function of Acidobacteria is to degrade the polymers of plant residues, and the abundance of Acidobacteria will increase in low organic carbon content soils [52]. This may suggest that adding a small amount of straw will increase the acidic environment and low organic carbon content in the paddy soil, which leads to the increase of Acidobacteria. One study reported organic carbon content in the paddy soil was increased with the amount of straw returned, while the abundances of Acidobacteria and Nitrospira decreased [53]. Nitrospira is the main microorganism in the nitrosation reaction that oxidizes nitrite to nitrate [54]. However, Nitrospira does not adapt to acidic environments caused by the straw addition, affecting the nitrogen cycle in paddy soil [54].
With the addition of a large amount of straw (>50% straw returning), the relative abundances of Proteobacteria and Bacteroidetes increased significantly (Table 2). Proteobacteria is the most important bacterial group in paddy soil and actively participates in the process of soil denitrification [55,56]. The relative abundances of Geobacter and Crenohrix in Proteobacteria increased significantly at high levels of straw addition (Table 3), which may contribute to the iron cycle process in paddy soil [57]. The relative abundances of Syntrophobacter and Desulfobacca in Proteobacteria decreased (Table 3), indicating that, with the addition of straw, the process of sulfur reduction in rice fields may be inhibited to a certain extent [58,59]. Bacteroidetes are often used to evaluate soil utilization [60], and Flavobacterium in Bacteroidetes is a decomposer of refractory fibers, such as lignin in straw [61]. The increase in Bacteroidetes and Proteobacteria has a positive effect on the soil carbon cycle [60,62]. Both Gemmatimonadetes and Pseudomonas contain a variety of taxa that inhibit pathogenic microorganisms [63,64]. The relative abundance of Gemmatimonadetes decreased significantly after adding straw, while the relative abundance of Pseudomonas increased significantly when straw was returned to the field at a high level. At the same time, several genera of putative pathogens (Didymella, Candida, Xenophyllcytalum, Articulospora, Microdochium, Nigrospora, and Talaromyces) also decreased [65,66]. The reason may be that flooded environments are not suitable for the growth of Gemmatimonadetes, making Pseudomonas the leading group that inhibits pathogens in rice fields.
Network analysis provides a way to investigate microbial communities by revealing non-random covariant patterns in community organizations [67]. Analyzing the structural characteristics of the ecological network may detect complex relationships between species and the stability of the ecological network structure [68,69]. The complexity of the network is indicated by the number and density of its nodes and edges [70]. In this study, the different returning amounts of straw resulted in completely different correlations between bacteria and fungi (Figure 3). Through network analysis (Figure 4), we found that the amount of straw added was the main factor driving the correlation among microorganisms in the paddy soil. The network correlation of microbial communities was more complicated at a medium level of straw returning, while the network correlation of bacteria and fungi communities was less complicated in other treatments of straw returning. Large straw additions (>50% straw addition) made the positive correlation between bacteria and fungus communities stronger. On the contrary, the addition of a small amount of straw (≤50% straw addition) not only reduced the complexity of the network but also reduced the positive correlation between bacterial and fungal communities (reduced the number of edges, average degree, and complexity of the network). Given that associations in co-occurrence networks may imply ecological interactions or niche sharing between microorganisms [71], adding a large amount of straw (>50% straw addition) may foster interactions or encourage more microbes to share niches, thereby comprehensively improving the ecological environment of paddy soil.

5. Conclusions

In conclusion, returning straw to the field triggered changes in the abundance and composition of the microbial community in paddy soil. With an increase in the amount of straw returned, the abundance of the fungal community decreased significantly. When the amount of straw added was low (≤50% straw added), the composition of the bacterial community was more susceptible, while when the amount of straw added was high (>50% straw added), the fungal community was more likely to be affected. The addition of a low-level straw addition increased the relative abundance of acidic microorganisms in paddy soil and reduced the relative abundance of nitrifying microorganisms, which was not conducive to the nitrogen cycle process in paddy soil. Straw returning at a medium or high level increased the abundance of the microbiomes related to carbon and iron metabolism, which may help the carbon and iron cycle in paddy soil. In addition, adding a large amount of straw (>50% straw addition) increased the complexity of the microbial network and may promote more niche-sharing, thereby comprehensively improving the ecological environment of the paddy soil. This study only describes the changes in the microbial community in the paddy soil after two years of rice straw being returned to the field, and further research is needed on the effect of the long-term addition of returning different amounts of straw on the paddy soil microbial community.

Author Contributions

C.T. and F.J. designed the experiments. E.W. and X.L. performed the experiments, collected the samples, extracted the DNA and wrote the manuscript. L.T., X.W. and L.J. analyzed the raw sequencing data. All authors have read and agreed to the published version of the manuscript.

Funding

This work is financially supported by the Special Foundation for Basic Research Program in Wild China of CAS (XDA23070500), National Natural Science Foundation of China (42007043, 51279197, 31370144, 41571255), the Special Foundation for State Major Basic Research Program of China (2016YFC0501202), Special Foundation for Basic Research Program in Soil of CAS (XDB15030103), Key Laboratory Foundation of Mollisols Agroecology (2016ZKHT-05), 135 Project of Northeast Institute of Geography and Agroecology (Y6H2043001), and Jilin Province Natural Science Foundation (20140101017JC).

Data Availability Statement

All raw and processed data are available on NCBI under the bioproject number PRJNA639877.

Acknowledgments

We would like to thank the staffs in Shanghai Personal Biotechnology Co., Ltd. for advice on the data analysis.

Conflicts of Interest

The authors declare no conflict of interest.

Appendix A

Figure A1. OTU rarefaction curve for bacterial and fungal communities with different amounts of straw added. Each group had three replicates (n = 3). The left picture shows bacterial OTUs and the right picture shows fungal OTUs.
Agriculture 11 00561 g0a1
Table A1. Network parameters in the network relationship between bacterial and fungal communities at the phylum level with different amounts of straw added. Each group had three replicates (n = 3).
Network Parameter Characteristics0% Straw Returning50% Straw Returning75% Straw Returning100% Straw Returning
Bacteria notes16171616
Fungi notes8888
Positive correlations47366553
Negative correlations46476240
Average degree7.756.6410.5837.75
Density0.3370.2770.460.337
Modularity0.5480.6090.1060.548
Connectance0.38150.35780.38850.3473

References

  1. Liu, X.B.; Zhang, X.Y.; Wang, Y.X.; Sui, Y.Y.; Zhang, S.L.; Herbert, S.J. Soil degradation: A problem threatening the sustainable development of agriculture in Northeast China. Plant Soil Environ. 2010, 56, 87–97. [Google Scholar] [CrossRef] [Green Version]
  2. Liu, J.J.; Sui, Y.Y.; Yu, Z.H.; Shi, Y.; Chu, H.Y.; Jin, J. Soil carbon content drives the biogeographical distribution of fungal communities in the black soil zone of northeast China. Soil Biol. Biochem. 2015, 83, 29–39. [Google Scholar] [CrossRef]
  3. von Luetzow, M.; Koegel-Knabner, I.; Ekschmitt, K.; Matzner, E.; Guggenberger, G. Stabilization of organic matter in temperate soils: Mechanisms and their relevance under different soil conditions—A review. Eur. J. Soil Sci. 2006, 57, 426–445. [Google Scholar] [CrossRef]
  4. Zhang, P.; Wei, T.; Jia, Z.K.; Han, Q.F.; Ren, X.L. Soil aggregate and crop yield changes with different rates of straw incorporation in semiarid areas of northwest China. Geoderma 2014, 230, 41–49. [Google Scholar] [CrossRef]
  5. Kuzyakov, Y.; Friedel, J.K.; Stahr, K. Review of mechanisms and quantification of priming effects. Soil Biol. Biochem. 2000, 32, 1485–1498. [Google Scholar] [CrossRef]
  6. Song, C.; Wang, E.L.; Han, X.Z.; Stirzaker, R. Crop production, soil carbon and nutrient balances as affected by fertilisation in a Mollisol agroecosystem. Nutr. Cycl. Agroecosys 2011, 89, 363–374. [Google Scholar] [CrossRef]
  7. Shahbaz, M.; Kumar, A.; Kuzyakov, Y.; Borjesson, G.; Blagodatskaya, E. Priming effects induced by glucose and decaying plant residues on SOM decomposition: A three-source C-13/C-14 partitioning study. Soil Biol. Biochem. 2018, 121, 138–146. [Google Scholar] [CrossRef]
  8. Li, H.; Cao, Y.; Wang, X.M.; Ge, X.; Li, B.Q.; Jin, C.Q. Evaluation on the Production of Food Crop Straw in China from 2006 to 2014. BioEnergy Res. 2017, 10, 949–957. [Google Scholar] [CrossRef]
  9. Yang, H.S.; Fang, C.; Meng, Y.; Dai, Y.J.; Liu, J. Long-term ditch-buried straw return increases functionality of soil microbial communities. Catena 2021, 202, 105316. [Google Scholar] [CrossRef]
  10. Shan, J.; Yan, X.Y. Effects of crop residue returning on nitrous oxide emissions in agricultural soils. Atmos. Environ. 2013, 71, 170–175. [Google Scholar] [CrossRef]
  11. Karami, A.; Homaee, M.; Afzalinia, S.; Ruhipour, H.; Basirat, S. Organic resource management: Impacts on soil aggregate stability and other soil physico-chemical properties. Agric. Ecosyst. Environ. 2012, 148, 22–28. [Google Scholar] [CrossRef]
  12. Blagodatskaya, E.V.; Blagodatsky, S.A.; Anderson, T.H.; Kuzyakov, Y. Priming effects in Chernozem induced by glucose and N in relation to microbial growth strategies. Appl. Soil Ecol. 2007, 37, 95–105. [Google Scholar] [CrossRef]
  13. Henriksen, T.M.; Breland, T.A. Carbon mineralization, fungal and bacterial growth, and enzyme activities as affected by contact between crop residues and soil. Biol. Fertil. Soils 2002, 35, 41–48. [Google Scholar] [CrossRef]
  14. Geisseler, D.; Horwath, W.R.; Scow, K.M. Soil moisture and plant residue addition interact in their effect on extracellular enzyme activity. Pedobiologia 2011, 54, 71–78. [Google Scholar] [CrossRef]
  15. Zhao, S.C.; Qiu, S.J.; Xu, X.P.; Ciampitti, I.A.; Zhang, S.Q.; He, P. Change in straw decomposition rate and soil microbial community composition after straw addition in different long-term fertilization soils. Appl. Soil Ecol. 2019, 138, 123–133. [Google Scholar] [CrossRef]
  16. Kamble, P.N.; Baath, E. Comparison of fungal and bacterial growth after alleviating induced N-limitation in soil. Soil Biol. Biochem. 2016, 103, 97–105. [Google Scholar] [CrossRef]
  17. Chibuike, G.; Burkitt, L.; Bretherton, M.; Singh, R.; Bishop, P. Dissolved Organic Carbon Concentration and Denitrification Capacity of a New Zealand Hill Country Soil After Forage Crop Establishment. Earth Syst. Environ. 2021, 1–14. [Google Scholar] [CrossRef]
  18. Zhao, D.S.; Zheng, D.; Wu, S.H.; Wu, Z.F. Climate changes in northeastern China during last four decades. Chinese Geogr. Sci. 2007, 17, 317–324. [Google Scholar] [CrossRef]
  19. Sun, W.M.; Xiao, E.Z.; Pu, Z.L.; Krumins, V.; Dong, Y.R.; Li, B.Q. Paddy soil microbial communities driven by environment- and microbe-microbe interactions: A case study of elevation-resolved microbial communities in a rice terrace. Sci. Total Environ. 2018, 612, 884–893. [Google Scholar] [CrossRef] [PubMed]
  20. Wu, M.; Qin, H.L.; Chen, Z.; Wu, J.S.; Wei, W.X. Effect of long-term fertilization on bacterial composition in rice paddy soil. Biol. Fertil. Soils 2011, 47, 397–405. [Google Scholar] [CrossRef]
  21. Kikuchi, H.; Watanabe, T.; Jia, Z.; Kimura, M.; Asakawa, S. Molecular analyses reveal stability of bacterial communities in bulk soil of a Japanese paddy field: Estimation by denaturing gradient gel electrophoresis of 16S rRNA genes amplified from DNA accompanied with RNA. Soil Sci. Plant Nutr. 2007, 53, 448–458. [Google Scholar] [CrossRef]
  22. Xia, Y.H.; Chen, X.B.; Zheng, X.D.; Deng, S.H.; Hu, Y.J.; Zheng, S.M. Preferential uptake of hydrophilic and hy-drophobic compounds by bacteria and fungi in upland and paddy soils. Soil Biol. Biochem. 2020, 148, 107879. [Google Scholar] [CrossRef]
  23. Wei, L.; Ge, T.; Zhu, Z.; Luo, Y.; Yang, Y.; Xiao, M. Comparing carbon and nitrogen stocks in paddy and upland soils: Accumulation, stabilization mechanisms, and environmental drivers. Geoderma 2021, 398, 115121. [Google Scholar] [CrossRef]
  24. Li, Y.H.; Shahbaz, M.; Zhu, Z.K.; Deng, Y.W.; Tong, Y.Y.; Chen, L. Oxygen availability determines key regulators in soil organic carbon mineralisation in paddy soils. Soil Biol. Biochem. 2021, 153, 108106. [Google Scholar] [CrossRef]
  25. Chen, Z.; Luo, X.Q.; Hu, R.G.; Wu, M.N.; Wu, J.S.; Wei, W.X. Impact of Long-Term Fertilization on the Composition of Denitrifier Communities Based on Nitrite Reductase Analyses in a Paddy Soil. Microb. Ecol. 2010, 60, 850–861. [Google Scholar] [CrossRef]
  26. Yang, H.S.; Feng, J.X.; Zhai, S.L.; Dai, Y.J.; Xu, M.M.; Wu, J.S. Long-term ditch-buried straw return alters soil water potential, temperature, and microbial communities in a rice-wheat rotation system. Soil Tillage Res. 2016, 163, 21–31. [Google Scholar] [CrossRef]
  27. Zhao, S.C.; Li, K.J.; Zhou, W.; Qiu, S.J.; Huang, S.W.; He, P. Changes in soil microbial community, enzyme activities and organic matter fractions under long-term straw return in north-central China. Agric. Ecosyst. Environ. 2016, 216, 82–88. [Google Scholar] [CrossRef]
  28. Klindworth, A.; Pruesse, E.; Schweer, T.; Peplies, J.; Quast, C.; Horn, M. Evaluation of general 16S ribosomal RNA gene PCR primers for classical and next-generation sequencing-based diversity studies. Nucleic Acids Res. 2013, 41, e1. [Google Scholar] [CrossRef]
  29. Adams, R.I.; Miletto, M.; Taylor, J.W.; Bruns, T.D. Dispersal in microbes: Fungi in indoor air are dominated by outdoor air and show dispersal limitation at short distances. ISME J. 2013, 7, 1262–1273. [Google Scholar] [CrossRef] [Green Version]
  30. Gardes, M.; Bruns, T.D. Its Primers with enhanced specificity for basidiomycetes-application to the identification of mycorrhizae and rusts. Mol. Ecol. 1993, 2, 113–118. [Google Scholar] [CrossRef]
  31. White, T.J.; Bruns, T.; Lee, S.; Taylor, J. Amplification and direct sequencing of fungal ribosomal RNA genes for phylogenetics. In PCR Protocols: A Guide to Methods and Applications; Innis, M.A., Gelfand, D.H., Sninsky, J.J., White, T.J., Eds.; Academic Press Inc.: New York, NY, USA, 1990; pp. 315–322. [Google Scholar]
  32. Caporaso, J.G.; Kuczynski, J.; Stombaugh, J.; Bittinger, K.; Bushman, F.D.; Costello, E.K. QIIME allows analysis of high-throughput community sequencing data. Nat. Methods 2010, 7, 335–336. [Google Scholar] [CrossRef] [PubMed] [Green Version]
  33. Edgar, R.C. Search and clustering orders of magnitude faster than BLAST. Bioinformatics 2010, 26, 2460–2461. [Google Scholar] [CrossRef] [PubMed] [Green Version]
  34. Feeley, K.J.; Davies, S.J.; Perez, R.; Hubbell, S.P.; Foster, R.B. Directional changes in the species composition of a tropical forest. Ecology 2011, 92, 871–882. [Google Scholar] [CrossRef] [Green Version]
  35. Buttigieg, P.L.; Ramette, A. A guide to statistical analysis in microbial ecology: A community-focused, living review of multivariate data analyses. FEMS Microbiol. Ecol. 2014, 90, 543–550. [Google Scholar] [CrossRef] [PubMed] [Green Version]
  36. Shi, S.H.; Tian, L.; Ma, L.N.; Tian, C.J. Community Structure of Rhizomicrobiomes in Four Medicinal Herbs and Its Im-plication on Growth Management. Microbiology 2018, 87, 425–436. [Google Scholar] [CrossRef]
  37. Oksanen, J. Multivariate Analysis of Ecological Communities in R: Vegan Tutorial. 2011. Available online: https://www.yumpu.com/en/document/view/41285419/multivariate-analysis-of-ecological-communities-in-r-vegan-tutorial (accessed on 18 June 2021).
  38. Yang, Y.Y.; Wang, W.B. Benzyldimethyldodecyl ammonium chloride shifts the proliferation of functional genes and microbial community in natural water from eutrophic lake. Environ. Pollut. 2018, 236, 355–365. [Google Scholar] [CrossRef] [PubMed] [Green Version]
  39. Revelle, W.; Revelle, M.W. Package ‘Psych’. The Comprehensive R Archive Network. 2015. Available online: http://www.test.personality-project.org/r/psych/psych-manual.pdf (accessed on 20 January 2021).
  40. Sun, W.M.; Xiao, E.Z.; Xiao, T.F.; Krumins, V.; Wang, Q.; Haggblom, M. Response of Soil Microbial Communities to Elevated Antimony and Arsenic Contamination Indicates the Relationship between the Innate Microbiota and Contaminant Fractions. Environ. Sci. Technol. 2017, 51, 9165–9175. [Google Scholar] [CrossRef] [PubMed]
  41. Wu, L.P.; Ma, H.; Zhao, Q.L.; Zhang, S.R.; Wei, W.L.; Ding, X.D. Changes in soil bacterial community and enzyme activity under five years straw returning in paddy soil. Eur. J. Soil Biol. 2020, 100, 103215. [Google Scholar] [CrossRef]
  42. Yan, S.S.; Song, J.M.; Fan, J.S.; Yan, C.; Dong, S.K.; Ma, C.M. Changes in soil organic carbon fractions and microbial community under rice straw return in Northeast China. Glob. Ecol. Conserv. 2020, 22, e00962. [Google Scholar] [CrossRef]
  43. Bu, R.Y.; Ren, T.; Lei, M.J.; Liu, B.; Li, X.K.; Cong, R.H. Tillage and straw-returning practices effect on soil dissolved organic matter, aggregate fraction and bacteria community under rice-rice-rapeseed rotation system. Agric. Ecosyst. Environ. 2020, 287, 106681. [Google Scholar] [CrossRef]
  44. Stemmer, M.; Watzinger, A.; Blochberger, K.; Haberhauer, G.; Gerzabek, M.H. Linking dynamics of soil microbial phospholipid fatty acids to carbon mineralization in a C-13 natural abundance experiment: Impact of heavy metals and acid rain. Soil Biol. Biochem. 2007, 39, 3177–3186. [Google Scholar] [CrossRef]
  45. Paterson, E.; Sim, A.; Osborne, S.M.; Murray, P.J. Long-term exclusion of plant-inputs to soil reduces the functional capacity of microbial communities to mineralise recalcitrant root-derived carbon sources. Soil Biol. Biochem. 2011, 43, 1873–1880. [Google Scholar] [CrossRef]
  46. Marschner, P.; Umar, S.; Baumann, K. The microbial community composition changes rapidly in the early stages of decomposition of wheat residue. Soil Biol. Biochem. 2011, 43, 445–451. [Google Scholar] [CrossRef]
  47. Pastorelli, R.; Vignozzi, N.; Landi, S.; Piccolo, R.; Orsini, R.; Seddaiu, G. Consequences on macroporosity and bacterial diversity of adopting a no-tillage farming system in a clayish soil of Central Italy. Soil Biol. Biochem. 2013, 66, 78–93. [Google Scholar] [CrossRef]
  48. Song, X.Y.; Spaccini, R.; Pan, G.; Piccolo, A. Stabilization by hydrophobic protection as a molecular mechanism for organic carbon sequestration in maize-amended rice paddy soils. Sci. Total Environ. 2013, 458–460, 319–330. [Google Scholar] [CrossRef] [PubMed]
  49. Qiu, H.S.; Ge, T.D.; Liu, J.Y.; Chen, X.B.; Hu, Y.J.; Wu, J.S. Effects of biotic and abiotic factors on soil organic matter mineralization: Experiments and structural modeling analysis. Eur. J. Soil Biol. 2018, 84, 27–34. [Google Scholar] [CrossRef]
  50. de Boer, W.; Folman, L.B.; Summerbell, R.C.; Boddy, L. Living in a fungal world: Impact of fungi on soil bacterial niche development. FEMS Microbiol. Rev. 2005, 29, 795–811. [Google Scholar] [CrossRef] [Green Version]
  51. Torsvik, V.; Ovreas, L.; Thingstad, T.F. Prokaryotic diversity-Magnitude, dynamics, and controlling factors. Science 2002, 296, 1064–1066. [Google Scholar] [CrossRef] [Green Version]
  52. Liu, J.J.; Sui, Y.Y.; Yu, Z.H.; Yao, Q.; Shi, Y.; Chu, H.Y. Diversity and distribution patterns of acidobacterial communities in the black soil zone of northeast China. Soil Biol. Biochem. 2016, 95, 212–222. [Google Scholar] [CrossRef]
  53. Shahbaz, M.; Kuzyakov, Y.; Sanaullah, M.; Heitkamp, F.; Zelenev, V.; Kumar, A. Microbial decomposition of soil organic matter is mediated by quality and quantity of crop residues: Mechanisms and thresholds. Biol. Fertil. Soils 2017, 53, 287–301. [Google Scholar] [CrossRef]
  54. Han, S.; Zeng, L.Y.; Luo, X.S.; Xiong, X.; Wen, S.L.; Wang, B.R. Shifts in Nitrobacter- and Nitrospira-like nitrite-oxidizing bacterial communities under long-term fertilization practices. Soil Biol. Biochem. 2018, 124, 118–125. [Google Scholar] [CrossRef]
  55. Ahn, J.H.; Song, J.; Kim, B.Y.; Kim, M.S.; Joa, J.H.; Weon, H.Y. Characterization of the Bacterial and Archaeal Communities in Rice Field Soils Subjected to Long-Term Fertilization Practices. J. Microbiol. 2012, 50, 754–765. [Google Scholar] [CrossRef]
  56. Gupta, R.S. The phylogeny of proteobacteria: Relationships to other eubacterial phyla and eukaryotes. FEMS Microbiol. Rev. 2000, 24, 367–402. [Google Scholar] [CrossRef]
  57. Yi, W.J.; You, J.H.; Zhu, C.; Wang, B.L.; Qu, D. Diversity, dynamic and abundance of Geobacteraceae species in paddy soil following slurry incubation. Eur. J. Soil Biol. 2013, 56, 11–18. [Google Scholar] [CrossRef]
  58. Wisawapipat, W.; Chooaiem, N.; Aramrak, S.; Chittamart, N.; Nookabkaew, S.; Rangkadilok, N. Sulfur amendments to soil decrease inorganic arsenic accumulation in rice grain under flooded and nonflooded conditions: Insights from temporal dynamics of porewater chemistry and solid-phase arsenic solubility. Sci. Total Environ. 2021, 779, 146352. [Google Scholar] [CrossRef] [PubMed]
  59. Yuan, C.L.; Na, S.; Li, F.B.; Hu, H.W. Impact of sulfate and iron oxide on bacterial community dynamics in paddy soil under alternate watering conditions. J. Hazard. Mater. 2021, 408, 124417. [Google Scholar] [CrossRef] [PubMed]
  60. Wolinska, A.; Kuzniar, A.; Zielenkiewicz, U.; Izak, D.; Szafranek-Nakonieczna, A.; Banach, A. Bacteroidetes as a sensitive biological indicator of agricultural soil usage revealed by a culture-independent approach. Appl. Soil Ecol. 2017, 119, 128–137. [Google Scholar] [CrossRef]
  61. Lydell, C.; Dowell, L.; Sikaroodi, M.; Gillevet, P.; Emerson, D. A population survey of members of the phylum Bacteroidetes isolated from salt marsh sediments along the East Coast of the United States. Microb. Ecol. 2004, 48, 263–273. [Google Scholar] [CrossRef]
  62. Jangid, K.; Williams, M.A.; Franzluebbers, A.J.; Sanderlin, J.S.; Reeves, J.H.; Jenkins, M.B. Relative impacts of land-use, management intensity and fertilization upon soil microbial community structure in agricultural systems. Soil Biol. Biochem. 2008, 40, 2843–2853. [Google Scholar] [CrossRef]
  63. Konishi, M.; Homma, Y.; Kubonouchi, M.; Kato, Y. Agent Used for Promoting Growth of Plant e.g., Tomato, Comprises Microorganism Contained in Bacteroidetes, Microorganism Contained in Chloroflexi, Microorganism Contained in Gemmatimonadetes, and Microorganisms contained in Verrucomicrobia. 2020. Available online: http://apps.webofknowledge.com/full_record.do?colName=DIIDW&recordID=202088488Q&log_event=no&search_mode=GeneralSearch&qid=1&log_event=yes&product=UA&SID=5F1w4BAxnjaP2n2ScBk&viewType=fullRecord&doc=1&page=1 (accessed on 10 September 2020).
  64. Raio, A.; Puopolo, G. Pseudomonas chlororaphis metabolites as biocontrol promoters of plant health and improved crop yield. World J. Microbiol. Biotechnol. 2021, 37, 99. [Google Scholar] [CrossRef]
  65. Fiori, A.C.G.; Schwan-Estrada, K.R.F.; Stangarlin, J.R.; Vida, J.B.; Scapim, C.A.; Cruz, M.E.S. Antifungal activity of leaf extracts and essential oils of some medicinal plants against Didymella bryoniae. J. Phytopathol. 2000, 148, 483–487. [Google Scholar] [CrossRef]
  66. Wei, X.; Wang, X.; Cao, P.; Gao, Z.; Chen, A.J.; Han, J. Microbial Community Changes in the Rhizosphere Soil of Healthy and Rusty Panax ginseng and Discovery of Pivotal Fungal Genera Associated with Rusty Roots. Biomed. Res. Int. 2020, 2020, 8018525. [Google Scholar] [CrossRef] [PubMed] [Green Version]
  67. Shi, S.; Nuccio, E.E.; Shi, Z.J.; He, Z.; Zhou, J.; Firestone, M.K. The interconnected rhizosphere: High network complexity dominates rhizosphere assemblages. Ecol. Lett. 2016, 19, 926–936. [Google Scholar] [CrossRef] [PubMed] [Green Version]
  68. Montoya, J.M.; Pimm, S.L.; Sole, R.V. Ecological networks and their fragility. Nature 2006, 442, 259–264. [Google Scholar] [CrossRef]
  69. Xiao, X.; Liang, Y.T.; Zhou, S.; Zhuang, S.Y.; Sun, B. Fungal community reveals less dispersal limitation and potentially more connected network than that of bacteria in bamboo forest soils. Mol. Ecol. 2018, 27, 550–563. [Google Scholar] [CrossRef]
  70. Zhang, B.G.; Zhang, J.; Liu, Y.; Shi, P.; Wei, G.H. Co-occurrence patterns of soybean rhizosphere microbiome at a continental scale. Soil Biol. Biochem. 2018, 118, 178–186. [Google Scholar] [CrossRef]
  71. Berry, D.; Widder, S. Deciphering microbial interactions and detecting keystone species with co-occurrence networks. Front. Microbiol. 2014. [Google Scholar] [CrossRef] [PubMed] [Green Version]
Figure 1. Effect of straw addition on bacterial and fungal beta diversity. Principal coordinate analysis (PCoA) of bacterial (A) (p values < 0.001, R2 = 0.641) and fungal (B) (p values < 0.001, R2 = 0.603) communities for fields given 0%, 50%, 75%, and 100% rice straw returning treatments based on the unweighted UniFradistance of bacterial and fungal communities. The first and second principal components of the PCoA of the bacterial community explained 29.92% and 27.67% of the communities, respectively. The first and second principal components of the PCoA of the fungal community explained 43.32% and 18.73% of the communities, respectively. Each treatment had three replicates (n = 3).
Agriculture 11 00561 g001
Figure 2. The relative abundance of the bacterial (A) and fungal (B) phyla at different levels of straw addition. The relative abundance was calculated as the average of the replicates for each group.
Agriculture 11 00561 g002
Figure 3. Co-inertia analysis (CIA) of bacteria and fungi when different amounts of straw were added. The direction of the arrow indicates the trend of the correlation between bacteria and fungi, while the length of the arrow indicates the strength of the correlation between bacteria and fungi. Each group had three replicates (n = 3). After Monte Carlo test, p = 0.001.
Agriculture 11 00561 g003
Figure 4. Network analysis between bacterial and fungal communities in fields treated with different amounts of straw. (A) network correlation between bacteria and fungi in no straw addition; (B) network correlation between bacteria and fungi in 50% straw addition; (C) network correlation between bacteria and fungi in 75% straw addition; (D) network correlation between bacteria and fungi in 100% straw addition; (E) Number of nodes; (F) number of edges; (G) network average degree; (H) network complexity. The red and blue nodes represent the bacterial phyla, and the red nodes are the main bacterial phyla; the yellow and pink nodes are the fungal phyla, and the yellow nodes represent the main fungal phyla. The red lines indicate a positive correlation, and the blue lines indicate a negative correlation.
Agriculture 11 00561 g004
Table 1. Effects of rice straw addition on the alpha diversity indices of the bacterial and fungal communities.
Straw AdditionChao 1ACESimpsonShannonThe Number of OTUs
Bacteria0%4097.23 ± 19.13 a4023.71 ± 153.68 a0.9981 ± 0.002 a10.48 ± 0.04 a3396.67 ± 32.25 a
50%3978.75 ± 151.81 a4121.79 ± 98.71 a0.9977 ± 0.003 a10.47 ± 0.10 a3355.00 ± 118.25 a
75%4080.96 ± 98.50 a3908.46 ± 65.73 a0.9969 ± 0.004 a10.39 ± 0.02 a3390.67 ± 31.20 a
100%3862.76 ± 69.83 a4135.83 ± 22.97 a0.9970 ± 0.009 a10.35 ± 0.08 a3288.00 ± 30.34 a
Fungi0%1041.67 ± 62.40 a1041.82 ± 62.35 a0.9667 ± 0.002 a6.45 ± 0.16 a664.33 ± 54.48 a
50%830.33 ± 52.09 ab830.33 ± 52.09 ab0.9457 ± 0.023 a5.73 ± 0.40 a480.67 ± 36.23 b
75%776.67 ± 56.04 b776.67 ± 56.04 b0.9107 ± 0.028 a5.16 ± 0.32 a470.33 ± 45.32 b
100%781.33 ± 161.40 b781.50 ± 161.51 b0.8656 ± 0.093 a5.26 ± 0.93 a484.00 ± 113.53 b
Note: One-way analysis of variance was used to test for significant differences in the diversity indices of fungi and bacteria, and the number of operational taxonomic units (OTUs) observed in paddy soil under different straw returning amounts. The significance of post hoc pairwise comparisons was determined using Tukey’s LSD test with a significance level of 0.05. Additionally, analyses were performed using the software package IBM SPSS statistics 20.0 for Windows. We repeated each treatment three times (n = 3). For each treatment, means in the same column with different lowercase letters differ significantly (p < 0.05).
Table 2. Relative abundance of bacteria and fungi at the phylum level in paddy soil with different levels of straw additions.
KingdomPhyla0% Straw Returning50% Straw Returning75% Straw Returning100% Straw Returning
BacteriaAcidobacteria0.1387 ± 0.0045 a0.1374 ± 0.0025 a0.1284 ± 0.0091 ab0.119 ± 0.01 b
Actinobacteria0.1393 ± 0.0066 a0.1582 ± 0.0102 a0.1479 ± 0.0234 a0.1367 ± 0.0201 a
Armatimonadetes0.005 ± 0.0014 a0.0045 ± 0.0008 a0.0053 ± 0.0014 a0.0035 ± 0.001 a
Bacteroidetes0.0318 ± 0.0039 c0.0448 ± 0.0043 b0.0489 ± 0.0035 ab0.055 ± 0.0021 a
Chlorobi0.0134 ± 0.002 a0.0083 ± 0.0012 b0.0166 ± 0.0021 a0.017 ± 0.0022 a
Chloroflexi0.1641 ± 0.0197 ab0.1402 ± 0.0126 b0.1798 ± 0.0191 a0.1482 ± 0.0101 ab
Cyanobacteria0.0082 ± 0.0037 ab0.0105 ± 0.0027 a0.0035 ± 0.0009 b0.0036 ± 0.0003 b
Elusimicrobia0.0016 ± 0.0002 a0.0013 ± 0.0003 a0.0012 ± 0.0004 a0.0012 ± 0.0002 a
Fibrobacteres0.0001 ± 0.0001 b0.0004 ± 0.0001 a0.0002 ± 0 b0.0003 ± 0.0001 b
Firmicutes0.0052 ± 0.0004 b0.0075 ± 0.0009 b0.024 ± 0.0112 a0.0096 ± 0.0004 b
Gemmatimonadetes0.0523 ± 0.0021 a0.0357 ± 0.0041 b0.0372 ± 0.0062 b0.0349 ± 0.0028 b
Nitrospirae0.0316 ± 0.0079 a0.0207 ± 0.0032 ab0.0261 ± 0.0062 ab0.0176 ± 0.0024 b
Planctomycetes0.0017 ± 0.0002 b0.0028 ± 0.0007 a0.0012 ± 0.0002 b0.0011 ± 0.0002 b
Proteobacteria0.3929 ± 0.0223 bc0.4137 ± 0.0063 ab0.3675 ± 0.0213 c0.4382 ± 0.0147 a
Spirochaetes0.0016 ± 0.0001 a0.0014 ± 0.0004 a0.0018 ± 0.0003 a0.0022 ± 0.0008 a
Verrucomicrobia0.0125 ± 0.0029 a0.0127 ± 0.001 a0.0104 ± 0.0037 a0.0119 ± 0.0036 a
FungiAscomycota0.5885 ± 0.1015 a0.5954 ± 0.0183 a0.7125 ± 0.1118 a0.5713 ± 0.1201 a
Basidiomycota0.2583 ± 0.0571 a0.3034 ± 0.0485 a0.25 ± 0.0951 a0.3282 ± 0.1343 a
Chytridiomycota0.0004 ± 0.0002 a0.0002 ± 0 a0.0001 ± 0.0001 a0.0003 ± 0.0002 a
Mortierellomycota0.1487 ± 0.0459 a0.0943 ± 0.0343 ab0.0309 ± 0.0142 b0.0881 ± 0.0105 ab
Mucoromycota0.0001 ± 0 b0 ± 0 b0.0002 ± 0.0001 b0.0106 ± 0.008 a
Rozellomycota0.0039 ± 0.0012 ab0.0067 ± 0.001 a0.0062 ± 0.0033 a0.0014 ± 0.0009 b
Note: The data presented in the table are the percentage of the number of OTUs of bacteria and fungi to the total number of OTUs. The significance of post hoc pairwise comparisons was determined using Tukey’s LSD test under a significance level of 0.05. Additionally, analyses were performed using the software package IBM SPSS statistics 20.0 for Windows. We repeated each treatment three times (n = 3); for each treatment, means in the same line with different lowercase letters differ significantly (p < 0.05).
Table 3. Relative abundance of bacteria and fungi at the genus level in paddy soil with different levels of straw additions.
KingdomPhylumGenus0% Straw Returning50% Straw Returning75% Straw Returning100% Straw Returning
BacteriaActinobacteriaArthrobacter0.1182 ± 0.0041 a0.1641 ± 0.0128 a0.1729 ± 0.0232 a0.15 ± 0.0435 a
Terracoccus0.0193 ± 0.0006 a0.0135 ± 0.0013 b0.0159 ± 0.0008 b0.0104 ± 0.0021 c
Nocardioides0.042 ± 0.0019 a0.0403 ± 0.004 ab0.0354 ± 0.0024 b0.0273 ± 0.0016 c
AcidobacteriaCandidatussolibacter0.0436 ± 0.0041 a0.0337 ± 0.0027 ab0.0287 ± 0.0068 b0.0254 ± 0.0036 b
Candidatuskoribacter0.0317 ± 0.0019 b0.0381 ± 0.0029 a0.0256 ± 0.0014 c0.0206 ± 0.0036 c
Geothrix0.0058 ± 0.0007 b0.0086 ± 0.0015 b0.0129 ± 0.0016 a0.0093 ± 0.0017 b
BacteroidetesFlavobacterium0.0045 ± 0.0022 b0.0245 ± 0.0078 a0.0202 ± 0.0054 a0.0262 ± 0.0049 a
Paludibacter0.0003 ± 0.0002 c0.0006 ± 0.0003 c0.0136 ± 0.0025 a0.0049 ± 0.0006 b
ChloroflexiAnaerolinea0.0393 ± 0.0147 a0.0328 ± 0.0066 a0.0404 ± 0.0144 a0.0321 ± 0.0124 a
CyanobacteriaLeptolyngbya0.0076 ± 0.0012 b0.0172 ± 0.005 a0.0045 ± 0.001 b0.006 ± 0.0025 b
FirmicutesClostridium0.0058 ± 0.001 b0.0074 ± 0.001 b0.012 ± 0.0024 a0.0084 ± 0.0015 ab
NitrospiraeNitrospira0.0248 ± 0.0047 a0.0157 ± 0.0044 b0.0127 ± 0.0025 b0.0121 ± 0.0029 b
ProteobacteriaGeobacter0.0951 ± 0.0083 b0.074 ± 0.0126 b0.1459 ± 0.0044 a0.1461 ± 0.0303 a
Crenothrix0.0044 ± 0.0006 b0.0039 ± 0.0003 b0.0089 ± 0.0008 b0.0568 ± 0.0076 a
Anaeromyxobacter0.0675 ± 0.0055 a0.0613 ± 0.0073 a0.0726 ± 0.0063 a0.0595 ± 0.006 a
Rhodoplanes0.0912 ± 0.0016 a0.0569 ± 0.0081 b0.0428 ± 0.0064 b0.0504 ± 0.0081 b
Pseudomonas0.0019 ± 0.0007 b0.0087 ± 0.0027 ab0.0122 ± 0.0033 ab0.0228 ± 0.012 a
Methylosinus0.0208 ± 0.0025 b0.0358 ± 0.005 a0.0196 ± 0.0034 b0.0279 ± 0.0031 ab
Syntrophobacter0.0568 ± 0.0014 a0.053 ± 0.0061 a0.0317 ± 0.0036 b 0.0347 ± 0.004 b
Methylibium0.0189 ± 0.0026 a0.0167 ± 0.0012 a0.0094 ± 0.0019 b0.0156 ± 0.0011 a
Desulfobacca0.0265 ± 0.0034 a0.0219 ± 0.0028 a0.024 ± 0.0037 a0.014 ± 0.0009 b
Phenylobacterium0.0164 ± 0.0032 b0.0257 ± 0.0031 a0.0078 ± 0.0014 c0.0138 ± 0.0017 b
Variovorax0.0093 ± 0.001 a0.0116 ± 0.0005 a0.0087 ± 0.0033 a0.0117 ± 0.0006 a
Thiobacillus0.0338 ± 0.0156 a0.0135 ± 0.0038 a0.0166 ± 0.0031 a0.019 ± 0.0061 a
Reyranella0.0139 ± 0.0024 a0.0096 ± 0.0007 b0.0049 ± 0.0009 c0.0085 ± 0.0009 b
Hyphomicrobium0.0115 ± 0.0006 a0.0103 ± 0.0009 a0.0076 ± 0.0007 b0.0068 ± 0.0006 b
FungiAscomycotaPseudogymnoascus0.1055 ± 0.0144 ab0.1369 ± 0.0467 ab0.2349 ± 0.1072 a0.0276 ± 0.0104 b
Didymella0.1692 ± 0.0623 a0.055 ± 0.0224 b0.0748 ± 0.0394 b0.019 ± 0.0053 b
Echria0.0392 ± 0.0074 b0.1942 ± 0.0648 a0.0353 ± 0.0227 b0.0261 ± 0.0202 b
Setophoma0.0073 ± 0.0044 b0.0068 ± 0.0049 b0.205 ± 0.163 a0.0036 ± 0.0008 b
Fusicolla0.0001 ± 0 b0 ± 0 b0.0003 ± 0.0003 b0.3394 ± 0.2546 a
Candida0.0253 ± 0.0061 a0.0098 ± 0.0018 b0.0122 ± 0.003 b0.0125 ± 0.0057 b
Xenopolyscytalum0.0129 ± 0.0063 a0.0048 ± 0.0017 b0.0013 ± 0.0002 b0.0037 ± 0.0022 b
Articulospora0.0641 ± 0.0382 a0.0002 ± 0.0001 b0.0002 ± 0.0001 b0.016 ± 0.0102 b
Pyrenochaetopsis0.0369 ± 0.0186 a0.0268 ± 0.0132 a0.0126 ± 0.0015 a0.0218 ± 0.0066 a
Cladosporium0.0232 ± 0.0064 a0.0142 ± 0.007 a0.0449 ± 0.0364 a0.0168 ± 0.0051 a
Microdochium0.0139 ± 0.004 a0.0035 ± 0.0013 b0.0041 ± 0.0022 b0.0037 ± 0.0016 b
Nigrospora0.0177 ± 0.0071 a0.0069 ± 0.002 b0.0027 ± 0.0007 b0.0079 ± 0.005 ab
Aspergillus0.0064 ± 0.0026 a0.0022 ± 0.0006 a0.0047 ± 0.0021 a0.0028 ± 0.001 a
Talaromyces0.0033 ± 0.0017 a0.0012 ± 0.0002 b0.001 ± 0.0003 b0.0007 ± 0.0003 b
BasidiomycotaPapiliotrema0.0079 ± 0.003 b0.0072 ± 0.0022 b0.0122 ± 0.0037 ab0.0225 ± 0.0088 a
Guehomyces0.1033 ± 0.0324 a0.0894 ± 0.0164 a0.08 ± 0.0305 a0.1095 ± 0.0667 a
Solicoccozyma0.0559 ± 0.0183 a0.042 ± 0.0013 a0.0661 ± 0.0246 a0.1009 ± 0.0566 a
Psilocybe0.0423 ± 0.0153 a0.1351 ± 0.0966 a0.017 ± 0.0063 a0.0258 ± 0.014 a
Mrakia0.0283 ± 0.0065 a0.0294 ± 0.0034 a0.0713 ± 0.0351 a0.0619 ± 0.0257 a
MortierellomycotaMortierella0.16 ± 0.05 a0.102 ± 0.0345 ab0.0312 ± 0.0135 b0.0681 ± 0.0135 b
Note: The data presented in the table are the percentage of the number of OTUs of bacteria and fungi to the total number of OTUs. The significance of post hoc pairwise comparisons was determined using Tukey’s LSD test under a significance level of 0.05. Additionally, analyses were performed using the software package IBM SPSS statistics 20.0 for Windows. We repeated each treatment three times (n = 3); for each treatment, means in the same line with different lowercase letters differ significantly (p < 0.05).
Publisher’s Note: MDPI stays neutral with regard to jurisdictional claims in published maps and institutional affiliations.

