Article

Enhanced Ruminal Fermentation Parameters and Altered Rumen Bacterial Community Composition by Formulated Rumen Buffer Agents Fed to Dairy Cows with a High-Concentrate Diet

1
Ruminant Nutrition and Anaerobe Laboratory, Department of Animal Science and Technology, Sunchon National University, 413 Jungangno, Jeonnam, Suncheon 57922, Korea
2
Department of Microbiology and Parasitology, Sher-e-Bangla, Agricultural University, Dhaka 1207, Bangladesh
3
Animal Disease and Diagnostic Laboratory, Department of Animal Science and Technology, Sunchon National University, 413 Jungangno, Jeonnam, Suncheon 57922, Korea
*
Author to whom correspondence should be addressed.
Agriculture 2021, 11(6), 554; https://doi.org/10.3390/agriculture11060554
Submission received: 14 May 2021 / Revised: 13 June 2021 / Accepted: 13 June 2021 / Published: 17 June 2021

Abstract

:
The effects of rumen buffer agents on ruminal fermentation parameters and bacterial community composition were determined using in vitro and in vivo experiments in three rumen-cannulated, high-concentrate fed Holstein Friesian dairy cows. Experiment 1 in vitro treatments included bentonite, calcium carbonate, calcium oxide, sodium bicarbonate, sodium sesquicarbonate, and processed coral, and unbuffered samples served as the control. Experiment 2 in vitro treatments were based on the formulation of various combinations of the buffer agents used in Experiment 1. Combinations were selected for the in vivo study based on their buffering ability. Calcium oxide, sodium bicarbonate, and sodium sesquicarbonate stabilized the ruminal pH and improved in vitro rumen fermentation. The combined buffer agents had a significant effect on pH, buffering capacity, total gas, and total volatile fatty acids. Firmicutes and Bacteroidetes were the dominant phyla in both treatments and the control. Ruminococcus and Prevotella were found to be the dominant genera. Ruminococcus bromii was predominant in the treatment group. Prevotella jejuni was more abundant in the control group compared to the treatment group, in which its abundance was very low. Ruminococcus flavefaciens and Intestinimonas butyriciproducens gradually increased in abundance as cows received treatment. Overall, a high-concentrate diet administered to cows induced adverse changes in ruminal pH; however, buffer supplementation enhanced ruminal fermentation characteristics and altered bacterial community, which could contribute to preventing ruminal acidosis.

1. Introduction

High-producing dairy cattle are often fed high-concentrate diets for attaining peak levels of energy, which are a requirement for milk production [1,2,3]. However, such a diet may prevent cattle from reaching their full potential as it negatively affects the performance, health, and milk production of the animal due to acute and subacute ruminal acidosis (SARA) [4,5,6]. Dietary supplementation with rapidly fermentable carbohydrates can lower the ruminal pH due to short-chain fatty acid accumulation in the rumen, which increases the risk of ruminal acidosis [3,6,7,8]. The depression of ruminal pH does not appear to be the main cause of SARA; however, it may be a result of SARA through its unfavorable effects on the rumen microbiota [5,6,9,10,11]. SARA is associated with metabolic and microbial alterations that are involved in metabolic health disorders of dairy cows [12,13]. This could have various negative effects on dairy cows because they rely on microbiota for nutrient utilization, and the dysbiosis of rumen digesta has been linked to different infectious and metabolic diseases [11,14,15]. One manifestation includes the reduction of the cellulolytic bacteria population, which leads to impairment of bacterial activity due to unfavorable ruminal pH and ultimately results in low fiber degradation ability [16,17,18]. Thus, the use of a dietary buffer could be beneficial for regulating the ruminal pH. Buffers are compounds that are capable of resisting adverse changes in rumen pH when cattle are fed a diet composed of high grains and fermented fine-chopped forages [19]. Compounds responsible for increasing the buffering capacity of ruminal fluid stabilize the rumen pH and directly neutralize volatile fatty acids (VFAs) that result from a high-concentrate diet [20,21].
Previous research has reported that the addition of buffer solutions, such as combined sodium bicarbonate and magnesium oxide, increases dry matter intake when cows are fed a diet consisting only of corn silage [22]. Sodium bicarbonate is widely used as a buffer because it increases ruminal pH, produces desirable rumen fermentation, and increases ruminal fluid outflow [23]. It is also a common feed additive for lactating dairy cattle because it can prevent milk fat depression, which is associated with a low-fiber and high-concentrate diet [24]. Moreover, magnesium oxide works efficiently in combination with sodium bicarbonate [23]. Researchers have stated that the levels of sodium bicarbonate and magnesium oxide in cattle diets should not exceed the mineral requirements of 113 g/cow/day and 45 g/cow/day, respectively [19,25]. In modern cattle farming, the frequent use of high-concentrate and low-forage feed has promoted the use of buffers because they are easily available and are cost-efficient [26]. However, the basic actions of buffer solutions and their buffering effects in the rumen have been given limited attention. Furthermore, the effect of combined buffering agent supplementation on ruminal fermentation and rumen microbiota has not yet been investigated. Therefore, this study aimed to develop a rumen buffer agent. We tested several combinations of known alkalizing compounds based on their buffering capacities. In addition, we evaluated the effect of buffer on in vitro and in vivo ruminal fermentation parameters and the rumen bacterial community composition of dairy cows fed a high-concentrate diet. We initially tested various buffering agents for their individual buffering capacity and effect on ruminal fermentation. Subsequently, we established formulations for several combinations of buffers, which were then pelletized and tested on in vitro rumen fermentation. Finally, we selected buffer combinations based on their ability to meet specifications for good buffering action. The selected combinations were used for in vivo trials in dairy cows fed a high-concentrate diet.

2. Materials and Methods

2.1. Animal Care

The animals used in this experiment and all the associated experimental protocols were reviewed and approved by the Sunchon National University Animal Research Ethics Committee (SCNU IACUC, approval number: SCNU IACUC-2018-01). The study was conducted at the Sunchon National University animal farm and in the Ruminant Nutrition and Anaerobe Laboratory of the Department of Animal Science and Technology at SCNU, which is located in Jeonnam, South Korea.

2.2. Experiment 1

2.2.1. Animals, Feeding, and Experimental Design

We tested individual buffer agents based on their ability to meet certain specifications for good buffering action and their effects on ruminal fermentation. Ruminal fluid from three rumen-cannulated Holstein Friesian cows (600 ± 47 kg body weight) was used for the evaluation of the in vitro release pattern of six different buffer agents. The animals were fed twice daily with concentrate feed and kleingrass (Panicum coloratum L.) hay. The ingredients and chemical composition of the experimental concentrate are presented in Table S1. Cows were housed in free-stall barns and had free access to water. The buffer agents bentonite (BEN), calcium carbonate (CC), calcium oxide (CO), sodium bicarbonate (SB), sodium sesquicarbonate (SS), and processed coral (PC) were used as treatments, and unbuffered samples served as the negative control (CON). The processed coral used in this study is a powdered coral calcium.

2.2.2. Rumen Fluid Collection and Analyses for In Vitro Rumen Fermentation and Buffering Capacity

Ruminal contents were collected from the three rumen-cannulated Holstein Friesian cows before morning feeding. Each fluid sample was strained through four layers of surgical gauze and pooled in an amber bottle with an oxygen-free headspace, which was subsequently capped after collection. The collected samples were maintained at 39 °C and immediately transported to the laboratory [27]. For each treatment, 70 mL of rumen fluid was dispensed under a stream of CO2 into a serum bottle containing 0.5 g of the treatment buffer and 2.5 g dry matter (DM) of ground corn grain, which served as the substrate [26]. The bottles were then stoppered with butyl-rubber and sealed with aluminum caps. Samples were incubated in triplicate at 39 °C for 6, 12, and 24 h while being shaken horizontally at 100 rpm, as described by Biswas et al. [28].
Rumen fermentation parameters were monitored at the end of each incubation period. The pH was determined using a pH meter (Mettler Toledo, Columbus, OH, USA). Total gas (TG) production in each serum bottle was measured using a pressure meter (Laurel Electronics, Inc., Costa Mesa, CA, USA) after the incubation period. A needle channel connected to the pressure meter was extended into the sealed fermentation bottle to measure the positive pressure that was built up by the gas inside the bottle. A gas flow regulator was then opened to allow the gas to flow inside the syringe barrel, and then the plunger was gradually pulled until the pressure reading on the machine display was zero. The volume of gas trapped inside the barrel was recorded as the TG produced [29,30]. Rumen digesta were also collected in two 1.5 mL microcentrifuge tubes and stored at −80 °C prior to ammonia-nitrogen (NH3-N) and VFA analyses. To analyze the NH3-N and VFA concentrations in the samples, the frozen rumen fermentation samples were thawed at room temperature and centrifuged for 10 min at 13,000 rpm at 4 °C using a Micro 17TR centrifuge (Hanil Science Industrial, Gimpo-si, Korea). The obtained supernatant was used for both analyses. The colorimetric method developed by Chaney and Marbach [31] was used with a Libra S22 spectrophotometer (Biochrom Ltd., CB40FJ, Cambridge, UK) at an absorbance of 630 nm to measure the NH3-N concentration. Meanwhile, high-performance liquid chromatography (Agilent Technologies 1200 series, Tokyo, Japan) with a UV detector set at 210 nm and 220 nm was used for VFA concentration analysis. Samples were isocratically eluted with 0.0085 N H2SO4 at a flow rate of 0.6 mL/min and a column temperature of 35 °C.
The buffering capacity of each treatment was determined following the protocol of Le Ruyet and Tucker [32] with some modifications. The pH of each sample of ruminal fluid was recorded after 1 min of equilibration. Buffering capacity (BC), defined as the resistance to a change in pH from pH 7 to 5, was determined by titrating a 30 mL aliquot of ruminal fluid from its initial pH to pH 5 with 1 N acetic acid and continuous stirring, and subsequently titrating an additional 30 mL aliquot from its initial pH to a pH of 7 with 1 N NaOH. If the initial pH was higher than 7, only the volume of acid required to reduce the pH from 7 to 5 was recorded. The buffering capacity was converted to milliequivalents per liter, as follows: BC = [(milliliters of 1 N acetic acid) + (milliliters of 1 N NaOH)] × 103/30 [32].

2.3. Experiment 2

2.3.1. Formulation of Buffer Agents Used for In Vitro and In Vivo Experiments

This part of the study established formulations for various combinations of the buffer agents used in Experiment 1. The buffer formulations were processed into pellets and tested again using in vitro ruminal fermentation. Prior to the in vitro and in vivo experiments, the buffer agents served as treatments were formulated based on the Korean Cattle Specification Standard 2019 Program (TMR Blending Ratio Software, Jeonju, Korea). Each alkaline buffer agent was mixed to the desired concentration, and the buffers were combined to form a treatment. The obtained buffer agent formulations were used for in vitro and in vivo rumen fermentation testing and metataxonomic analyses. The buffer agent formulations used in this study are listed in Table S2. Magnesium oxide was used to replace the buffers that showed non-promising results in Experiment 1. The treatments were tested to determine their neutralizing and buffering capacities by titration with 2 N acetic acid from their initial pH to 6.50 and 5.50, respectively. The titration results are presented in Table S3.

2.3.2. Rumen Fluid Collection, In Vitro Rumen Fermentation, Buffering Capacity, and Parameter Analyses

The procedures were the same as those used in Experiment 1, except the treatments used here were the formulated buffer agents. The treatments are presented in Table S2, with an unbuffered treatment serving as the negative control.

2.3.3. Experimental Animals, Feeding, Design, and Effect of Treatments on the In Vivo Study

To evaluate the effects of the treatments on rumen fermentation and animal bacterial composition, an in vivo experiment was conducted using three rumen-cannulated Holstein Friesian cows (600 ± 60 kg body weight; 24 mos. of age) in a 3 × 3 Latin square design. The experiment consisted of three periods of 7–14 days, during which the cows adapted to a high-concentrate diet and developed acidosis. Then, the treatments were given once daily for five days. The feeding trial was conducted with three treatments: a control feed (CON (no buffer supplemented)), which served as the negative control; RB-1 (30% calcium oxide, 10% processed coral, 30% magnesium oxide, 30% sodium bicarbonate); and RB-3 (20% calcium oxide, 10% processed coral, 40% magnesium oxide, and 30% sodium bicarbonate). The chemical compositions of the buffer agents used for the in vivo experiments are presented in Table 1. The cattle were confined individually and had free access to water. The experimental animals were fed daily with a 4:16 (forage:concentrate) ratio (kg, DM) in two equal portions at 0900 and 1600 h. The treatments were processed into pellet form and compressed in a gelatin capsule (Torpac, Oceanside, CA, USA) for easy feeding. Ruminal fluid was collected during the 5-day treatment feeding period. Consequently, 10–14 days were allotted for washing before transitioning to the next period.
Rumen fluid samples were collected through the cannula before morning feeding on the day before treatment supplementation (day 0) and on the last day of supplementation (day 5). After the last sample was taken, the cows were left to transition to the next feeding trial, and the ruminal fermentation parameters were analyzed. These parameters were evaluated using the same protocol as that used in the in vitro experiment.

2.3.4. 16S rRNA Amplicon Sequencing and Metataxonomic Analyses

Samples obtained from each treatment were sent to Macrogen, Korea for DNA extraction, 16S rRNA sequencing, and microbiome analysis. Briefly, DNA was extracted using the DNeasy Power Soil Kit (Qiagen, Hilden, Germany) according to the manufacturer’s instructions. The extracted DNA was quantified using Quant-IT PicoGreen (Invitrogen, Waltham, MA, USA). Sequencing libraries were prepared according to the Illumina 16S Metagenomic Sequencing Library protocols to amplify the V3 and V4 regions. The input gDNA was PCR amplified with 1 × reaction buffer, 1 nM of dNTP mix, 500 nM each of the universal forward and reverse PCR primers, and 2.5 U of Herculase II fusion DNA polymerase (Agilent Technologies, Santa Clara, CA, USA). The cycle conditions for the first PCR were 3 min at 95 °C for heat activation, 25 cycles of 30 s at 95 °C, 30 s at 55 °C, and 30 s at 72 °C, followed by a 5-min final extension at 72 °C. The universal primer pair with Illumina adapter overhang sequences were V3-F (5′-TCG TCG GCA GCG TCA GAT GTG TAT AAG AGA CAG CCT ACG GGN GGC WGC AG-3′) and V4-R (5′-GTC TCG TGG GCT CGG AGA TGT GTA TAA GAG ACA GGA CTA CHV GGG TAT CTA ATC C-3′). The PCR product was purified using AMPure beads (Agencourt Bioscience, Beverly, MA, USA). Following purification, 2 µL of the PCR product was amplified again for final library construction with the index targeted by the NexteraXT Indexed Primer. The cycle conditions for the second PCR were the same as those for the first PCR, except for 10 cycles. The PCR product was purified using AMPure beads. The final purified product was then quantified using qPCR according to the qPCR Quantification Protocol Guide (KAPA Library Quantification kits for Illumina Sequencing platforms) and qualified using the TapeStation D1000 ScreenTape (Agilent Technologies, Waldbronn, Germany).
Sequencing was performed using the Illumina MiSeq platform (Illumina Inc., San Diego, CA, USA). Raw data files (fastq) containing the sequenced paired-end (PE) reads were obtained using the bcls2fastq package (Illumina Inc., San Diego, CA, USA) from the base call binary data produced by real-time analysis. The PE raw reads were filtered from the adapter sequences using the Scythe (v0.994) [33] and Sickle [34] programs, and then they were assembled using Fast Length Adjustment of Short Reads (FLASH 1.2.11) [35]. Assembled reads were quality filtered and trimmed for short and extra-long reads, and duplicate reads were removed and clustered at 100% identity using CD-HIT-OUT [36]. Chimeric reads were identified, and the initial clusters were recruited to the primary clusters. Then, noise filtering was performed, and the remaining non-chimeric clusters were binned according to their operational taxonomic units (OTU) following a greedy algorithm with a cut-off species-level identity of 97% using CD-HIT-OTU [36]. Representative sequences from the clustered OTUs were taxonomically assigned using Quantitative Insights Into Microbial Ecology (QIIME Version 1) [37] from the NCBI 16S rRNA database, and the taxonomic composition was generated using QIIME-UCLUST [38]. The bacterial taxonomy and composition data were used to generate a biological information matrix (BIOM) [39] in Mothur [40]. The generated BIOM file was used to visualize the alpha and beta diversity indices, and the bacterial composition using programs utilized by Metagenomics Core Microbiome Exploration Tool (MetaCOMET) [41] and MicrobiomeAnalyst [42].

2.4. Statistical Analysis

Data analysis was performed using Statistical Analysis Systems (SAS) version 9.1 (SAS Institute Inc., Cary, NC, USA). Data were statistically evaluated using the Proc general linear model (GLM) for a completely randomized design. All treatments in the in vitro experiment were conducted in triplicate, and Duncan’s multiple range test (DMRT) was used to identify differences between specific treatments. Statistical significance was set at p < 0.05.

3. Results

3.1. Experiment 1

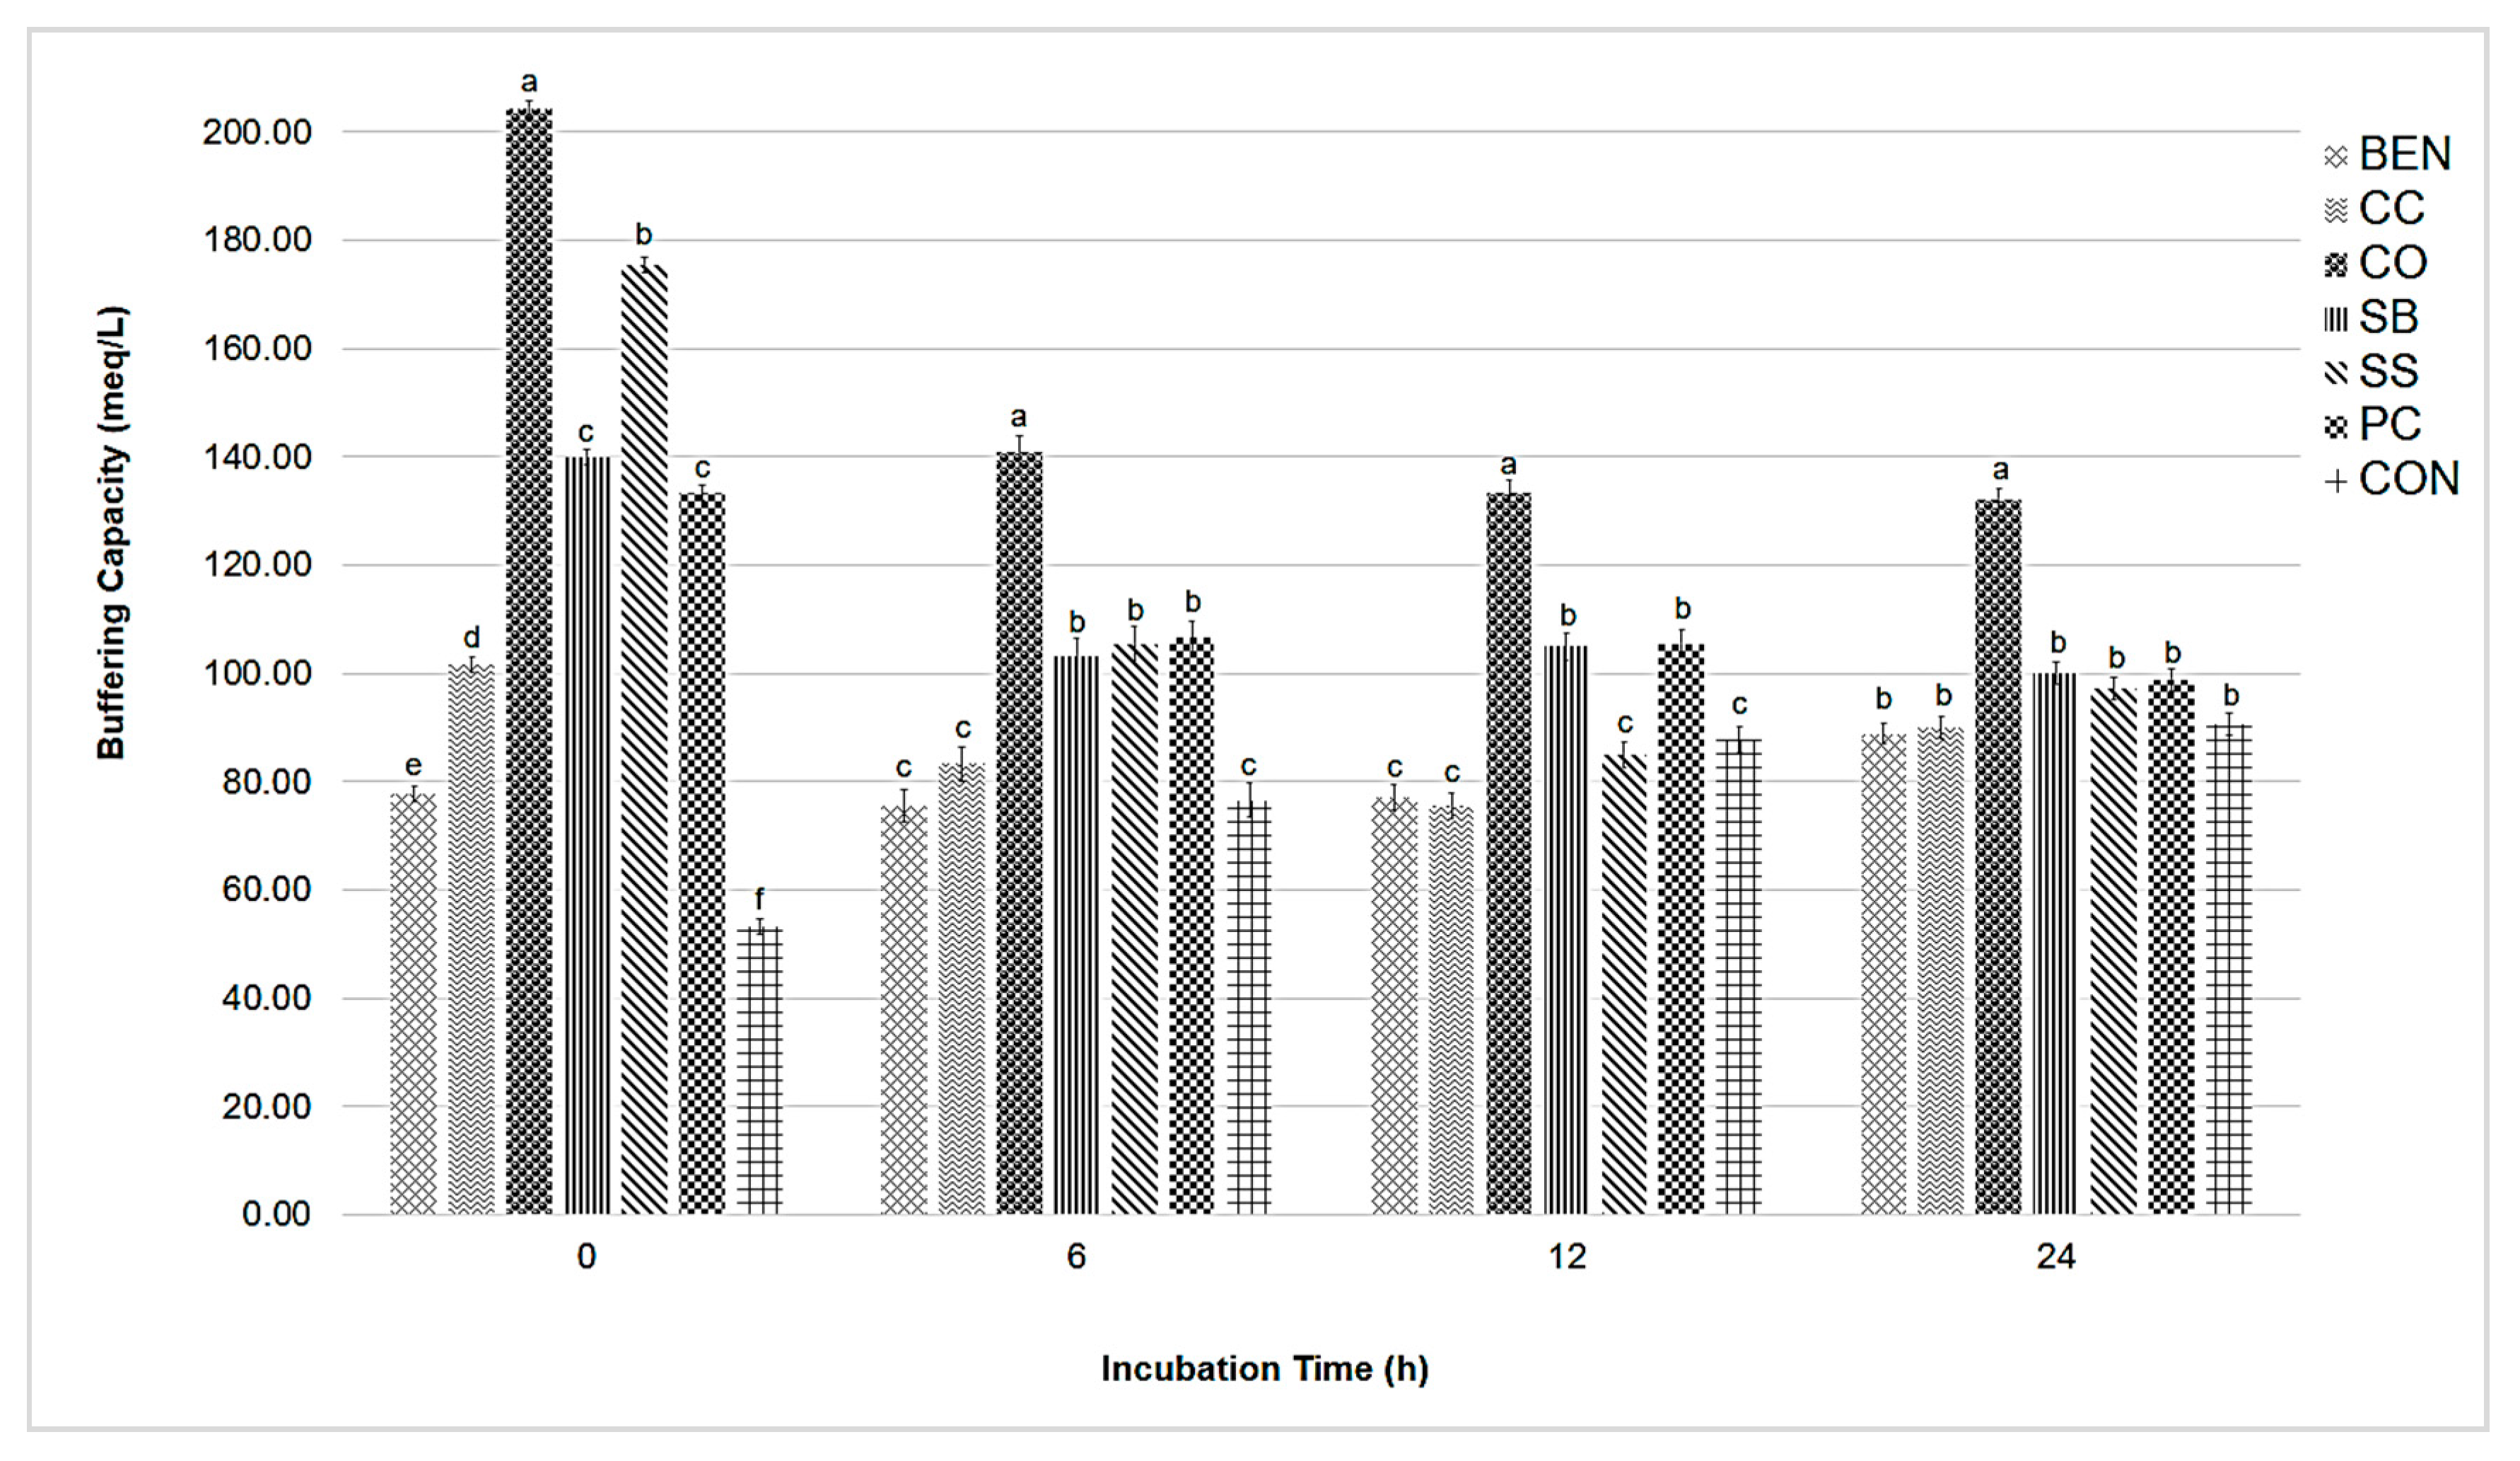
Effects of Individual Buffer Agents on In Vitro Rumen Fermentation Parameters

The effects of the treatments on the in vitro rumen fermentation parameters after 24 h of incubation are shown in Table S4. Throughout the incubation period, the ruminal pH obtained from the CO treatment was significantly higher (p < 0.001) than that of the other treatments and CON. Both SB and SS showed similar effects on pH and were consistent with CO after 6–12 h of incubation. PC, BEN, and CC exhibited less significant effects (p < 0.001) among the treatments during this period, while the control group presented the lowest (p < 0.001) pH value after 6 h of incubation. After 24 h, CO remained the most significant buffer agent for neutralizing the pH, and it was the only treatment to display a pH above 6 throughout the incubation period. Moreover, PC exhibited a similar effect during this period based on its significance level, but it was less effective during the previous observation periods. These treatments were followed by SS and SB, respectively, as the second- and third-most effective buffer agents affecting the pH, while BEN and CC were the two least efficient treatments throughout the incubation period, even compared to the control group. SB had significantly higher (p < 0.001) gas production than the other treatments after 6 h of incubation. Varying significance levels for gas production were observed for the other treatments. SS was the second-most significant (p < 0.001). BEN and CC showed similar effects on gas production as CON, followed by PC, which had less significant effects. After 12 h of incubation, SB still exhibited the highest gas production (p < 0.001), and SS exhibited a similar level of significance. This was followed by BEN and CC, which displayed similar effects on gas production. Meanwhile, CO remained the least significant during this period, following CON. After 24 h of incubation, SB consistently presented the most significant (p < 0.001) effects on gas production along with SS, followed by CC and PC. CO—which were the least effective during the previous incubation period—gained more significance than BEN and CON after 24 h. After 6 h of incubation, the ruminal NH3-N concentration was significantly higher (p < 0.001) in CON, followed by CC and CO. SS showed the least effect (p < 0.05) on NH3-N production during this period. After 12 h of incubation, CON produced the highest (p < 0.001) NH3-N, with CO and PC displaying the lowest NH3-N production. However, the CON treatment, which consistently presented significantly high levels of produced NH3-N up to 12 h of incubation, exhibited the least significant (p < 0.001) effect after 24 h of incubation alongside BEN. PC, which exhibited the least significance during the previous incubation periods, showed the highest (p < 0.001) NH3-N concentration among all treatments. In addition, varying significance levels were observed for other treatments, with SB being the second-most significant treatment (p < 0.001). SS and CO were the third-most effective, and CC was the fourth-most effective based on the significance level.
Significantly higher (p < 0.001) acetate concentrations were observed in SB compared to the other treatments after 6 h of incubation (Table S4). On the other hand, CO, CC, and BEN exhibited low acetate concentrations during this period. Ruminal fermentation after 12 h resulted in PC producing the highest acetate concentration, which was significantly different (p < 0.001) among the treatments. After 24 h of incubation, CO, which initially showed the lowest acetate concentration, suddenly exhibited a similar level of significance as SB and SS, which displayed the highest (p < 0.001) acetate concentrations. Propionate, butyrate, and total VFA concentrations were the highest (p < 0.001) in SB, SS, and PC after 6 h of incubation. Subsequently, a distinct effect of SS was observed at 12 to 24 h, in that significantly higher (p < 0.001) propionate, butyrate, and total VFA concentrations were observed than in the other treatments and CON. With regard to the acetate-to-propionate ratio, BEN had the highest (p < 0.001) value among the treatments due to the low concentrations of propionate produced during fermentation.
The buffering capacity of CO was significantly greater (p < 0.001) throughout the incubation period compared to the other treatments and CON (Figure 1). After 6 h of incubation, CO exhibited the highest (p < 0.001) buffering capacity value, followed by PC, SS, and SB, which presented similar levels of significance. Other treatments, such as CC, BEN, and CON, displayed lower buffering capacity. Furthermore, CO still exhibited the highest (p < 0.001) buffering capacity after 12 h of incubation, followed by SB. The remaining treatments had lower buffering capacity values during the 12 h incubation period. After 24 h of incubation, CO consistently exhibited the highest (p < 0.001) buffering capacity among the treatments.

3.2. Experiment 2

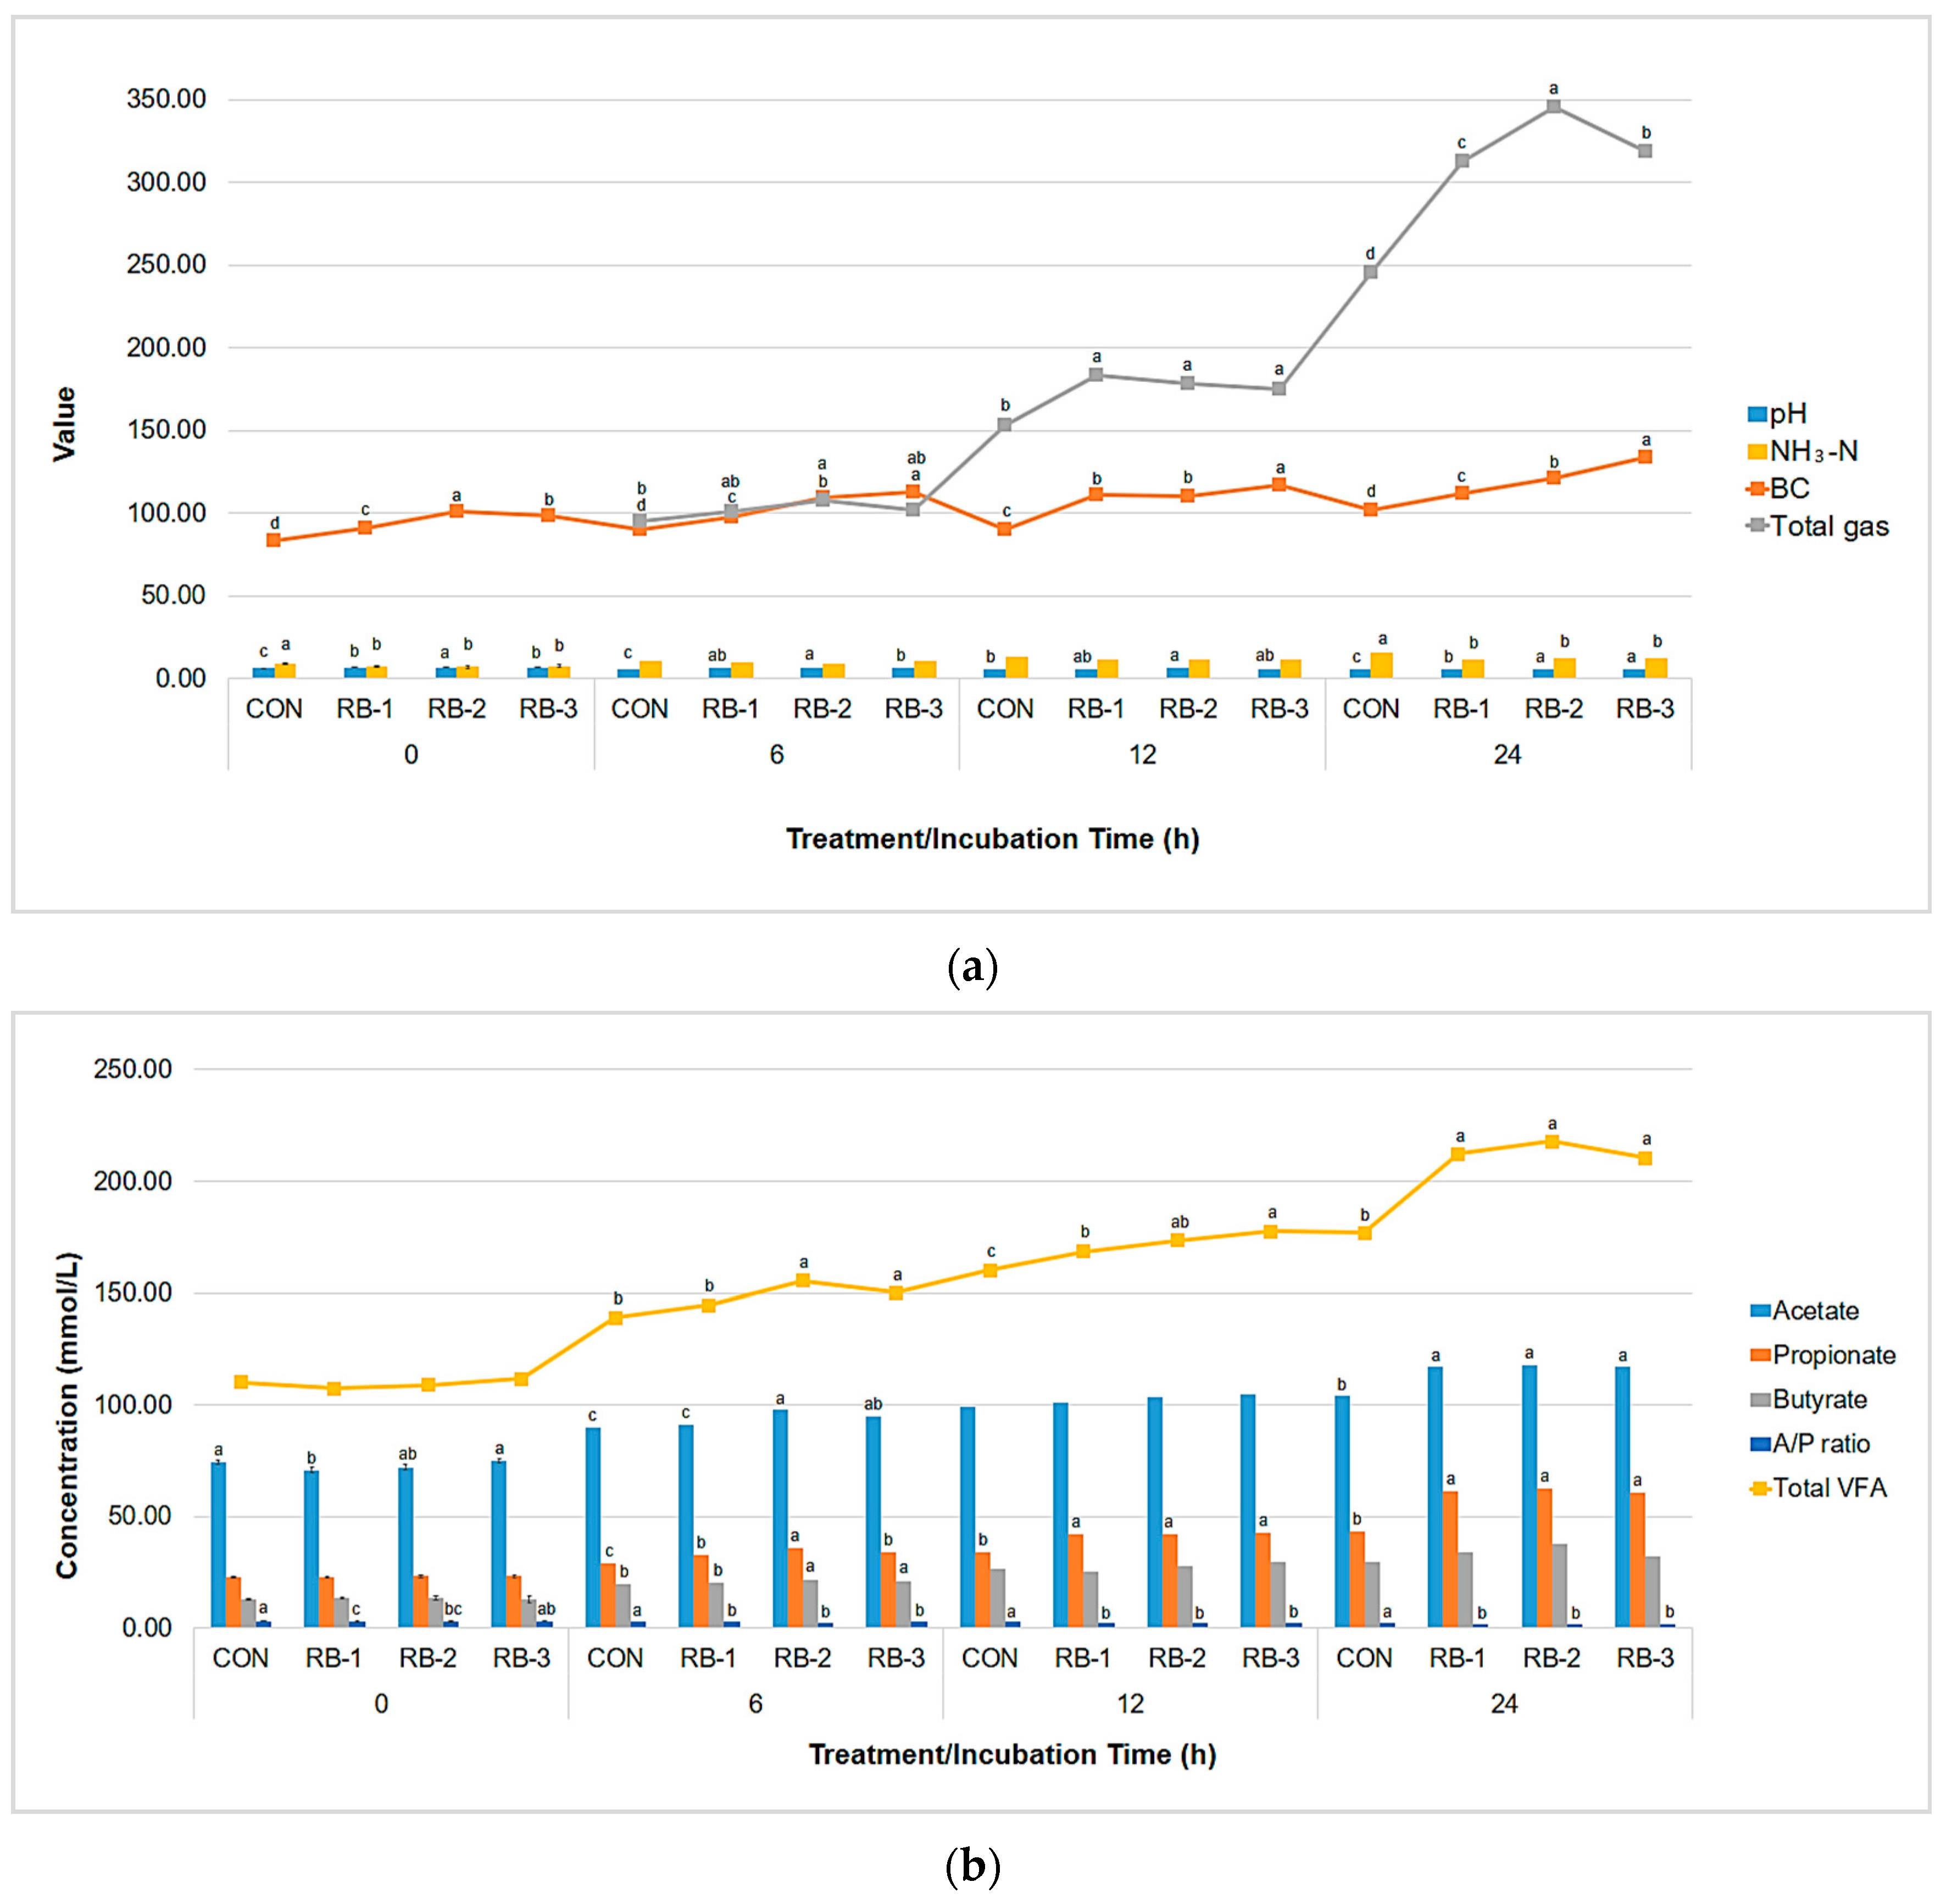
3.2.1. Effect of Combination of Buffer Agents on In Vitro Rumen Fermentation Parameters

The effects of combined buffer agents on the in vitro rumen fermentation parameters are shown in Figure 2a. The ruminal pH of RB-2 and RB-3 showed similar effects and were consistently higher (p < 0.05) than the other treatments after 24 h of incubation. At 6–24 h, RB-3 had a significantly higher (p < 0.05) buffering capacity compared to the other treatments. Regarding gas production, the RB groups were consistently higher (p < 0.05) compared to CON after the 6 and 12 h incubation periods. Meanwhile, RB-2 produced the most total gas after 24 h, followed by RB-3, RB-1, and CON. No significant differences were observed in NH3-N concentration between treatments during the 12 h incubation period. CON had the highest (p < 0.05) NH3-N concentration after 24 h incubation, and the effects of the treatments on the NH3-N concentration were equivalent.
The VFA concentrations during the in vitro rumen fermentation experiment with 24 h incubation are shown in Figure 2b. Significantly higher (p < 0.05) acetate concentrations were consistently observed in the RB treatments than in CON after the 24 h incubation period. The same pattern was observed for propionate; the RB treatments also had significantly higher (p < 0.05) concentrations than CON. A consistent increase in propionate concentration was observed for these treatments throughout the 24-h incubation period, and CON exhibited the least propionate. Subsequently, a distinct effect of treatment was observed for the butyrate concentration in the samples. A significant effect was observed only after 6 h of incubation. During this period, RB-2 and RB-3 had significantly higher (p < 0.05) concentrations than did RB-1 and CON. There was no significant effect of the treatments during the 12-h incubation period; however, butyrate concentrations in RB-1, RB-2, and RB-3 tended to increase (p = 0.061) after 24 h of incubation. Total VFA contents were greater (p < 0.05) with the RB treatments than in CON after 12 and 24 h of incubation. RB-2 and RB-3 showed high concentrations in nearly all incubation periods. Significantly higher (p < 0.05) acetate-to-propionate ratios were consistently observed in CON over the entire incubation period.

3.2.2. Effects of Combination of Buffer Agents on In Vivo Rumen Fermentation Parameters

The effects of combined buffer agentson the rumen fermentation parameters during the in vivo study are presented in Table S5. Analyses showed a significant effect of the treatments on dairy cow ruminal fluid pH after the 5-d feeding trial. On the fifth day of supplementation, RB-1 and RB-3 had significantly higher (p < 0.05) ruminal pH than did CON. Meanwhile, other parameters, including NH3-N, the acetate-to-propionate ratio, and total and individual VFA, were not significantly affected by the treatments during the feeding trial. However, the treatments still yielded higher numerical values of the ruminal fermentation parameters compared with CON after the 5-d feeding trial.

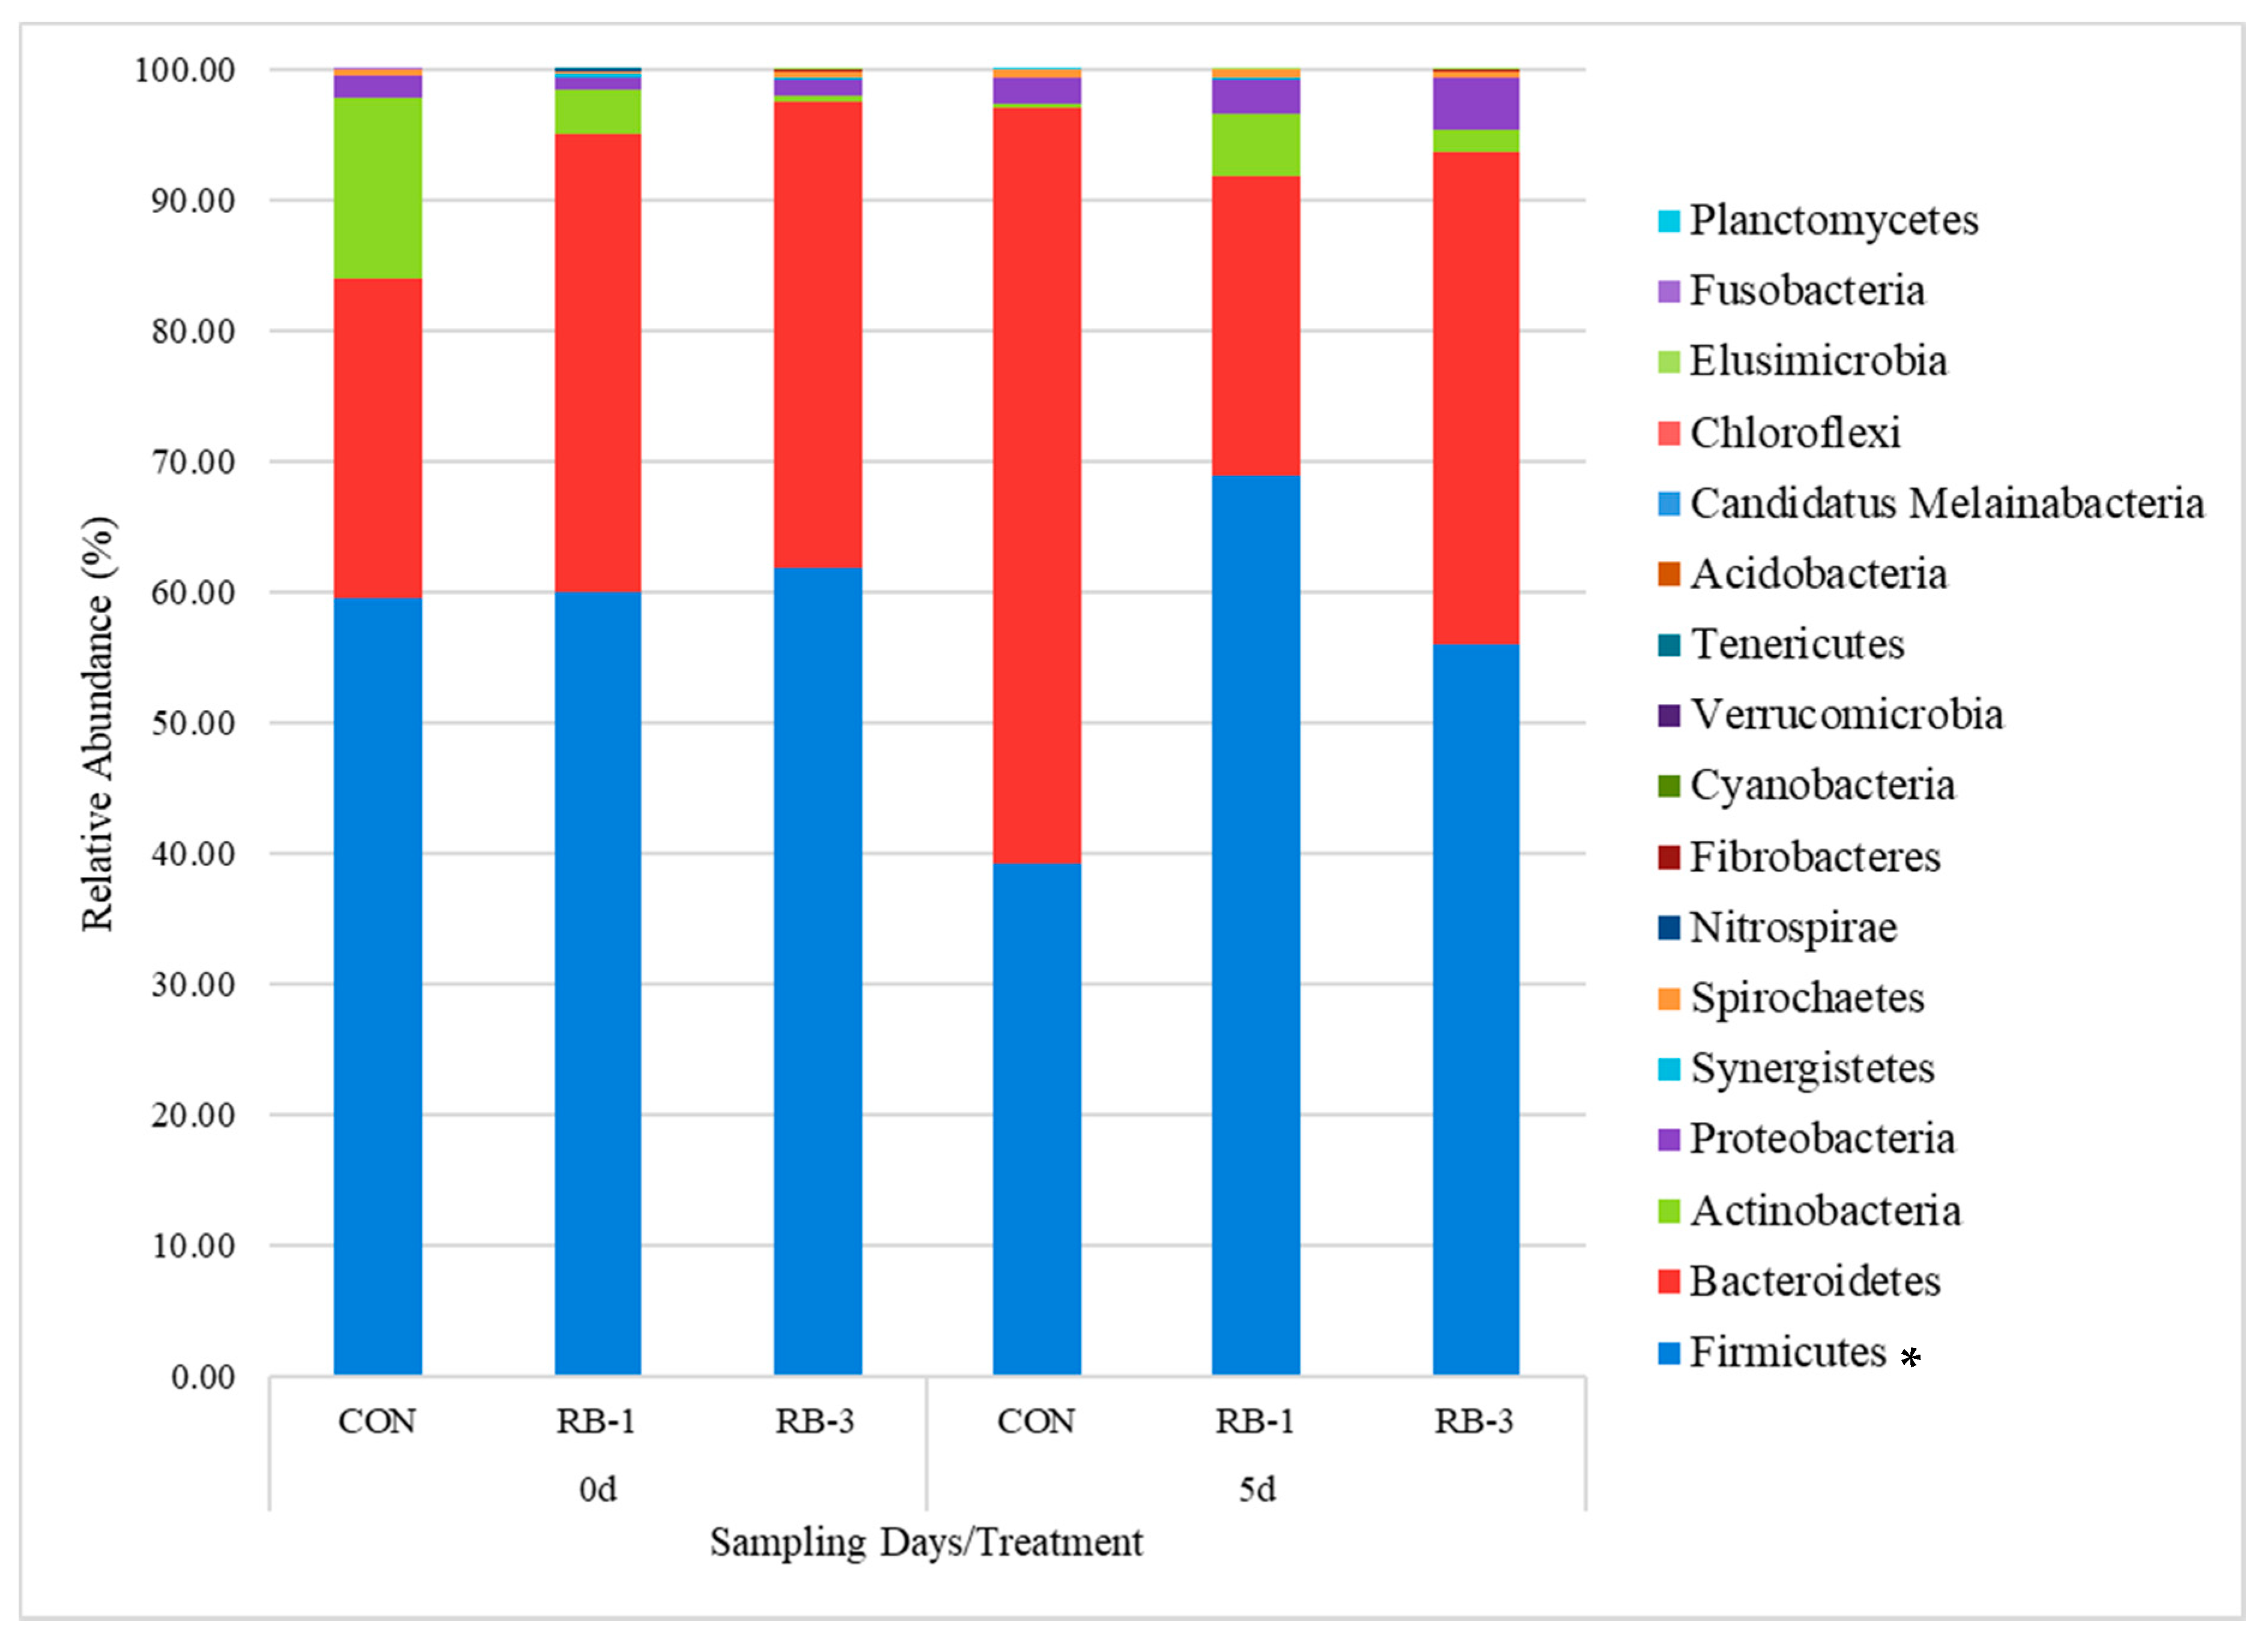
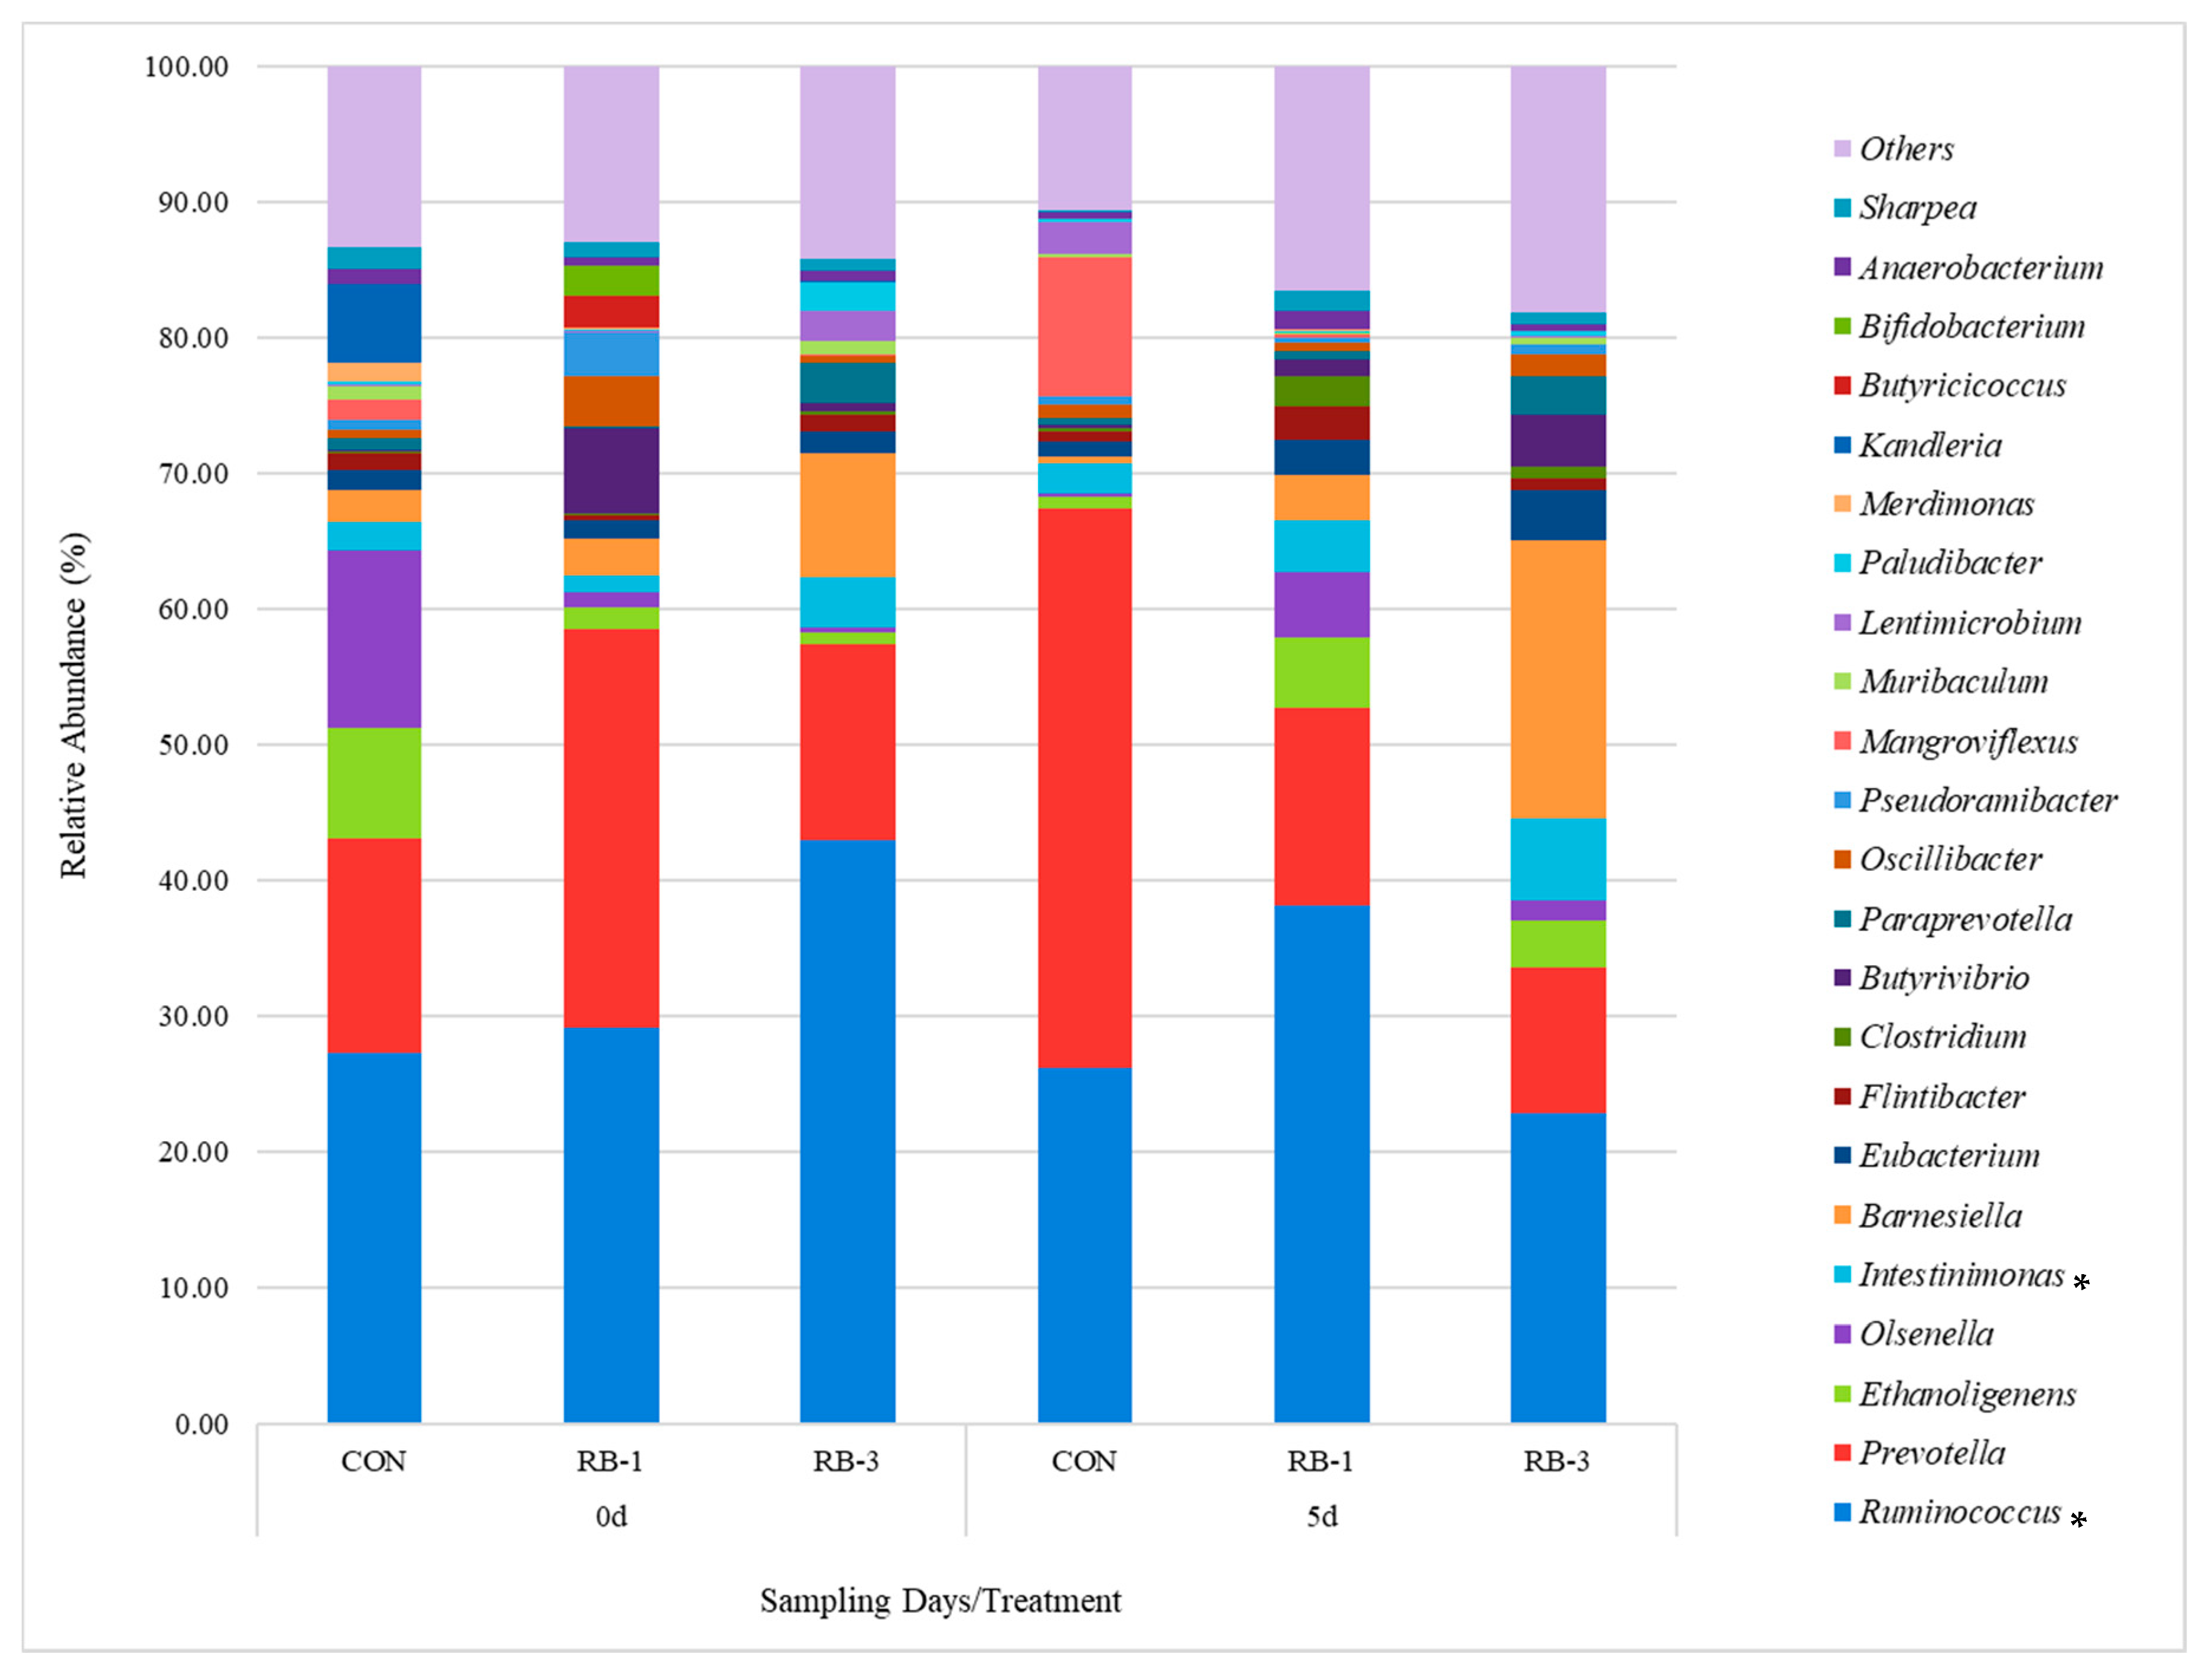
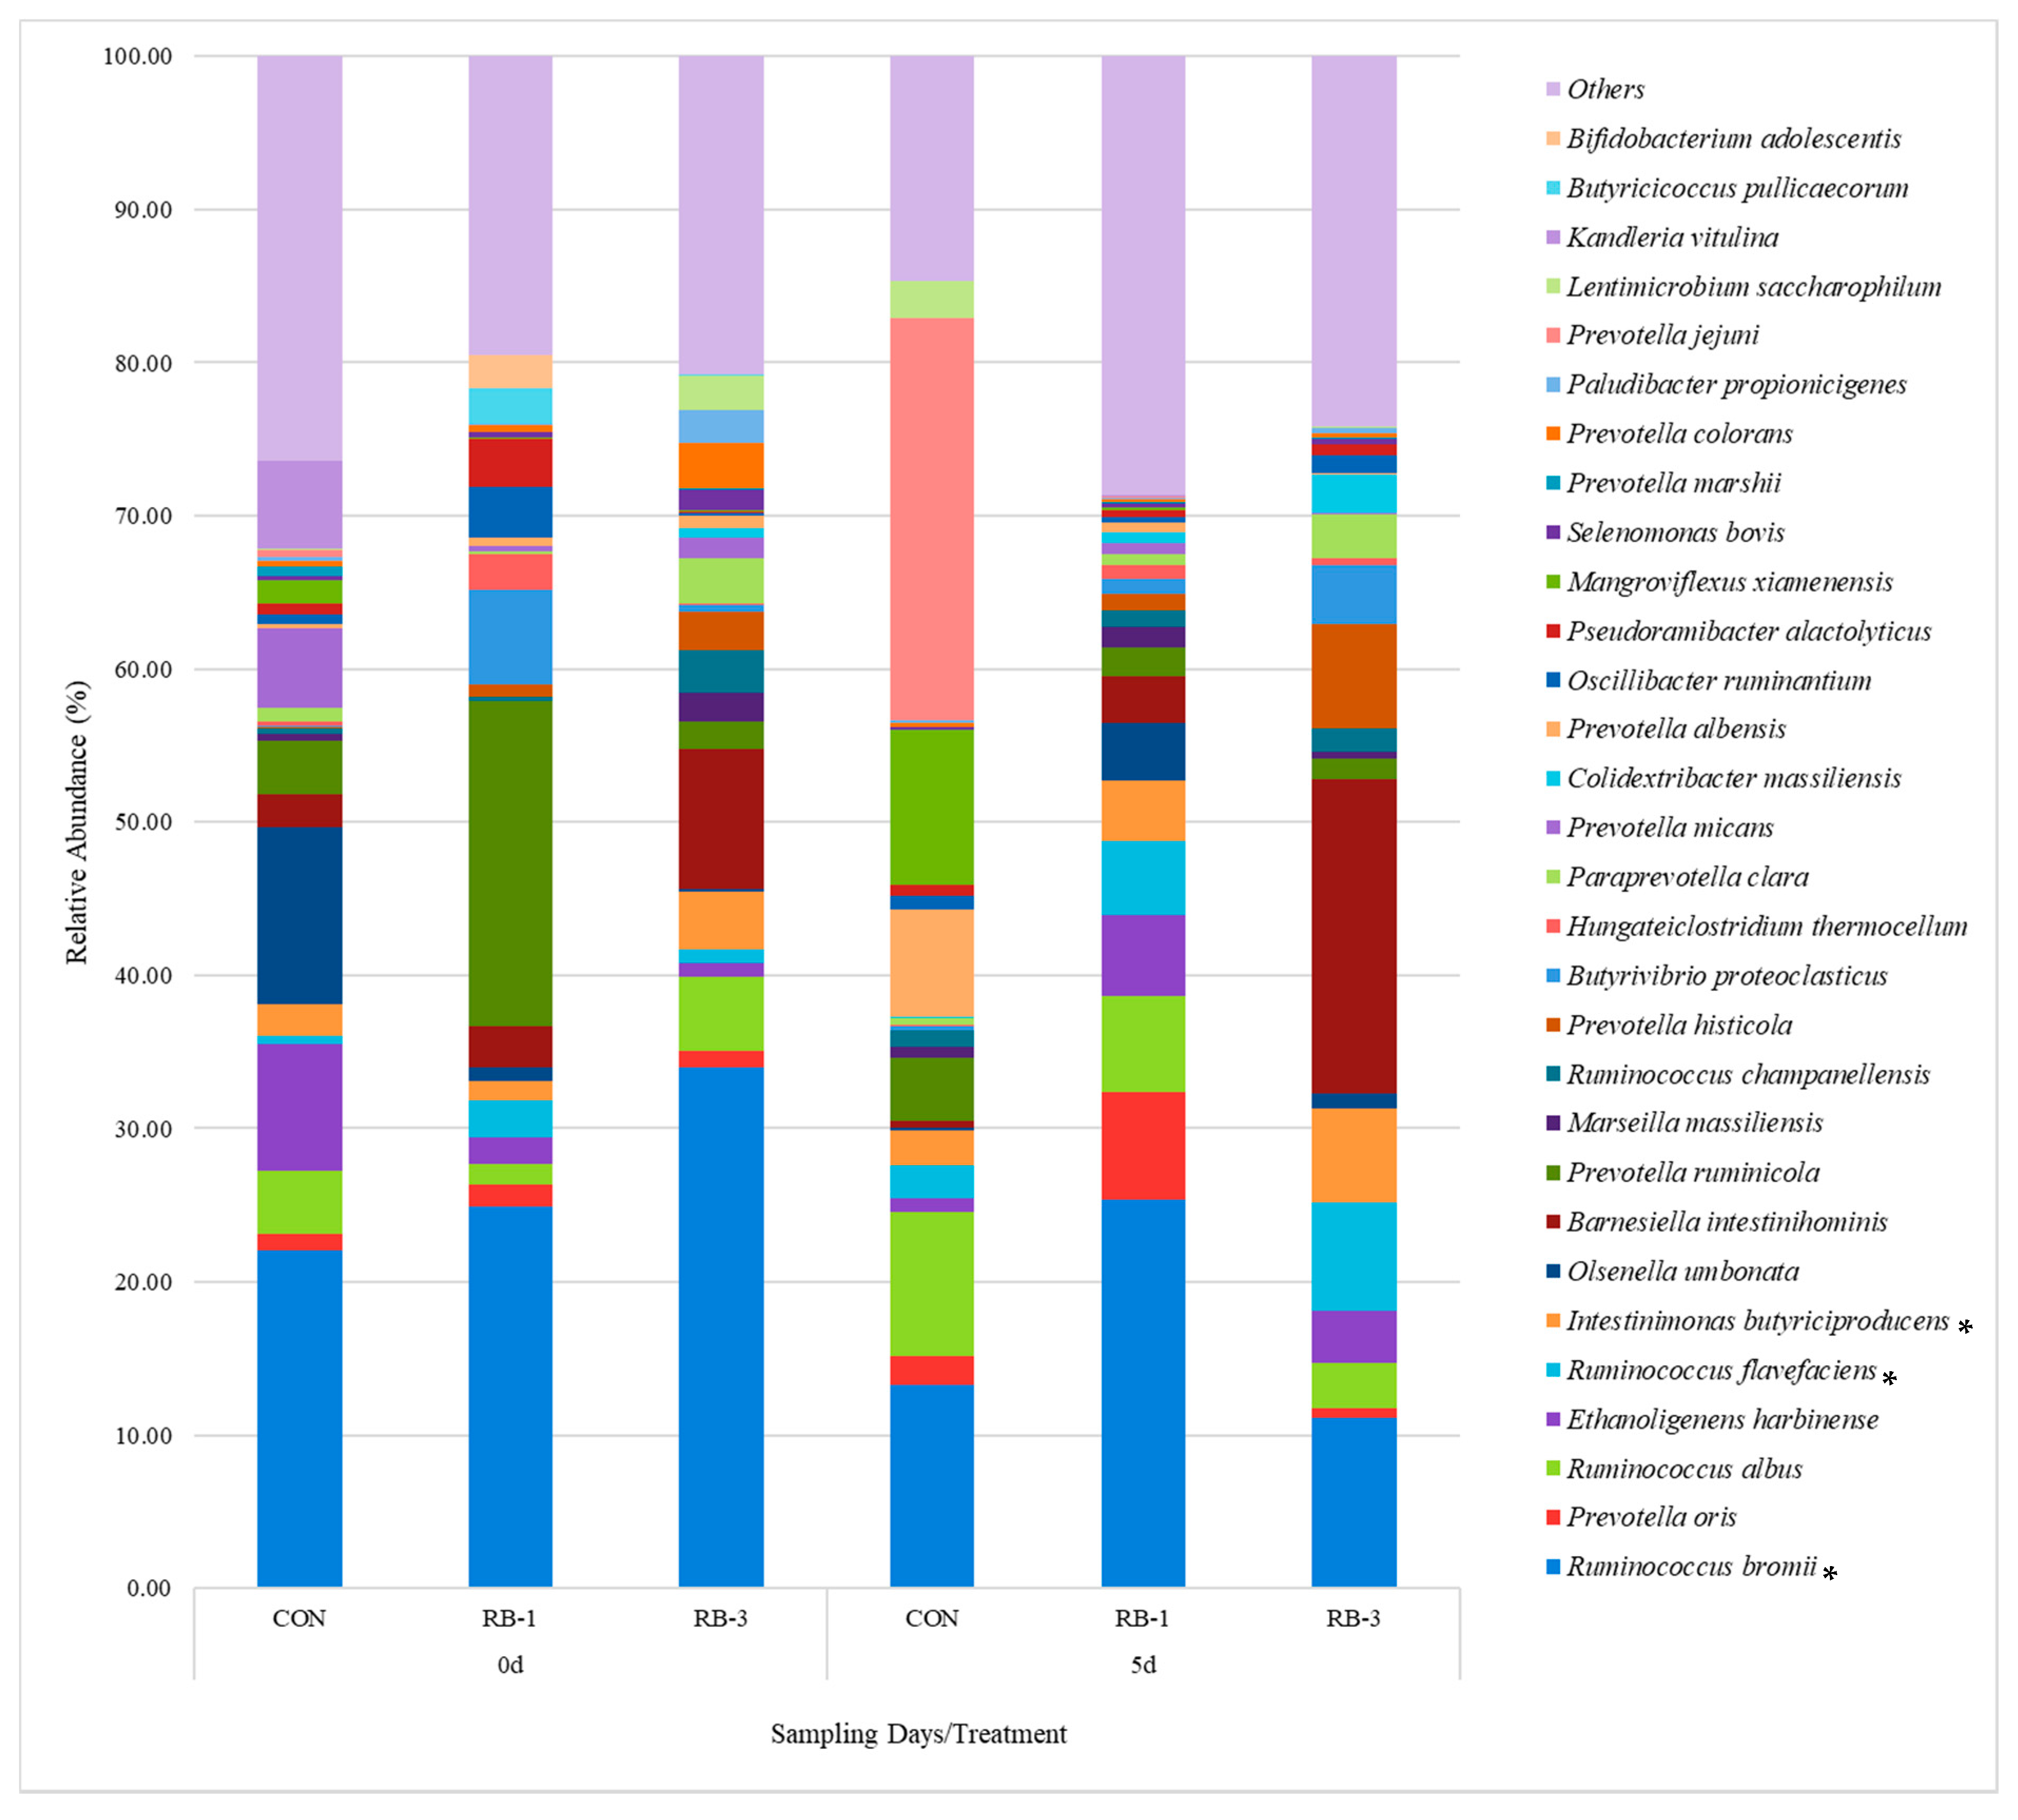
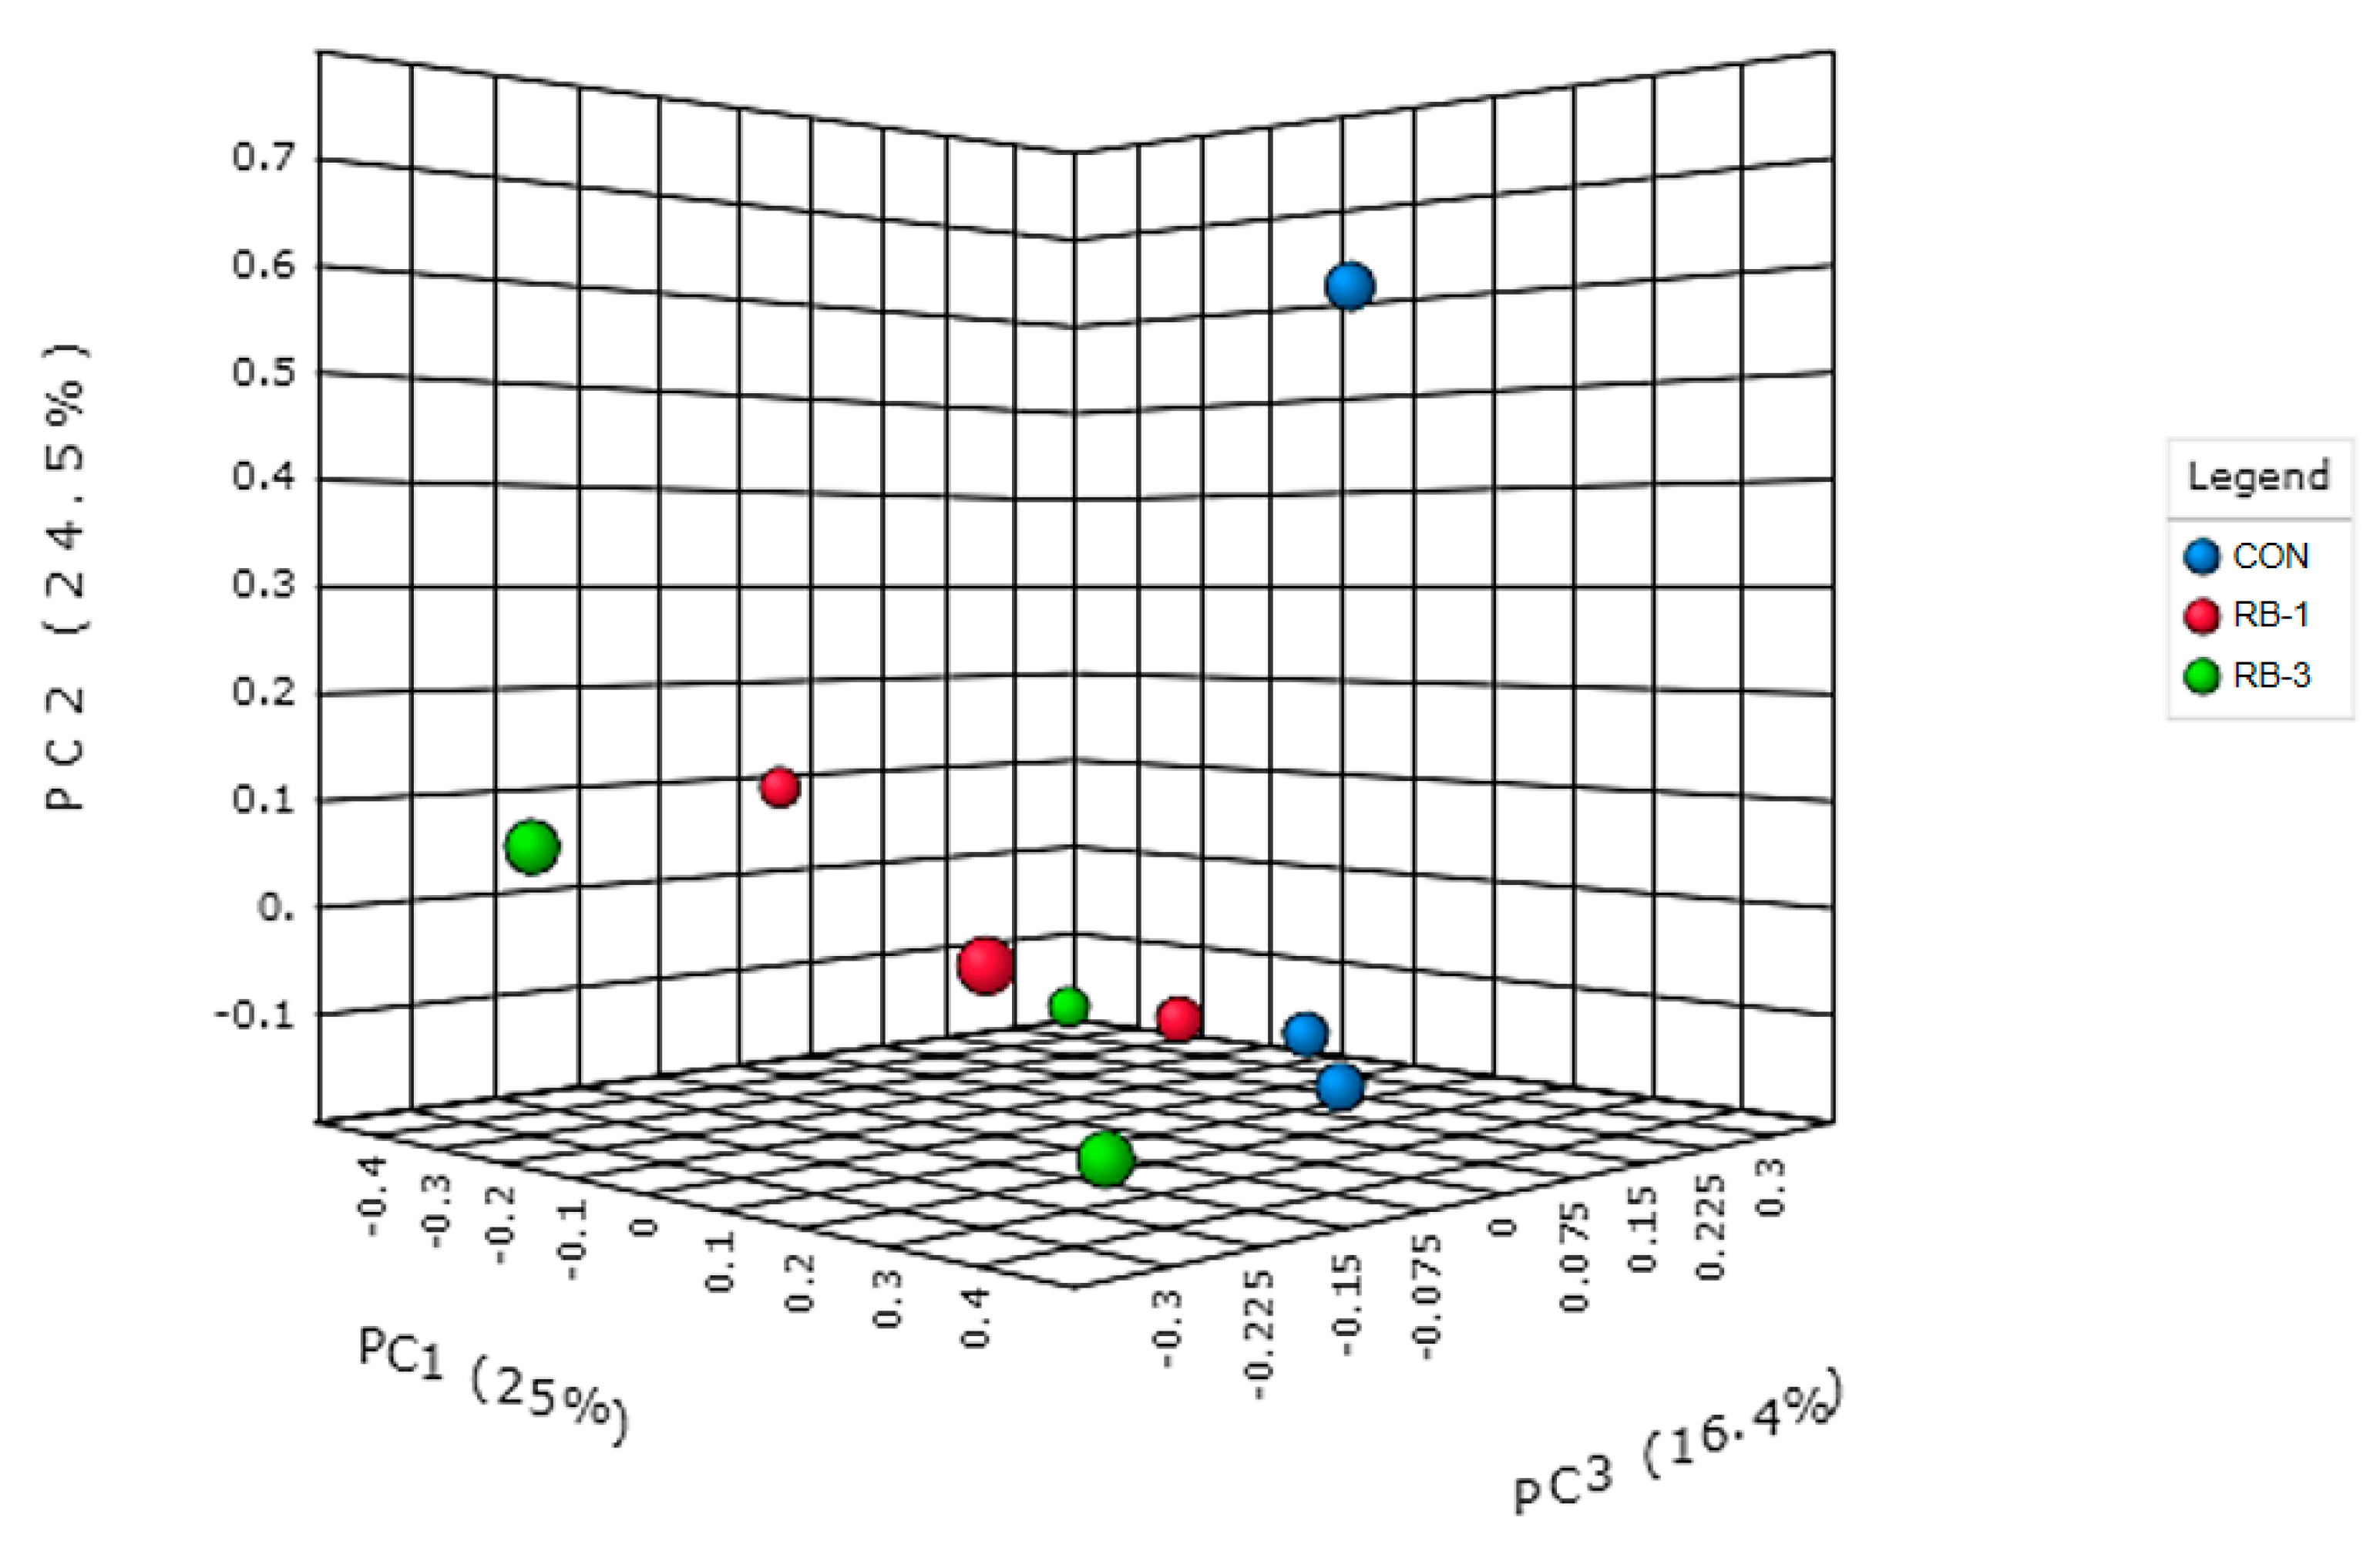
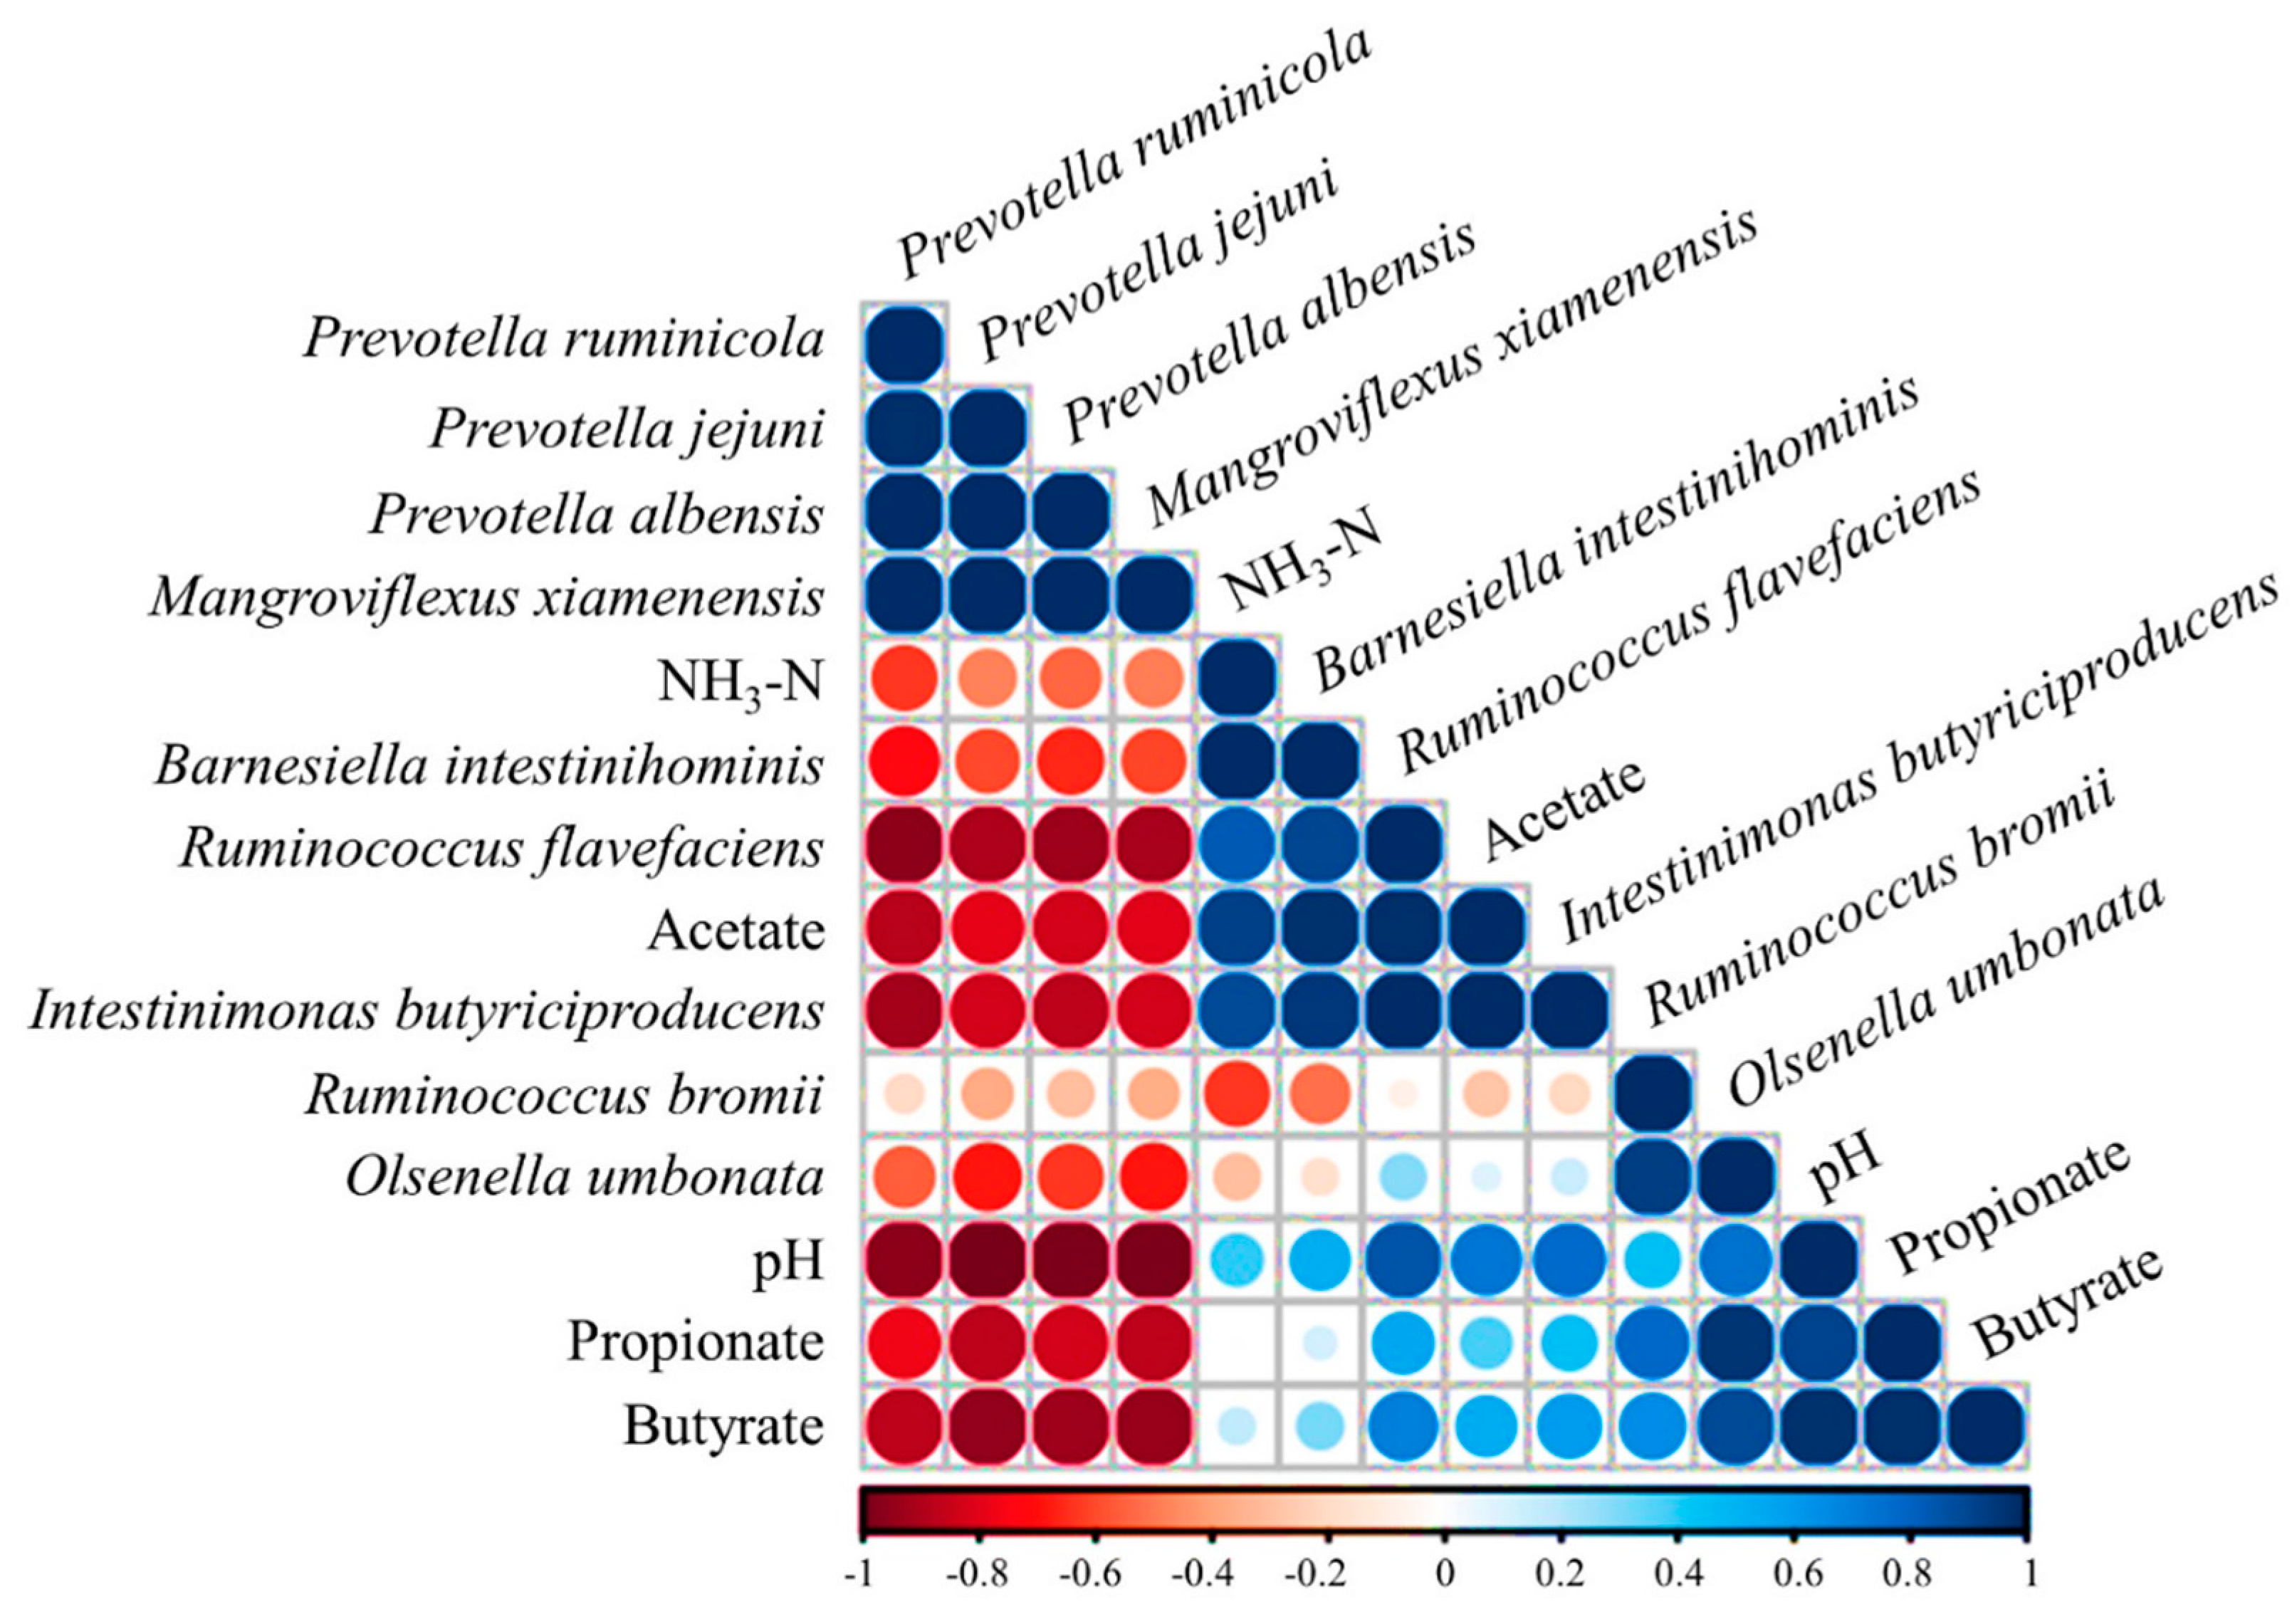
3.2.3. General Rumen Bacterial Community Composition

The alpha bacterial diversity revealed no differences across treatments for all indices, indicating that the sequencing depth was comparable for all treatments (Table 2). The distributions of the alpha diversity indices showed that the OTUs ranged from 196.67 to 285.00, 312.67 to 327.67, and 292.33 to 294.00 in RB-1, RB-3, and CON, respectively. The bacterial taxonomic composition at the phylum level is shown in Figure 3. A total of 17 bacterial phyla were identified as part of the rumen bacterial community. As the major phyla, Firmicutes, Bacteroidetes, and Actinobacteria were the most abundant. At 0 d, before supplementation with the treatments, there was a high relative abundance of the phyla Firmicutes and Bacteroidetes. However, an opposite trend was observed for Actinobacteria. Subsequently, after five days of treatment, the bacterial relative abundance was altered. There was a drastic increase in the relative abundance of Firmicutes (p = 0.023) in RB-1 and a sudden drop in RB-3 and CON. Meanwhile, there was a contrasting trend for Bacteroidetes, which exhibited high abundance in the control and a decreasing abundance after supplementation with RB-1. Furthermore, there was a noticeable decrease in the abundance of Actinobacteria in CON, whereas the abundance increased with supplementation with RB-1. Furthermore, supplementation with RB-1 and RB-2 increased the abundance of Proteobacteria. The remaining phyla exhibited low relative abundances (<1%).
The analysis of genus-level composition revealed 218 genera, of which 23 were dominant (>1% relative abundance), as shown in Figure 4. Ruminococcus and Prevotella were found to be predominant among the genera. The relative abundance of Ruminococcus was highest with RB-3 treatment, followed by RB-1 and CON at 0 d (immediately before supplementation with the treatments). However, a sudden change in the relative abundance occurred after 5 d. Supplementation with RB-1 significantly enhanced the abundance of Ruminococcus (p = 0.021); however, it reduced the relative abundance of Prevotella. Moreover, continuous supplementation with RB-3 resulted in a decreased abundance of Ruminococcus. The abundance of Prevotella under CON exhibited a drastic increase after 5 d of the feeding trial, resulting in the greatest abundance among genera during this period. However, continuous supplementation with RB-1 reduced the relative abundance of Prevotella. The relative abundances of Ethanoligenes and Olsenella were higher in the negative control than in RB-1 and RB-3 during day 0, but they were drastically reduced after 5 d. With supplementation of RB-1 and RB-3, these two genera had an increased relative abundance. Furthermore, the relative abundance of Barnesiella exhibited the same trend as Ethanoligenes and Olsenella during the 5 d feeding trial; its abundance was higher with supplementation of RB-3 than with the other treatments and CON. A notable increase in Barnesiella abundance occurred after five days of feeding. In addition, a significant increase (p = 0.001) in the abundance of Intestinimonas was observed during supplementation with RB-3. Mangroviflexus had an increased relative abundance in CON after five days of the feeding trial. Moreover, a drastic increase in Merdimonas was evident in RB-3 after 5 d of supplementation, making it the second-most abundant genus after Ruminococcus.
Species-level analysis showed that Ruminococcus bromii was the most dominant species for RB-3 (p = 0.024), followed by RB-1 and CON at 0 d (Figure 5). However, its abundance changed after five days of feeding. RB-1 had the highest relative abundance of Ruminococcus bromii compared to the other treatments. In contrast, Prevotella jejuni exhibited higher relative abundance in CON and very low abundance in RB-1 and RB-3 on the fifth day of feeding. A similar scenario was observed for Mangroviflexus xiamenensis and Prevotella albensis. The relative abundances of these two species were higher in CON than in the other treatments after five days of supplementation. Prevotella ruminicola had a higher relative abundance in RB-1 than in the other treatments at 0 d; however, a drastic decrease in its abundance occurred after 5 d of treatment. Ethanoligenens harbinense exhibited a higher abundance during treatment supplementation than in CON. In the case of Barnesiella intestinihominis, RB-3 increased its abundance after 5 d of supplementation. Olsenella umbonata also showed a drastic change in its relative abundance. As shown in Figure 3, the abundance was only high in CON on day 0; however, supplementation with RB-1 and RB-3 on the fifth day caused its abundance to gradually increase. In contrast, Ruminococcus flavefaciens (p = 0.012) and Intestinimonas butyriciproducens (p = 0.001) showed a gradual increase in relative abundance with supplementation of the dairy cows with the treatments. In this regard, R. flavefaciens and I. butyriciproducens had high relative abundances after supplementation with RB-3 on the fifth day of the feeding trial. This treatment might have enhanced the abundance of these bacterial species, causing them to have an increasing effect on their richness. Consequently, the supplementing buffers may have affected the rumen microbiota through the relative abundance of the bacterial species.
A comparison of the bacterial communities by principal coordinate analysis (PCoA) is presented in Figure 6. The unweighted unifrac three-dimensional scatter plot clearly grouped the RB-1 and RB-3 bacterial communities, distinctly separating them from the CON group microbiota. Differentiating bacterial species between the treatment groups were identified using linear discriminant analysis (LDA)-based Linear discriminant analysis Effect Size (LEfSe) algorithm approach [43]. Results showed 15 differentiating species at a p-value cut-off equal to 0.2 for Kruskal–Wallis test between treatments with an absolute LDA score 2.0. Five bacterial species were enriched under the control group, two in RB-1, and eight in RB-3. Meanwhile, only Thermotalea metallivorans was found to significantly enriched at 0.05 p-value cut-off in the control group (Figure S1).
A correlation plot was generated through a correlogram of Pearson’s correlation coefficients to visualize the degree of association between rumen fermentation parameters and the predominant rumen bacterial species (Figure 7). Parameters with a correlation coefficient of 0.8 or greater were considered as the same variables. The rumen fermentation parameters showed a negative correlation with Prevotella ruminicola, P. jejuni, P. albensis, and Mangroviflexus xiamenensis. On the other hand, Ruminococcus flavefaciens, Intestinimonas butyriciproducens, Ruminococcus bromii, and Olsenella umbonata were positively correlated with pH, acetate, propionate, and butyrate. Among these species, only Barnesiella intestinihominis showed negative correlation with the ruminal pH. Meanwhile, NH3-N showed positive correlations only with B. intestinihominis, R. flavefaciens, and I. butyriciproducens.

4. Discussion

One of the major health issues for cows in contemporary dairy farming is the sudden decline in ruminal pH, which causes reduced feed intake, problems with digestion, and milk production losses. Starch, one of the most efficient carbohydrates, can be fermented in the rumen and promote microbial growth. However, pH levels decrease when high-starch diets are quickly digested within the rumen, which in turn causes ruminal acidosis. Additionally, high-starch diets cause there to be an increased passage of fermentable carbohydrates to the intestines. Some of these carbohydrates are degraded by enzymes; however, their levels are too high to completely break down, causing the excess to flow towards the large intestine where microbial fermentation occurs. This typically leads to ruminal acidosis [45]. Sodium bicarbonate is widely used to prevent ruminal acidosis because it can act as a natural buffer in the rumen. Additionally, researchers have suggested that magnesium oxide can act as either a neutralizer or a buffer in the rumen [46].
The results of Experiment 1 showed that, among the tested agents, CO presented the most significant buffering capacity throughout in vitro rumen fermentation. The high buffering capacity of CO also affected acid neutralization, as it consistently showed the highest pH throughout the observations and resulted in a more balanced acidity compared to the other treatments after 24 h of incubation. The negative control exhibited the least significance. Few studies have used calcium oxide as a fermentation buffer for ruminants, and future studies are required to improve the efficiency of calcium oxide as a dietary buffer. Sodium bicarbonate and sodium sesquicarbonate, which presented decent effects on pH neutralization and buffering capacity, produced significantly high total gas levels. This indicates a high rate of fermentation, which could explain the lower pH level compared to that of the calcium oxide buffer. The negative control produced less total gas, which may have been due to impaired pH conditions, as a result of an imbalance between rumen microbes that were acid producers and utilizers [47]. This situation could have occurred in the absence of saliva, which is an abundant source of bicarbonate and therefore acts as a natural buffer. In addition to the fact that sodium bicarbonate has a low buffering capacity in low pH conditions, this agent rapidly solubilizes in the rumen and immediately acts as a buffer. However, it exhibits limited buffering activity, explaining why the pH dropped after 24 h of incubation. However, assessments of the effect of sodium sesquicarbonate on rumen fermentation are limited. In a study by Solorzano et al. [48], sodium sesquicarbonate presented the same effect as sodium bicarbonate in lactating Holsteins fed a high-grain diet. The effect of sodium bicarbonate as observed in the present study is similar to the observation of Le Ruyet and Tucker [32], who assessed the temporal effects of sodium bicarbonate and magnesium oxide on the buffering capacity and pH of ruminal fluid from cows fed a high-concentrate diet. This explains why these two buffer agents have nearly the same level of significance in terms of pH, buffering capacity, and total gas production. Meanwhile, increased ruminal pH increases protein solubility, causing a drastic rise in ruminal NH3-N [49]. Nagata et al. [3] concluded that an increase in NH3-N concentration is associated with VFA production, which supports the results of the correlation analysis in the present study. However, in a natural setup, excess NH3-N is either recycled or excreted [50], which was not possible in the in vitro setup; thus, this could explain why NH3-N accumulated when the buffer was not present.
Compared to the negative control, the treatments had significant effects on pH, buffering capacity, and individual and total VFA concentrations. Kohn and Dunlap [51] stated that dietary supplementation with sodium bicarbonate causes an increase in ruminal pH because of the dissociation of sodium (Na+) and bicarbonate (HCO3). The results obtained by Snyder et al. [47] revealed that supplementation with sodium bicarbonate increased ruminal pH, ammonia nitrogen concentration, and molar concentrations of individual and total VFA, which supports the results of the present study. Previous studies have reported an increase in ammonia-nitrogen once the rumen pH increases due to supplementation with sodium bicarbonate [52,53,54]. As an increase in ruminal pH results in increased protein solubility, this may have been the cause of high concentrations of ruminal ammonia-nitrogen [55]. In contrast, the delay in the drop of ruminal pH may have been due to calcium oxide being an alkalizer rather than a buffer [56]. Alkalizers can cause a large increase in pH and can neutralize acidity, whereas buffers can prevent increased acidity [55]. Furthermore, the result that supplementation with sodium bicarbonate improved gas production was in accordance with the findings of Rauch et al. [57] and Kang and Wanapat [58]. The dissociation of sodium bicarbonate, which results in the buildup of gas due to CO2 liberation, could be a possible reason for the high gas production observed in the present study. Sodium bicarbonate improves fiber digestion by increasing ruminal pH and enhancing the environmental conditions of cellulolytic bacteria [49]. The obtained data on the temporal effects of ruminal buffers in terms of their buffering capacity and the resulting pH of ruminal fluid from cows fed a high-concentrate diet were in accordance with the results of Le Ruyet and Tucker [32]. Buffering compounds increased the ruminal fluid buffering value index and were beneficial in preventing postprandial increases in the ruminal fluid hydrogen ion concentration. Shaver et al. [25] stated that magnesium oxide, sodium bicarbonate, and sodium sesquicarbonate are the best rumen buffers, as they usually increase the acetate-to-propionate ratio and prevent reduction of the ruminal pH. Kang and Wanapat [58] observed increased total VFA concentrations due to supplementation with buffering agents, which support the data obtained in the present study. Rapid carbohydrate fermentation in the rumen results in high ruminal VFA concentrations [59]. Consequently, supplementation with sodium bicarbonate and magnesium oxide in high-concentrate diets could alter ruminal pH, liquid turnover, and patterns of ruminal fermentation [60,61,62,63].
A transition of diet results in various changes in rumen conditions that reduce ruminal microbiota richness and diversity [2,10,64]. Researchers have reported that a high-concentrate diet alters microbial community structures in the digestive tract of ruminants [9,10,65]. A metagenomic survey of bacterial community composition was conducted using the ruminal fluid samples of Holstein Friesian cows at 0 d to 5 d after a feeding trial. The phylum-level bacterial composition was in accordance with the data obtained from previous research showing that Firmicutes, Bacteroidetes, and Actinobacteria were the predominant phyla in the rumen [3,9,65]. Firmicutes and Bacteroidetes were identified and considered to be the core components of the microbiome [9,66]. These two phyla might be less affected by sudden changes in the rumen ecosystem, such as acidic challenges and dietary changes [3]. Previous studies have reported that the ratio of Bacteroidetes in the rumen decreases due to acidic conditions during feeding with a high-concentrate diet [10,67]. However, Bacteroidetes is more efficient in degrading structural carbohydrates than Firmicutes [68]. Ruminococcus and Prevotella were the predominant genera in the present study. Prevotella, a dominant bacterial genus in the rumen, has a unique ability to use a variety of substrates when ruminants consume a range of different diets [69]. Although Ruminococcus is a well-known cellulolytic bacteria, Ruminococcus bromii, which can ferment starch, was found to be dominant in the rumen microbiome [70]. Thus, an increase in starch-fermenting Ruminococcus species may have contributed to the higher relative abundance of this genus during the feeding trial. Consequently, the high relative abundance of Mangroviflexus in the negative control may have been due to the ability of this genus to utilize starch as the sole carbon and nitrogen source [71]. In addition, the high concentrations of acetate and propionate in the rumen fermentation samples of dairy cows can be explained by the study of Zhao et al. who found that Mangroviflexus xiamensis is the main fermentation product of acetate, propionate, and succinate [71]. The relative abundance of Barnesiella in the present study can be supported by the results of Sakamoto et al. [72], who found that this particular genus is saccharolytic and has a strictly fermentative type of metabolism. Moreover, the high abundances of B. intestinihominis and Ethanoligenens harbinense in the RB treatments were appropriate considering the acetate concentration in the rumen fluid of dairy cows that received treatment supplementation for five days. A study by Morotomi et al. [73] revealed that acetate is one of the metabolic end products of this species, which supports the in vivo results of acetate in the present study. These previous findings support the positive correlation observed between B. intestinihominis and rumen-produced acetate. Furthermore, Opdahl et al. [74] stated that E. harbinense can ferment various mono-, di-, and oligosaccharides into acetate, ethanol, hydrogen, and carbon dioxide. An increase in the relative abundance of Intestinimonas butyriciproducens with RB treatments may have directly contributed to the increase in butyrate concentration observed in the rumen fluid after treatment supplementation. Kläring et al. [75] found that I. butyriciproducens has a unique function in producing butyrate, thus supporting the findings of the present study. Prevotella ruminicola is considered one of the most abundant species recovered from the rumen, and it usually plays an important role in polysaccharide degradation [76,77]. This supports the results of the present study, considering the relative abundance of P. ruminicola during the high-concentrate diet period. Similarly, the high abundance of P. jejuni in CON may have been due to its ability to ferment glucose and its cell function as a saccharolytic bacteria [27,78]. Rumen microbes have a unique ability to convert carbohydrates to short-chain fatty acids at a rate that exceeds the absorptive, buffering, and outflow capacity of the rumen, which causes a sudden decrease in ruminal pH [6].
Several studies have investigated the effect of ruminal acidosis on the adaptation and recovery of ruminal bacteria during acidic challenges [1,2,3,79]. In accordance with previous research, the transition to a high-concentrate diet and resulting SARA, as well as the changes in the conditions and substrate availabilities in the rumen resulted in a reduction of the richness and diversity of the ruminal fluid microbiota [9,10,64]. Moreover, excessive grain feeding and concentrate-induced SARA altered the microbial community structure of the digestive tract [1,10,64,80]. Levine and D’Antonio [81] concluded that the high richness and diversity of rumen microbiota are linked with healthy hosts and high adaptability, robustness, and functionality of these microbiota. The reduced richness and diversity of ruminal microbiota during excessive grain feeding adversely affects their health and production [2]. Thus, as Zamarreño et al. [21] stated, the use of antacids or buffer agents is recommended, as they can help to avoid the occurrence of ruminant acidosis.

5. Conclusions

To our knowledge, this is the first study to report the effect of combined buffering agents on in vitro and in vivo ruminal fermentation parameters and the ruminal bacterial composition and diversity of Holstein Friesian cows fed a high-concentrate diet. The combined buffering agent treatments had a significant effect on in vitro ruminal fermentation. The supplementation of treatments to Holstein Friesian cows did not significantly affect the in vivo ruminal fermentation parameters; however, it markedly showed that treatments RB-1 and RB-3 had parameters with higher numerical values compared to the negative control. A metagenomics survey on the abundance and diversity of rumen bacteria revealed that Firmicutes and Bacteroidetes were the dominant phyla in all treatments and the negative control. We identified 218 genera, of which Ruminococcus and Prevotella were dominant. Bacterial communities before and after treatment supplementation showed distinct changes, considering the different OTUs obtained from each group. The high-concentrate diet administered to dairy cows induced adverse changes in ruminal pH, and supplementation of treatments altered bacterial community composition and diversity. Thus, this study provides novel insights into the effect of combined buffer agents on ruminal fermentation and bacterial communities for dairy cows fed a high-concentrate diet.

Supplementary Materials

The following materials are available online at https://www.mdpi.com/article/10.3390/agriculture11060554/s1, Table S1: Ingedients and chemical composition of the experimental concentrate; Table S2: Formulated buffer agent treatments for in vitro and in vivo experiments; Table S3: Neutralizing and buffering capacity of the formulated buffer agent treatments; Table S4: Effect of treatments on in vitro rumen fermentation parameters after 0, 6, 12, and 24 h of incubation; Table S5: Effect of treatments on rumen fermentation profile of Holstein Friesian cows after 5 days of supplementation; Figure S1: Linear discriminant analysis Effect Size (LEfSe) for the influence of treatments on bacterial communities.

Author Contributions

Conceptualization, S.-S.L., C.-D.J. and S.C.R.; supervision, S.-S.L.; experiment, S.C.R. and C.-D.J.; data curation, S.C.R. and C.-D.J.; formal analysis, S.C.R., C.-D.J. and S.-S.L.; laboratory analysis, S.C.R.; methodology, S.C.R., C.-D.J., M.A.M. and S.-S.L.; Rumen fluid sampling, S.C.R. and M.I.; software, Y.-I.C., S.-H.K. and A.-R.S.; validation, S.-S.L.; investigation, S.C.R., C.-D.J. and S.-S.L.; writing—original draft, S.-S.L., C.-D.J. and S.C.R.; writing—review and editing: S.C.R., L.L.M. and S.-S.L. All authors have read and agreed to the published version of the manuscript.

Funding

This research was funded by the National Research Foundation of Korea (NRF), Republic of Korea, project no. 2020R1I1A3074048.

Institutional Review Board Statement

The present study was approved by the Ethics Committee on Animal Use of Sunchon National University (approval number SCNU IACUC-2008-01).

Data Availability Statement

The data presented in this study are available upon request from the corresponding author.

Conflicts of Interest

The authors declare no conflict of interest.

References

  1. Hook, S.E.; Steele, M.A.; Northwood, K.S.; Dijkstra, J.; France, J.; Wright, A.-D.G.; McBride, B.W. Impact of subacute ruminal acidosis (SARA) adaptation and recovery on the density and diversity of bacteria in the rumen of dairy cows. FEMS Microbiol. Ecol. 2011, 78, 275–284. [Google Scholar] [CrossRef] [Green Version]
  2. Plaizier, J.C.; Li, S.; Danscher, A.M.; Derakshani, H.; Andersen, P.H.; Khafipour, E. Changes in Microbiota in Rumen Digesta and Feces Due to a Grain-Based Subacute Ruminal Acidosis (SARA) Challenge. Microb. Ecol. 2017, 74, 485–495. [Google Scholar] [CrossRef]
  3. Nagata, R.; Kim, Y.H.; Ohkubo, A.; Kushibiki, S.; Ichijo, T.; Sato, S. Effects of repeated subacute ruminal acidosis challenges on the adaptation of the rumen bacterial community in Holstein bulls. J. Dairy Sci. 2018, 101, 4424–4436. [Google Scholar] [CrossRef]
  4. Plaizier, J.C.; Khafipour, E.; Li, S.; Gozho, G.N.; Krause, D.O. Subacute ruminal acidosis (SARA), endotoxins and health consequences. Anim. Feed Sci. Technol. 2012, 172, 9–21. [Google Scholar] [CrossRef]
  5. Kleen, J.L.; Cannizzo, C. Incidence, prevalence and impact of SARA in dairy herds. Anim. Feed Sci. Technol. 2012, 172, 4–8. [Google Scholar] [CrossRef]
  6. Plaizier, J.C.; Krause, D.O.; Gozho, G.N.; McBride, B.W. Subacute ruminal acidosis in dairy cows: The physiological causes, incidence and consequences. Vet. J. 2008, 176, 21–31. [Google Scholar] [CrossRef] [PubMed]
  7. Rabelo, E.; Rezende, R.L.; Bertics, S.J.; Grummer, R.R. Effects of transition diets varying in dietary energy density on lactation performance and ruminal parameters of dairy cows. J. Dairy Sci. 2003, 86, 916–925. [Google Scholar] [CrossRef] [Green Version]
  8. Nagaraja, T.G.; Titgemeyer, E.C. Ruminal acidosis in beef cattle: The current microbiological and nutritional outlook. J. Dairy Sci. 2007, 90, E17–E38. [Google Scholar] [CrossRef] [Green Version]
  9. Petri, R.M.; Schwaiger, T.; Penner, G.B.; Beauchemin, K.A.; Forster, R.J.; McKinnon, J.J.; McAllister, T.A. Characterization of the core rumen microbiome in cattle during transition from forage to concentrate as well as during and after an acidotic challenge. PLoS ONE 2013, 8, e83424. [Google Scholar] [CrossRef] [PubMed] [Green Version]
  10. Mao, S.Y.; Zhang, R.Y.; Wang, D.S.; Zhu, W.Y. Impact of subacute ruminal acidosis (SARA) adaptation on rumen microbiota in dairy cattle using pyrosequencing. Anaerobe 2013, 24, 12–19. [Google Scholar] [CrossRef] [PubMed]
  11. Khafipour, E.; Li, S.; Tun, H.M.; Derakhshani, H.; Moossavi, S.; Plaizier, K.J.C. Effects of grain feeding on microbiota in the digestive tract of cattle. Anim. Front. 2016, 6, 13–19. [Google Scholar] [CrossRef]
  12. Steele, M.A.; Croom, J.; Kahler, M.; Alzahal, O.; Hook, S.E.; Plaizier, K.; Mcbride, B.W. Bovine rumen epithelium undergoes rapid structural adaptations during grain-induced subacute ruminal acidosis. Am. J. Physiol. Regul. Integr. Comp. Physiol. 2011, 300, R1515–R1523. [Google Scholar] [CrossRef] [PubMed] [Green Version]
  13. Zebeli, Q.; Metzler-Zebeli, B.U. Interplay between rumen digestive disorders and diet-induced inflammation in dairy cattle. Res. Vet. Sci. 2012, 93, 1099–1108. [Google Scholar] [CrossRef]
  14. Russell, J.B.; Rychlik, J.L. Factors that alter rumen microbial ecology. Science (80-.) 2001, 292, 1119–1122. [Google Scholar] [CrossRef]
  15. Krause, D.O.; Nagaraja, T.G.; Wright, A.D.G.; Callaway, T.R. Board-invited review: Rumen microbiology: Leading the way in microbial ecology. J. Anim. Sci. 2013, 91, 331–341. [Google Scholar] [CrossRef]
  16. Grant, R.H.; Mertens, D.R. Influence of Buffer pH and Raw Corn Starch Addition on In Vitro Fiber Digestion Kinetics. J. Dairy Sci. 1992, 75, 2762–2768. [Google Scholar] [CrossRef]
  17. Russell, J.B.; Wilson, D.B. Why Are Ruminal Cellulolytic Bacteria Unable to Digest Cellulose at Low pH? J. Dairy Sci. 1996, 79, 1503–1509. [Google Scholar] [CrossRef]
  18. Li, F.; Cao, Y.; Liu, N.; Yang, X.; Yao, J.; Yan, D. Subacute ruminal acidosis challenge changed in situ degradability of feedstuffs in dairy goats. J. Dairy Sci. 2014, 97, 5101–5109. [Google Scholar] [CrossRef] [Green Version]
  19. Khorasani, R. Dietary Buffering Requirements of Lactating Dairy Cows; Department of Agricultural Food and Nutritional Sciences, University of Alberta: Edmonton, AB, Canada, 2018. [Google Scholar]
  20. Tucker, W.B.; Aslam, M.; Lema, M.; Shin, I.S.; Le Ruyet, P.; Hogue, J.F.; Buchanan, D.S.; Miller, T.P.; Adams, G.D. Sodium bicarbonate or multielement buffer via diet or rumen: Effects on performance and acid-base status of lactating cows. J. Dairy Sci. 1992, 75, 2409–2420. [Google Scholar] [CrossRef]
  21. Zamarreño, A.M.; García-Mina, J.M.; Cantera, R.G. A new methodology for studying the performance of products against ruminal acidosis. J. Sci. Food Agric. 2003, 83, 1607–1612. [Google Scholar] [CrossRef]
  22. Stokes, M.R.; Vandemark, L.L.; Bull, L.S. Effects of sodium bicarbonate, magnesium oxide, and a commercial buffer mixture in early lactation cows fed hay crop silage. J. Dairy Sci. 1986, 69, 1595–1603. [Google Scholar] [CrossRef]
  23. Stallings, C.C. Sodium Bicarbonate and Magnesium Oxide in Dairy Cattle Rations; Virginia Cooperative Extension Program: Blacksburg, VA, USA, 1992; Available online: https://vtechworks.lib.vt.edu/bitstream/handle/10919/75835/VCE404_114.pdf?sequence=1&isAllowed=y (accessed on 12 June 2020).
  24. Erdman, R.A.; Douglass, L.W.; Hemken, R.W.; Teh, T.H.; Mann, L.M. Effects of Sodium Bicarbonate on Palatability and Voluntary Intake of Concentrates Fed Lactating Dairy Cows. J. Dairy Sci. 1982, 65, 1647–1651. [Google Scholar] [CrossRef]
  25. Shaver, R.D.; Armentano, L.E.; Crowley, J.W. Dietary Buffers for Dairy Cattle; University of Wisconsin: Madison, WA, USA, 1988. [Google Scholar]
  26. Herod, E.L.; Bechtle, R.M.; Bartley, E.E.; Dayton, A.D. Buffering ability of several compounds in vitro and the effect of a selected buffer combination on ruminal acid production in vivo. J. Dairy Sci. 1978, 61, 1114–1122. [Google Scholar] [CrossRef]
  27. Ramos, S.C.; Jeong, C.D.; Mamuad, L.L.; Kim, S.H.; Kang, S.H.; Kim, E.T.; Cho, Y.I.; Lee, S.S.; Lee, S.S. Diet transition from high-forage to high-concentrate alters rumen bacterial community composition, epithelial transcriptomes and ruminal fermentation parameters in dairy cows. Animals 2021, 11, 838. [Google Scholar] [CrossRef]
  28. Hattori, K.; Matsui, H. Diversity of fumarate reducing bacteria in the bovine rumen revealed by culture dependent and independent approaches. Anaerobe 2008, 14, 87–93. [Google Scholar] [CrossRef] [PubMed]
  29. Soriano, A.P.; Mamuad, L.L.; Kim, S.H.; Choi, Y.J.; Jeong, C.D.; Bae, G.S.; Chang, M.B.; Lee, S.S. Effect of Lactobacillus mucosae on in vitro rumen fermentation characteristics of dried brewers grain, methane production and bacterial diversity. Asian-Australasian J. Anim. Sci. 2014, 27, 1562–1570. [Google Scholar] [CrossRef] [PubMed] [Green Version]
  30. Mamuad, L.L.; Kim, S.H.; Choi, Y.J.; Soriano, A.P.; Cho, K.K.; Lee, K.; Bae, G.S.; Lee, S.S. Increased propionate concentration in Lactobacillus mucosae–fermented wet brewers grains and during in vitro rumen fermentation. J. Appl. Microbiol. 2017, 123, 29–40. [Google Scholar] [CrossRef] [PubMed]
  31. Chaney, A.L.; Marbach, E.P. Modified reagents for determination of urea and ammonia. Clin. Chem. 1962, 8, 130–132. [Google Scholar] [CrossRef]
  32. Le Ruyet, P.; Tucker, W.B. Ruminal Buffers: Temporal Effects on Buffering Capacity and pH of Ruminal Fluid from Cows Fed a High Concentrate Diet. J. Dairy Sci. 1992, 75, 1069–1077. [Google Scholar] [CrossRef]
  33. Buffalo, V.S. Scythe: A Bayesian Adapter Trimer. Available online: https://github.com/vsbuffalo/scythe (accessed on 22 October 2020).
  34. Joshi, N.A.; Fass, J.N. Sickle: A Sliding-Window, Adaptive, Quality-Based Trimming Tool for FastQ Files (Version 1.33) [Software]. Available online: https://github.com/najoshi/sickle (accessed on 22 October 2020).
  35. Magoč, T.; Salzberg, S.L. FLASH: Fast length adjustment of short reads to improve genome assemblies. Bioinformatics 2011, 27, 2957–2963. [Google Scholar] [CrossRef]
  36. Fu, L.; Niu, B.; Zhu, Z.; Wu, S.; Li, W. CD-HIT: Accelerated for clustering the next-generation sequencing data. Bioinformatics 2012, 28, 3150–3152. [Google Scholar] [CrossRef]
  37. Caporaso, J.G.; Kuczynski, J.; Stombaugh, J.; Bittinger, K.; Bushman, F.D.; Costello, E.K.; Fierer, N.; Peña, A.G.; Goodrich, J.K.; Gordon, J.I.; et al. QIIME allows analysis of high- throughput community sequencing data Intensity normalization improves color calling in SOLiD sequencing. Nat. Publ. Gr. 2010, 7, 335–336. [Google Scholar] [CrossRef]
  38. Edgar, R.C. Search and clustering orders of magnitude faster than BLAST. Bioinformatics 2010, 26, 2460–2461. [Google Scholar] [CrossRef] [Green Version]
  39. McDonald, D.; Clemente, J.C.; Kuczynski, J.; Rideout, J.R.; Stombaugh, J.; Wendel, D.; Wilke, A.; Huse, S.; Hufnagle, J.; Meyer, F.; et al. The Biological Observation Matrix (BIOM) format or: How I learned to stop worrying and love the ome-ome. Gigascience 2012, 464, 1–6. [Google Scholar] [CrossRef] [PubMed] [Green Version]
  40. Schloss, P.D.; Westcott, S.L.; Ryabin, T.; Hall, J.R.; Hartmann, M.; Hollister, E.B.; Lesniewski, R.A.; Oakley, B.B.; Parks, D.H.; Robinson, C.J.; et al. Introducing mothur: Open-Source, Platform-Independent, Community-Supported Software for Describing and Comparing Microbial Communities. Appl. Environ Microbiol. 2009, 75, 7537–7541. [Google Scholar] [CrossRef] [PubMed] [Green Version]
  41. Wang, Y.; Xu, L.; Gu, Y.Q.; Coleman-Derr, D. MetaCoMET: A web platform for discovery and visualization of the core microbiome. Bioinformatics 2016, 32, 3469–3470. [Google Scholar] [CrossRef] [Green Version]
  42. Dhariwal, A.; Chong, J.; Habib, S.; King, I.L.; Agellon, L.B.; Xia, J. MicrobiomeAnalyst: A web-based tool for comprehensive statistical, visual and meta-analysis of microbiome data. Nucleic Acids Res. 2017, 45, W180–W188. [Google Scholar] [CrossRef]
  43. Segata, N.; Izard, J.; Waldron, L.; Gevers, D.; Miropolsky, L.; Garrett, W.S.; Huttenhower, C. Metagenomic biomarker discovery and explanation. Genome Biol. 2011, 12, R60. [Google Scholar] [CrossRef] [PubMed] [Green Version]
  44. Kassambara, A. Correlation Matrix—Online Software: Analysis and Visualization. Available online: http://www.sthda.com/english/rsthda/correlation-matrix.php (accessed on 6 June 2021).
  45. Mainardi, S.R.; Hengst, B.A.; Nebzydoski, S.J.; Nemec, L.M.; Gressley, T.F. Effects of abomasal oligofructose on blood and feces of Holstein steers. J. Anim. Sci. 2011, 89, 2510–2517. [Google Scholar] [CrossRef]
  46. Teh, T.H.; Hemken, R.W.; Harmon, R.J. Dietary magnesium oxide interactions with sodium bicarbonate on cows in early lactation. J. Dairy Sci. 1985, 68, 881–890. [Google Scholar] [CrossRef]
  47. Blignaut, D. Alkaline treatment for preventing acidosis in the rumen culture fermenting carbohydrates: An experimental study in vitro. J. Adv. Vet. Anim. Res. 2019, 6, 100–107. [Google Scholar]
  48. Solorzano, L.C.; Armentano, L.E.; Grummer, R.R.; Dentine, M.R. Effects of sodium bicarbonate or sodium sesquicarbonate on lactating holsteins fed a high grain diet. J. Dairy Sci. 1989, 72, 453–461. [Google Scholar] [CrossRef]
  49. Snyder, T.J.; Rogers, J.A.; Muller, L.D. Effects of 1.2% sodium icarbonate with two ratios of corn silage:grain on milk production, rumen germentation, and utrient digestion by lactating dairy cows. J. Dairy Sci. 1983, 66, 1290–1297. [Google Scholar] [CrossRef]
  50. Abdoun, K.; Stumpff, F.; Martens, H. Ammonia and urea transport across the rumen epithelium: A review. Anim. Health Res. Rev. 2006, 7, 43–59. [Google Scholar] [CrossRef] [PubMed] [Green Version]
  51. Kohn, R.A.; Dunlap, T.F. Calculation of the buffering capacity of bicarbonate in the rumen and in vitro. J. Anim. Sci. 1998, 76, 1702–1709. [Google Scholar] [CrossRef] [PubMed] [Green Version]
  52. Emery, R.S.; Brown, L.D. Effect of feeding sodium and potassium bicarbonate on milk fat, rumen pH, and volatile fatty acid production. J. Dairy Sci. 1961, 44, 1899. [Google Scholar] [CrossRef]
  53. Emery, R.S.; Brown, L.D.; Thomas, J.W. Effect of sodium and calcium carbonates on milk production and composition of milk, blood, and rumen contents of cows fed grain ad libitum with restricted roughage. J. Dairy Sci. 1964, 58, 1325. [Google Scholar] [CrossRef]
  54. Erdman, R.A.; Botts, R.L.; Hemken, R.W.; Bull, L.S. Effect of dietary sodium bicarbonate and magnesium oxide on production and physiology in early lactation. J. Dairy Sci. 1980, 63, 923–930. [Google Scholar] [CrossRef]
  55. Wohlt, J.E.; Sniffen, C.J.; Hoover, W.H. Measurement of protein solubility in common feedstuffs. J. Dairy Sci. 1973, 56, 1052. [Google Scholar] [CrossRef]
  56. Nuñez, A.J.C.; Felix, T.L.; Lemenager, R.P.; Schoonmaker, J.P. Effect of calcium oxide inclusion in beef feedlot diets containing 60% dried distillers grains with solubles on ruminal fermentation, diet digestibility, performance, and carcass characteristics. J. Anim. Sci. 2014, 92, 3954–3965. [Google Scholar] [CrossRef]
  57. Rauch, R.E.; Robinson, P.H.; Erasmus, L.J. Effects of sodium bicarbonate and calcium magnesium carbonate supplementation on performance of high producing dairy cows. Anim. Feed Sci. Technol. 2012, 177, 180–193. [Google Scholar] [CrossRef]
  58. Kang, S.; Wanapat, M. Rumen-buffering capacity using dietary sources and in vitro gas fermentation. Anim. Prod. Sci. 2016, 58, 862–870. [Google Scholar] [CrossRef]
  59. Khattab, I.M.; Salem, A.Z.M.; Abdel-Wahed, A.M.; Kewan, K.Z. Effects of urea supplementation on nutrient digestibility, nitrogen utilisation and rumen fermentation in sheep fed diets containing dates. Livest. Sci. 2013, 155, 223–229. [Google Scholar] [CrossRef]
  60. Erdman, R.A.; Hemken, R.W.; Bull, L.S. Dietary sodium bicarbonate and magnesium oxide for early postpartum lactating dairy cows: Effects on production, acid-base metabolism, and digestion. J. Dairy Sci. 1982, 65, 712–731. [Google Scholar] [CrossRef]
  61. Thomas, J.W.; Emery, R.S. Additive Nature of Sodium Bicarbonate and Magnesium Oxide on Milk Fat Concentrations of Milking Cows Fed Restricted-Roughage Rations. J. Dairy Sci. 1969, 52, 1762. [Google Scholar] [CrossRef]
  62. Thomson, D.J.; Beever, D.E.; Latham, M.J.; Sharpe, M.E. The effect of inclusion of mineral salts in the diet on dilution rate, the pattern of rumen fermentation and the composition of the rumen microflora. J. Agric. Sci. 1978, 91, 1. [Google Scholar] [CrossRef]
  63. Emmanuel, B.; Lawlor, M.J.; McAleese, D. The effect of phosphate and carbonate-bicarbonate supplements on the rumen buffering systems of sheep. Br. J. Nutr. 1970, 24, 653. [Google Scholar] [CrossRef] [PubMed]
  64. Fernando, S.C.; Purvis, H.T.; Najar, F.Z.; Sukharnikov, L.O.; Krehbiel, C.R.; Nagaraja, T.G.; Roe, B.A.; De Silva, U. Rumen microbial population dynamics during adaptation to a high-grain diet. Appl. Environ. Microbiol. 2010, 76, 7482–7490. [Google Scholar] [CrossRef] [Green Version]
  65. Khafipour, E.; Krause, D.O.; Plaizier, J.C. A grain-based subacute ruminal acidosis challenge causes translocation of lipopolysaccharide and triggers inflammation. J. Dairy Sci. 2009, 92, 1060–1070. [Google Scholar] [CrossRef] [Green Version]
  66. Henderson, G.; Cox, F.; Ganesh, S.; Jonker, A.; Young, W.; Global Rumen Census Collaborators; Janssen, P.H. Rumen microbial community composition varies with diet and host, but a core microbiome is found across a wide geographical range. Sci. Rep. 2015, 5, 14567. [Google Scholar] [CrossRef]
  67. Sato, S. Pathophysiological evaluation of subacute ruminal acidosis (SARA) by continuous ruminal pH monitoring. Anim. Sci. J. 2016, 87, 168–177. [Google Scholar] [CrossRef] [Green Version]
  68. Kaoutari, A.E.; Armougom, F.; Gordon, J.I.; Raoult, D.; Henrissat, B. The abundance and variety of carbohydrate-active enzymes in the human gut microbiota. Nat. Rev. Microbiol. 2013, 11, 497–504. [Google Scholar] [CrossRef]
  69. Golder, H.M.; Denman, S.E.; McSweeney, C.; Celi, P.; Lean, I.J. Ruminal bacterial community shifts in grain-, sugar-, and histidine-challenged dairy heifers. J. Dairy Sci. 2014, 97, 5131–5150. [Google Scholar] [CrossRef] [PubMed]
  70. Klieve, A.V.; O’Leary, M.N.; McMillen, L.; Ouwerkerk, D. Ruminococcus bromii, identification and isolation as a dominant community member in the rumen of cattle fed a barley diet. J. Appl. Microbiol. 2007, 103, 2065–2073. [Google Scholar] [CrossRef]
  71. Zhao, C.; Gao, Z.; Qin, Q.; Ruan, L. Mangroviflexus xiamenensis gen. nov., sp. nov., a member of the family Marinilabiliaceae isolated from mangrove sediment. Int. J. Syst. Evol. Microbiol. 2012, 62, 1819–1824. [Google Scholar] [CrossRef]
  72. Sakamoto, L.; Benno, B. Bergey’s Manual of Systematics of Archaea and Bacteria; Wiley: Hoboken, NJ, USA, 2015; pp. 1–3. [Google Scholar] [CrossRef]
  73. Morotomi, M.; Nagai, F.; Sakon, H.; Tanaka, R. Dialister succinatiphilus sp. nov. and Barnesiella intestinihominis sp. nov., isolated from human faeces. Int. J. Syst. Evol. Microbiol. 2008, 58, 2716–2720. [Google Scholar] [CrossRef] [Green Version]
  74. Opdahl, L.J.; Gonda, M.G.; St-Peter, B. Identification of Uncultured Bacterial Species from Firmicutes, Bacteroidetes and CANDIDATUS Saccharibacteria as Candidate Cellulose Utilizers from the Rumen of Beef Cows. Microorganisms 2018, 6, 17. [Google Scholar] [CrossRef] [Green Version]
  75. Kläring, K.; Hanske, L.; Bui, N.; Charrier, C.; Blaut, M.; Haller, D.; Plugge, C.M.; Clavel, T. Intestinimonas butyriciproducens gen. nov., sp. nov., a butyrate-producing bacterium from the mouse intestine. Int. J. Syst. Evol. Microbiol. 2013, 63, 4606–4612. [Google Scholar] [CrossRef] [PubMed] [Green Version]
  76. Dehority, B.A. Characterization of several bovine rumen bacteria isolated with a xylan medium. J. Bacteriol. 1966, 91, 1724–1729. [Google Scholar] [CrossRef] [PubMed] [Green Version]
  77. Hungate, R.E. The Rumen and Its Microbes, 1st ed.; Academic Press: Cambridge, MA, USA, 1966; ISBN 9781483263625. [Google Scholar]
  78. Downes, J.; Sutcliffe, I.; Tanner, A.C.R.; Wade, W.G. Prevotella marshii sp. nov. and Prevotella baroniae sp. nov., isolated from the human oral cavity. Int. J. Syst. Evol. Microbiol. 2005, 55, 1551–1555. [Google Scholar] [CrossRef] [Green Version]
  79. McCann, J.C.; Luan, S.; Cardoso, F.C.; Derakhshani, H.; Khafipour, E.; Loor, J.J. Induction of subacute ruminal acidosis affects the ruminal microbiome and epithelium. Front. Microbiol. 2016, 7, 701. [Google Scholar] [CrossRef] [PubMed] [Green Version]
  80. Khafipour, E.; Li, S.; Plaizier, J.C.; Krause, D.O. Rumen microbiome composition determined using two nutritional models of subacute ruminal acidosis. Appl. Environ. Microbiol. 2009, 75, 7115–7124. [Google Scholar] [CrossRef] [PubMed] [Green Version]
  81. Levine, J.M.; D’Antonio, C.M. Elton revisited: A review of evidence linking diversity and invasibility. Oikos 1999, 87, 15–26. [Google Scholar] [CrossRef] [Green Version]
Figure 1. Buffering capacity (meq/L) of treatments during the in vitro rumen fermentation experiment after 0, 6, 12, and 24 h of incubation. BEN, bentonite; CC, calcium carbonate; CO, calcium oxide; SB, sodium bicarbonate; SS, sodium sesquicarbonate; PC, processed coral; CON, control. Superscripts above columns of each buffer (a–f) denote significant differences (p < 0.05).
Agriculture 11 00554 g001
Figure 2. Effect of treatments on in vitro rumen fermentation parameters after 0, 6, 12, and 24 h of incubation. (a) effect on pH, NH3-N (mg/dL), BC (meq/L), and total gas (mL). (b) effect on individual and total VFA (mmol/L), and A/P ratio. CON, negative control; RB-1 (30% calcium oxide, 10% processed coral, 30% magnesium oxide, 30% sodium bicarbonate); RB-2 (20% calcium oxide, 10% processed coral, 30% magnesium oxide, 40% sodium bicarbonate); RB-3 (20% calcium oxide, 10% processed coral, 40% magnesium oxide, 30% sodium bicarbonate). a–d Superscript denotes significant differences (p < 0.05). BC, buffering capacity; NH3-N, ammonia-nitrogen; VFA, volatile fatty acid; A/P, acetate to propionate ratio.
Agriculture 11 00554 g002
Figure 3. Phylum-level bacterial taxonomic compositions of Holstein Friesian cow rumens at 0 and 5 d of treatment supplementation. CON (no buffer added), negative control; RB-1 (30% calcium oxide, 10% processed coral, 30% magnesium oxide, 30% sodium bicarbonate); RB-3 (20% calcium oxide, 10% processed coral, 40% magnesium oxide, 30% sodium bicarbonate). Asterisks (*) denote significant differences (p < 0.05).
Agriculture 11 00554 g003
Figure 4. Genus-level bacterial taxonomic compositions of Holstein Friesian cow rumens at 0 and 5 d of treatment supplementation. CON (no buffer added), negative control; RB-1 (30% calcium oxide, 10% processed coral, 30% magnesium oxide, 30% sodium bicarbonate); RB-3, (20% calcium oxide, 10% processed coral, 40% magnesium oxide, 30% sodium bicarbonate). Asterisks (*) denote significant differences (p < 0.05).
Agriculture 11 00554 g004
Figure 5. Species-level bacterial taxonomic compositions of Holstein Friesian cow rumens at 0 and 5 d of treatment supplementation. CON (no buffer added), negative control; RB-1 (30% calcium oxide, 10% processed coral, 30% magnesium oxide, 30% sodium bicarbonate); RB-3 (20% calcium oxide, 10% processed coral, 40% magnesium oxide, 30% sodium bicarbonate). Asterisks (*) denote significant differences (p < 0.05).
Agriculture 11 00554 g005
Figure 6. Bacterial beta diversity of the rumen digesta of Holstein Friesian cow after 5 days of treatment supplementation, showing a three-dimensional scatter plot, generated using principal coordinates analysis (PCoA) from Bray–Curtis index analyses [42]. Each treatment is identified by colors on the right side of the figure. Permutational multivariate analysis of variance (PERMANOVA) was used to compare beta diversities between treatments. CON (no buffer added), negative control; RB-1, (30% calcium oxide, 10% processed coral, 30% magnesium oxide, 30% sodium bicarbonate); RB-3 (20% calcium oxide, 10% processed coral, 40% magnesium oxide, 30% sodium bicarbonate).
Agriculture 11 00554 g006
Figure 7. Correlation plot showing the Pearson’s correlation coefficient between the rumen fermentation parameters and the predominating rumen bacterial species. Statistically significant values are shown (p < 0.05). Strong positive and negative correlations are displayed in blue and red, respectively, and less strong correlations are shown in lighter shades. Color intensity and the size of the circle are proportional to the correlation coefficients. The figure was generated using statistical tools for high-throughput data analysis (STHDA) [44].
Agriculture 11 00554 g007
Table 1. Chemical composition of buffer agents.
Component (%)RB-1RB-3
Calcium10.8910.61
Phosphorus0.060.05
Potassium2.991.85
Magnesium15.4317.96
Sodium10.507.93
Iron0.160.19
Manganese0.010.01
RB-1: 30% calcium oxide, 10% processed coral, 30% magnesium oxide, and 30% sodium bicarbonate. RB-3: 20% calcium oxide, 10% processed coral, 40% magnesium oxide, and 30% sodium bicarbonate.
Table 2. Diversity of the microbial communities in rumen samples of Holstein Friesian cows supplemented with different treatment over a 5-day feeding trial.
IndexDay (d)Treatment 1SEMp-Value
CONRB-1RB-3
OTU0292.33196.67312.6739.8290.294
5294.00285.00327.6736.4610.753
Chao10323.19207.02347.9446.7360.235
5333.84320.23358.4142.0450.843
Shannon Index04.663.854.770.7830.235
54.405.004.930.7200.843
Inverse Simpson00.890.770.880.0700.466
50.840.900.890.0670.778
1 CON, negative control; RB-1 (30% calcium oxide, 10% processed coral, 30% magnesium oxide, 30% sodium bicarbonate); RB-3 (20% calcium oxide, 10% processed coral, 40% magnesium oxide, 30% sodium bicarbonate). SEM, standard error of the mean.
Publisher’s Note: MDPI stays neutral with regard to jurisdictional claims in published maps and institutional affiliations.

