Article

Effects of Phosphorus on Nitrification Process in a Fertile Soil Amended with Urea

1
Institute of Agricultural Resources and Environment, Guangdong Academy of Agricultural Sciences, Key Laboratory of Plant Nutrition and Fertilizer in South Region, Ministry of Agriculture and Rural Affairs, Guangdong Key Laboratory of Nutrient Cycling and Farmland Conservation, Guangzhou 510640, China
2
Department of Natural Resources and Environmental Sciences, University of Illinois at Urbana-Champaign, Urbana, IL 61801, USA
*
Authors to whom correspondence should be addressed.
Agriculture 2021, 11(6), 523; https://doi.org/10.3390/agriculture11060523
Submission received: 27 April 2021 / Revised: 29 May 2021 / Accepted: 31 May 2021 / Published: 4 June 2021
(This article belongs to the Special Issue Fertilizer Use, Soil Health and Agricultural Sustainability)

Abstract

:
While the effects of carbon on soil nitrogen (N) cycle have been extensively studied, it is not clearly understood how co-existing macronutrients, such as phosphorus (P), affect the N cycle in agroecosystems. In this study, P amendment effects on nitrification in a fertile agricultural soil were investigated under a typical N-P amendment rate. In a laboratory incubation study, soils were amended with urea, monopotassium phosphate and a mixture of urea and monopotassium phosphate at the same rate. In soils that received no amendments (control), P only, urea only, and urea plus P amendment, nitrification occurred within the first five days, with an average net nitrification rate of 5.30, 5.77, 16.66 and 9.00 mg N kg−1d−1, respectively. Interestingly, nitrification in urea-treated soils was retarded by P addition where a N:P ratio seemed to be a key factor impeding nitrification. This was also supported by the response of ammonia-oxidizing bacteria (AOB), which was more sensitive to P addition than ammonia-oxidizing archaea (AOA). The outcome of this study showed that application of P fertilizer suppressed the nitrification process in urea amended soil, suggesting that a synergistic aspect of N and P nutrient management should be further explored to retard N losses from agricultural systems.

1. Introduction

Nitrification is an important biological oxidation process in the soil N cycle. Ammonia monooxygenase encoded by amoA gene serves as a crucial enzyme to catalyze the reaction of ammonia oxidation [1,2,3], which is the first rate-limiting step in nitrification. Both ammonia oxidizing bacteria (AOB) and ammonia oxidizing archaea (AOA) bearing with ammonia monooxygenase are identified to drive the conversion of ammonia to nitrite [4,5]. Previous studies confirmed that AOA and AOB co-exist in most agricultural soils and they respond diversely to the fluctuating habitat conditions where soil type and characteristics (e.g., pH, ammonia substrate and organic C) are important drivers in shaping the composition and the activities of two ammonia oxidizers [6,7,8,9,10]. As compared to AOB, AOA are found to be more adaptive to acidic soils with low NH3 availability and organic matters [11,12,13,14,15] and more sensitive to N form [16]. However, in contrast to AOA, AOB favored the nitrogen-rich environment [17,18,19], being more responsive to N supplementation [20,21] and more active in some neutral or alkaline soils with N amendments [22,23], as AOB made relative importance to nitrification irrespective of N source (e.g., urea or ammonium) [24,25,26]. The contrasting responses occurring between AOA and AOB may be attributed to their different physiology and metabolic pathways as AOA ecotypes contain urease-encoding genes and the strong affinity of AOA on ammonia facilitates its adaptation to harsh environments, such as low pH and ammonium concentration, high temperature and salinity [27].
In ecosystems, the activities and metabolisms of these soil organisms are closely related to the availability of macronutrients such as P [28,29,30]. Chen et al. (2016) [31] reported that AOB activity was stimulated in a P limited acidic agricultural soil when a small quantity of P (≤25 mg kg−1) was applied. Soil nitrification was also promoted with an increase in P availability in an acidic deciduous forest [32]. Similar results with P-deficit agricultural soil were also observed by Cheng et al. (2018) [33] that soil gross nitrification rate was accelerated by P amendment due to the enhancement of NH4+ substrate. It was suggested that P availability stimulates N dynamics only when P becomes the main limiting factor for organism development in N rich ecosystem [34]. He and Dijkstra (2015) [35] conducted a N cycle study in P deficient grassland soil. They showed that P addition stimulated nitrification and denitrification, leading to large N gaseous losses. Similarly, the direct influence of P on nitrous oxide (N2O) emission was also observed in a grassland soil, where P addition increased gaseous loss of N2O in P-poor soils [36]. The study of Neill et al. (2021) [37] also highlighted the effects of soil P on nitrogen transformation rates and the microbial community. However, Wang et al. (2019) [38] found that the populations of AOA and AOB in soil were increased by the simultaneous application of N and P, regardless of intrinsic soil fertility.
While the previous studies focused on P limited systems, the effect of P amendments on the N cycle in intensively managed fertile agricultural soils has not been evaluated. Since both N and P are essential elements for crop production, understanding the relationship between P availability and the N cycle is important for improving current agriculture practices. Accordingly, the effects of P fertilizer amendment on the nitrification process were studied in a fertile agricultural soil. A laboratory incubation study was conducted in soils that were amended with phosphate fertilizer, urea and urea with phosphate fertilizer. The dynamic changes of NH4+-N, NO3-N, available phosphorus, as well as the quantitative characterization of the amoA genes responsible for nitrification, were monitored.

2. Materials and Methods

2.1. Site Description and Soil Used

Surface soil samples (0–20 cm) were collected from a vegetable field (23°20′39″ N, 113°20′53.8″ E) in Guangzhou, China. The soil in the sampling field is classified as River alluvial soil, which was cultivated with leafy vegetables in a perennial pattern for more than nine years. The chemical fertilizers with a nutrient ratio of 1:1:1 in N:P2O5:K2O have been extensively adapted in the local vegetable production. Total nutrients (N+P2O5+K2O) input of the chemical fertilizers were usually at the rate of 405–472.5 kg ha−1 per crop. After collection, soil was sieved through a 2 mm-mesh after removing roots and plant residues.

2.2. Laboratory Incubation Study

The soil moisture was kept at 60% of total water-holding capacity and was pre-incubated at 25 (±2) °C in the dark for 14 days to stabilize the microbial activity.
Four treatments were arranged in the experiment, that is, control (C), urea, phosphorus (P) and a mixture of urea and P (urea + P), with six incubation periods, that is, 0, 1, 2, 3, 5, 7 and 10 days. After pre-incubation, a soil sample of 100 g was transferred into one beaker. Each treatment was repeated three times and a total of 84 experimental beakers were used at the beginning of the incubation. The application rate of 0.20 g N kg−1 soil for urea and 0.087 g P kg−1(equivalent to 0.20 g P2O5 kg−1) soil for monopotassium phosphate were used. This N:P ratio is a typical rate used by farmers for leafy vegetable production in Guangdong province, China, where the soils were collected for this study. All of the amendments were mixed thoroughly with soil in beakers. Soils without urea and monopotassium phosphate were used as the control treatment. The beakers were covered by parafilm with four small holes on the top for aeration and were then incubated at 25 (± 2) °C under dark conditions. During the incubation period, soil moisture was maintained at 60% of the water-holding capacity by replenishing the required water every two days.

2.3. Soil Analysis and Nutrient Extraction

Soil pH (soil:water = 1:2.5) was ~6.39, and organic C was ~10.70 g kg−1. Agronomic nutrient analysis indicated 177.8 mg kg−1 of available N measured by an alkaline hydrolysis diffusion method, 130.0 mg kg−1 of available P with the method of Olsen et al. (1954) [39] and 148.5 mg kg−1 of available K measured by an ammonium acetate-flame photometer method. Cation exchange capacity measured by an ammonium acetate method [40] was ~9.84 cmolc kg−1. Soil moisture was determined in an oven after drying at 105 °C for 48 h. Soil mineral N (i.e., NH4+-N and NO3-N) was extracted with 2.0 mol L−1 KCl (10:1, ratio of KCl solution to fresh soil weight) and was then measured with an Alliance-Futura II flow-injection autoanalyzer (Alliance Instruments Integral Futura, Frépillon, France). The soil net nitrification rate (NR) was calculated from the difference in NO3-N concentration between the initial and incubated samples as described by Verchot et al. (2001) [41].

2.4. DNA Extraction and Quantitative PCR (qPCR) of the amoA Genes

Soil samples were collected at days 0, 3, 7 for the analysis of AOA and AOB amoA gene abundance. Soil total DNA extraction analysis was conducted using a FastDNA™ Spin Kit for Soil (MP Biomedicals, Santa Ana, CA, USA). The quality and the purity of DNA was determined using a spectrophotometer (NanoDrop2000, Thermo Fisher Scientific, Waltham, MA, USA). A quantitative PCR (qPCR) assay was conducted with DNA extraction in triplicate for each sample using real-time, quantitative PCR (SYBRGreen-based qPCR). The archaeal amoA gene was amplified by primers Arch-amoAF (5′-STAATGGTCTGGCTTAGACG-3′) and Arch-amoAR (5′-GCGGCCATCCATCTGTATGT-3′) [42]. The primers amoA-1F (5′-GGGGTTTCTACTGGTGGT-3′) and amoA-2R (5′-CCCCTCKGSAAAGCCTTCTTC-3′) were used for ammonia-oxidizing bacteria [43]. The abundance of amoA genes of AOA and AOB were determined by qPCR (ABI7500, Applied Biosystems, Waltham, MA, USA). Each 20-μL reaction mixture contained 16.4 μL 2 × ChamQ SYBR Color qPCR Master Mix (Vazyme, Nanjing, China), 0.8 μL of 5 μM specific forward and reverse primer, 2 μL of template DNA. The fragments for AOA were amplified with an initial denaturation step at 95 °C for 5 min, followed by 40 cycles of 5 s at 95 °C, 30 s at 55 °C and 40 s at 72 °C for the collection of fluorescence data. The same procedures were performed on the fragment amplification of AOB with a little modification on 40 cycles of 30 s at 58 °C. The standard curves for AOA and AOB were obtained, both using serial dilutions of 10-fold serial dilutions of a known copy numbers of the plasmid DNA. The PCR reaction runs had an efficiency of 96.55% for AOA (R2 = 0.9997) and 97.04% for AOB (R2 = 0.9988), respectively.

2.5. Statistical Analysis

Data were expressed as the means of three repeats and standard deviation. One-way ANOVA was performed using SAS9.2 software (SAS Institute Inc., Cary, NC, USA). The significant differences among the means were determined by Fisher’s least-significant difference test (LSD). It was considered statistically significant at p ≤ 0.05. The dynamic changes in NO3-N concentration with incubation time were fitted with an exponential rise to max model by using SigmaPlot 10.0 software (Systat Software Inc., San Jose, CA, USA). The model was expressed as N = N0 + Np (1− exp (-k1t)), where N was NO3-N concentration (mg kg−1) at incubation time t (day); N0 was NO3-N concentration (mg kg−1) at initial time (t = 0) of incubation (after pre-incubation); Np (mg kg−1) was potential nitrification, Np = N N 0 1 e k 1 t ; k1 (day−1) was rate constant of this kinetic model, k 1 = ln N p ln ( N p N + N 0 ) t . The potential nitrification rate Vp (mg N kg−1 day−1) was calculated from the model as Vp = Np × k1 [44]. All figures were created using OriginPro 2020 (OriginLab Corporation, Northampton, MA, USA). Correlation analyses were performed on IBM SPSS statistics versions 17.0.

3. Results

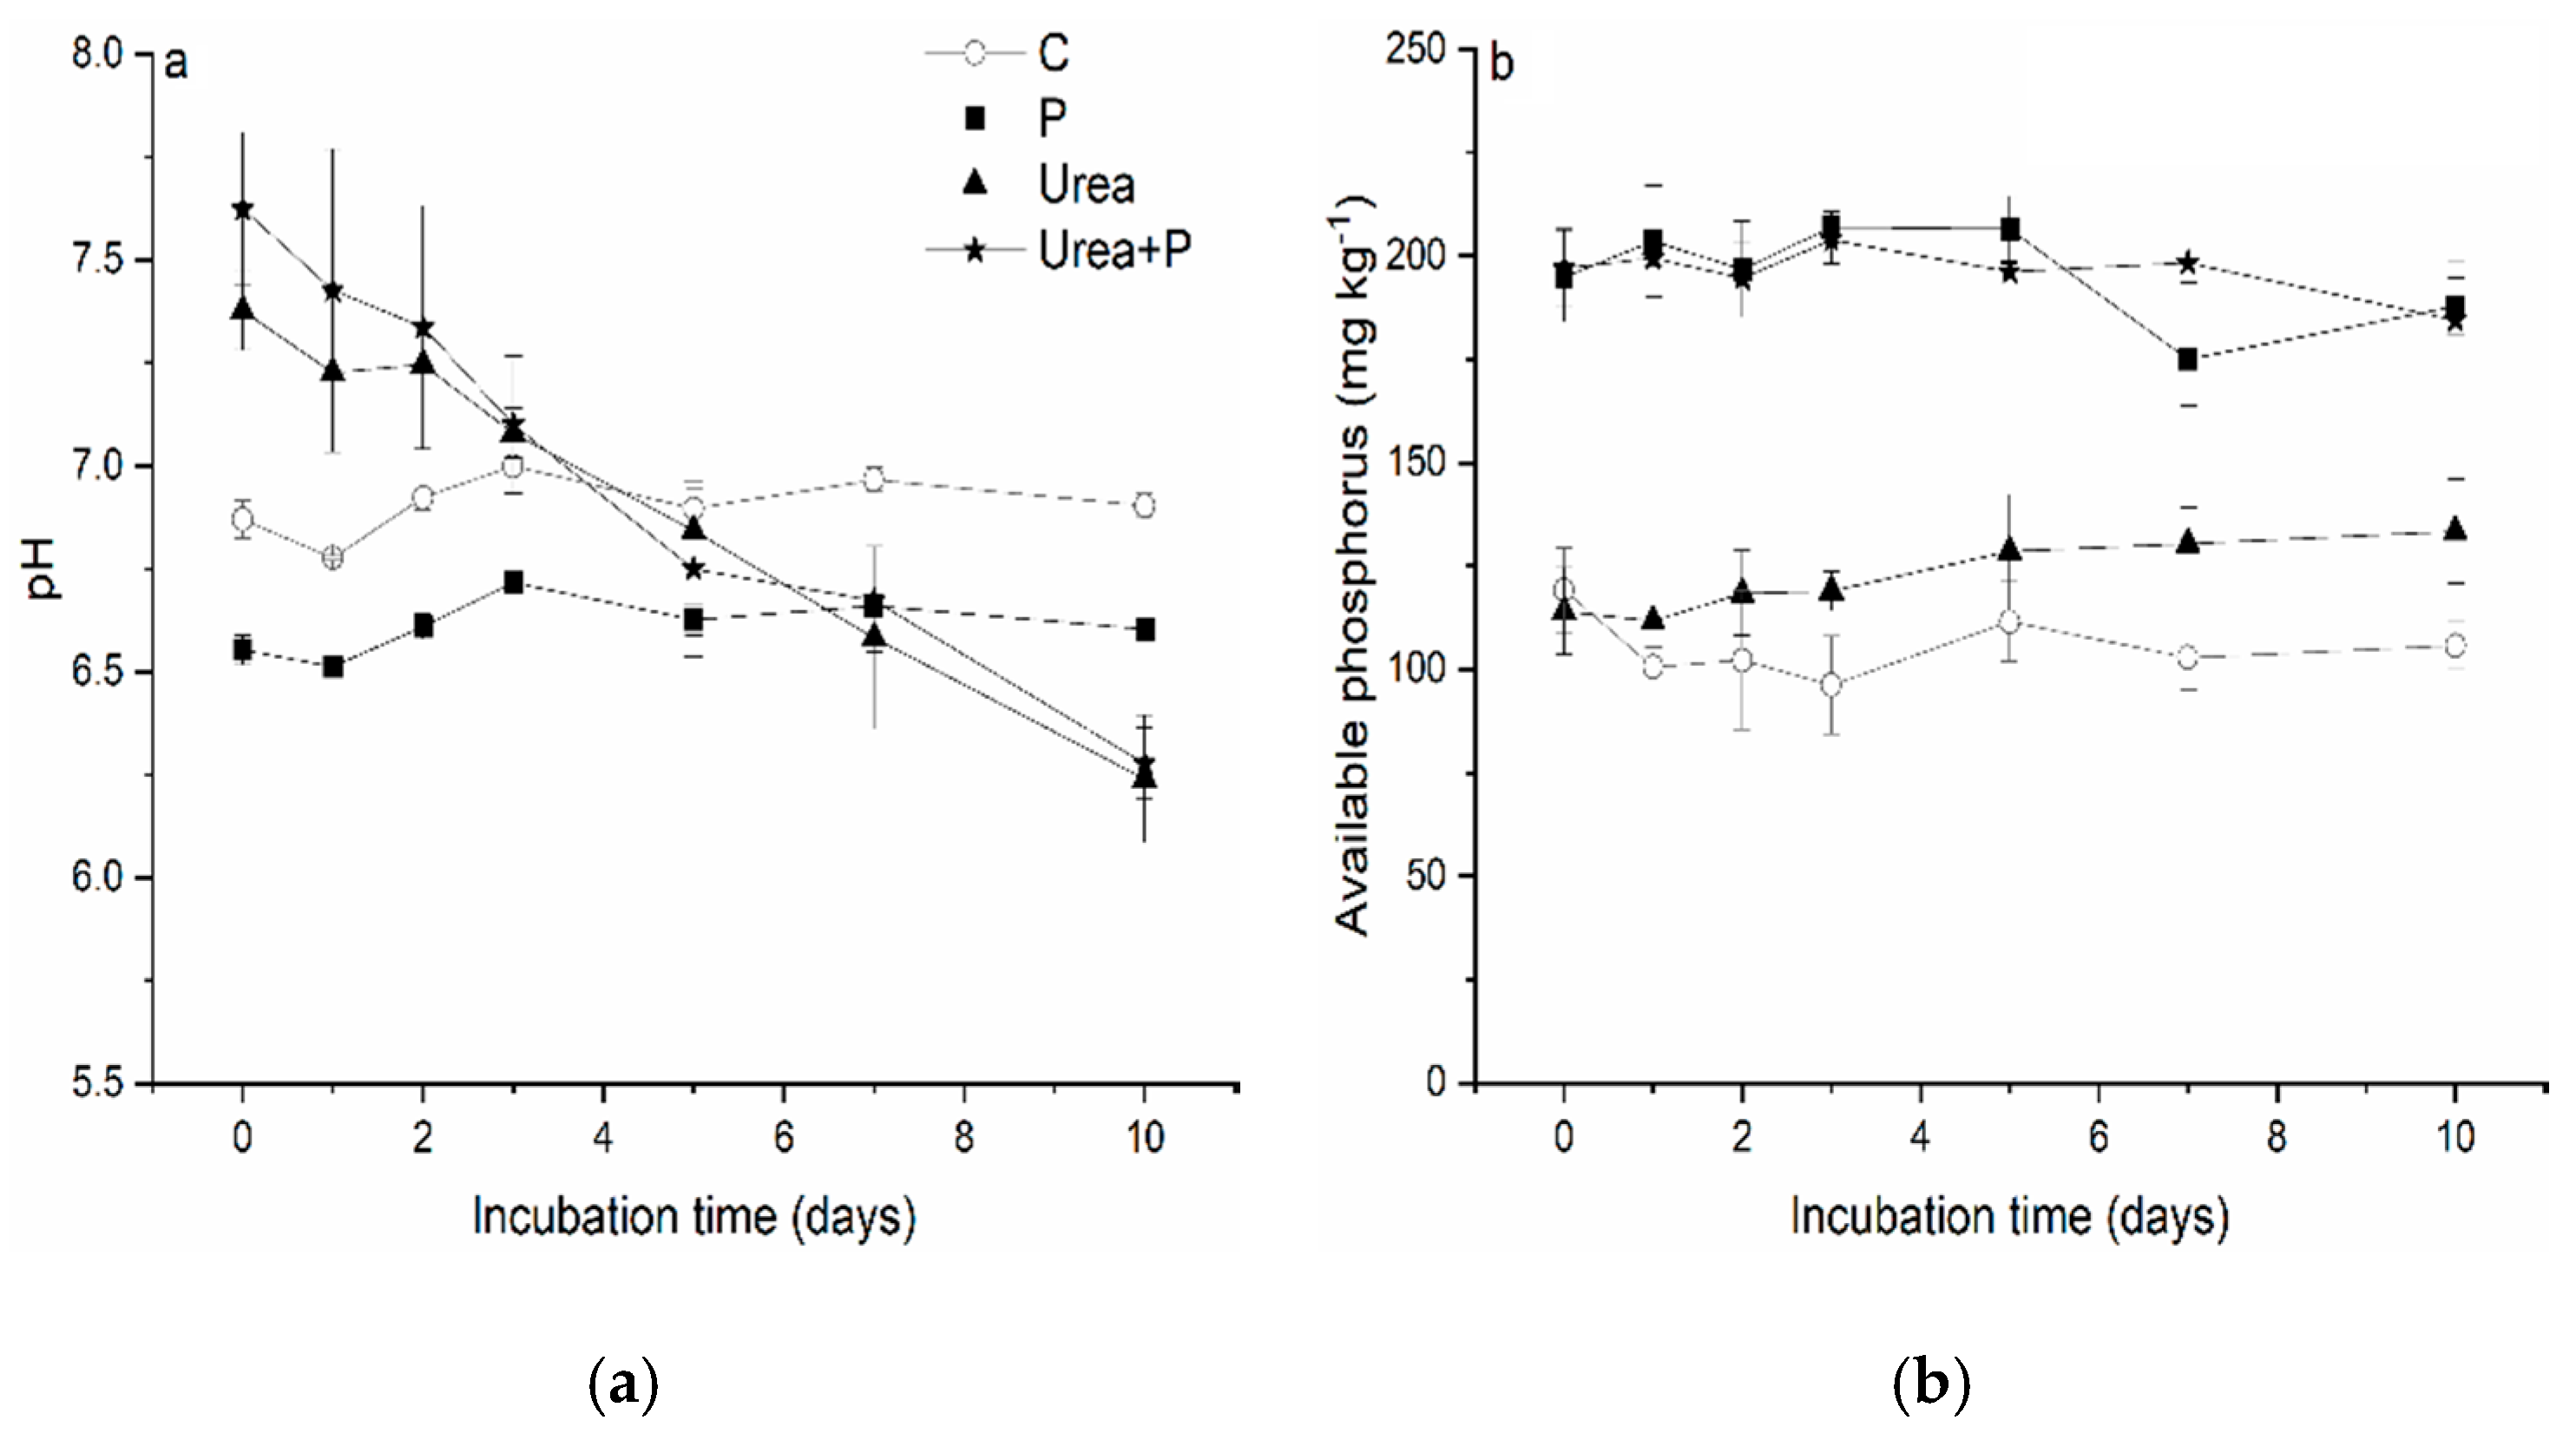
3.1. Soil pH and Available P

Soil pH in control was stable at around seven during the incubation study (Figure 1a). A slight decrease in pH (p ≤ 0.05) to ~6.6 was observed after the addition of monopotassium phosphate. This was due to exchangeable protons being displaced with potassium ion. In the urea-added soils (“urea only” or “urea plus P”), pH initially increased by ~0.5–0.7 as compared to that of the control (Figure 1a, Table S1). In these soils, pH decreased to ~6.25 at the end of the incubation. Overall, a relatively higher pH value within the first three days and a lower pH value during days five to ten both in the soil amended with urea, and with urea plus P compared to that of the control, were observed. There were no significant differences in pH between urea only and urea plus P treatments.
Available P in the control soil immediately decreased to ~100 mg kg−1 after one day and remained at ~100 mg kg−1 during the experiment (Figure 1b). The addition of P significantly increased the available P to ~180 mg kg−1 (Figure 1b). In the soil amended with urea, available P gradually increased by ~17% with increasing time (Figure 1b). For the soil amended with urea plus P treatment, available P was greater than that of urea treated soils (Figure 1b).

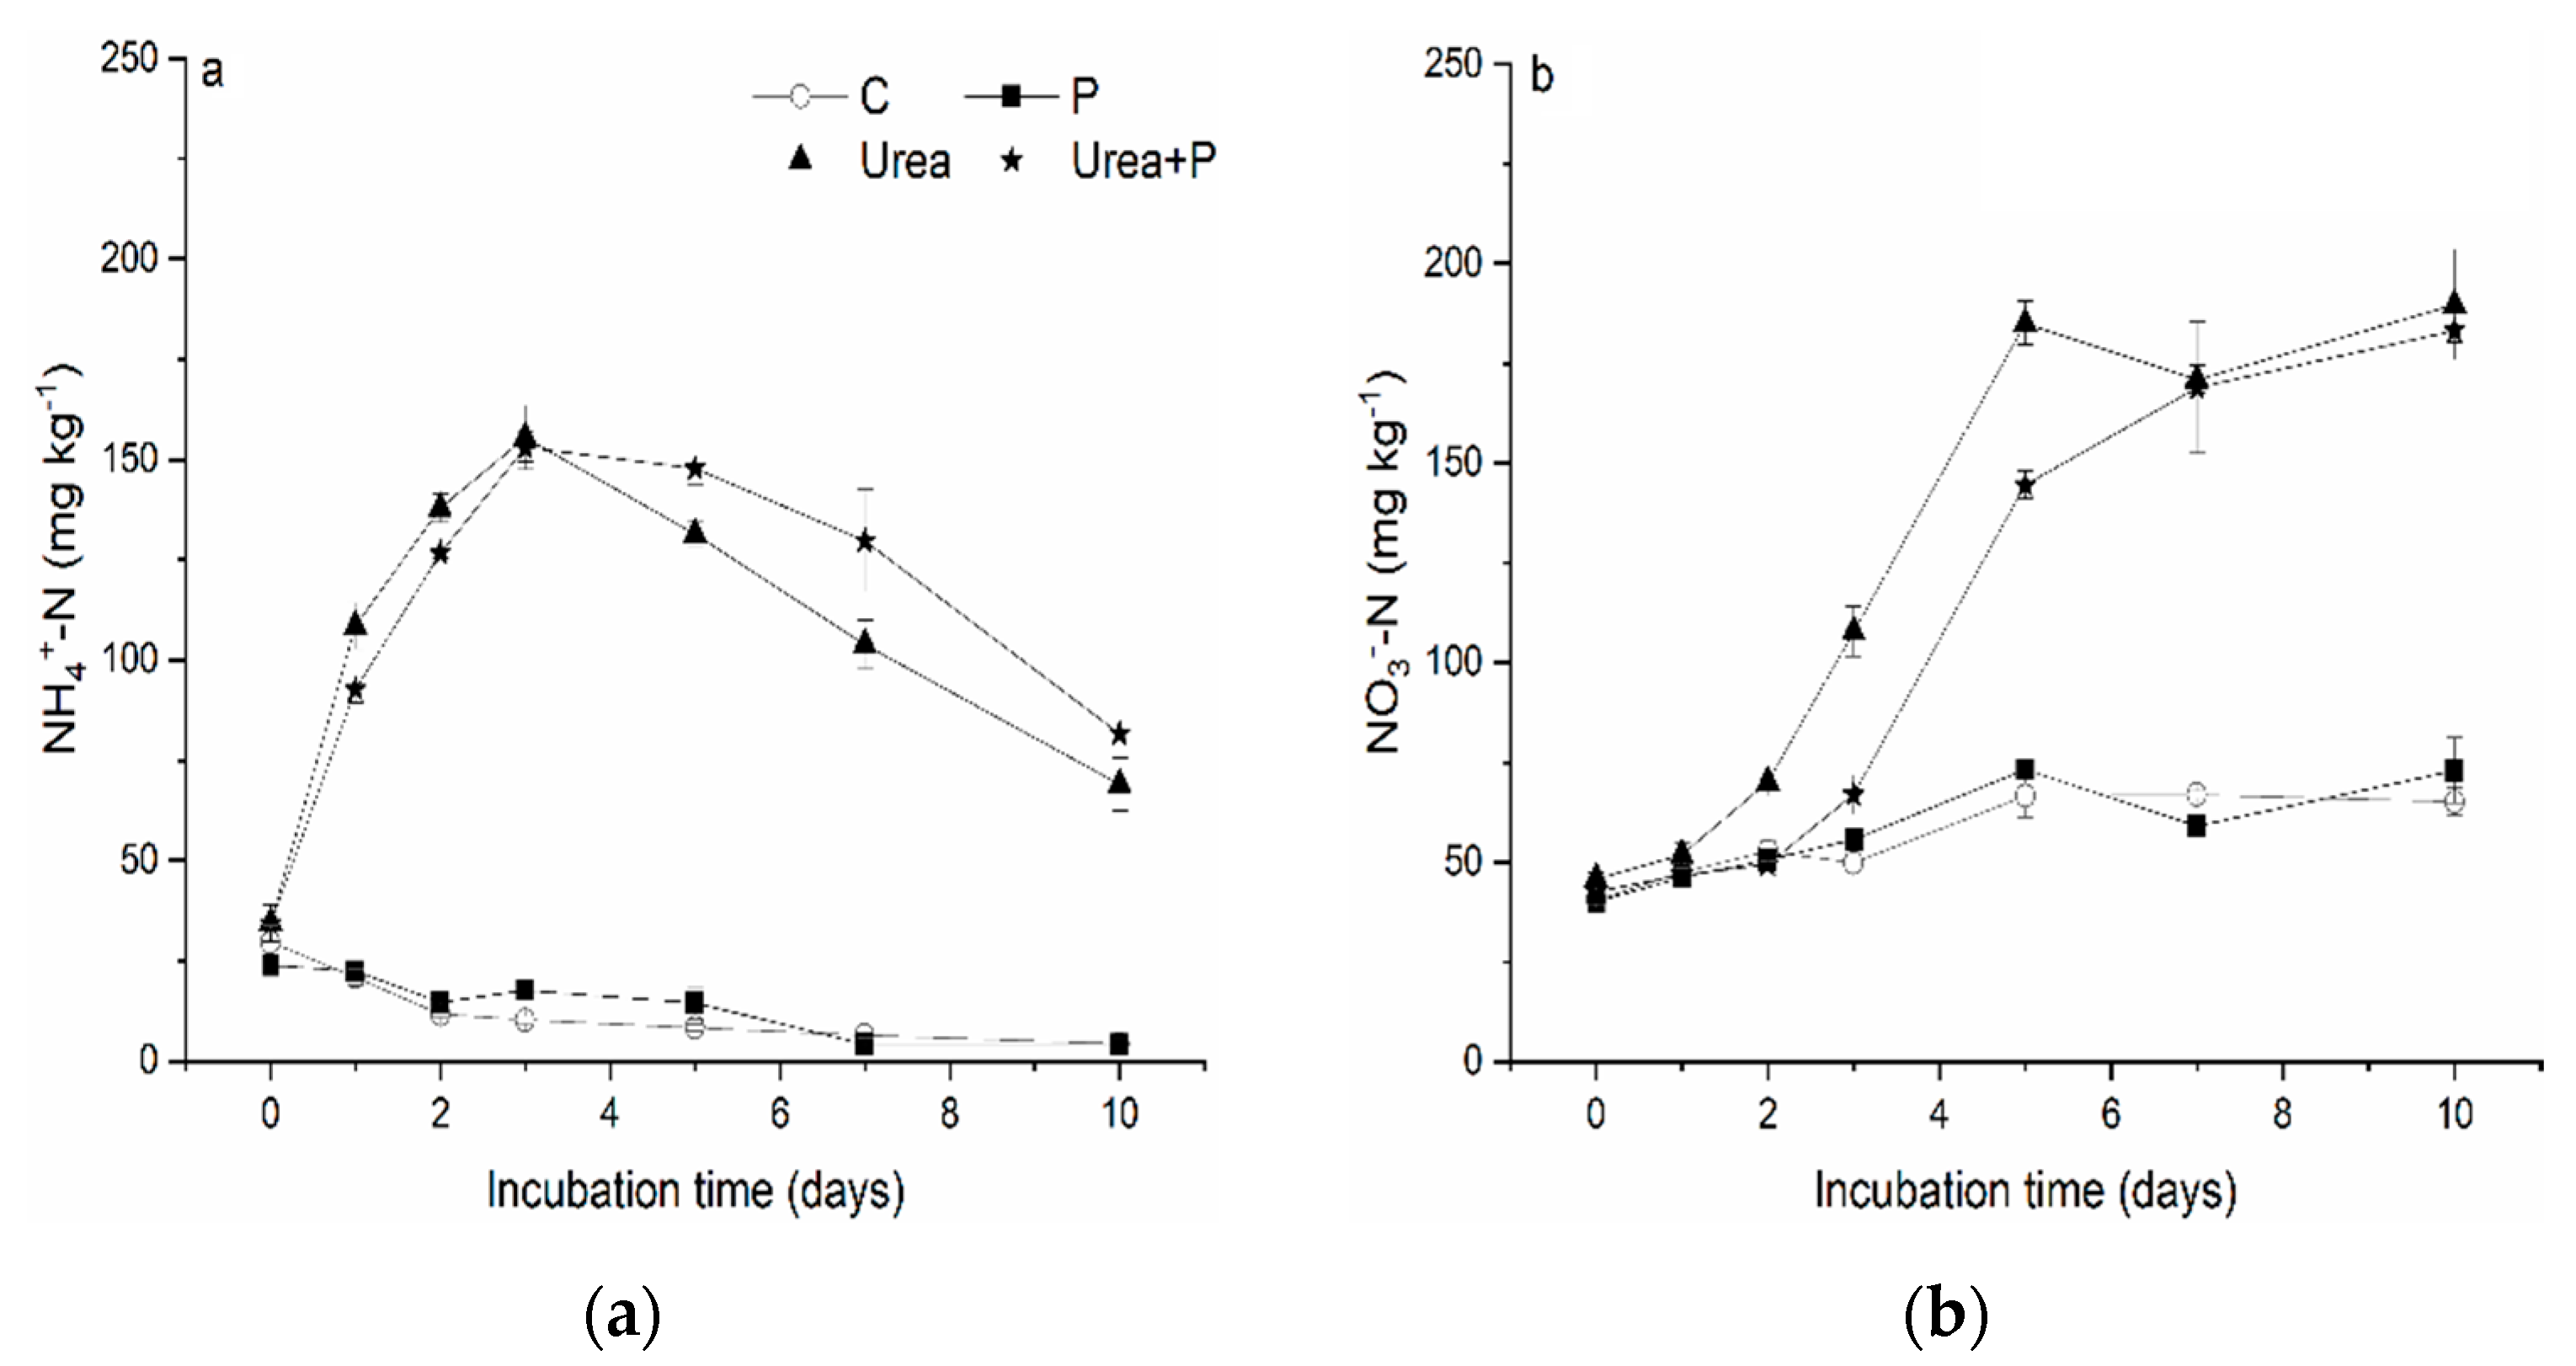
3.2. Changes in NH4+-N

NH4+-N concentration in the control and the P treated soils gradually decreased with time (Figure 2a). A significant difference (p ≤ 0.05) between the two treatments occurred at days 2, 3 and 7, respectively (Figure 2a). In the soils amended with urea only or urea plus P, NH4+-N was produced via urea hydrolysis during the first three days, and then decreased gradually with increasing time (Figure 2a). Compared to the urea treated soil, ammonium was lower in the soils with urea plus P during the first three days, and the opposite trend was observed after three days. The significant differences between the two treatments were especially observed at days 1, 2, 5 and 7, respectively (Figure 2a).

3.3. Soil Nitrification

NO3-N concentration increased with time in the control and the soil amended with P, indicating the occurrence of nitrification without any external N addition (Figure 2b). At the end of the experiment, NO3-N concentration increased by 60.3% and 81.5% in the control and P amended soil, respectively, as compared to that of the initial time (Figure 2b). However, the net nitrification rate in these two treatments showed a decreasing trend overall (Table 1). Furthermore, nitrification in both control- and P amended-soil was almost completed within five days as no significant changes in NO3-N were observed after day 5 (Figure 2b). The net nitrification rate of 5.30 ± 0.41 mg N kg−1d−1 in the control and 5.77 ± 0.40 mg N kg−1d−1 in P amended soil within the first five days were recorded (Table 1). A large difference in NO3-N concentration between the control and P treatment suggested that P addition stimulated soil nitrification at day 3 and suppressed it at day 7 (Figure 2b), respectively.
For soil amended with urea only or urea plus P, a strong nitrification process was observed (Figure 2b). NO3-N concentration was significantly lower in the soil treated with urea plus P than that in the soil amended with urea only during the first five days. Considering the NO3-N (45.87 mg kg−1) at the initial time, NO3-N in the urea treated soil increased to ~139 mg kg−1 at day 5, indicating that ~70% of added urea N (i.e., 200 mg N kg−1) was accumulated as NO3-N during this period. However, only ~51% of added urea N was nitrified in the soil amended with urea plus P at the same period (Figure 2b). The net nitrification rate within the first five days in urea and urea plus P treatment was 16.66 + 0.86 mg N kg−1d−1 and 9.00 ± 0.47 mg N kg−1 d−1, respectively (Table 1).
Using the data above, net nitrification kinetics were modeled with a first-order kinetic model. Parameters were listed in Table 2. When nitrification potential (Np) and nitrification rate (Vp) were evaluated in the control soil and the soil amended with P, there were no significant differences (Table 2). However, when these parameters of the soil amended with urea and with urea plus P were compared, the soil amended with urea plus P increased Np by 86.4% and decreased Vp by 38.7% (Table 2), suggesting P retarded nitrification. The kinetic model assessment also supports the P suppressed nitrification when soils received urea and P simultaneously.

3.4. Soil Stoichiometry of N:P Ratio

Compared to the control, the addition of P decreased the NH4+-N/AP (available P) ratio significantly throughout the incubation period (Table 3). The NH4+-N/AP in the urea plus P amendment decreased only within the first five days compared to that of urea only amendment. The addition of P decreased the soil NO3-N/AP ratio significantly in both native soil and N-added soils (Table 3). Overall, the NH4+-N/AP ratio in the control soil and the P amended soil decreased with time, whereas the ratio in soil with urea only and with urea plus P increased to the maximum level at day 3 and then decreased. In contrast, the NO3-N/AP ratio in both in C and P amendments showed increasing trends with time. However, the NO3-N/AP ratio in both urea only and urea plus P amendments increased within the first five days and then decreased (Table 3).

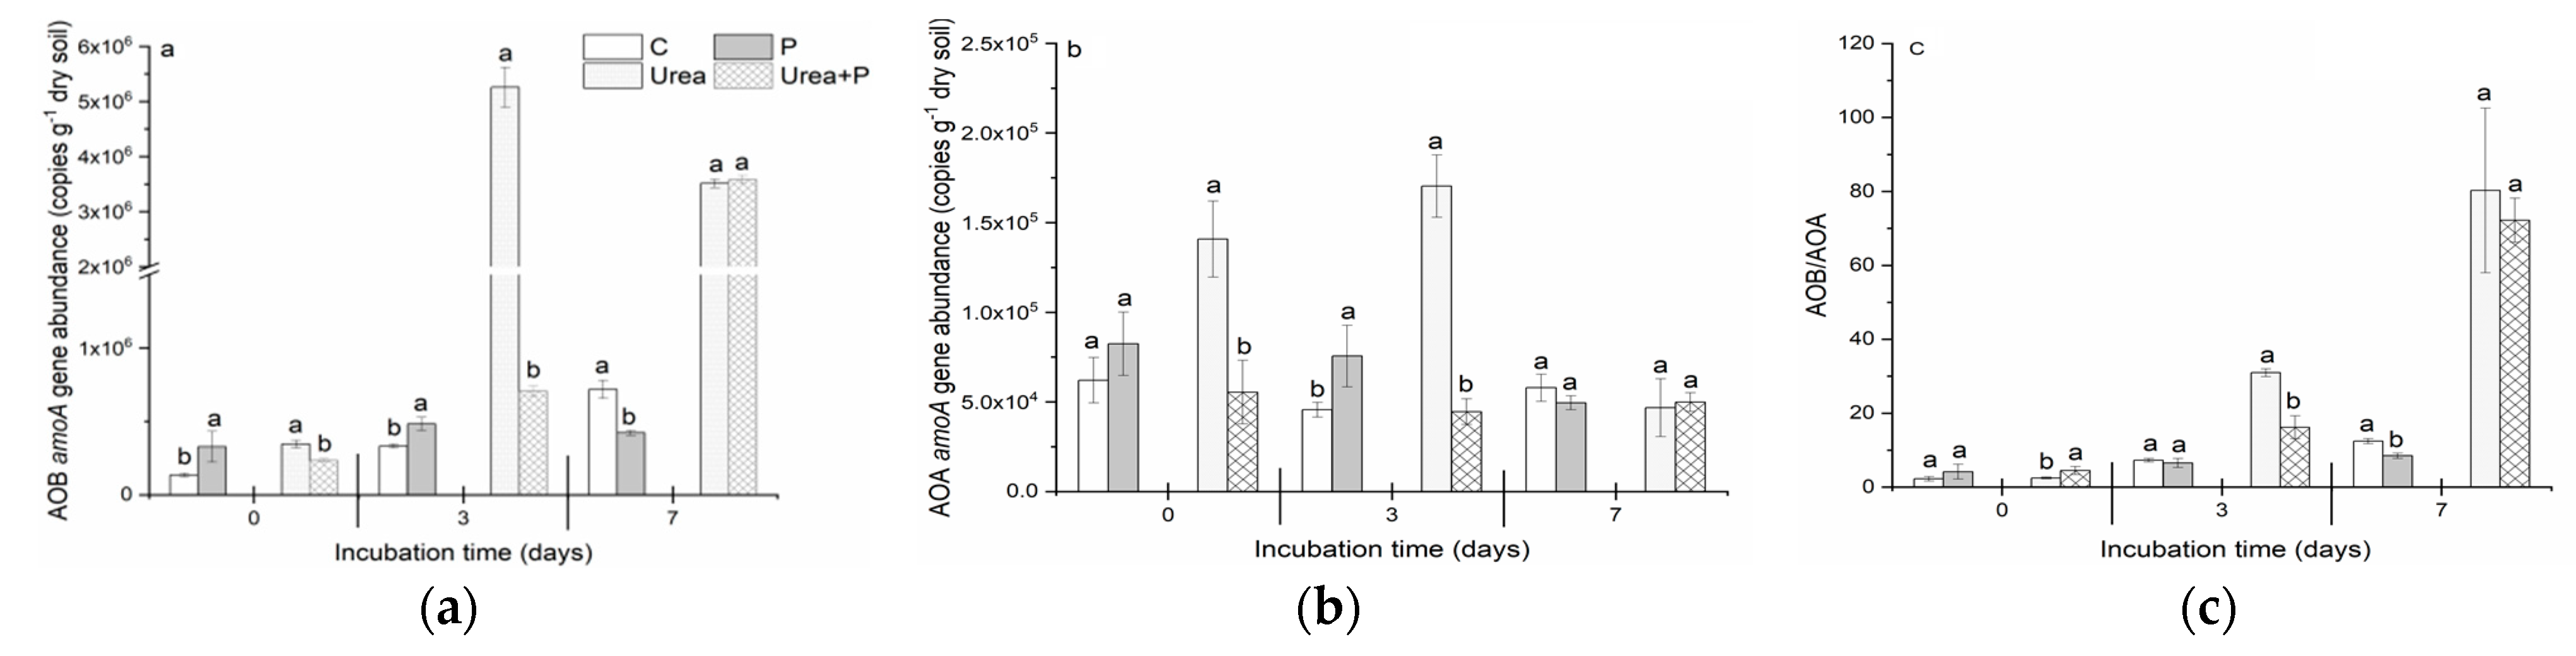
3.5. Abundances of Bacterial and Archaeal amoA Genes

Compared to the control, the abundance of bacterial amoA gene in the P treated soil increased significantly at days 0 and 3, whereas it decreased at seven days (Figure 3a). In contrast, bacterial amoA gene number decreased significantly in the soil treated with urea plus P at days 0 and 3 as compared to that of the urea only treated soil, while no significant differences were observed after seven days between these two amendments (Figure 3a).
The abundance of the archaeal amoA gene showed no response to P addition at initial time and increased significantly at day 3 as compared to that of the control (Figure 3b). In contrast, archaeal amoA gene number in the soil amended with urea plus P at days 0 and 3 decreased significantly, relative to that of urea-treated soil. At day 7, no significant differences were observed for archaeal amoA gene abundance between C and P, and between urea and urea plus P (Figure 3b).
A ratio of AOB/AOA showed no significant differences between C and P treated soil at days 0 and 3, whereas it decreased significantly in the P amended soil at day 7 as compared to that of the control (Figure 3c). In the soil amended with urea plus P, AOB/AOA ratio was significantly higher at day 0 and lower at day 3 compared to that of the urea treated soil. No significant differences for an AOB/AOA ratio between the two treatments were observed at day 7 (Figure 3c).

3.6. Correlations between Soil Ammonia-Oxidizing Microorganisms and Soil Properties

In Table 4, positive correlations between soil pH and NH4+-N (r = 0.217, p < 0.05), NH4+-N/AP (r = 0.232, p < 0.05) were observed, whereas negative correlations between pH and NO3-N (r = −0.476, p < 0.01), NO3-N/AP (r = −0.362, p < 0.05) were recorded. Soil available P was only found to be significantly correlated with NO3-N/AP negatively (r = −0.376, p < 0.01). There was a significant positive correlation between the abundance of bacterial amoA gene and NH4+-N (r = 0.763, p < 0.01), NO3-N (r = 0.831, p < 0.01), NH4+-N/AP (r = 0.870, p < 0.05), and NO3-N/AP (r = −0.822, p < 0.01) (Table 4). However, the abundance of the archaeal amoA gene was only correlated with NH4+-N/AP (r = 0.424, p < 0.05). Soil properties, such as pH and mineral N, as well as the abundance of the bacterial amoA gene, were all important factors affecting the composition of soil ammonia oxidizers expressed as AOB/AOA. The net nitrification rate in this soil was regulated positively by mineral N concentration, ammonia oxidizers’ abundance as well as the ratio of mineral N to available P at a significant level (Table 4).

4. Discussion

As observed from this study, soil pH in the control, P only, urea only and urea plus P amendments fluctuated between 6.78–7.00, 6.51–6.72, 6.24–7.38 and 6.28–7.62 (Figure 1a), respectively, which was almost in the optimum pH range for facilitating the nitrification process. Thus, the significant differences in nitrification or abundance of ammonia oxidizers between these amendments were not likely due to the changes of soil pH, which can also be supported by the correlation analysis between pH and net nitrification rate, and the abundance of bacterial and archaeal amoA gene (Figure 2 and Figure 3, Table 1 and Table 4). However, soil pH may impose indirect effects on nitrification through regulating mineral N availability, the stoichiometry of N:P as well as the composition of ammonia oxidizers in soil (Table 4).
In previous studies conducted with various P deficient soils, P addition was found to stimulate the nitrification of native N by increasing ammonia oxidizers’ activities due to the relief from their P shortage [31,33]. However, this is not the case in this study as a fertile vegetable-cultivated soil, which is enriched in available P (130.0 mg P kg−1), was used, suggesting that P was not likely a limiting factor for the ammonia oxidizer growth. Correlation analysis between an abundance of ammonia oxidizers and available P concentration also supported this speculation (Table 4). Soil nitrification is deemed to be controlled by substrate (NH3) concentration and nitrifying microorganism activities. The time-dependent kinetics of soil nitrification in four amendments fitted with the first-order model (Table 2) indicated that the substrate (NH3) was insufficient as compared to the oxidizing capacity of the ammonia oxidizers [44,45]. For the native N, responses of nitrification to the P addition were associated with the NH4+-N availability, which could affect ammonia oxidization by providing an energy source [46] (Zhang et al. 2013). In particular, an increased NH4+-N with the P addition in the native soil at day 3 was driven from the mineralized organic N, which could be stimulated by P as reported in previous studies [31,33].
With the proceeding of nitrification, NH4+-N concentration in P amendment at day 7 may decrease to a level limiting AOB growth (Figure 3a). In contrast, in the soil simultaneously amended with urea and P, mediation of P on soil nitrification can be divided into two stages (i.e., urea hydrolysis and nitrification). The detailed changes in net nitrification rate (Table 1) indicated that the suppressed nitrification induced by P was kinetically limited. In the present study, it was observed that urea hydrolysis was completed within the first three days and nitrification occurred mainly in the first five days (Figure 1, Table 1). During urea hydrolysis, exogenous P reduced soil NH4+-N availability (Figure 2a), which may be due to the inhibitory effect of P on urease activities as reported in previous studies [47,48,49,50]. The reduction in soil NH4+-N availability in response to P addition during urea hydrolysis may contribute to the decrease of nitrification rate (Figure 1, Table 1) as the urea hydrolysis and nitrification process generally coexists. However, during the period after urea hydrolysis, especially at day 5, a higher NH4+-N concentration in response to P addition was maintained in the soil amended with urea plus P (Figure 2a). This implies that the reduction of nitrification in the P treated soil may not be attributed to the NH4+-N availability directly (Figure 3). As observed from the changes in the NH4+-N/AP ratio (Table 3), it was significantly lower in the urea and P treated soil during the first five days, suggesting that NH4+-N became a main limiting factor induced by P when urea and P were added together. Wei et al. (2017) [51] previously found that P amendment changed the relative availability of N and P in fertilized soils, leading to the reduction in AOB amoA abundance due to a shift in a soil N:P ratio. Similar results were also reported in several studies where soil nitrification was meditated by P amendment through the N:P stoichiometry homeostasis [52,53,54,55,56]. They concluded that P affected nitrification in N fertilizer amended soils indirectly through the regulation of a soil NH4+-N/AP ratio. In fact, changes in N:P stoichiometry occurred in soils that received both N and P fertilizers, which negatively affected the abundance of AOB and AOA, resulting in the reduction in nitrification.
In the current study, the amoA gene in bacteria was more abundant than archaea, irrespective of the types of amendments (Figure 3), which was also observed in previous studies where AOB was dominant in neutral and alkaline soils after long-term fertilization [19,54,57,58]. Responses of AOB and AOA abundance to the P addition either in native soil or urea treated soil indicated that two ammonia oxidizers were both involved in the soil nitrification (Figure 3). A large number of studies have shown that AOA was more sensitive than AOB to different fertilization amendments in acidic soils [59,60]. However, Yang et al. (2020) [61] reported that nitrification was predominated by AOB in strongly acidic tea soil receiving ample N, whereas AOA was more important under oligotrophic conditions without external N application. In the soil used in this study, it was AOB, not AOA, that responded more sensitively to P addition. He et al. (2021) [62] found that the AOB community was significantly regulated by soil with an available phosphorus concentration. Chen et al. (2016) [31] observed that P addition showed no effects on AOA abundance of communities but induced a significant difference in AOB abundance and communities in agricultural soil. Similarly, P addition reduced bacterial amoA abundance and exerted limited impacts on AOA abundance in a paddy soil [51]. It has been demonstrated that P could exert influence on AOB abundance by affecting their growth, affinity to NH3, or their metabolic behavior [27,30,63]. The roles played by AOB and AOA in nitrification are considered to be controlled by soil pH [64] since they occupy different pH-associated niches [6,65] by altering their dominant species [66]. In our study, however, the ratio of AOB to AOA, rather than their abundance, exhibited significant correlation with soil pH. Instead, the soil NH4+-N/AP ratio seemed to be an important factor affecting the relative contributions of AOB and AOA in nitrification as the correlations between NH4+-N/AP and abundance of AOB and AOA, as well as their ratio, were all at a significant level (Table 4). The niche separation between AOB and AOA helps to explain their contrasting responses to the environmental changes as AOA ecotypes contain urease-encoding genes that possess strong affinity on ammonia and facilitating its adaptation to the harsh environment [7,27].

5. Conclusions

In conclusion, this study showed that phosphorus addition stimulated the nitrification of native N via mediating soil NH4+-N availability directly, whereas it suppressed nitrification indirectly in soil treated with urea and P simultaneously through regulating the soil NH4+-N/AP ratio associated with the abundance in AOB and AOA. Changes of N:P stoichiometry in soils treated with urea and P simultaneously were probably the key factor behind an increasing limitation of NH4+-N and then growth inhibition of ammonia oxidizers. Both AOB and AOA were involved in the nitrification of this soil, while AOB’s response was more sensitive than AOA to the P addition.
As long as the P/N fertilizer recommendation for specific crops is met, the combined application of N and P fertilizer might have potential for retarding nitrate loss from agricultural soils as P served as a nitrification regulator.

Supplementary Materials

Author Contributions

Conceptualization, J.N. and Y.A.; methodology, J.N. and S.A.; software, J.S. and R.W.; formal analysis, J.N. and J.S.; resources, J.N. and S.A.; data curation, J.N. and Y.A.; writing—original draft preparation, J.N.; writing—review and editing, Y.A. and S.A. All authors have read and agreed to the published version of the manuscript.

Funding

This research was jointly funded by the National Natural Science Foundation of China (31701996), China Scholarships Council (201908440099) and Agricultural competitive industry discipline team building project of Guangdong Academy of Agricultural Sciences (202120TD).

Institutional Review Board Statement

Not applicable.

Informed Consent Statement

Not applicable.

Data Availability Statement

Not applicable.

Conflicts of Interest

The authors declare no conflict of interest.

References

  1. Klotz, M.G.; Alzerreca, J.; Norton, J.M. A gene encoding a membrane protein exists upstream of the amoA/amoB genes in ammonia-oxidizing bacteria: A third member of the amo operon? FEMS Microbiol. Lett. 1997, 150, 65–73. [Google Scholar] [CrossRef]
  2. Kowalchuk, G.A.; Stephen, J.R. Ammonia-oxidizing bacteria: A model for molecular microbial ecology. Annu. Rev. Microbiol. 2001, 55, 485–592. [Google Scholar] [CrossRef]
  3. Li, Y.; Chapman, S.J.; Nicol, G.W.; Yao, H. Nitrification and nitrifiers in acidic soils. Soil Biol. Biochem. 2018, 116, 290–301. [Google Scholar] [CrossRef]
  4. Leininger, S.; Urich, T.; Schloter, M.; Schwark, L.; Qi, J.; Nicol, G.W.; Prosser, J.I.; Schuster, S.C.; Schleper, C. Archaea predominate among ammonia-oxidizing prokaryotes in soils. Nature 2006, 442, 806–809. [Google Scholar] [CrossRef] [PubMed]
  5. Deboer, W.; Gunnewiek, P.; Veenhuis, M.; Bock, E.; Laanbroek, H.J. Nitrification at low pH by aggregated chemolithotrophic bacteria. Appl. Environ. Microbiol. 1991, 57, 3600–3604. [Google Scholar] [CrossRef] [PubMed]
  6. He, J.Z.; Hu, H.W.; Zhang, L.M. Current insights into the autotrophic thaumarchaeal ammonia oxidation in acidic soils. Soil Biol. Biochem. 2012, 55, 146–154. [Google Scholar] [CrossRef]
  7. Prosser, J.I.; Nicol, G.W. Archaeal and bacterial ammonia-oxidisers in soil: The quest for niche specialisation and differentiation. Trends Microbiol. 2012, 20, 523–531. [Google Scholar] [CrossRef]
  8. Qin, H.; Yuan, H.; Zhang, H.; Zhu, Y.; Yin, C.; Tan, Z.; Wu, J.; Wei, W. Ammonia-oxidizing archaea are more important than ammonia-oxidizing bacteria in nitrification and NO3-N loss in acidic soil of sloped land. Biol. Fertil. Soils 2013, 49, 767–776. [Google Scholar] [CrossRef]
  9. Wang, X.; Han, C.; Zhang, J.; Huang, Q.; Deng, H.; Deng, Y.; Zhong, W. Long-term fertilization effects on active ammonia oxidizers in an acidic upland soil in China. Soil Biol. Biochem. 2015, 84, 28–37. [Google Scholar] [CrossRef]
  10. Isobea, K.; Ikutani, J.; Fang, Y.; Yoh, M.; Mo, J.; Suwa, Y.; Yoshida, M.; Senoo, K.; Otsuka, S.; Koba, K. Highly abundant acidophilic ammonia-oxidizing archaea causes high rates of nitrification and nitrate leaching in nitrogen-saturated forest soils. Soil Biol. Biochem. 2018, 122, 220–227. [Google Scholar] [CrossRef]
  11. Levičnik-Höfferle, Š.; Nicol, G.W.; Ausec, L.; Mandic-Mulec, I.; Prosser, J.I. Stimulation of thaumarchaeal ammonia oxidation by ammonia derived from organic nitrogen but not added inorganic nitrogen. FEMS Microbiol. Ecol. 2012, 80, 114–123. [Google Scholar] [CrossRef]
  12. Wu, Y.; Conrad, R. Ammonia oxidation-dependent growth of group I.1b Thaumarchaeota in acidic red soil microcosms. FEMS Microbiol. Ecol. 2014, 89, 127–134. [Google Scholar] [CrossRef]
  13. Stopnisek, N.; Gubry-Rangin, C.; Hofferle, S.; Nicol, G.W.; Mandic-Mulec, I.; Prosser, J.I. Thaumarchaeal ammonia oxidation in an acidic forest peat soil is not influenced by ammonium amendment. Appl. Environ. Microbiol. 2010, 76, 7626–7634. [Google Scholar] [CrossRef]
  14. Hu, B.L.; Liu, S.; Wang, W.; Shen, L.D.; Lou, L.P.; Liu, W.P.; Tian, G.M.; Xu, X.Y.; Zheng, P. pH-dominated niche segregation of ammonia-oxidising microorganisms in Chinese agricultural soils. FEMS Microbiol. Ecol. 2014, 90, 290–299. [Google Scholar]
  15. Che, J.; Zhao, X.Q.; Zhou, X.; Jia, Z.J.; Shen, R.F. High pH-enhanced soil nitrification was associated with ammonia-oxidizing bacteria rather than archaea in acidic soils. Appl. Soil Ecol. 2015, 85, 21–29. [Google Scholar] [CrossRef]
  16. Martens-Habbena, W.M.; Berube, P.; Urakawa, H.; de la Torre, J.R.; Stahl, D.A. Ammonia oxidation kinetics determine niche separation of nitrifying Archaea and Bacteria. Nature 2009, 461, 976–979. [Google Scholar] [CrossRef]
  17. Taylor, A.E.; Zeglin, L.H.; Dooley, S.; Myrold, D.D.; Bottomley, P.J. Evidence for different contributions of archaea and bacteria to the ammonia-oxidizing potential of diverse Oregon soils. Appl. Environ. Microbiol. 2010, 76, 7691–7698. [Google Scholar] [CrossRef] [PubMed]
  18. Di, H.J.; Cameron, K.C.; Shen, J.P.; Winefield, C.S.; O’Callaghan, M.; Bowatte, S.; He, J.Z. Nitrification driven by bacteria and not archaea in nitrogen-rich grassland soils. Nat. Geosci. 2009, 2, 621–624. [Google Scholar] [CrossRef]
  19. Jia, Z.; Conrad, R. Bacteria rather than Archaea dominate microbial ammonia oxidation in an agricultural soil. Environ. Microbiol. 2009, 11, 1658–1671. [Google Scholar] [CrossRef] [PubMed]
  20. Ai, C.; Liang, G.; Sun, J.; Wang, X.; He, P.; Zhou, W. Different roles of rhizosphere effect and long-term fertilization in the activity and community structure of ammonia oxidizers in a calcareous fluvo-aquic soil. Soil Biol. Biochem. 2013, 57, 30–42. [Google Scholar] [CrossRef]
  21. Xia, W.; Zhang, C.; Zeng, X.; Feng, Y.; Weng, J.; Lin, X.; Zhu, J.; Xiong, Z.; Xu, J.; Cai, Z.; et al. Autotrophic growth of nitrifying community in an agricultural soil. ISME J. 2011, 5, 1226–1236. [Google Scholar] [CrossRef] [PubMed]
  22. Chu, H.; Fujii, T.; Morimoto, S.; Lin, X.; Yagi, K.; Hu, J.; Zhang, J. Community structure of ammonia-oxidizing bacteria under long-term application of mineral fertilizer and organic manure in a sandy loam soil. Appl. Environ. Microbiol. 2007, 73, 485–491. [Google Scholar] [CrossRef]
  23. Wu, Y.; Lu, L.; Wang, B.; Lin, X.; Zhu, J.; Cai, Z.; Yan, X.; Jia, Z. Long-term field fertilization significantly alters community structure of Ammonia-oxidizing Bacteria rather than Archaea in a Paddy soil. Soil Sci. Soc. Am. J. 2011, 75, 1431–1439. [Google Scholar] [CrossRef]
  24. Tzanakakis, V.A.; Paranychianakis, N.V. Divergent response of ammonia oxidizers to various amino acids. Appl. Soil Ecol. 2017, 114, 45–51. [Google Scholar] [CrossRef]
  25. Ouyang, Y.; Norton, J.M.; Stark, J.M.; Reeve, J.R.; Habteselassie, M.Y. Ammonia-oxidizing bacteria are more responsive than archaea to nitrogen source in an agricultural soil. Soil Biol. Biochem. 2016, 96, 4–15. [Google Scholar] [CrossRef]
  26. Di, H.J.; Cameron, K.C.; Shen, J.-P.; Winefield, C.S.; O’Callaghan, M.; Bowatte, S.; He, J.-Z. Ammonia-oxidizing bacteria and archaea grow under contrasting soil nitrogen conditions. FEMS Microbiol. Ecol. 2010, 72, 386–394. [Google Scholar] [CrossRef]
  27. Erguder, T.H.; Boon, N.; Wittebolle, L.; Marzorati, M.; Verstraete, W. Environmental factors shaping the ecological niches of ammoniaoxidizing archaea. FEMS Microbiol Rev. 2009, 33, 855–869. [Google Scholar] [CrossRef] [PubMed]
  28. Spohn, M. Element cycling as driven by stoichiometric homeostasis of soil microorganisms. Basic Appl. Ecol. 2016, 17, 471–478. [Google Scholar] [CrossRef]
  29. Sardans, J.; Rivas-Ubach, A.; Penuelas, J. The C:N:P stoichiometry of organisms and ecosystems in a changing world: A review and perspectives. Perspect. Plant Ecol. Evol. Syst. 2012, 14, 33–47. [Google Scholar] [CrossRef]
  30. Tang, Y.; Zhang, X.; Li, D.; Wang, H.; Chen, F.; Fu, X.; Fang, X.; Sun, X.; Yu, G. Impacts of nitrogen and phosphorus additions on the abundance and community structure of ammonia oxidizers and denitrifying bacteria in Chinese fir plantations. Soil Biol. Biochem. 2016, 103, 284–293. [Google Scholar] [CrossRef]
  31. Chen, Y.; Sun, T.T.; Qian, H.Y.; Fan, J.B.; He, Y.Q.; Sun, B. Nitrogen mineralization as a result of phosphorus supplementation in long-term phosphate deficient soil. Appl. Soil Ecol. 2016, 106, 24–32. [Google Scholar] [CrossRef]
  32. DeForest, J.L.; Otuya, R.K. Soil nitrification increases with elevated phosphorus or soil pH in an acidic mixed mesophytic deciduous forest. Soil Biol. Biochem. 2020, 142, 107716. [Google Scholar] [CrossRef]
  33. Cheng, Y.; Wang, J.; Sun, N.; Xu, M.; Zhang, J.; Cai, Z.; Wang, S. Phosphorus addition enhances gross microbial N cycling in phosphorus-poor soils: A 15N study from two long-term fertilization experiments. Biol. Fertil. Soil 2018, 54, 783–789. [Google Scholar] [CrossRef]
  34. Chen, H.; Zhang, W.; Gurmesa, G.A.; Zhu, X.; Li, D.; Mo, J. Phosphorus addition affects soil nitrogen dynamics in a nitrogen-saturated and two nitrogen-limited forests. Eur. J. Soil Biol. 2017, 68, 472–479. [Google Scholar] [CrossRef]
  35. He, M.; Dijkstra, F.A. Phosphorus addition enhances loss of nitrogen in a phosphorus-poor soil. Soil Biol. Biochem. 2015, 82, 99–106. [Google Scholar] [CrossRef]
  36. Mehnaz, K.R.; Dijkstra, F.A. Denitrification and associated N2O emissions are limited by phosphorus availability in a grassland soil. Geoderma 2016, 284, 34–41. [Google Scholar] [CrossRef]
  37. O’Neill, R.M.; Krol, D.J.; Wall, D.; Lanigan, G.J.; Renou-Wilson, F.; Richards, K.G.; Jansen-Willems, A.B.; Müller, C. Assessing the impact of long-term soil phosphorus on N-transformation pathways using 15N tracing. Soil Biol. Biochem. 2021, 152, 108066. [Google Scholar] [CrossRef]
  38. Wang, Y.; Ji, H.; Wang, R.; Guo, S. Responses of nitrification and denitrification to nitrogen and phosphorus fertilization: Does the intrinsic soil fertility matter? Plant Soil 2019, 440, 443–456. [Google Scholar] [CrossRef]
  39. Olsen, S.R.; Cole, C.V.; Watanabe, F.S.; Dean, L. Estimation of Available Phosphorus in Soils by Extraction with Sodium Bicarbonate; USDA Circular 939; US Government Printing Office: Washington, DC, USA, 1954.
  40. Lu, R.K. Methods of Agricultural Chemical Analysis of Soil; China Science and Technology Press: Beijing, China, 2000. [Google Scholar]
  41. Verchot, L.V.; Holmes, Z.; Mulon, L.; Groffman, P.M.; Lovett, G.M. Gross vs net rates of N mineralization and nitrification as indicators of functional differences between forest types. Soil Biol. Biochem. 2001, 33, 1889–1901. [Google Scholar] [CrossRef]
  42. Francis, C.A.; Roberts, K.J.; Beman, J.M.; Santoro, A.E.; Oakley, B.B. Ubiquity and diversity of ammonia-oxidizing archaea in water columns and sediments of the ocean. Proc. Natl. Acad. Sci. USA 2005, 102, 14683–14688. [Google Scholar] [CrossRef] [PubMed]
  43. Horz, H.P.; Barbrook, A.; Field, C.B.; Bohannan, B.J.M. Ammonia-oxidizing bacteria respond to multifactorial global change. Proc. Natl. Acad. Sci. USA 2004, 101, 15136–15141. [Google Scholar] [CrossRef]
  44. Jiang, X.; Shi, X.; Liu, W.; Wright, A. Kinetics of net nitrification associated with soil aggregates under conventional and no-tillage in a subtropical rice soil. Plant Soil 2011, 347, 305–312. [Google Scholar] [CrossRef]
  45. Xin, X.; Jiang, X.; Su, J.; Yan, X.; Ni, J.; Faeflen, S.J.; Huang, X.; Wright, A.L. Manganese oxide affects nitrification and ammonia oxidizers in subtropical and temperate acid forest soils. Catena 2016, 137, 24–30. [Google Scholar] [CrossRef]
  46. Zhang, X.; Liu, W.; Schloter, M.; Zhang, G.; Chen, Q.; Huang, J.; Li, L.; Elser, J.J.; Han, X. Response of the abundance of key soil microbial nitrogen-cycling genes to multi-factorial global changes. PLoS ONE 2013, 8, e76500. [Google Scholar] [CrossRef]
  47. Benini, S.; Rypniewski, W.R.; Wilson, K.S.; Ciurli, S.; Mangani, S. Structure-based rationalization of urease inhibition by phosphate: Novel insights into the enzyme mechanisms. J. Biol. Inorg. Chem. 2001, 6, 778–790. [Google Scholar] [CrossRef] [PubMed]
  48. Krajewska, B.; Zaborska, W. The effect of phosphate buffer in the range of pH 5.80-8.07 on jack bean urease activity. J. Mol. Catal. B Enzym. 1999, 6, 75–81. [Google Scholar] [CrossRef]
  49. Liu, G.; Zhang, X.; Wang, X.; Shao, H.; Yang, J.; Wang, X. Soil enzymes as indicators of saline soil fertility under various soil amendments. Agric. Ecosyst. Environ. 2017, 237, 274–279. [Google Scholar] [CrossRef]
  50. Gao, Y.; Huang, H.; Zhao, H.; Xia, H.; Sun, M.; Li, Z.; Li, P.; Zheng, C.; Dong, H.; Liu, J. Phosphorus affects enzymatic activity and chemical properties of cotton soil. Plant Soil Environ. 2019, 65, 361–368. [Google Scholar] [CrossRef]
  51. Wei, X.; Hu, Y.; Peng, P.; Zhu, Z.; Atere, C.T.; O’Donnell, A.G.; Wu, J.; Ge, T. Effect of P stoichiometry on the abundance of nitrogen-cycle genes in phosphorus-limited paddy soil. Soil Biol. Biochem. 2017, 53, 767–776. [Google Scholar] [CrossRef]
  52. Mori, T.; Ohta, S.; Ishizuka, S.; Konda, R.; Wicaksono, A.; Heriyanto, J.; Hardjono, A. Effects of phosphorus addition on N2O and NO emissions from soils of an Acacia mangium plantation. Soil Sci. Plant Nutr. 2010, 56, 782–788. [Google Scholar] [CrossRef]
  53. Fisk, M.; Ratliff, T.; Goswami, S.; Yanai, R. Synergistic soil response to nitrogen plus phosphorus fertilization in hardwood forests. Biogeochemistry 2014, 118, 195–204. [Google Scholar] [CrossRef]
  54. Wang, F.; Li, J.; Wang, X.; Zhang, W.; Zou, B.; Neher, D.A.; Li, Z. Nitrogen and phosphorus addition impact soil N2O emission in a secondary tropical forest of south China. Sci. Rep. 2014, 4, 5615. [Google Scholar] [CrossRef] [PubMed]
  55. Zhang, L.; Huo, Y.; Guo, D.; Wang, Q.; Bao, Y.; Li, L. Effects of multi-nutrient additions on GHG fluxes in a temperate grassland of northern China. Ecosystems 2014, 17, 657–672. [Google Scholar] [CrossRef]
  56. White, J.R.; Reddy, K.R. Nitrification and denitrification rates of everglades wetland soils along a phosphorus-impacted gradient. J. Environ. Qual. 2003, 32, 2436–2443. [Google Scholar] [CrossRef]
  57. Chu, H.; Fujii, T.; Morimoto, S.; Lin, X.; Yagi, K. Population size and specific nitrification potential of soil ammonia-oxidizing bacteria under long-term fertilizer management. Soil Biol. Biochem. 2008, 40, 1960–1963. [Google Scholar] [CrossRef]
  58. Xue, C.; Penton, C.; Zhang, B.; Zhao, M.; Rothstein, D.E.; Mladenoff, D.J.; Forrester, J.A.; Shen, Q.; Tiedje, A.M. Soil fungal and bacterial responses to conversion of open land to short rotation woody biomass crops. GCB Bioenergy 2015, 8, 723–736. [Google Scholar] [CrossRef]
  59. He, J.Z.; Shen, J.P.; Zhang, L.M.; Zhu, Y.G.; Zheng, Y.M.; Xu, M.G.; Di, H.J. Quantitative analyses of the abundance and composition of ammonia-oxidizing bacteria and ammonia-oxidizing archaea of a Chinese upland red soil under long-term fertilization practices. Environ. Microbiol. 2007, 9, 2364–2374. [Google Scholar] [CrossRef] [PubMed]
  60. Chen, X.; Zhang, L.M.; Shen, J.P.; Wei, W.X.; He, J.Z. Abundance and community structure of ammonia-oxidizing archaea and bacteria in an acid paddy soil. Biol. Fertil. Soils 2011, 47, 323–331. [Google Scholar] [CrossRef]
  61. Yang, X.; Ni, K.; Shi, Y.; Yi, X.; Ji, L.; Ma, L.; Ruan, J. Heavy nitrogen application increases soil nitrification through ammoniaoxidizing bacteria rather than archaea in acidic tea (Camellia sinensis L.) plantation soil. Sci. Total Environ. 2020, 717, 137248. [Google Scholar] [CrossRef]
  62. He, X.; Li, S.; Wu, F. Responses of Ammonia-oxidizing microorganisms to intercropping systems in different seasons. Agriculture 2021, 11, 195. [Google Scholar] [CrossRef]
  63. Dong, J.; Che, R.; Jia, S.; Wang, F.; Zhang, B.; Cui, X.; Wang, S.; Wang, S. Responses of ammonia-oxidizing archaea and bacteria to nitrogen and phosphorus amendments in an alpine steppe. Eur. J. Soil Sci. 2020, 71, 94–954. [Google Scholar] [CrossRef]
  64. Prosser, J.I.; Nicol, G.W. Relative contributions of archaea and bacteria to aerobic ammonia oxidation in the environment. Environ. Microbiol. 2008, 10, 2931–2941. [Google Scholar] [CrossRef] [PubMed]
  65. Nicol, G.W.; Leininger, S.; Schleper, C.; Prosser, J.I. The influence of soil pH on the diversity, abundance and transcriptional activity of ammonia oxidizing archaea and bacteria. Environ. Microbiol. 2008, 10, 2966–2978. [Google Scholar] [CrossRef]
  66. Song, H.; Che, Z.; Cao, W.; Huang, T.; Wang, J.; Dong, Z. Changing roles of ammonia-oxidizing bacteria and archaea in a continuously acidifying soil caused by over-fertilization with nitrogen. Environ. Sci. Pollut. Res. 2016, 23, 11964–11974. [Google Scholar] [CrossRef] [PubMed]
Figure 1. pH (a) and available phosphorus (b) in soil amended with and without urea, P, urea + P during the incubation study. Legends correspond to the amendment of urea N (urea, 0.20 g N kg−1 soil), monopotassium phosphate (P, 0.087 g P kg−1 soil), urea N and monopotassium phosphate (urea + P, 0.20 g N kg−1 soil + 0.087 g P kg−1 soil). The soil without N and P addition was used as the control (C, control). Three soil samples in each treatment were taken after 0, 1, 2, 3, 5, 7 and 10 days of incubation. Data in the figure represent means ± standard deviations (n = 3).
Agriculture 11 00523 g001
Figure 2. NH4+-N (a) and NO3-N (b) in soil amended with and without urea, P, and urea + P. Legends correspond to the amendment of urea N (urea, 0.20 g N kg−1soil), monopotassium phosphate (P, 0.087 g P kg−1 soil), urea N and monopotassium phosphate (urea + P, 0.20 g N kg−1 soil + 0.087 g P kg−1 soil). The soil without N and P addition was used as the control (C, control). Three soil samples in each treatment were taken after 0, 1, 2, 3, 5, 7 and 10 days of incubation. Data in the figure represent means ± standard deviations (n = 3).
Agriculture 11 00523 g002
Figure 3. Changes of amoA gene abundance of AOB (a), AOA (b) and ratio of AOB to AOA (c) in soil amended with and without urea, P, and urea + P during incubation period. Legends correspond to the amendment of urea N (urea, 0.20 g N kg−1 soil), monopotassium phosphate (P, 0.087 g P kg−1 soil), urea N and monopotassium phosphate (urea + P, 0.20 g N kg−1 soil + 0.087 g P kg−1 soil). The soil without nitrogen and phosphorus addition was used as the control (C, control). Three soil samples in each treatment were taken after 0, 3, 7 days of incubation. Data in the figure represent means ± standard deviations (n = 3). Different letters on the column between the treatment of C and P, Urea and Urea + P at the same sampling period indicate statistical difference according to Fisher’s least-significant difference test (p ≤ 0.05).
Agriculture 11 00523 g003
Table 1. Net nitrification rate in soil amended with Urea, P, Urea + P and the control during 10 days of incubation.
TreatmentsNO3-N (mg kg−1d−1) at Different Incubation Time (Days)
1235710
C6.84 ± 1.01 a6.07 ± 1.30 a3.08 ± 1.35 b5.20 ± 1.12 a3.75 ± 0.13 a2.45 ± 0.35 a
P6.05 ± 1.28 a5.21 ± 0.46 a5.18 ± 0.55 a6.63 ± 0.20 a2.70 ± 0.29 b3.28 ± 0.82 a
Urea6.04 ± 2.86 a12.12 ± 1.72 a20.63 ± 2.06 a27.84 ± 1.09 a17.86 ±0.50 a14.39 ± 1.37 a
Urea + P4.15 ± 0.81 a3.38 ± 0.24 b8.10 ± 1.63 b20.38 ± 0.70 b18.03 ± 2.35 a14.05 ± 0.30 a
Net nitrification rate in soils treated with urea (urea, 0.20 g N kg1 soil), monopotassium phosphate (P, 0.087 g P kg−1 soil), urea plus monopotassium phosphate (urea + P, 0.20 g N kg−1 soil + 0.087 g P kg−1 soil) and without any fertilizers (C, control). Three soil samples in each treatment were taken after 0, 1, 2, 3, 5, 7 and 10 days of incubation. Data in the table represent means ± standard deviations (n = 3). Data between C and P, Urea and Urea + P followed by different letters in the same column are statistically different according to Fisher’s least-significant difference test (p ≤ 0.05), i.e., a and b indicated the significant differences between two treatments, whereas a and a indicated no significant differences between two treatments.
Table 2. Parameters of first-order kinetics model fitting soil NO3-N accumulation during 10 days of incubation.
TreatmentsNp (mg N kg−1)k1 (day−1)R2Vp (mg N kg−1 day−1)
C40.15 ± 0.850.26 ± 0.030.897.63 ± 0.83
P39.41 ± 2.160.23 ± 0.170.778.17 ± 3.35
Urea203.8 ± 18.780.18 ± 0.020.9136.18 ± 1.22
Urea + P379.91 ± 19.490.06 ± 0.010.9222.19 ± 1.92
Legends correspond to the amendment of urea N (Urea, 0.20 g N kg−1 soil), monopotassium phosphate (P, 0.087 g P kg−1 soil), urea plus monopotassium phosphate (Urea + P, 0.20 g N kg−1 soil + 0.087 g P kg−1 soil) and without any fertilizers (C, control). Three soil samples in each treatment were taken after 0, 1, 2, 3, 5, 7 and 10 days of incubation. Data in the table represent means ± standard deviations (n = 3). Mean values of three repeats were used for fitting first-order kinetics model. Np, potential nitrification; k1, the rate constant of the model; Vp, potential nitrification rate calculated from first-order kinetics as Vp = k1Np.
Table 3. Changes in the labile N:P ratio in soils during the incubation study.
ItemsTreatmentsIncubation Time (Days)
01235710
NH4+-N/APC0.25 ± 0.04 a0.21 ± 0.02 a0.12 ± 0.04 a0.11 ± 0.01 a0.07 ± 0.01 a0.06 ± 0.01 a0.04 ± 0.01 a
P0.12 ± 0.01 b0.11 ± 0.01 b0.07 ± 0.01 b0.09 ± 0.01 b0.07 ± 0.02 a0.02 ± 0.01 b0.02 ± 0.01 b
Urea0.30 ± 0.06 a0.98 ± 0.12 a1.17 ± 0.10 a1.31 ± 0.04 a1.03 ± 0.10 a0.80 ± 0.09 a0.52 ± 0.13 a
Urea + P0.17 ± 0.03 b0.46 ± 0.01 b0.65 ± 0.02 b0.75 ± 0.04 b0.75 ± 0.03 b0.66 ± 0.07 a0.45 ± 0.1 1 a
NO3-N/APC0.34 ± 0.04 a0.47 ± 0.01 a0.53 ± 0.09 a0.55 ± 0.11 a0.60 ± 0.10 a0.65 ± 0.05 a0.62 ± 0.02 a
P0.23 ± 0.01 b0.23 ± 0.02 b0.24 ± 0.02 b0.26 ± 0.01 b0.36 ± 0.01 b0.39 ± 0.03 b0.39 ± 0.06 b
Urea0.40 ± 0.03 a0.47 ± 0.02 a0.59 ± 0.04 a0.91 ± 0.09 a1.45 ± 0.17 a1.32 ± 0.11 a1.43 ± 0.12 a
Urea + P0.22 ± 0.01 b0.23 ± 0.01 b0.25 ± 0.01 b0.33 ± 0.02 b0.74 ± 0.02 b0.85 ± 0.09 b1.00 ± 0.06 b
Labile N:P ratio in soils treated with urea (urea, 0.20 g N kg−1 soil), monopotassium phosphate (P, 0.087 g P kg−1 soil), urea plus monopotassium phosphate (Urea + P, 0.20 g N kg−1 soil + 0.087 g P kg−1 soil) and without any fertilizers (C, control). Three soil samples in each treatment were taken after 0, 1, 2, 3, 5, 7 and 10 days of incubation. Data in the table represent means ± standard deviations (n = 3). Data between C and P, urea and urea + P followed by different letters in the same column are statistically different according to Fisher’s least-significant difference test (p ≤ 0.05), i.e., a and b indicated the significant differences between two treatments, whereas a and a indicated no significant differences between two treatments. AP, available P.
Table 4. The correlation coefficients between ammonia-oxidizing microorganisms and soil properties.
VariablepHAPNH4+-NNO3-NAOBAOAAOB/AOANRNH4+-N/APNO3-N/AP
pH1
AP−0.1601
NH4+-N0.217 *0.1211
NO3-N−0.476 **0.0160.506 **1
AOB−0.194−0.1200.763 **0.831 **1
AOA0.288−0.2730.215−0.0620.380 *1
AOB/AOA−0.399 *0.0340.612 **0.963 **0.769 **−0.1661
NR−0.195−0.0330.686 **0.838 **0.963 **0.493 *0.781 **1
NH4+-N/AP0.232 *−0.1370.934 **0.477 **0.870 **0.424 *0.589 **0.708 **1
NO3-N/AP−0.362 *−0.376 **0.412 **0.900 **0.822 **0.0800.850 **0.788 **0.507 *1
* p < 0.05; ** p < 0.01. Correlation analysis were performed by IBM SPSS statistics versions 17.0. AOB, bacterial amoA gene number; AOA, archaeal amoA gene number. AP, available P; NR, net nitrification rate.
Publisher’s Note: MDPI stays neutral with regard to jurisdictional claims in published maps and institutional affiliations.

