Article

Comparative Assessment of Hydroponic Lettuce Production Either under Artificial Lighting, or in a Mediterranean Greenhouse during Wintertime

1
Laboratory of Vegetable Crops, Department of Crop Science, Agricultural University of Athens, Iera Odos 75, 11855 Athens, Greece
2
Laboratory of Plant Physiology, Department of Crop Science, Agricultural University of Athens, Iera Odos 75, 11855 Athens, Greece
*
Author to whom correspondence should be addressed.
Agriculture 2021, 11(6), 503; https://doi.org/10.3390/agriculture11060503
Submission received: 18 May 2021 / Accepted: 23 May 2021 / Published: 29 May 2021
(This article belongs to the Special Issue Impact of Light on Horticultural Crops)

Abstract

:
Butterhead lettuce was grown hydroponically in a vertical farm under high (HLI) and low (LLI) light intensity (310, and 188 μmol m−2 s−1, respectively) and compared to hydroponically grown lettuce in a greenhouse (GT) during wintertime in Athens, Greece (144 μmol m−2 s−1). The highest plant biomass was recorded in the HLI treatment, whereas LLI and GT produced similar plant biomass. However, the LLI produced vortex-like plants, which were non-marketable, while the plants in the GT were normal-shaped and saleable. Net photosynthesis was highest in the HLI and higher in the LLI than in the GT, thereby indicating that light intensity was the dominant factor affecting photosynthetic performance. Nevertheless, the unsatisfactory performance of the LLI is ascribed, not only to reduced light intensity, but also to reduced light uniformity as the LED lamps were closer to the plants than in the HLI. Furthermore, the large solar irradiance variability in the GT resulted in substantially higher adaptation to the increased light intensity compared to LLI, as indicated by chlorophyll fluorescence measurements. Light intensity and photoperiod are believed to be the primary reasons for increased nitrate content in the GT than in the vertical farming treatments.

1. Introduction

Vertical farming is the procedure of growing vegetables in soilless culture, indoors with artificial lighting. It has been an existing concept for about 50 years, with the first commercial Plant Factory with Artificial Lighting (PFAL) to be established in Miura Nouen, in Shizuoka Prefecture, Japan in 1983 [1]. Due to the recent breakthroughs in the LED industry, vertical farming has become a feasible and scalable farming method. Meanwhile, the interest in developing efficient vertical farming systems is growing due to several factors, including the rise of the human population, extreme weather phenomena due to climate change, and ultimately the enormous pressure by consumers for high-quality fresh products. Freshness is especially important in cases of highly perishable goods, such as leafy vegetables. The ever-increasing demand for nutritious, fresh, safe for consumption and environmentally friendly food has been the driving force for the upscaling of the vertical farming industry, and the establishment of many vertical farming companies and startups.
Climatic conditions, especially temperature and light intensity, have a strong impact on growth, yield and nutritional quality of vegetables [2]. Light is not only the energy source for plants, but also an environmental signal modulating plant morphogenesis. Therefore, light can induce various physiological responses and affect growth and development, through its variations in intensity, photoperiod and spectrum [3,4,5,6]. Morphological and physiological changes occur when plants adapt to different light environments. Low photosynthetic photon flux density (PPFD) tend to induce shade-avoidance-like responses to plants, whereas high PPFD can enhance carbohydrate accumulation and net photosynthetic rate [7,8,9]. Moreover, the growth and morphology of plants are negatively influenced by reduced daily light integrals (DLI) [10], and thus, light intensity and photoperiod are limiting factors for glasshouse production during winter and early autumn. Extending the photoperiod can lead to increased fresh weight of lettuce [11].
Vertical farming can successfully address the problems arising from limited light integrals during wintertime as it provides unlimited opportunities to control the light intensity and duration. The environmental and nutritional control provide additional tools to manipulate crop growth and development [12], allowing stable produce, irrespective of the season or the outside environmental conditions. Lettuce (Lactuca sativa L.) is a model crop for studying the effect of lighting in vertical farms due to its fast growth and short production cycle [13,14]. Moreover, lettuce is one of the most important leafy vegetables worldwide, as it is considered a rich source of vitamins (A, C, E, K), polyphenols, and antioxidant compounds [15]. Due to its short size and production cycle, lettuce is a model plant for vertical farming studies and attracts a high interest for commercial production in vertical farming systems [16]. Nevertheless, lettuce is often accused of accumulating nitrate at levels which can be harmful for humans if consumed at excessive levels [17]. Nitrate accumulation in plants is affected by the environmental conditions and is also influenced by genetic factors. Of the environmental factors, light intensity seems to exert the strongest influence on nitrate accumulation in plant tissues [18]. Previous studies have shown that increasing the light intensity up to a certain level enhances the growth and quality of lettuce, and it has been suggested that the most efficient light intensity for lettuce in a plant factory is between 200–400 μmol m−2 s−1 [19,20,21,22,23,24].
The measurement of chlorophyll fluorescence is a proven, quantitative, non-invasive, powerful tool of assessing the properties of the photosynthetic apparatus [25], especially when it is used in combination with other non-invasive measurements such as gas exchange analysis [26]. Therefore, chlorophyll fluorescence coupled with gas exchange measurements have been used to assess the impact of artificial lighting at different intensities on the performance of the photosynthetic apparatus in plants grown in vertical farms. However, comparisons in growth, yield and photosynthetic performance between plants grown either in vertical farming systems or in conventional hydroponic Mediterranean greenhouses are lacking.
Despite the above-mentioned advantages of vertical over conventional farming, this cropping system raises skepticism, especially in countries with abundant sunlight, such as Greece, Spain, or Italy. However, the high light intensity might be utilized to provide an additional advantage if part of the energy needs for artificial lighting are covered by collecting solar energy through photovoltaic panels. Considering the above background, in the current study we compare a vertical farming system partly powered by solar energy with a conventional, hydroponic system when both are used for winter lettuce production under Mediterranean climatic conditions. In the current paper, leaf nitrate concentrations leaf anatomical characteristics and leaf photosynthetic parameters of plants grown in the vertical farming system under two different light intensities, a high light intensity (HLI) and a low light intensity (LLI), as well as in plants cultivated in a standard glasshouse (GT) during wintertime are reported. Details concerning the electricity consumption of the vertical farming system, used for this study, and the possibility to reduce electricity costs by using a hybrid-solar lighting system with photovoltaic panels, were reported in a previous paper [27].

2. Materials and Methods

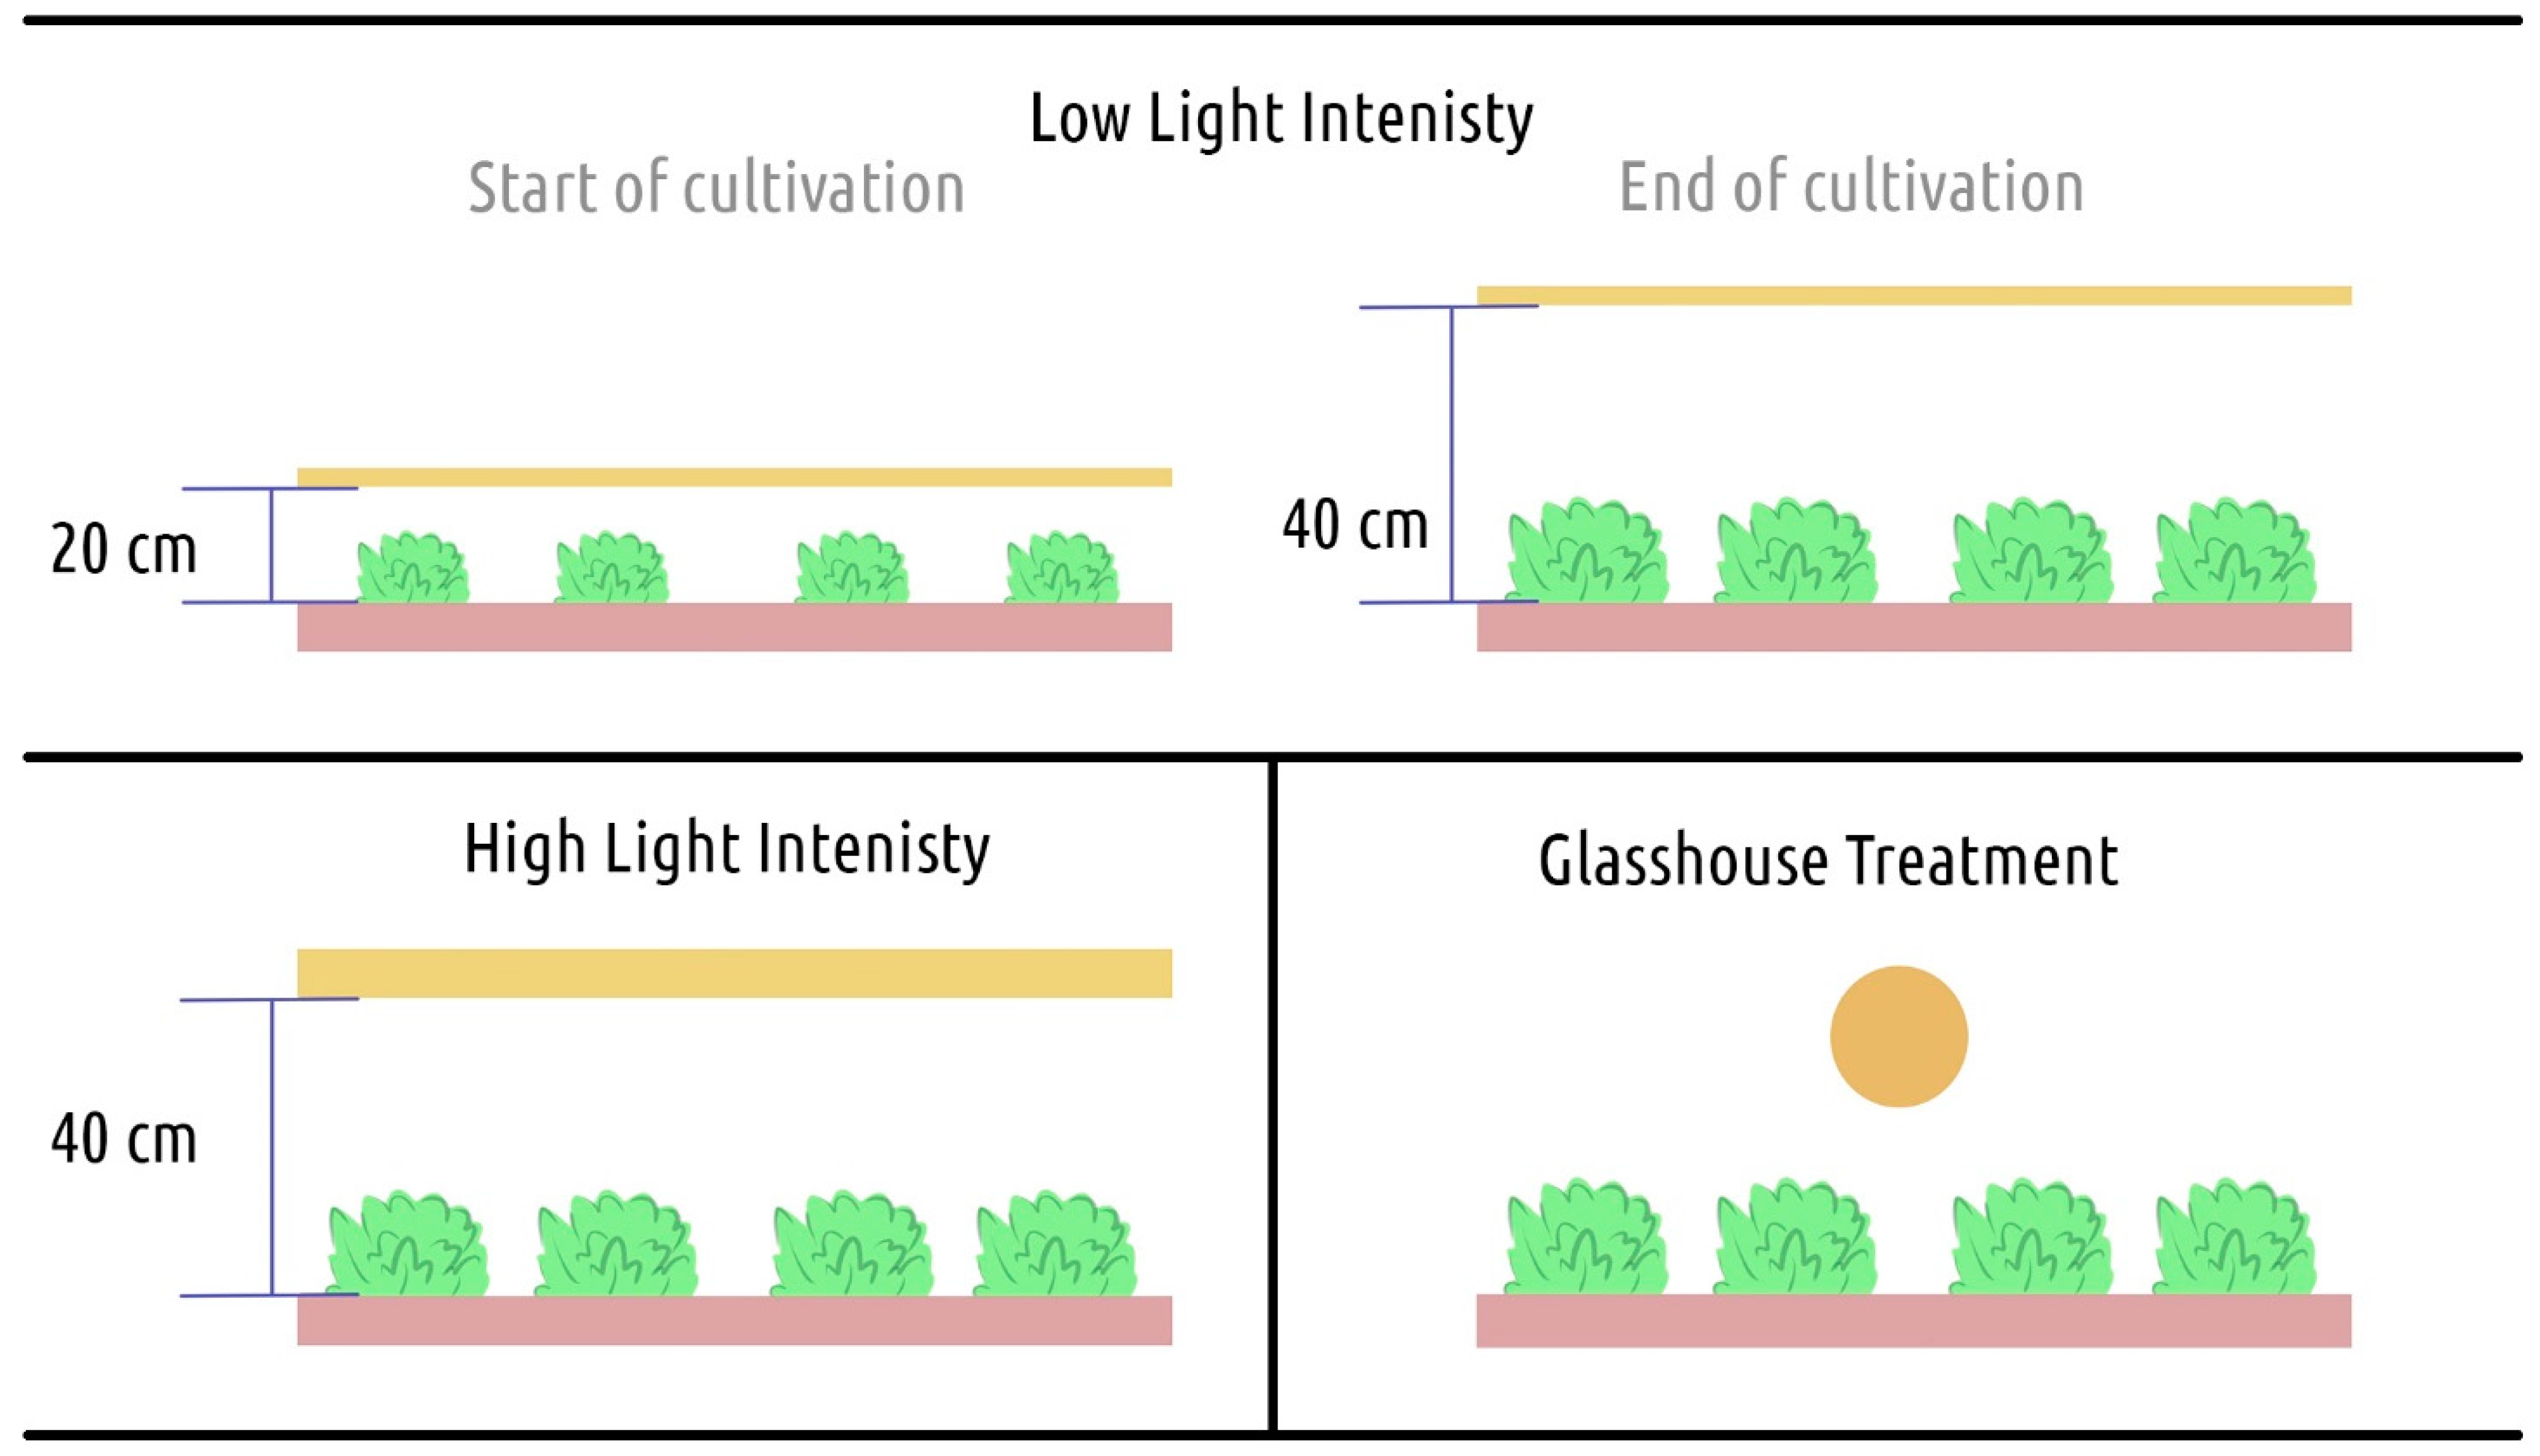
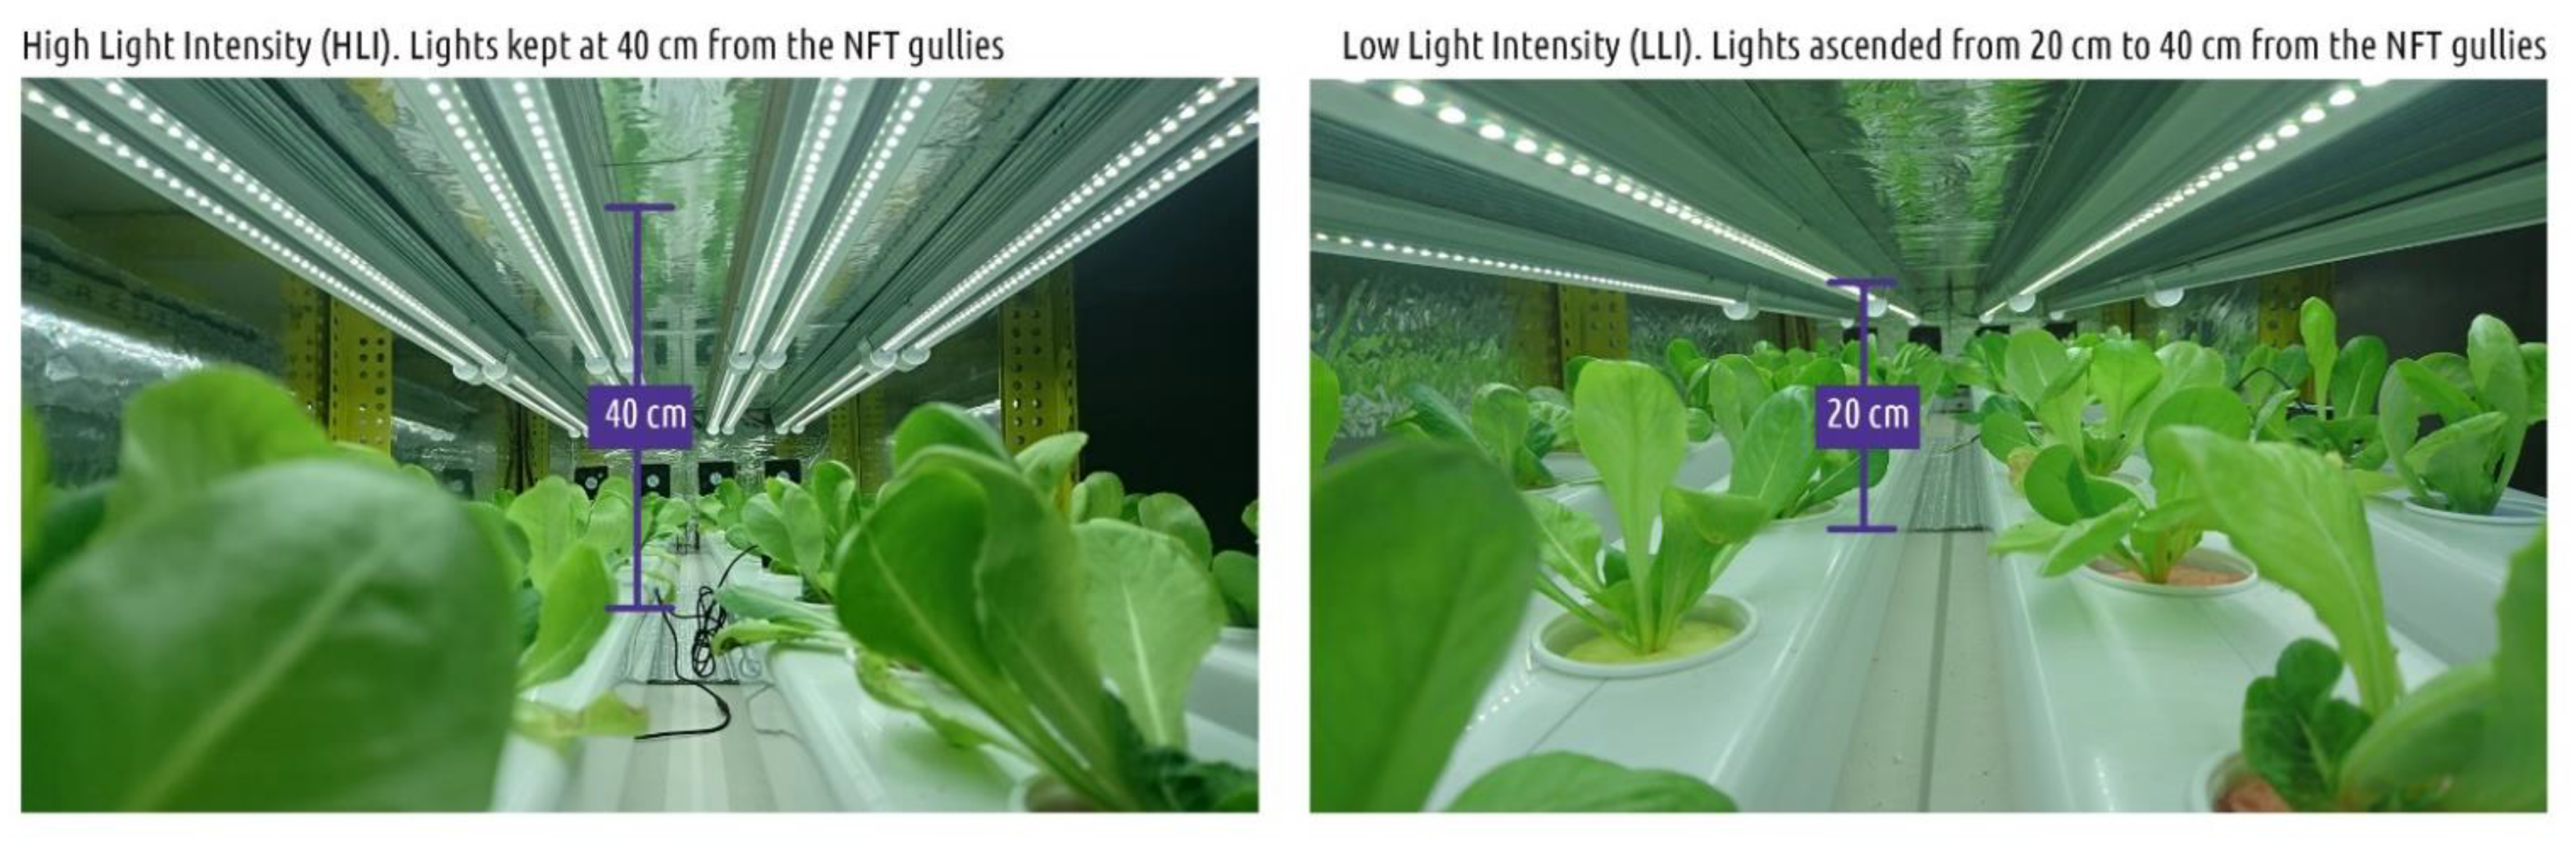
2.1. Plant Material and Experimental Setup

Lettuce seedlings (Lactuca sativa L. cv. Glory) were provided from a commercial nursery (Plantas S.A, Chalandri, Greece) at the three-leaf stage. Prior to transplanting the growing medium was removed from the root surface area. The seedlings were transplanted into plastic cups using a slit sponge capable of holding the plants at the height of the hypocotyl. The plastic cups were then placed inside Nutrient Film Technique (NFT) gullies of a vertical farming system, henceforth termed Photon Rack (PR), as well as in similar gullies placed in a heated glasshouse at the Agricultural University of Athens (37°58’57.8’’ N, 23°42’14.3’’ E). The Photon Rack (PR) system was constructed by K. Dekoulis Lab, Kallithea, Athens, Greece.
The PR was a 1.9 m high, 3-layer rack with four 2-m long NFT gullies per layer. Each gully accommodated 12 plants. Each shelve was 200 cm long and 78 cm wide. Hence the density was 30 plants per m2. The LED tubes were clipped above the hydroponic gullies on an aluminum fixture which was designed to ascend and/or descend depending on the wanted light intensity. The nutrient solution was delivered from a 90-L tank to the gullies of the top layer by a Hailea pump (HX8850, 4900 L h−1, 100 W, Guangdong Hailea Group Co., Ltd., Chaozhou, Guangdong, China). The pump operated daily on a 24-h basis. Airflow was accomplished by using fans on the two ends of the rack. The PR was placed indoors in an acclimated room. Pictures of the PR can be found in Appendix A.
The vertical farming production of lettuce took place in the PR from 20 November 2017 to 19 December 2017 by applying two different treatments. The first treatment was a high light intensity treatment (HLI), consisting of either 16 hybrid-solar or conventional LED, which provided an average of 310 μmol m−2 s−1 irradiance. The LED tubes of the HLI treatment maintained their distance from the gully level throughout the cultivation period as seen in Figure 1. Details regarding the differences in energy consumption of the hybrid-solar and the conventional LED tubes have been provided in a previous paper [27]. The second treatment was a low light intensity treatment (LLI) with 8 LED tubes providing 188 μmol m−2 s−1 irradiance. The LED tubes were placed 20 cm above the NFT gully level and ascended manually during the cultivation period. At the end of the cultivation cycle the LED tubes had the same distance from the gully level, 40 cm, as the High Light Intensity (HLI) treatment (Figure 1). The light spectrum chosen was white broad spectrum (Figure 2) as various studies have shown that it is more beneficial for plant growth compared to narrow spectrum LEDs, like red, blue or their combinations [13,28,29,30,31,32,33,34]. In both treatments of the vertical farming system, a 12-h photoperiod, an average temperature (T) of 22 ± 1.5 °C, an average relative humidity (RH) of 90 ± 10% and an average CO2 concentration of 400 ppm were maintained. To evaluate the outcome of the vertical farming method, a Glasshouse Treatment (GT) was also carried out during the 22 December 2017–20 January 2018 period as comparison. The Glasshouse treatment (GT) was completely depended on sunlight. Given that the conditions inside the climate chamber were fully controlled, and thus, independent of the outside environment, the outcome of the experiment would be the same regardless of the time it was carried out. The climatic conditions of the Greenhouse treatment were as follows; average light intensity was 144 μmol m−2 s−1, the photoperiod was 10 h d−1 while the other climatic conditions; T, RH, CO2 where 20 ± 1.5 °C, 64 ± 10% and 400 ppm respectively. The afore mentioned climatic conditions are summarized in Table 1. The chemical composition of the nutrient solution (NS) supplied to replenish plant uptake (replenishment NS) was as follows: K: 8 mmol L−1, Ca: 4.8 mmol L−1, Mg: 1.3 mmol L−1, NO3-: 16.4 mmol L−1, NH4+: 1.3 mmol L−1, H2PO4-: 1.8 mmol L−1, Fe: 20 μmol L−1, Mn: 6 μmol L−1, Zn: 5 μmol L−1, Cu: 0.75 μmol L−1, B: 30 μmol L−1, Mo: 0.5 μmol L−1. The electrical conductivity and the pH of the recirculating nutrient solution were monitored every day and maintained to 2.4 dS m−1, and 5,5–6,5, respectively, by adding appropriate amounts of replenishment NS, and nitric acid, respectively. In addition, the recirculating NS was renewed every week.
Light intensity was measured using a photometer Li-Cor (LI-188B Integrating quantum/Radiometer/Photometer, LI-COR INC, Lincoln, NE, USA) at plant height. The spectrum was measured using a spectroradiometer (USB2000+, Ocean Optics Inc., Dunedin, FL, USA) at a close distance from the LED chips. The environmental parameters were measured using the Sigrow Pro sensor (Sigrow B.V., Wageningen Campus, Wageningen, The Netherlands). Growth characteristics, shoot fresh weight, leaf number and leaf area were measured during harvest.

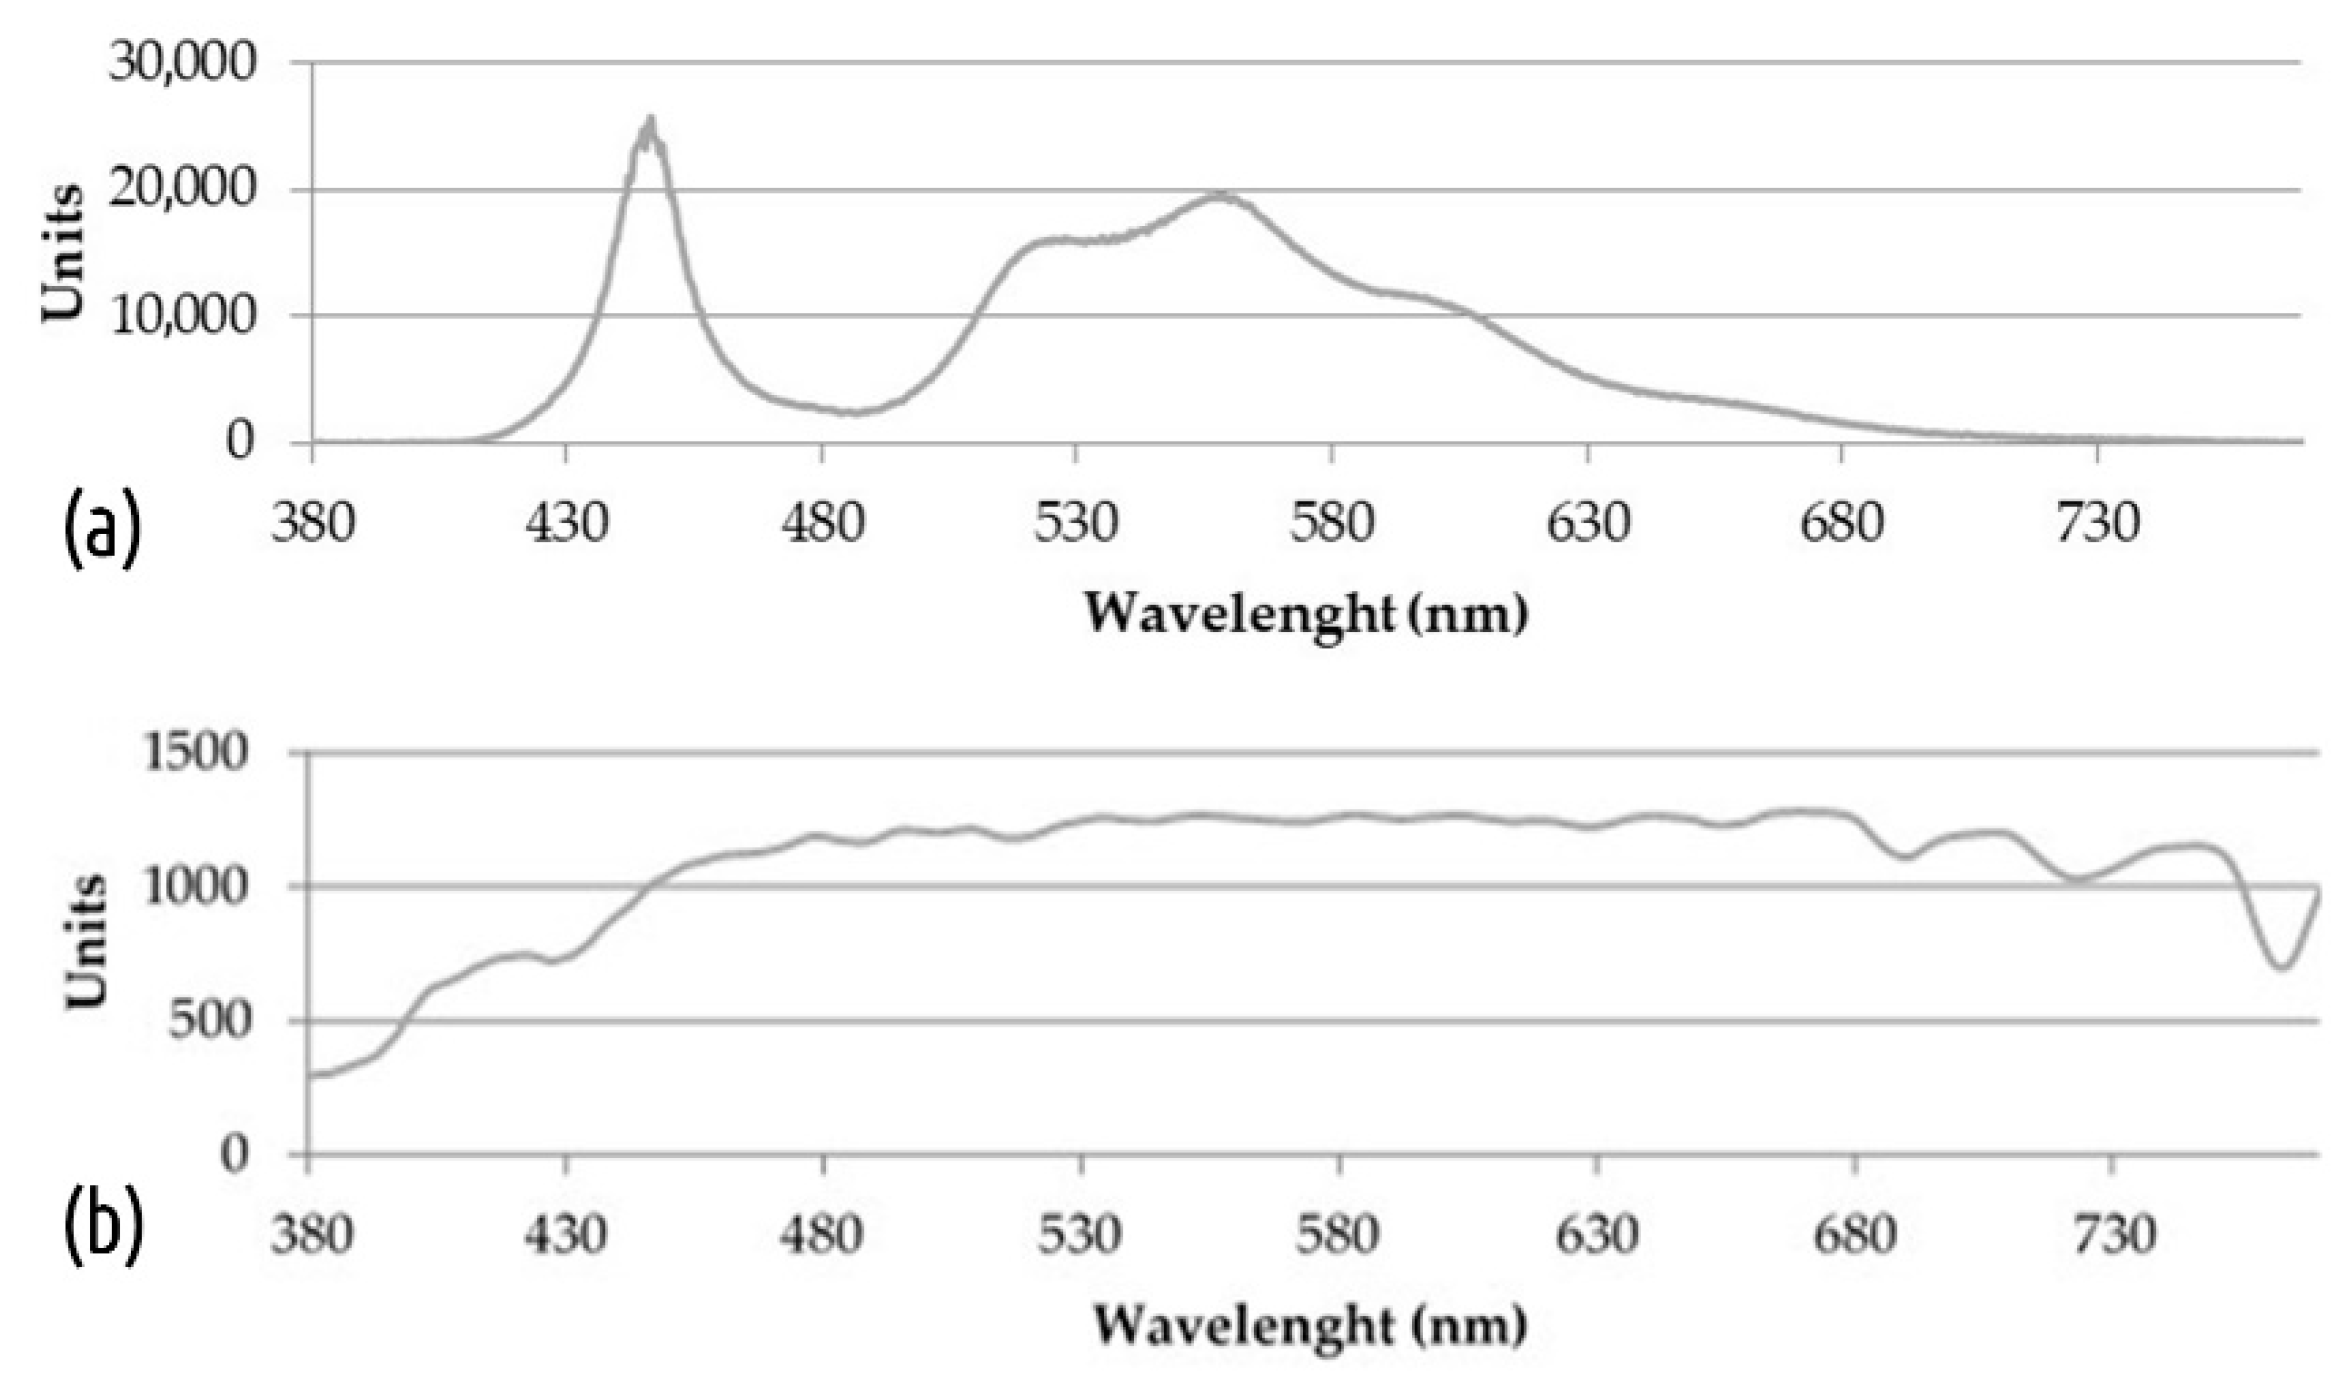
2.2. Chlorophyll Fluorescence and Leaf Gas Exchange

The in vivo chlorophyll fluorescence parameters (operating efficiency of PSII photochemistry, ΦPSII; electron transport rate, ETR; photochemical quenching of PSII, qP; and non-photochemical quenching, qN) were measured once, as described by Liakopoulos et al. [35], at the end of the cultivation in fully developed lettuce leaves, during the light period (specifically between 8:00 a.m. and 12:30 p.m.), using a portable chlorophyll fluorometer (PAM-2100, Heinz Walz GmbH, Effeltrich, Germany). Each leaf was acclimated for 20 min before the measurements were taken, using dark leaf clips. The light response curve was measured using 7 light intensities in the range between 0 to 938 μmol m−2 s−1. The starting light intensity was 40 μmol m−2 s−1, followed by 74, 120, 192, 302, 412, 631 and 938 μmol m−2 s−1. Measurements of photosynthetic light curves and photosynthetic characteristics were carried out using white light from the PAMs’ halogen light source. Fluorescence measurements were taken on the same morning with gas exchange measurements. Measurements of light-saturated net CO2 assimilation rate and stomatal conductance were conducted on mature leaves exposed to each light treatment (HLI, LLI, GT), using a portable open-circuit gas-exchange instrument (LI-6400, Li-COR Inc., Lincoln, NE, USA), equipped with a broad leaf chamber enclosing 6 cm2 of leaf area. Temperature and relative air humidity inside the chamber were 30 ± 3 °C, and 30 ± 2%, respectively. Gas exchange parameters (net rate of CO2 assimilation, A; transpiration rate, E; intercellular CO2, ci; and stomatal conductance to H2O, gs) were measured at ambient CO2 atmospheric concentration under 7 different photosynthetic photon flux densities, supplied by the LED light of the instrument’s chamber, ranging from 0 μmol m−2 s−1 to 1840 μmol m−2 s−1 after acclimation for 180 s. The starting light intensity was 0 μmol m−2 s−1, followed by 46, 92, 184, 460, 920, and 1840 μmol m−2 s−1. Six replicates for each treatment were measured (three readings at steady-state conditions were recorded per replicate and per light level). Water Use Efficiency (WUE) was calculated as “instantaneous WUE” between A and E (A/E) as described by Medrano et al. [36].

2.3. Fresh Weight, Leaf Number, Leaf Area, and Leaf Nitrate Concentration

Shoot fresh weight (sFW, g) and root fresh weight (rFW, g) were measured using the Mettler PE-3600 (Mettler Toledo LLC, Columbus, Ohio, USA) scale, after wiping the plant parts with paper to remove the surface water. The number of leaves were determined by destructive sampling during the harvest stage. The leaf nitrate concentration was determined by measuring nitrite after reduction of nitrate to nitrite by copperised cadmium (Cu-CD) columns and subsequent colorimetric determination of nitrite by a Griess diazo-coupling reaction as described by Novozamsky et al., [37]. The percentage of the daily nitrate intake in each treatment per average lettuce head was calculated by multiplying the average fresh weight of each lettuce head (kg) with the mean nitrate concentration (mg kg−1) and then dividing by the human threshold of acceptable daily intake (ADI), which is 220 mg d−1 [38]. The percentage of the daily intake of nitrate of each treatment per 100 g of fresh produce was estimated by dividing the mean nitrate concentration for 100 g of lettuce by the human threshold of ADI.

2.4. Statistical Analysis

The experiment was set up as a completely randomized design, with three treatments. Each treatment consisted of 4 NFT gullies. Due to lack of space, each plant constituted one replication. For the statistical analysis, 10 replication samples per treatment were collected randomly to minimize the position effect. The data were statistically evaluated by applying one-way ANOVA using the STATISTICA software package, version 9.0 (TIBCO Software Inc, Palo Alto, CA, USA) for Windows (Microsoft, Redmon, WA, USA). When ANOVA was significant for one measured parameter, the treatment means were separated using the Duncan’s Multiple Range Test (p ≤ 0.05). Data were presented in figures and tables as means ± SE of ten replicates.

3. Results

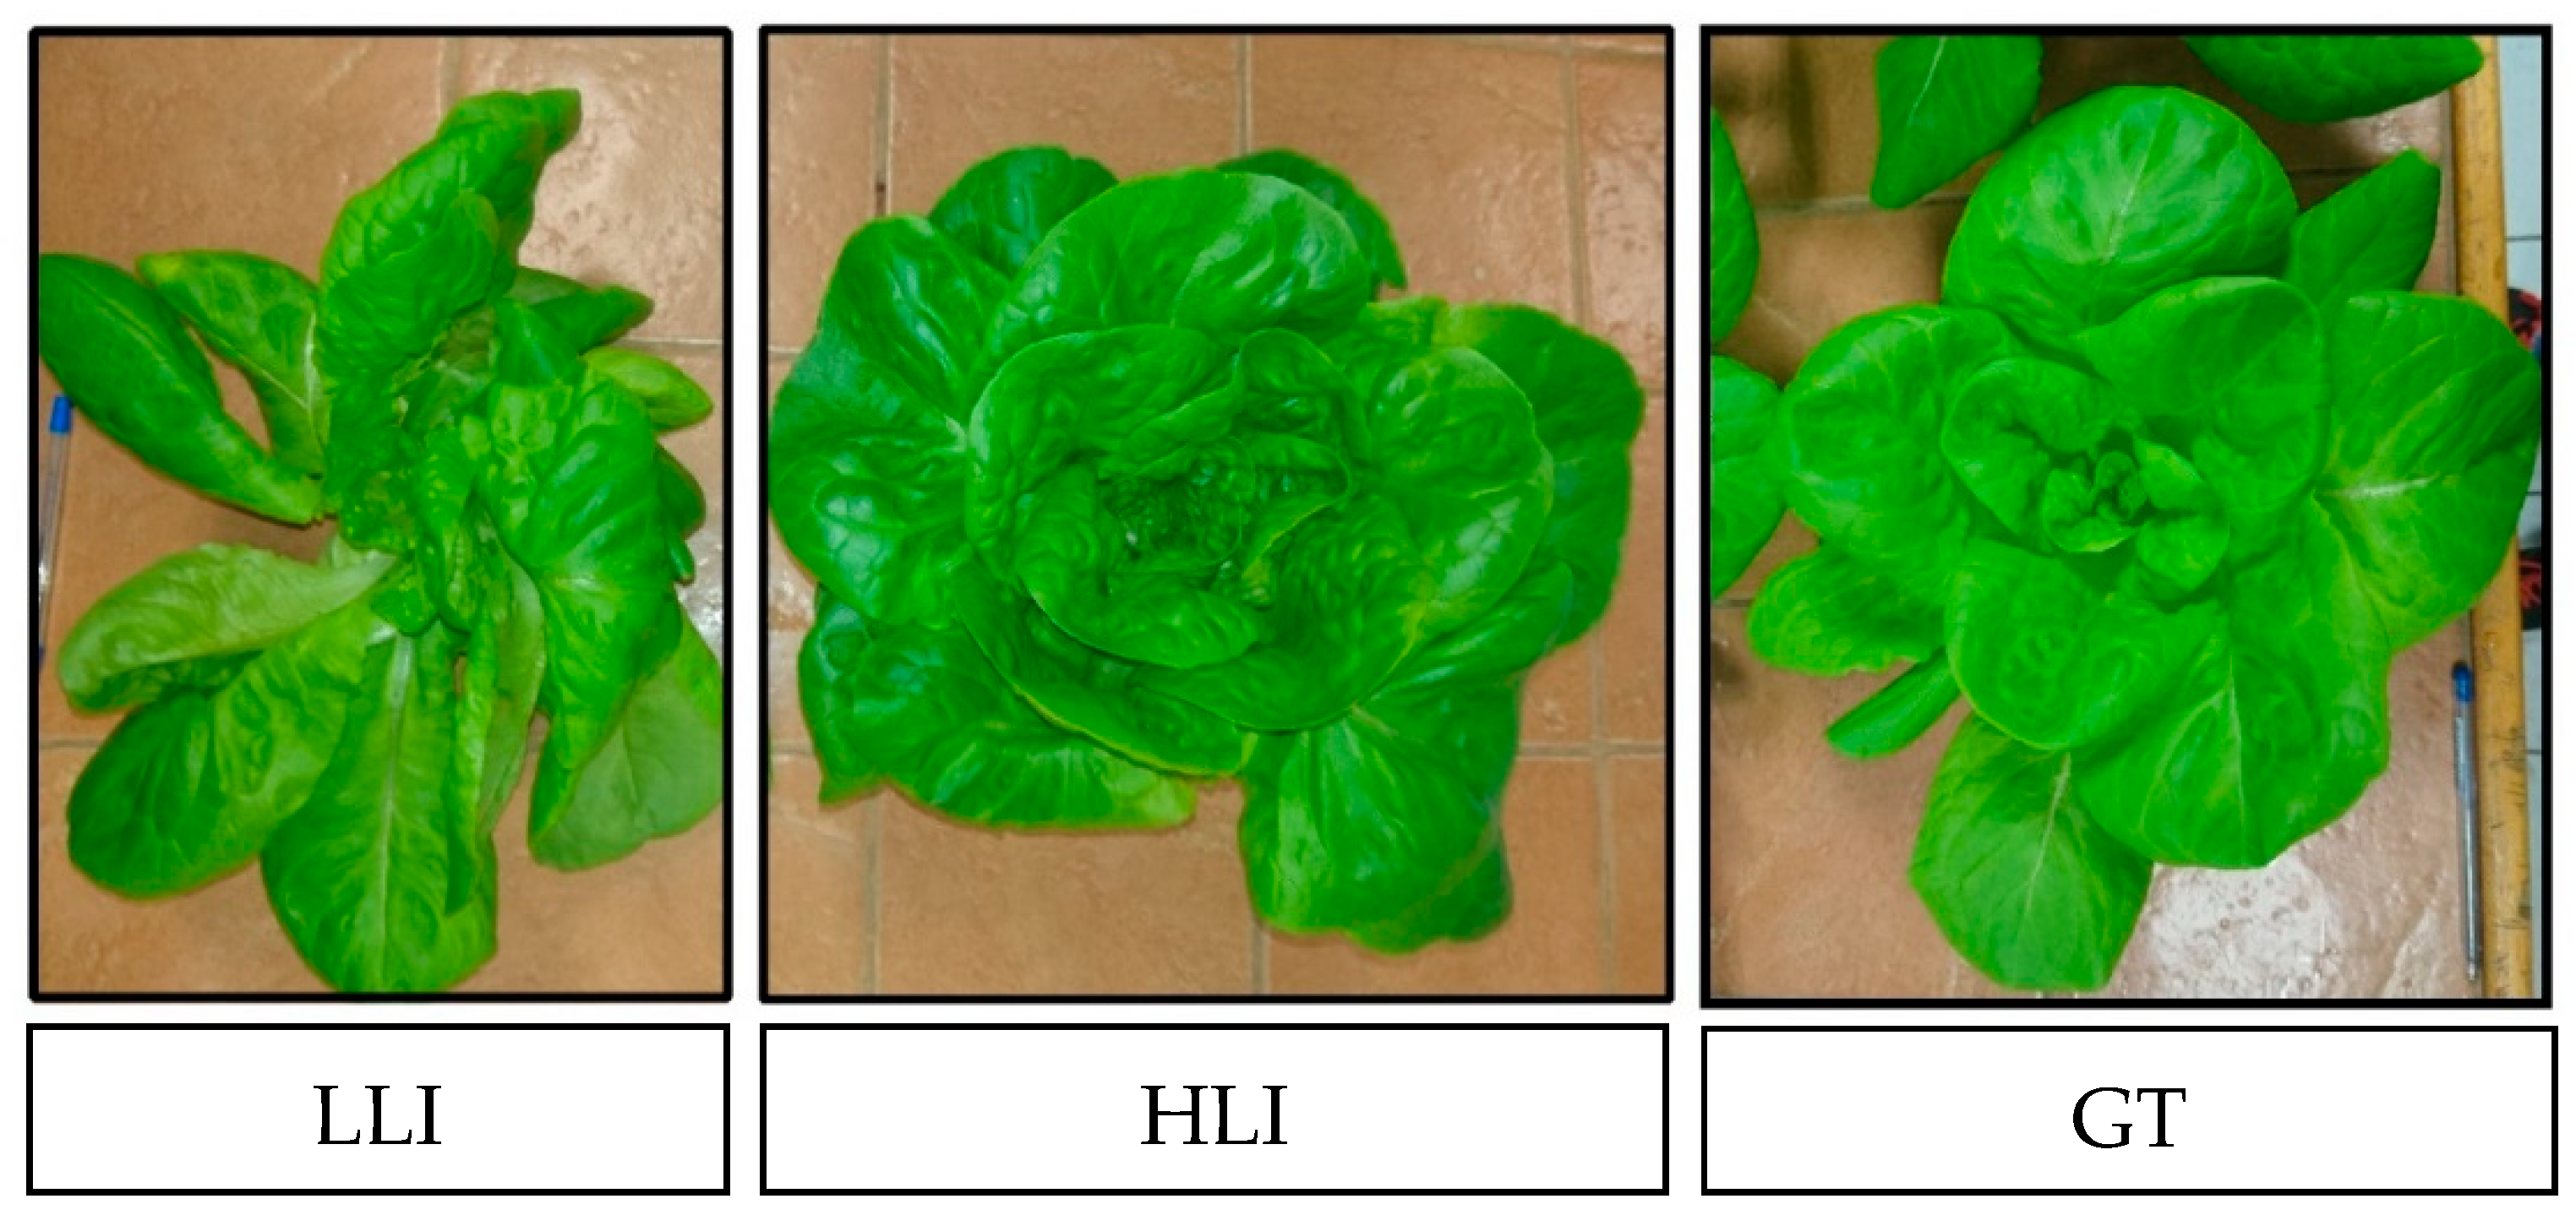
3.1. Quality and Biomass of Lettuce Plants Grown under Different Lighting Designs

The fresh biomass of the epigeous plant part in the HLI treatment was almost double as high as in the other two treatments, while the difference was not significant between the LLI and GT (Table 2). The fresh to dry weight ratio in the epigeous biomass did not differ significantly between the treatments (data not shown). The root biomass was higher in the HLI followed by the LLI treatment while GT had by far the lowest root biomass. The leaf number was significantly higher in plants of the HLI treatment compared to the other two treatments, and significantly higher in the LLI than in the GT treatment. The leaf area was significantly higher in the HLI treatment compared to LLI and GT, while the latter two treatments did not differ significantly from each other. The appearance of the lettuce plants is sown in Figure 3. The lowest nitrate concentrations were measured in the HLI and LLI treatments, without any significant differences between them, while the leaf nitrate concentration measured in the GT treatment was significantly higher than those measured in the vertical farming system, irrespective of light intensity (Table 2).

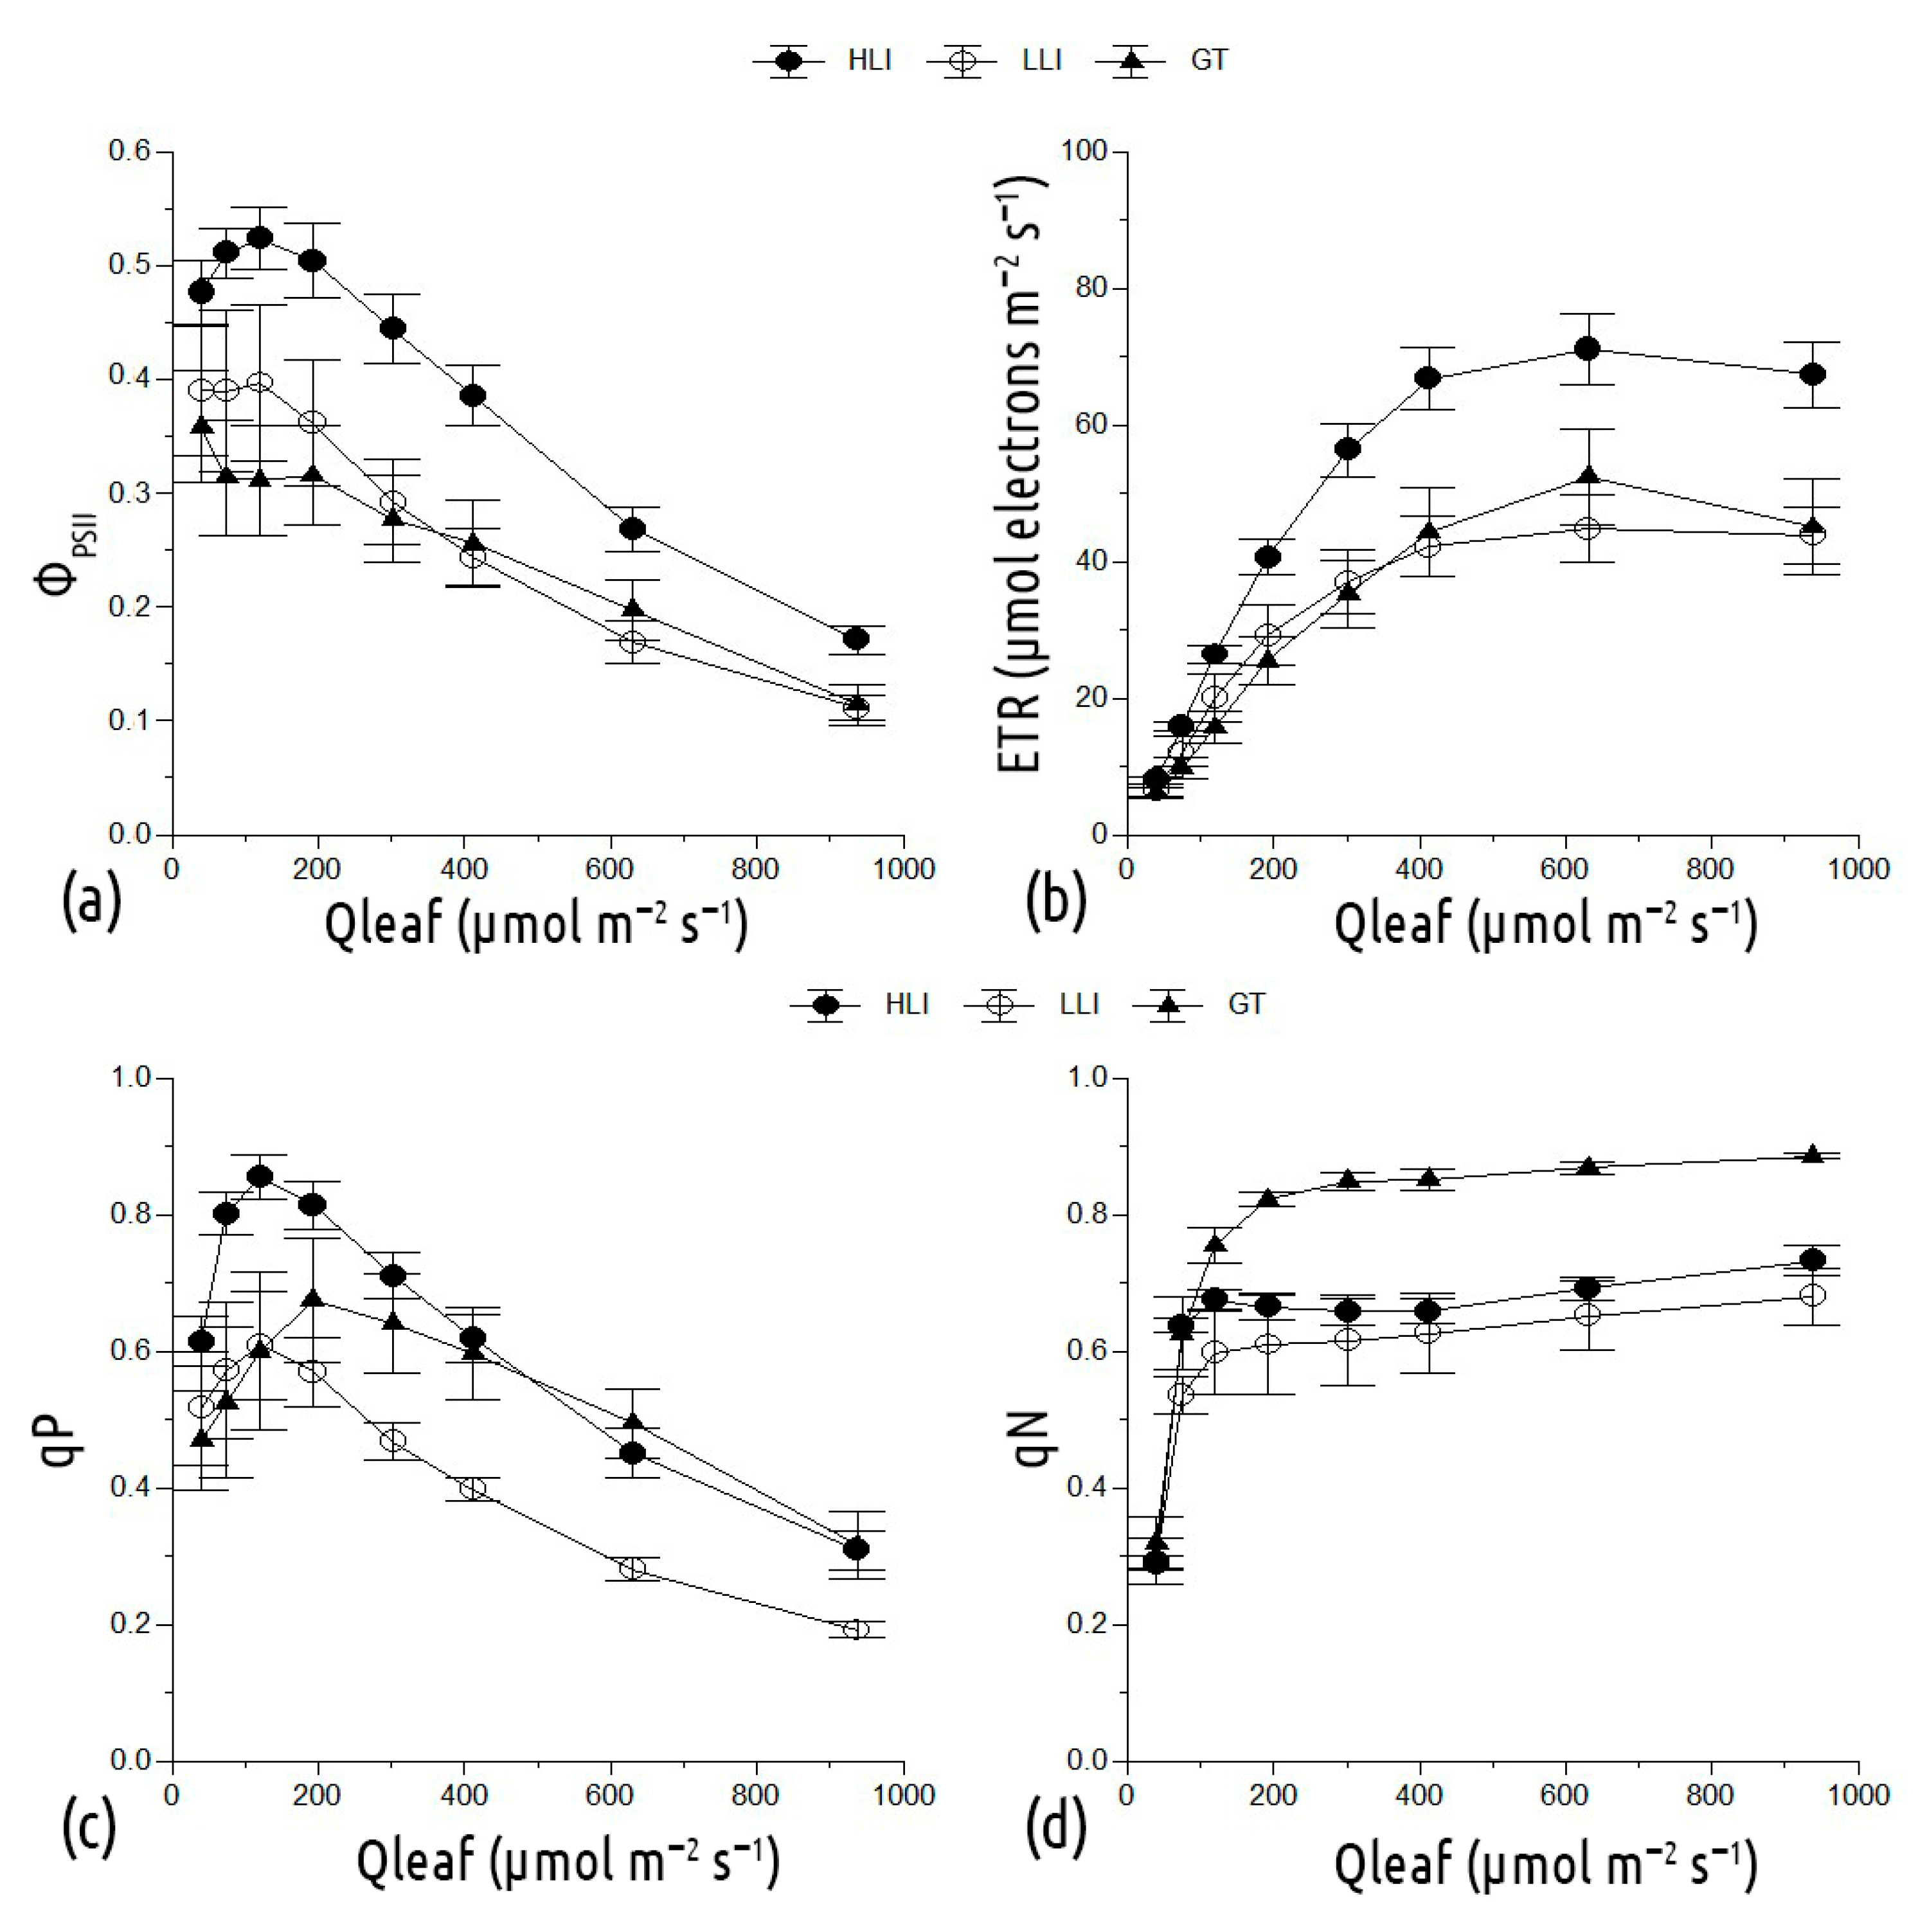
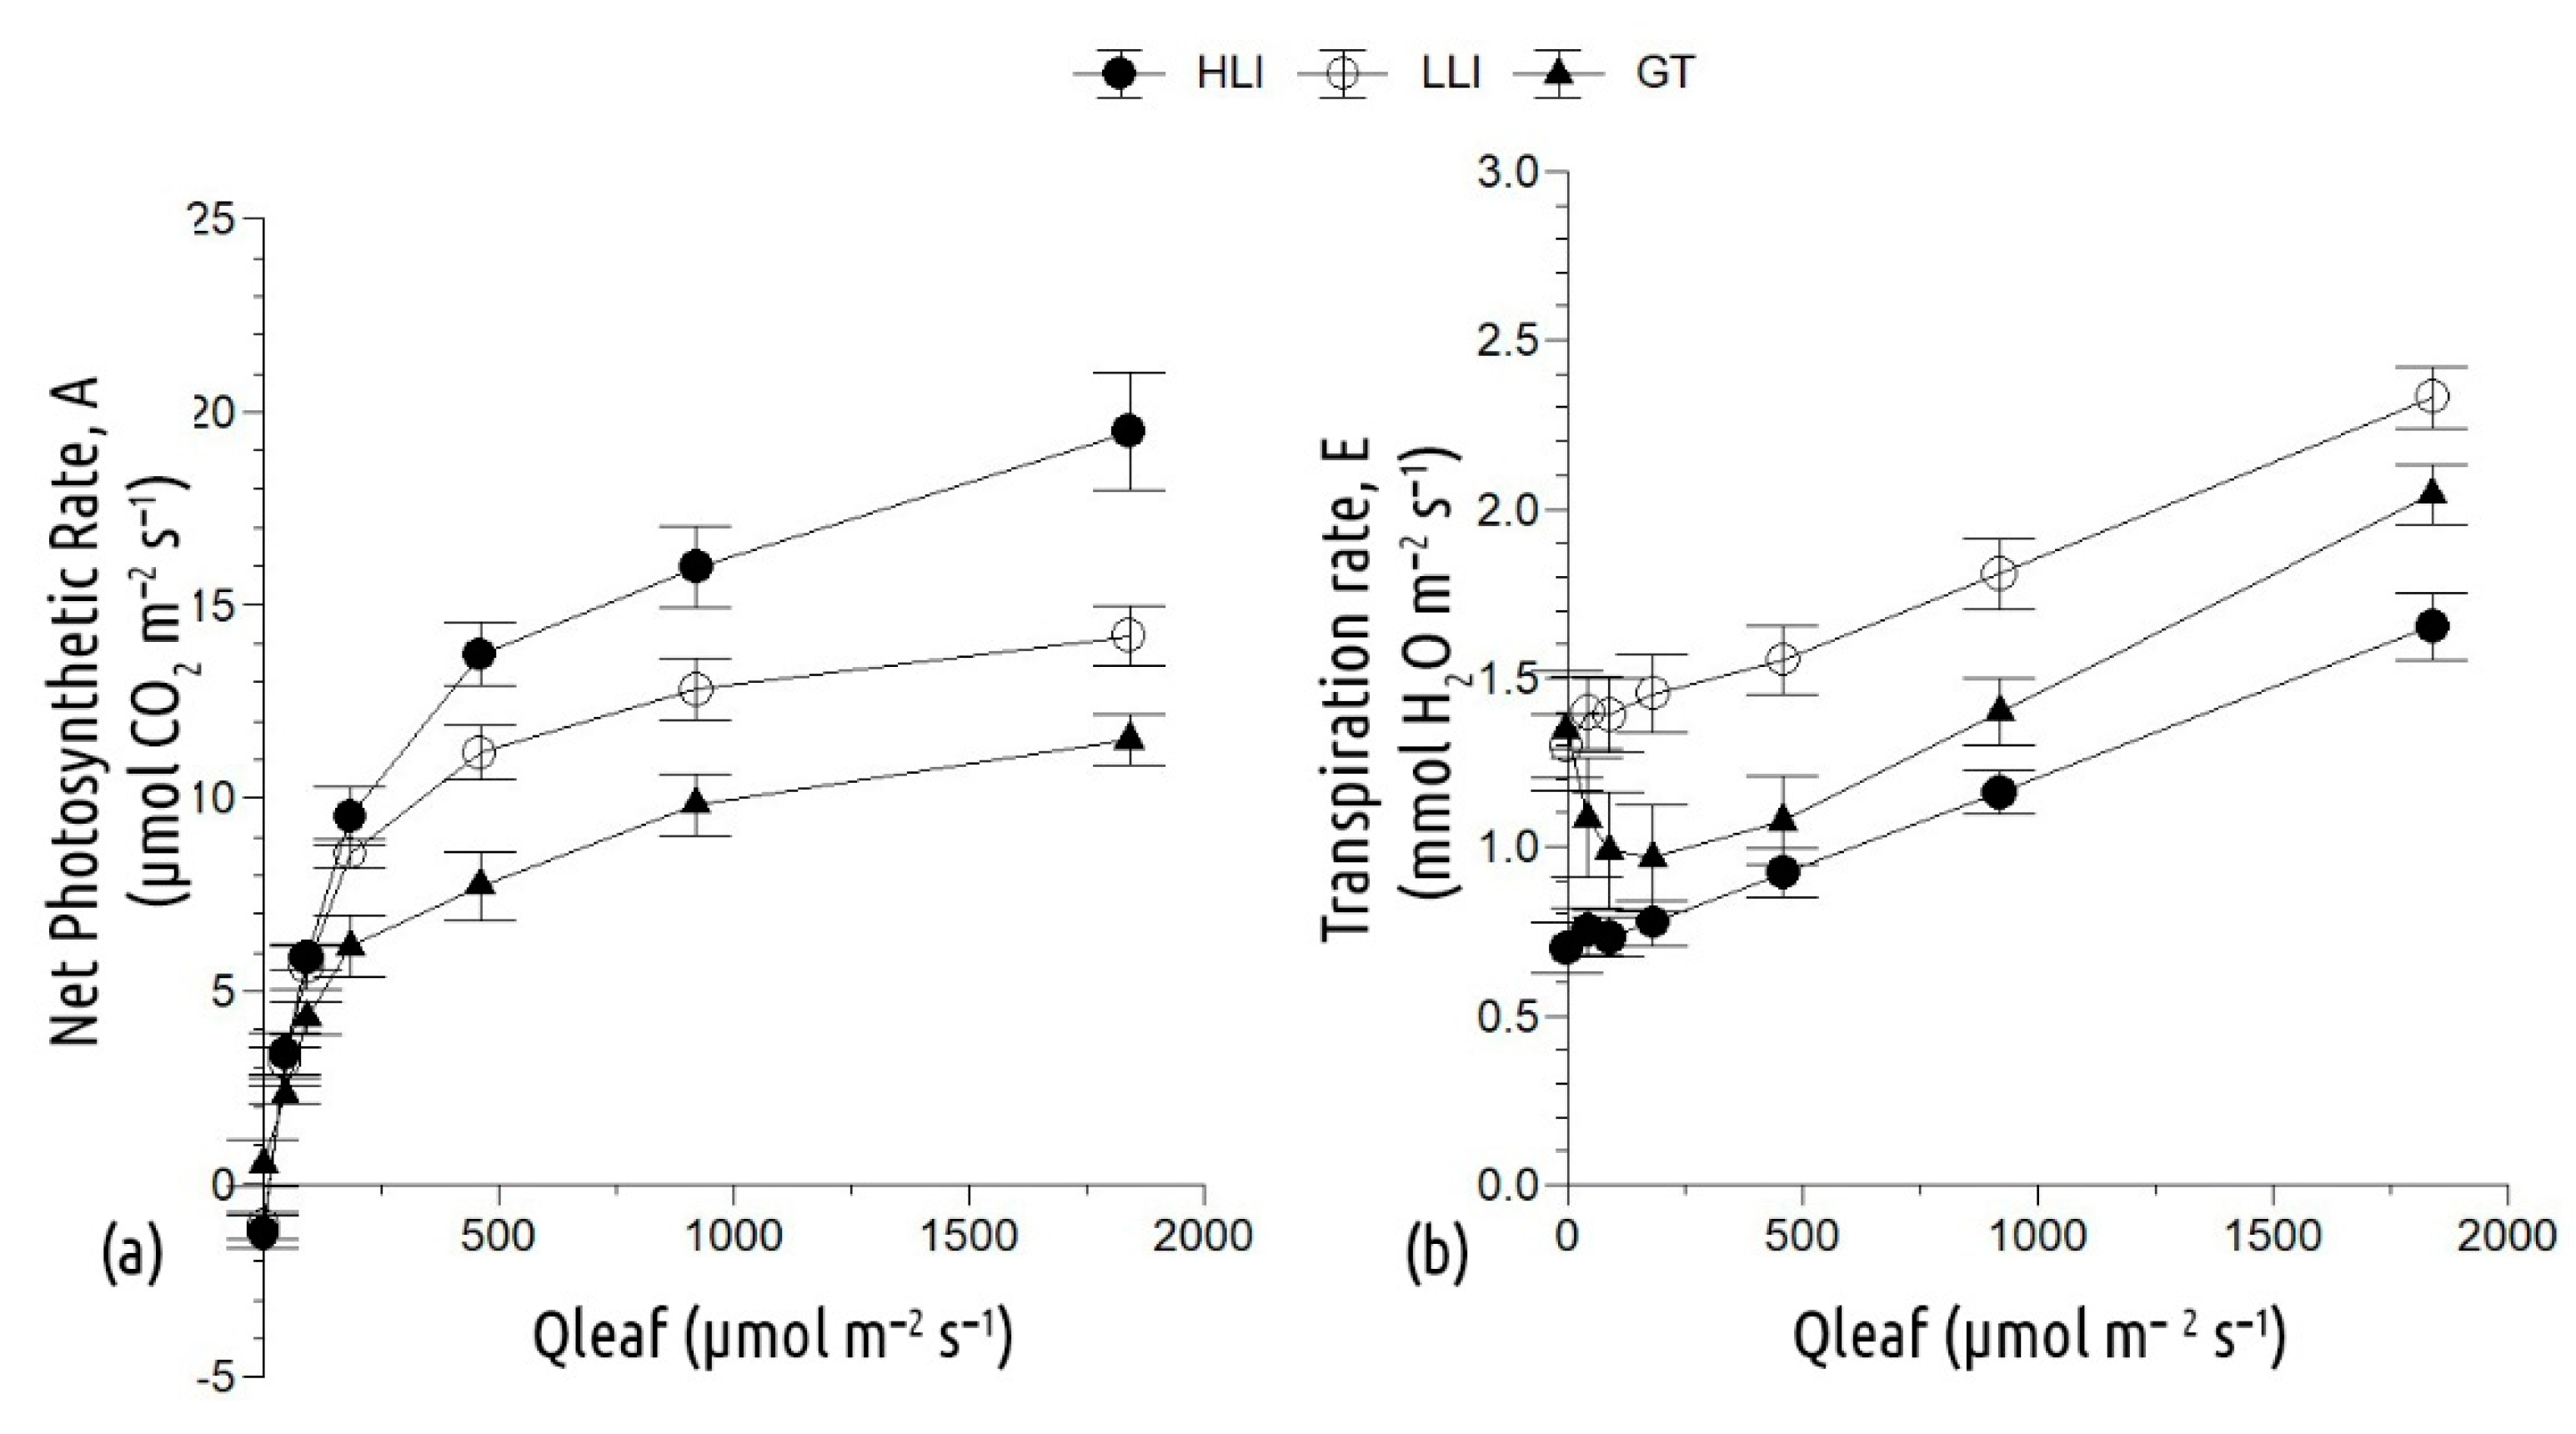
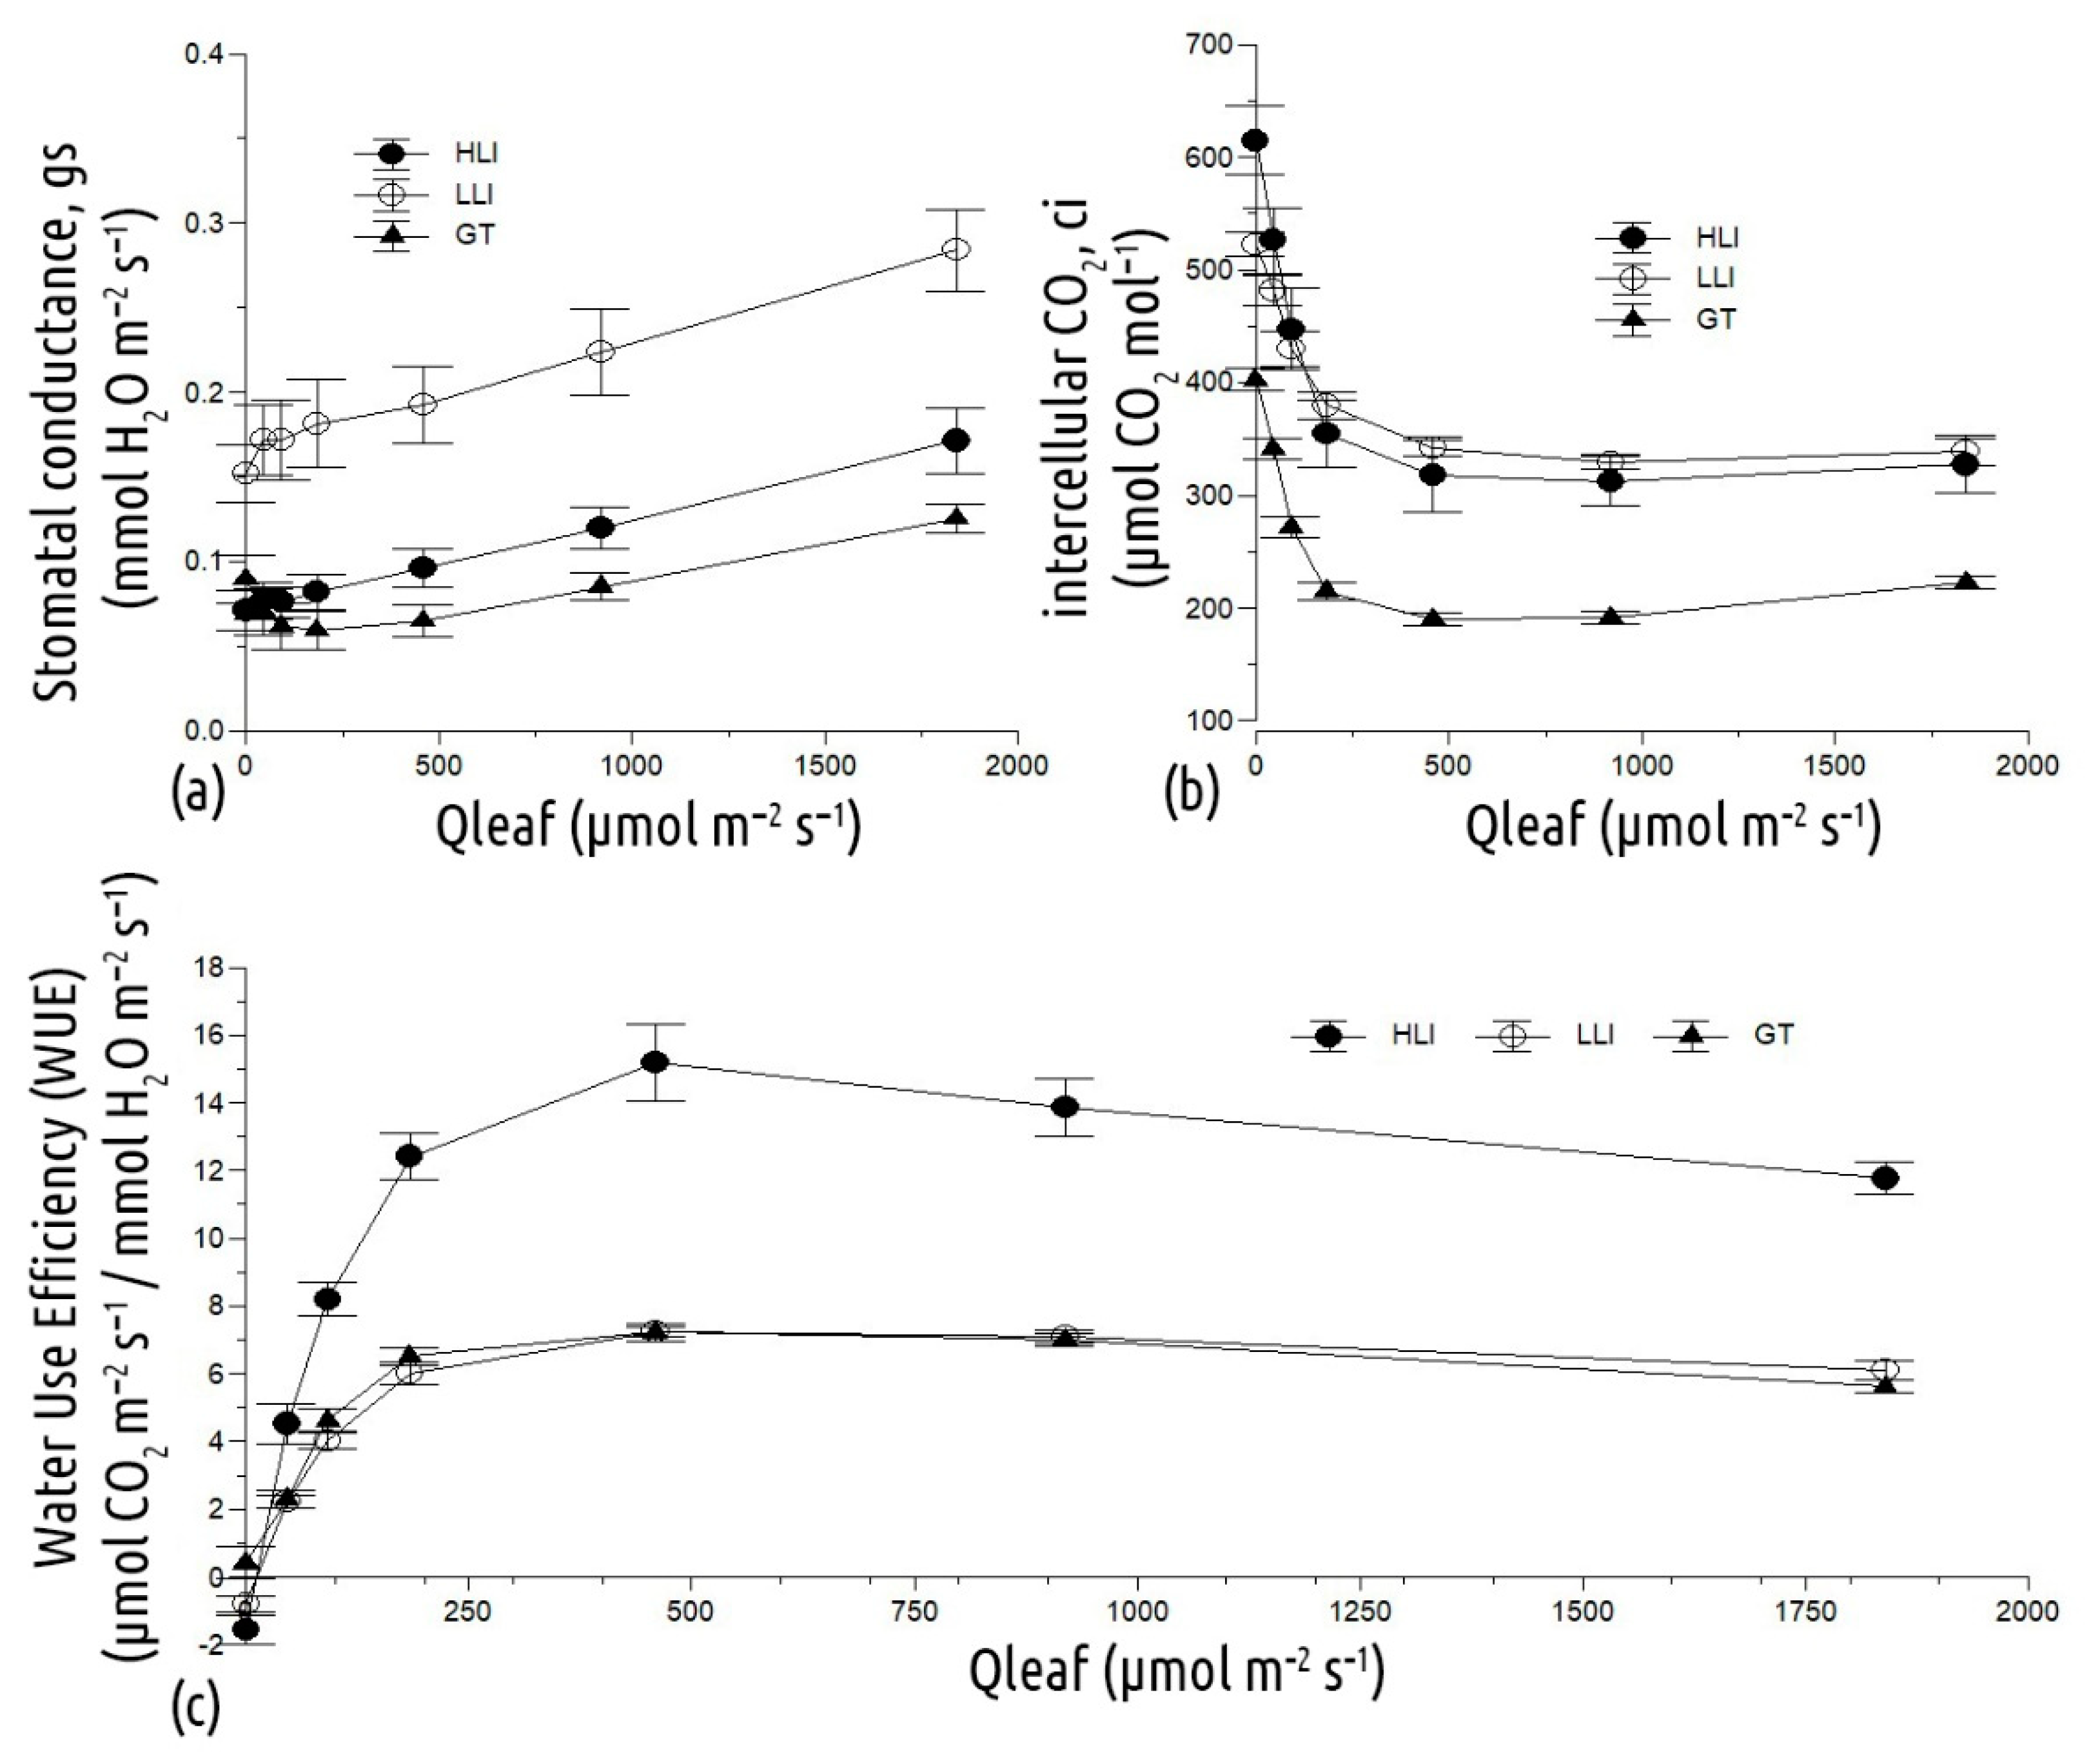
3.2. Physiological Characteristics: Chlorophyll Fluorescence and Gas Exchange

The chlorophyll fluorescence analysis showed that, based on the ΦPSII and ETR parameters, plants of the HLI treatment were more capable of utilizing the light for photosynthesis than those of the other treatments, whereas LLI and GT plants did not differ significantly (Figure 4).
Looking further into the qP values, it was shown that, for PPFD lower than 300 μmol m−2 s−1, the HLI treatment was significantly higher than the other two treatments (Figure 4c), while at PPFD higher than 300 μmol m−2 s−1, the qP values of the HLI treatment were significantly higher only in comparison with those recorded in the LLI. Furthermore, the qP in the GT treatment, representing the energy ratio distributed to photosynthetic electron transport, was significantly lower than in the LLI treatment under PPFD below 150 μmol m−2 s−1, similar to that measured in the LLI for PPFD equal to 150 μmol m−2 s−1, and higher than in the LLI for PPFD higher than 150 μmol m−2 s−1. The measurements of the qN, which represents energy dissipation at the PSII antenna level due to the xanthophyll cycle and other photoprotective or regulatory processes, revealed significantly higher values in the GT compared to the other treatments (Figure 4d).
As shown in Figure 5, the highest net photosynthetic rates and the lowest transpiration rates were measured in the HLI treatment compared to the other two treatments. The highest levels of transpiration and stomatal conductance were measured in plants of the LLI, and the differences were significant compared to both the HLI and the GT. On the other hand, as seen in Figure 4 the intercellular CO2 was significantly lower in the GT compared to both the HLI and LLI, while the latter treatments did not differ significantly from each other. Finally, the HLI exhibited the highest water use efficiency (Figure 6) compared to the LLI and the GT, while the latter two treatments did not differ significantly from each other.

4. Discussion

Light intensity strongly affects growth and quality of lettuce as reported by Kang et al. [4], and Fu, et al. [19]. The present study showed that an irradiance level of 188 μmol m−2 s−1 applied constantly for 18 h in a vertical hydroponic system was insufficient for lettuce, while a PPFD of 310 μmol m−2 s−1 could produce large lettuce heads containing less nitrates compared to those produced hydroponically in a Mediterranean greenhouse during wintertime. However, apart from the light intensity, the light uniformity had also a strong impact on lettuce growth in the current study. Indeed, the GT treatment, which took place in a Mediterranean hydroponic greenhouse during wintertime with an average PPFD of 144 μmol m−2 s−1 and a 10 h photoperiod, produced morphologically salable lettuces, albeit with a lower biomass than in the HLI. Morphological differences at the harvest stage between plants originating from the three treatments are shown in Figure 3. Apparently, the shape of the plants in the LLI was peculiar, while, based on the shape, HLI plants could not be distinguished from those of the GT treatment. In contrast, the LLI treatment produced morphologically non-marketable lettuce heads characterized by a vortex-like morphology although the mean light intensity was higher than that prevailing in the GT. The vortex-like morphology was presumably a result of poor light uniformity in the LLI treatment, which has a similar effect with that imposed by competition among neighboring plants on the Red:Far red ratio as reported by Ballaré [39,40,41], and Nagashima and Hikosaka [42].
The placement of the LED tubes closer to the plants in the LLI treatment led to areas exposed to high light intensity alternated by areas of lower light intensity on the upper surface of the plants and inside the plant canopy. As reported by Marchior et al. [43], self-shading can lead to exposure of a large part of plant leaves to low light levels, and concomitantly to severe restrictions in the rate of net assimilation. Nevertheless, it is worth to note that the vortex-like morphology would not be a problem if the lettuces were produced for fresh cut salads.
In addition to the light uniformity, differences in the light quality had also a strong impact on growth of lettuce. As reported by Dougher and Bugbee [44], Lin et al., [13], Li and Kubota [14], and other researchers [32,45,46,47], the spectrum can greatly affect the growth of a crop. In the vertical farming system white LEDs were used in both the LLI and the HLI treatment, while in the GT treatment the plants were receiving natural sunlight. On this basis, it is suggested that the biomass differences between the vertical farming treatments on the one and the GT on the other were partly imposed by differences in the light spectrum.
The higher leaf nitrate concentrations in the HLI treatment compared to the LLI and the GT are reasonable, given that the assimilation rate of nitrates into the plant cells is primarily dictated by the activity of nitrate reductase, which is depending on the light conditions [48,49]. As reported by Viršile et al. [50] an increased light intensity provides more energy available to photochemistry, provided that CO2 supply from the atmosphere is ample, leads to enhanced carbohydrate production and accelerated nitrate assimilation to amino acids. However, the light intensity alone cannot explain the huge difference in leaf nitrate concentration between the LLI and the GT. Indeed, the difference in light intensity between the LLI and the GT is relatively small, compared to that between the HLI and the LLI. However, the difference in leaf NO3- concentration is much larger between the LLI and the GT than between HLI and LLI. This lack in proportionality between light levels and leaf nitrate concentrations indicates that the leaf nitrate concentration was influenced by both light intensity and light quality. Indeed, as reported by Chen et al. [30], blue light boosts the synthesis of nitrate reductase in directly or indirectly ways. Therefore, the lower leaf nitrate concentrations in the vertical farming treatments of the current study may be associated with a high proportion of blue light in the light spectrum applied in these treatments.
As shown in Figure 7, when the nitrate values were studied per plant, the nitrate values of each treatment were all below the human threshold of acceptable daily intake (ADI), which is 220 mg day−1 for a person weighing 60 kg [38]. The consumption of an average lettuce originating from the HLI treatment covered the 70% of ADI, while LLI covered just 52% and GT the 94%. However, taking a mean daily consumption of 100 g as a calculation basis, the GT greatly surpassed the ADI limit, providing 163%, while LLI and HLI remained safe for consumption with 79%, and 57% of the ADI, respectively. This indicates that the consumption of greenhouse-produced lettuce in winter is associated with a higher risk of surpassing the safety threshold. Nevertheless, this may be not associated with a higher health risk, as recent investigations dispute the harmful effects of nitrate and its derivate nitrite on human health [51].
The measurements of chlorophyll fluorescence and gas exchange parameters showed that HLI was photosynthetically the most efficient treatment. Furthermore, the results concerning chlorophyll fluorescence parameters at different light levels demonstrate the acclimation effect in the lettuce plants grown under each treatment. The plants of the HLI treatment were growing under a stable PPFD of around 300 μmol m−2 s−1, while the LLI plants were exposed to a stable but lower PPFD of around 190 μmol m−2 s−1. However, the GT plants were growing in an environment with unstable, natural lighting corresponding to an average PPFD of around 140 μmol m−2 s−1, but maximum PPFD levels in the greenhouse reached 500 μmol m−2 s−1 or more at times during some days. These conditions may have been partially responsible for the increasing efficiency of the photosynthetic activities in the GT under increased light intensity in comparison to LLI, the efficiency of which dropped with increased PPFD (point of 300 μmol m−2 s−1 for ΦPSII and ETR, and point of 100–150 μmol m−2 s−1 for qP and qN) as shown in Figure 4.
As stated by Walters R.G [52], plants have evolved several mechanisms enabling them to adapt to changes in growth conditions. The adaptation mechanisms include both morphological changes improving light interception on the long term (Ballare’ [41]; Weston et al. [53]), and adjustments in the functioning of individual proteins maximizing the efficiency of the photosynthetic apparatus, which operate on timescales ranging from seconds to hours (Demmig-Adams and Adams [54]). The HLI and LLI treatments of the vertical farm were adapted to stable environmental conditions, and thus, were unable to adapt quickly to any deviation from those conditions as seen from the chlorophyll fluorescence measurements (Figure 4). The unstable lighting conditions of the GT treatment in the greenhouse helped the plants adapt in more diverse lighting conditions. This can be seen from the qP measurements Figure 4c, where the GT treatment appears to be more capable of utilizing high light intensities than the LLI and HLI.
The high intercellular CO2 concentrations in the LLI are ascribed to the significantly high levels of stomatal conductance. However, the low net photosynthesis in the LLI despite the high levels of intercellular concentration indicate that the restriction of plant biomass in this treatment originated from limitations in the photosynthetic apparatus. In contrast, the lower rates of net photosynthesis in the GT compared to the other two treatments were associated with reductions in both the stomatal conductance and the intercellular CO2 concentrations, which indicates that the plant biomass in this treatment was partly restricted by stomatal limitations. The reduced stomatal conductance in the GT is ascribed to the lower relative humidity in the greenhouse air compared to than maintained in the vertical farming treatments (Table 1). As has been reported in a previous paper [27]), stomatal length did not differ significantly among treatments whereas the stomatal density of the GT treatment was significantly lower in comparison to that measured in the other treatments. These results highlight another advantage of lettuce cultivation in vertical farming systems, namely their inherent ability to allow for maintenance of the air humidity to optimal levels for plant growth.
The highest WUE was observed in the HLI treatment, which had the largest leaf area as well. For the LLI treatment it was expected to have low WUE since it had decreased chlorophyll fluorescence and increased stomatal conductance. The lettuces of the HLI treatment grew under high relative humidity conditions (RH = 90%), which led to decreased transpiration in comparison to the GT were the relative humidity was lower (RH = 64%) and therefore the transpiration was greater. This also had an impact on the calcium ascension since in both the HLI and LLI treatments, there were lettuce plants that suffered from tip burn. An unexpected point regarding the LLI was that the stomatal conductance and the transpiration rate were higher than in the other two treatments despite the high relative humidity (RH = 90%). It is speculated that the decreased distance between the LEDs and the plant canopy led to uncontrolled high illuminance at certain parts of the leaves. This high light intensity perhaps acted as a signal, tricking the plant into activating a high light intensity response at plant level.

5. Conclusions

The aim of the present work was to evaluate the commercial benefits of growing lettuce indoors with artificial lighting compared to glasshouse production under Mediterranean climatic conditions. During this experiment, morphological and physiological characteristics were also measured. A significant increase of the biomass and quality characteristics as well as the photosynthetic capacity was observed in lettuces grown in the high PPFD treatment (HLI) of the vertical farm. Nitrate content analysis showed that when studying lettuce heads, the percentage of the daily nitrate intake were below the human threshold for all treatments. Whereas, in consuming 100 g of lettuce, only the vertical farming treatments (HLI and LLI) were below that threshold and therefore safe for consumption. These results further support the superiority of lettuces grown in vertical farms. Even though the outcome of this study supported that the use of the HLI treatment was able to produce lettuce plants of higher quality, in comparison to LLI and GT treatments, during winter in Athens, a large-scale experiment in a year-round cultivation period should be further investigated to draw accurate conclusions for the feasibility and appropriateness of vertical farming in Greece.

Author Contributions

Conceptualization, O.V., M.M. and D.S.; methodology, G.L. and D.S.; software, O.V., M.M. and G.N.; validation, O.V., M.M., G.N. and G.L.; formal analysis, O.V., M.M., G.N. and G.L.; investigation, O.V., M.M., G.N. and G.L.; resources, D.S. and G.L.; data curation, O.V., M.M., G.N. and G.L; writing—original draft preparation, O.V.; writing—review and editing, O.V., M.M., G.N., G.L. and D.S.; visualization, O.V.; supervision, D.S.; project administration, D.S.; funding acquisition, D.S. All authors have read and agreed to the published version of the manuscript.

Funding

This research received no external funding.

Institutional Review Board Statement

Not applicable.

Informed Consent Statement

Not applicable.

Conflicts of Interest

The authors declare no conflict of interest.

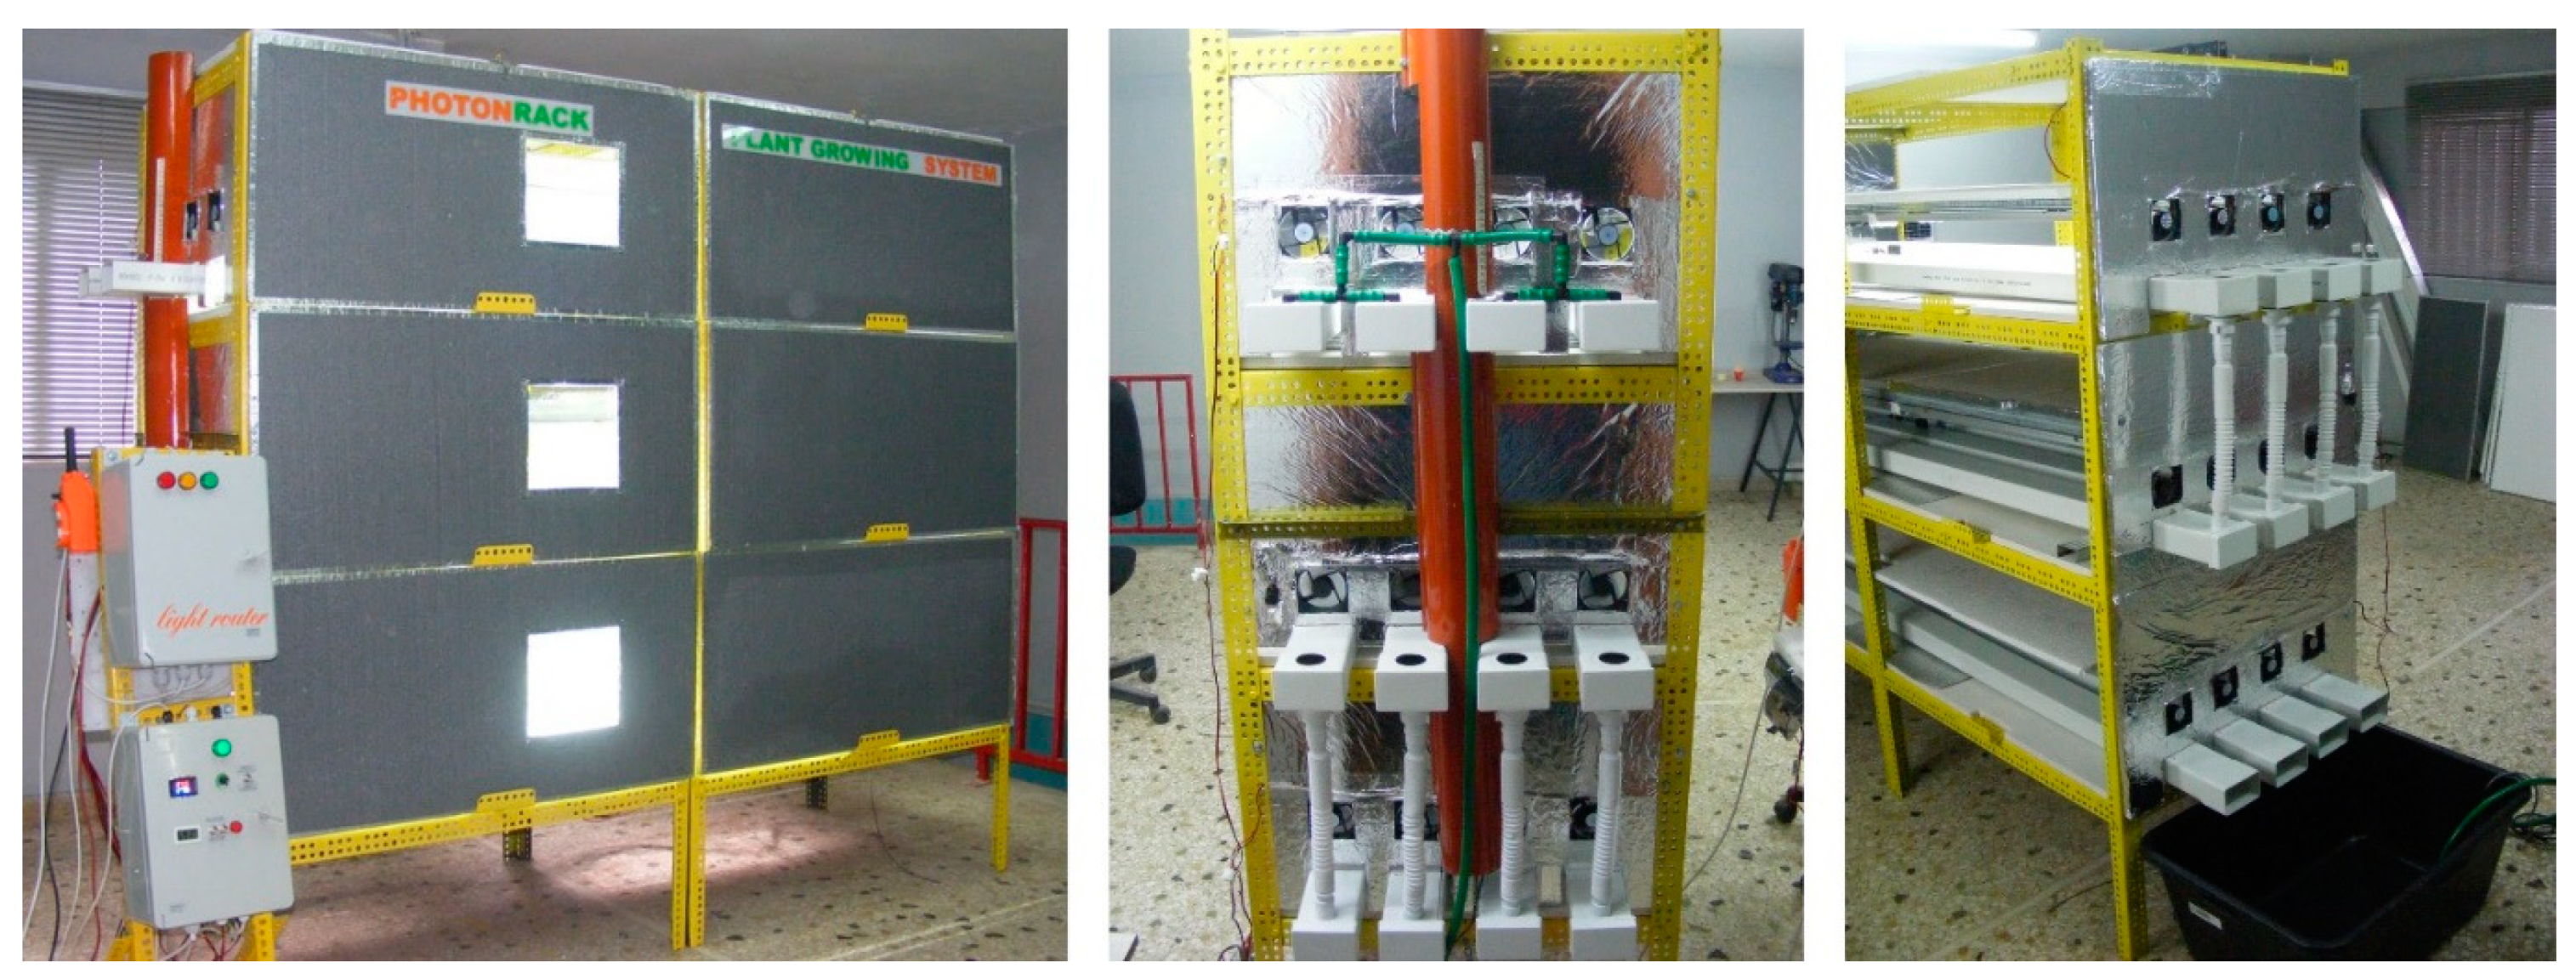
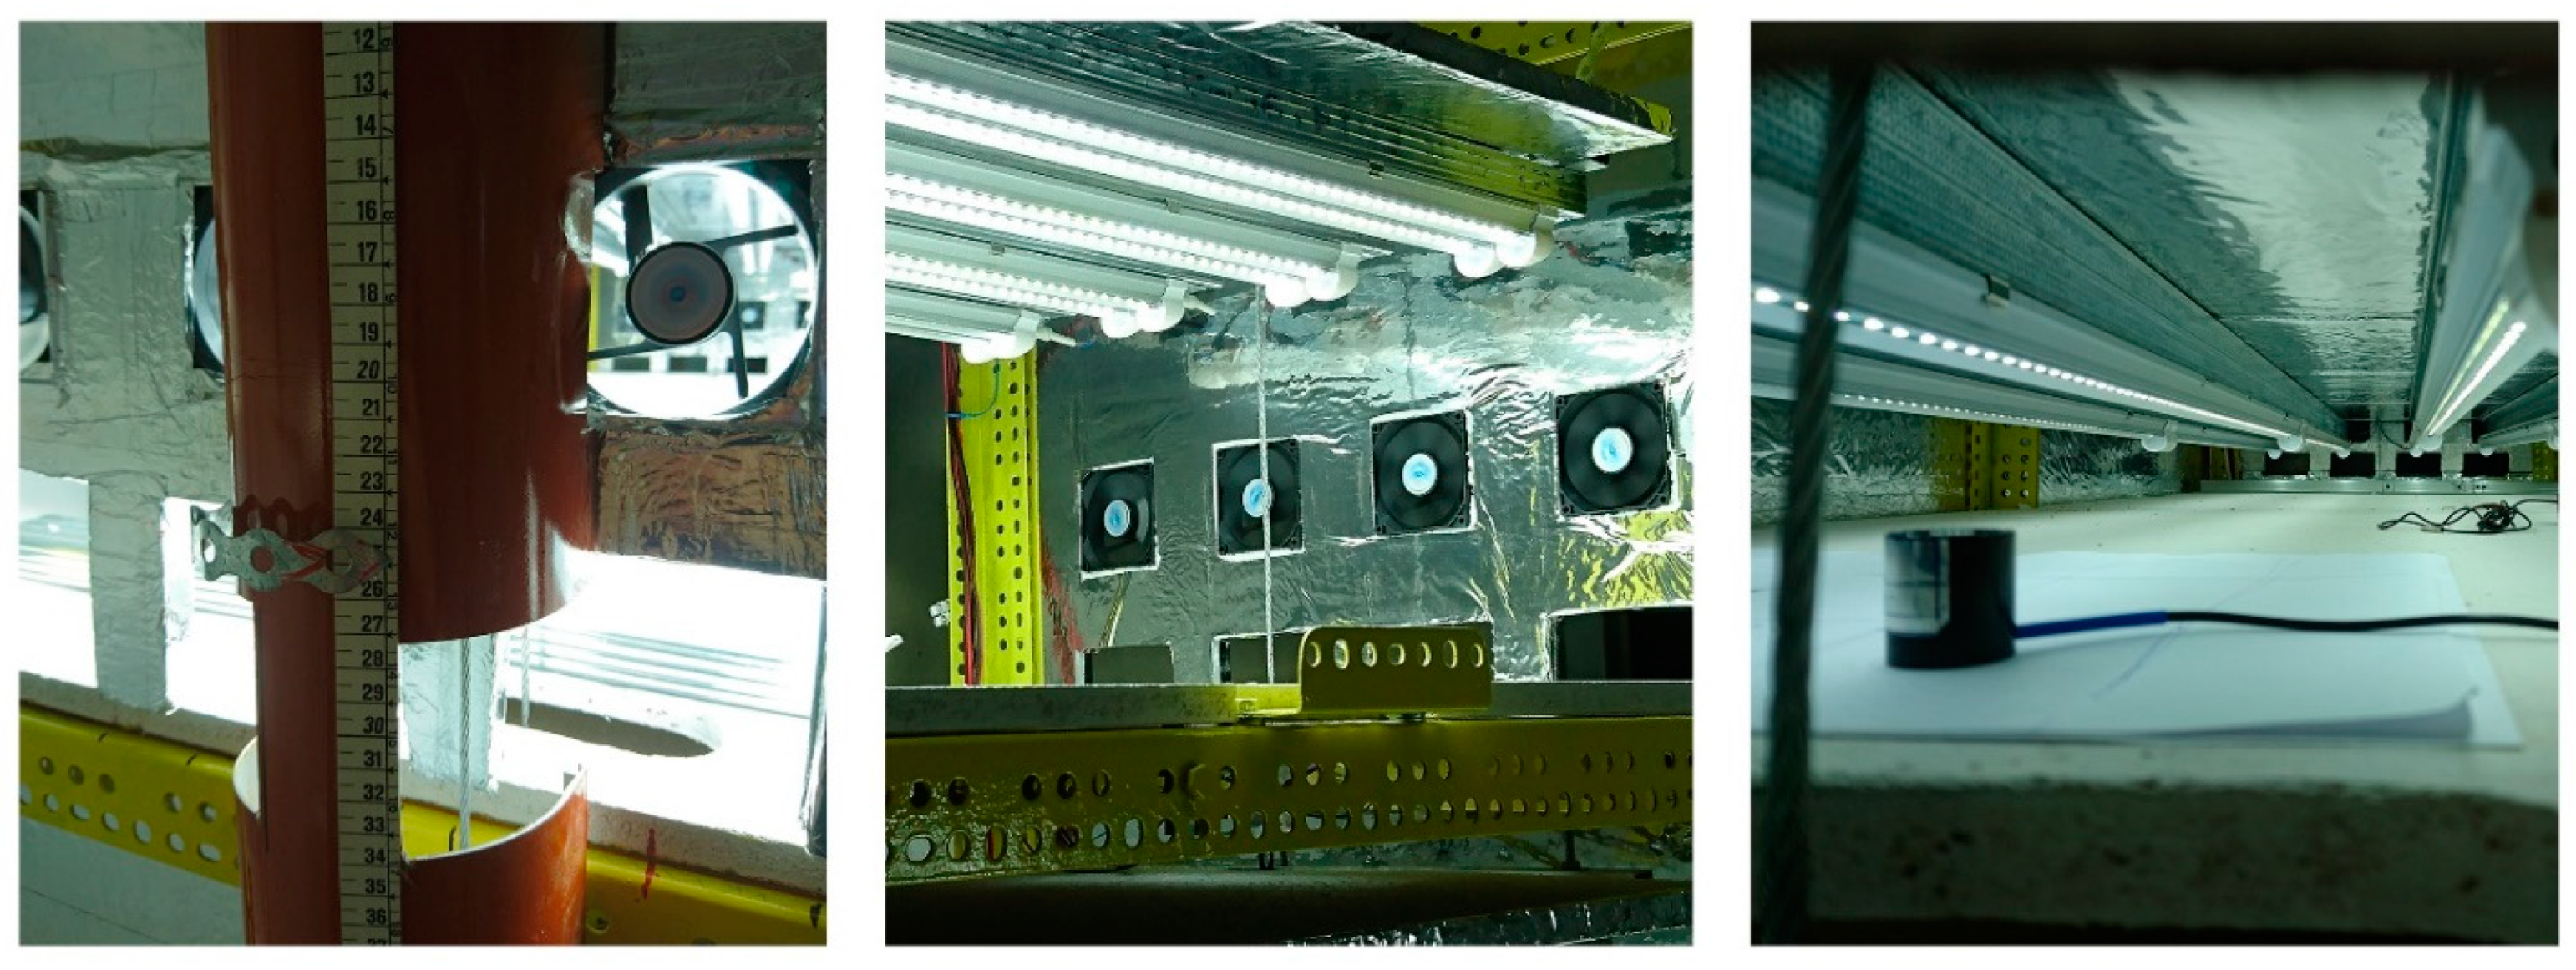
Appendix A. Photon Rack

Figure A1. Constriction of the Photon Rack (PR) system at K.Dekoulis Lab in Kallithea, Athens, Greece.
Agriculture 11 00503 g0a1
Figure A2. The photon flux density measurements were carried out using LI-188B Integrating quantum/Radiometer/Photometer, LI-COR INC, Lincoln, NE, USA. The LED tubes were attached on an aluminum base that allowed them to ascend and descend manually. The measuring tape indicated the distance between the LED tubes and the layer’s surface. The photometer was placed on a white A4 paper that was separated into 9 squares. Readings were recorded for each of those squares to completely map out the PPFD of each layer in relation to the LED tube’s distance which ranged from 10 cm to 40 cm.
Agriculture 11 00503 g0a2
Figure A3. The LED tubes of the High Light Intensity treatment (HLI) were stationary. The distance between the NFT gullies and the LED tubes was 40 cm. The distance between the plant canopy and LED tubes was decreased as the planτs grew due to their increase in height, unlike in the LLI treatment were the LED tubes ascended from 20 cm to 40 cm distance from the NFT gullies as the plants grew, until the point the reached the ceiling of the layer.
Agriculture 11 00503 g0a3

References

  1. Kozai, T.; Fang, W.; Chun, C.; Yang, Q.; Tong, Y.; Cheng, R.; Kubota, C.; Lu, C. Chapter 3—PFAL Business and R&D in the World: Current Status and Perspectives. In Plant Factory; Kozai, T., Niu, G., Takagaki, M., Eds.; Academic Press: San Diego, CA, USA, 2016; pp. 35–68. [Google Scholar]
  2. Savvas, D.; Passam, H.C. Hydroponic Production of Vegetable and Ornamentals; Embryo Publications: Athens, Greece, 2002. [Google Scholar]
  3. Abidi, F.; Girault, T.; Douillet, O.; Guillemain, G.; Sintes, G.; Laffaire, M.; Ahmed, H.B.; Smiti, S.; Huché-Thélier, L.; Leduc, N. Blue light effects on rose photosynthesis and photomorphogenesis. Plant Biol. 2013, 15, 67–74. [Google Scholar] [CrossRef]
  4. Kang, J.H.; KrishnaKumar, S.; Atulba, S.L.S.; Jeong, B.R.; Hwang, S.J. Light intensity and photoperiod influence the growth and development of hydroponically grown leaf lettuce in a closed-type plant factory system. Hortic. Environ. Biotechnol. 2013, 54, 501–509. [Google Scholar] [CrossRef]
  5. Zhang, X.; He, D.; Niu, G.; Yan, Z.; Song, J. Effects of environment lighting on the growth, photosynthesis, and quality of hydroponic lettuce in a plant factory. Int. J. Agric. Biol. Eng. 2018, 11, 33–40. [Google Scholar] [CrossRef]
  6. Inada, K.; Yasumoto, Y. Effects of light quality, daylength and periodic temperature variation on the growth of lettuce and radish plants. Jpn. J. Crop Sci. 1989, 58, 689–694. [Google Scholar] [CrossRef] [Green Version]
  7. Fu, Y.; Li, H.; Yu, J.; Liu, H.; Cao, Z.; Manukovsky, N.S.; Liu, H. Interaction effects of light intensity and nitrogen concentration on growth, photosynthetic characteristics and quality of lettuce (Lactuca sativa L. Var. youmaicai). Sci. Hortic. 2017, 214, 51–57. [Google Scholar] [CrossRef]
  8. Dou, H.; Niu, G.; Gu, M.; Masabni, J.G. Responses of sweet basil to different daily light integrals in photosynthesis, morphology, yield, and nutritional quality. HortScience 2018, 53, 496–503. [Google Scholar] [CrossRef]
  9. Lu, N.; Bernardo, E.L.; Tippayadarapanich, C.; Takagaki, M.; Kagawa, N.; Yamori, W. Growth and accumulation of secondary metabolites in perilla as affected by photosynthetic photon flux density and electrical conductivity of the nutrient solution. Front. Plant Sci. 2017, 8, 1–12. [Google Scholar] [CrossRef] [PubMed] [Green Version]
  10. Hernández, R.; Kubota, C. Growth and morphological response of cucumber seedlings to supplemental red and blue photon flux ratios under varied solar daily light integrals. Sci. Hortic. 2014, 173, 92–99. [Google Scholar] [CrossRef]
  11. Yan, Z.; He, D.; Niu, G.; Zhai, H. Evaluation of growth and quality of hydroponic lettuce at harvest as affected by the light intensity, photoperiod and light quality at seedling stage. Sci. Hortic. 2019, 248, 138–144. [Google Scholar] [CrossRef]
  12. Kozai, T.; Niu, G.; Takagaki, M. Plant Factory: An Indoor Vertical Farming System for Efficient Quality Food Production; Academic Press: Cambridge, MA, USA, 2015. [Google Scholar]
  13. Lin, K.-H.; Huang, M.-Y.; Huang, W.-D.; Hsu, M.-H.; Yang, Z.-W.; Yang, C.-M. The effects of red, blue, and white light-emitting diodes on the growth, development, and edible quality of hydroponically grown lettuce (Lactuca sativa L. var. capitata). Sci. Hortic. 2013, 150, 86–91. [Google Scholar] [CrossRef]
  14. Li, Q.; Kubota, C. Effects of supplemental light quality on growth and phytochemicals of baby leaf lettuce. Environ. Exp. Bot. 2009, 67, 59–64. [Google Scholar] [CrossRef]
  15. Senizza, B.; Zhang, L.; Miras-Moreno, B.; Righetti, L.; Zengin, G.; Ak, G.; Bruni, R.; Lucini, L.; Sifola, M.I.; El-Nakhel, C.; et al. The Strength of the Nutrient Solution Modulates the Functional Profile of Hydroponically Grown Lettuce in a Genotype-Dependent Manner. Foods 2020, 9, 1156. [Google Scholar] [CrossRef] [PubMed]
  16. Touliatos, D.; Dodd, I.C.; Mcainsh, M. Vertical farming increases lettuce yield per unit area compared to conventional horizontal hydroponics. Food Energy Secur. 2016, 5, 184–191. [Google Scholar] [CrossRef] [PubMed] [Green Version]
  17. Cometti, N.N.; Martins, M.Q.; Bremenkamp, C.A.; Nunes, J.A. Nitrate concentration in lettuce leaves depending on photosynthetic photon flux and nitrate concentration in the nutrient solution. Hortic. Bras. 2011, 29, 548–553. [Google Scholar] [CrossRef] [Green Version]
  18. Chen, Z.; Shah Jahan, M.; Mao, P.; Wang, M.; Liu, X.; Guo, S. Functional growth, photosynthesis and nutritional property analyses of lettuce grown under different temperature and light intensity. J. Hortic. Sci. Biotechnol. 2021, 96, 53–61. [Google Scholar] [CrossRef]
  19. Fu, W.; Li, P.; Wu, Y.; Tang, J. Effects of different light intensities on anti-oxidative enzyme activity, quality and biomass in lettuce. Hortic. Sci. 2012, 39, 129–134. [Google Scholar]
  20. Ferrón-Carrillo, F.; Guil-Guerrero, J.L.; González-Fernández, M.J.; Lyashenko, S.; Battafarano, F.; da Cunha-Chiamolera, T.P.L.; Urrestarazu, M. LED Enhances Plant Performance and Both Carotenoids and Nitrates Profiles in Lettuce. Plant Foods Hum. Nutr. 2021, 76. [Google Scholar] [CrossRef]
  21. Min, Q.; Marcelis, L.F.M.; Nicole, C.C.S.; Woltering, E.J. High Light Intensity Applied Shortly Before Harvest Improves Lettuce Nutritional Quality and Extends the Shelf Life. Front. Plant Sci. 2021, 12, 76. [Google Scholar] [CrossRef]
  22. Nicole, C.C.S.; Charalambous, F.; Martinakos, S.; Van De Voort, S.; Li, Z.; Verhoog, M.; Krijn, M. Lettuce growth and quality optimization in a plant factory. Acta Hortic. 2016, 1134, 231–238. [Google Scholar] [CrossRef]
  23. Bantis, F.; Ouzounis, T.; Radoglou, K. Artificial LED lighting enhances growth characteristics and total phenolic content of Ocimum basilicum, but variably affects transplant success. Sci. Hortic. 2016. [Google Scholar] [CrossRef] [Green Version]
  24. Song, J.; Huang, H.; Hao, Y.; Song, S.; Zhang, Y.; Su, W.; Liu, H. Nutritional quality, mineral and antioxidant content in lettuce affected by interaction of light intensity and nutrient solution concentration. Sci. Rep. 2020, 10, 1–9. [Google Scholar] [CrossRef] [Green Version]
  25. Fu, W.; Li, P.; Wu, Y. Effects of different light intensities on chlorophyll fluorescence characteristics and yield in lettuce. Sci. Hortic. 2012, 135, 45–51. [Google Scholar] [CrossRef]
  26. Baker, N.R. Chlorophyll Fluorescence: A Probe of Photosynthesis In Vivo. Annu. Rev. Plant Biol. 2008, 59, 80–113. [Google Scholar] [CrossRef] [PubMed] [Green Version]
  27. Savvas, D.; Voutsinos, O.; Mastoraki, M.; Liakopoulos, G.; Dekoulis, K.; Ntatsi, G. Exploring the possibility to use energy from solar panels to provide artificial light through LEDs in a vertical hydroponic crop of lettuce. Acta Hortic. 2020, 1296, 943–950. [Google Scholar] [CrossRef]
  28. Chen, X.-L.; Guo, W.-G.; Xue, X.-Z.; Wang, L.-C.; Qiao, X.-J. Growth and quality responses of “Green Oak Leaf” lettuce as affected by monochromic or mixed radiation provided by fluorescent lamp (FL) and light-emitting diode (LED). Sci. Hortic. 2014, 172, 168–175. [Google Scholar] [CrossRef]
  29. Chen, X.-L.; Xue, X.-Z.; Guo, W.-Z.; Wang, L.-C.; Qiao, X.-J. Growth and nutritional properties of lettuce affected by mixed irradiation of white and supplemental light provided by light-emitting diode. Sci. Hortic. 2016, 200, 111–118. [Google Scholar] [CrossRef]
  30. Snowden, M.C.; Cope, K.R.; Bugbee, B. Sensitivity of Seven Diverse Species to Blue and Green Light: Interactions with Photon Flux. PLoS ONE 2016, 11, e0163121. [Google Scholar] [CrossRef]
  31. Park, Y.; Runkle, E.S. Spectral effects of light-emitting diodes on plant growth, visual color quality, and photosynthetic photon efficacy: White versus blue plus red radiation. PLoS ONE 2018, 13, 1–14. [Google Scholar] [CrossRef] [Green Version]
  32. Mickens, M.A.; Skoog, E.J.; Reese, L.E.; Barnwell, P.L.; Spencer, L.E.; Massa, G.D.; Wheeler, R.M. A strategic approach for investigating light recipes for ‘Outredgeous’ red romaine lettuce using white and monochromatic LEDs. Life Sci. Sp. Res. 2018, 19, 53–62. [Google Scholar] [CrossRef]
  33. Kim, H.-H.; Goins, G.D.; Wheeler, R.M.; Sager, J.C. Green-light Supplementation for Enhanced Lettuce Growth under Red- and Blue-light-emitting Diodes. HortScience 2004, 39, 1617–1622. [Google Scholar] [CrossRef] [Green Version]
  34. Swan, B.V.; Bugbee, B. Increasing Blue Light from LED ’s Reduces Growth of Lettuce; Research Capitol Hill, Utah State University: Logan, UT, USA, 2017; p. 56. [Google Scholar]
  35. Liakopoulos, G.; Spanorigas, I. Foliar anthocyanins in Pelargonium × hortorum are unable to alleviate light stress under photoinhibitory conditions. Photosynthetica 2012, 50, 254–262. [Google Scholar] [CrossRef]
  36. Medrano, H.; Tomás, M.; Martorell, S.; Flexas, J.; Hernández, E.; Rosselló, J.; Pou, A.; Escalona, J.M.; Bota, J. From leaf to whole-plant water use efficiency (WUE) in complex canopies: Limitations of leaf WUE as a selection target. Crop J. 2015, 3, 220–228. [Google Scholar] [CrossRef] [Green Version]
  37. Novozamsky, I.; Houba, V.J.G.; van der Eijk, D.; van Eck, R. Notes on determinations of nitrate in plant material. Neth. J. Agric. Sci. 1983, 31, 239–248. [Google Scholar] [CrossRef]
  38. Brkić, D.; Bošnir, J.; Bevardi, M.; Gross Bošković, A.; Miloš, S.; Lasić, D.; Krivohlavek, A.; Racz, A.; Mojsović-Ćuić, A.; Trstenjak Uršulin, N. Nitrate in Leafy Green Vegetables and Estimated Intake. Afr. J. Tradit. Complement. Altern. Med. AJTCAM 2017, 14, 31–41. [Google Scholar]
  39. Ballaré, C.L.; Scopel, A.L.; Jordan, E.T.; Vierstra, R.D. Signaling among neighboring plants and the development of size inequalities in plant populations. Proc. Natl. Acad. Sci. USA 1994, 91, 10094–10098. [Google Scholar] [CrossRef] [PubMed] [Green Version]
  40. Ballaré, C.L. Illuminated behaviour: Phytochrome as a key regulator of light foraging and plant anti-herbivore defence. Plant Cell Environ. 2009, 32, 713–725. [Google Scholar] [CrossRef] [PubMed]
  41. Ballaré, C.L. Keeping up with the neighbours: Phytochrome sensing and other signalling mechanisms. Trends Plant Sci. 1999, 4, 97–102. [Google Scholar] [CrossRef]
  42. Nagashima, H.; Hikosaka, K. Plants in a crowded stand regulate their height growth so as to maintain similar heights to neighbours even when they have potential advantages in height growth. Ann. Bot. 2011, 108, 207–214. [Google Scholar] [CrossRef]
  43. Marchiori, P.E.R.; Machado, E.C.; Ribeiro, R.V. Photosynthetic limitations imposed by self-shading in field-grown sugarcane varieties. Field Crops Res. 2014, 155, 30–37. [Google Scholar] [CrossRef]
  44. Dougher, T.A.O.; Bugbee, B. Long-term blue light effects on the histology of lettuce and soybean leaves and stems. J. Am. Soc. Hortic. Sci. 2004, 129, 467–472. [Google Scholar] [CrossRef] [Green Version]
  45. Hytönen, T.; Pinho, P.; Rantanen, M.; Kariluoto, S.; Lampi, A.; Edelmann, M.; Joensuu, K.; Kauste, K.; Mouhu, K.; Piironen, V.; et al. Effects of LED light spectra on lettuce growth and nutritional composition. Light. Res. Technol. 2018, 50, 880–893. [Google Scholar] [CrossRef]
  46. Pinho, P.; Jokinen, K.; Halonen, L. The influence of the LED light spectrum on the growth and nutrient uptake of hydroponically grown lettuce. Light. Res. Technol. 2017, 49, 866–881. [Google Scholar] [CrossRef]
  47. Brazaityté, A.; Ulinskaité, R.; Duchovskis, P.; Samuoliené, G.; Siksnianienė, J.B.; Jankauskiené, J.; Sabqieviené, G.; Baranouskis, K.; Staniené, G.; Tamulaitis, G.; et al. Optimization Of Lighting Spectrum For Photosynthetic System And Productivity Of Lettuce By Using Light-Emitting Diodes. Acta Hortic. 2006, 711, 183–188. [Google Scholar] [CrossRef]
  48. Lillo, C. Light regulation of nitrate reductase in green leaves of higher plants. Physiol. Plant. 1994, 90, 616–620. [Google Scholar] [CrossRef]
  49. Rajasekhar, V.K.; Gowri, G.; Campbell, W.H. Phytochrome-Mediated Light Regulation of Nitrate Reductase Expression in Squash Cotyledons. Plant. Physiol. 1988, 88, 242–244. [Google Scholar] [CrossRef] [PubMed] [Green Version]
  50. Viršilė, A.; Brazaitytė, A.; Vaštakaitė-Kairienė, V.; Miliauskienė, J.; Jankauskienė, J.; Novičkovas, A.; Samuolienė, G. Lighting intensity and photoperiod serves tailoring nitrate assimilation indices in red and green baby leaf lettuce. J. Sci. Food Agric. 2019, 99, 6608–6619. [Google Scholar] [CrossRef]
  51. Habermeyer, M.; Roth, A.; Guth, S.; Diel, P.; Engel, K.H.; Epe, B.; Fürst, P.; Heinz, V.; Humpf, H.U.; Joost, H.G.; et al. Nitrate and nitrite in the diet: How to assess their benefit and risk for human health. Mol. Nutr. Food Res. 2015, 59, 106–128. [Google Scholar] [CrossRef] [PubMed]
  52. Walters, R.G. Towards an understanding of photosynthetic acclimation. J. Exp. Bot. 2004, 56, 435–447. [Google Scholar] [CrossRef]
  53. Weston, E.; Thorogood, K.; Vinti, G.; López-Juez, E. Light quantity controls leaf-cell and chloroplast development in Arabidopsis thaliana wild type and blue-light-perception mutants. Planta 2000, 211, 807–815. [Google Scholar] [CrossRef] [PubMed]
  54. Demmig-Adams, B.; Adams, W.W. Photoprotection and Other Responses of Plants to High Light Stress. Annu. Rev. Plant Physiol. Plant Mol. Biol. 1992, 43, 599–626. [Google Scholar] [CrossRef]
Figure 1. Schematic representation of the treatments. Low Light Intensity (LLI), High Light Intensity (HLI), Glasshouse Treatment (GT).
Agriculture 11 00503 g001
Figure 2. (a) Spectrum of LED lights used for this study, (b) Sun’s spectrum, during noon.
Agriculture 11 00503 g002
Figure 3. Average appearance of lettuce plants from each growing treatment at the harvest stage. Judged by visual inspection, the low light intensity in the Photon Rack (LLI) produced “vortex-like” morphology. The plants in the HLI and GT treatments were morphologically “normal”, while in the HLI they had a greener appearance. HLI, High light intensity; LLI, Low light intensity; GT, Glasshouse treatment.
Agriculture 11 00503 g003
Figure 4. ΦPSII (a), ETR (b), qP (c) and qN (d) of an average lettuce plant grown under each different treatment. HLI, High light intensity; LLI, Low light intensity; GT, Glasshouse treatment. Vertical bars indicate ± standard errors of means.
Agriculture 11 00503 g004
Figure 5. Net Photosynthetic Rate, A, (a), Transpiration rate, E, (b) of an average lettuce grown under each treatment’s conditions. HLI, High light intensity; LLI, Low light intensity; GT, Glasshouse treatment. Vertical bars indicate ± standard errors of means.
Agriculture 11 00503 g005
Figure 6. Stomatal conductance, gs, (a) intercellular CO2, ci, (b,c) water use efficiency (WUE) of an average lettuce grown under each treatment’s conditions. HLI, High light intensity; LLI, Low light intensity; GT, Glasshouse treatment. Vertical bars indicate ± standard errors of means.
Agriculture 11 00503 g006
Figure 7. Estimation of percentage of the daily intake of nitrate of each treatment per average lettuce head and per 100 g of fresh produce. HLI, High light intensity; LLI, Low light intensity; GT, Glasshouse treatment.
Agriculture 11 00503 g007
Table 1. Overview of the treatments’ characteristics and climate conditions studied.
TreatmentEnvironmental ConditionsAverage Light Intensity LocationCharacteristics
HLIT: 22 ± 1.5 °C, RH: 90 ± 10%, [CO2]: 400 ppm, Photoperiod: 12 h310 μmol m−2 s−1PR upper layer16 Conventional LED tubes
LLIT: 22 ± 1.5 °C, RH: 90 ± 10%, [CO2]: 400 ppm, Photoperiod: 12 h188 μmol m−2 s−1PR lower layer8 Conventional LED tubes
GTT: 20 ± 1.5 °C, RH: 64 ± 10%, [CO2]: 400 ppm, Photoperiod: 10 h144 μmol m−2 s−1GlasshouseSolar light
HLI: High light intensity; LLI: Low light intensity; GT: Greenhouse treatment; T: Temperature; RH: Relative humidity; PR: Photon Rack.
Table 2. Effect of different light intensities and hydroponic cropping system on growth and development of lettuce ‘Glory’ grown in a vertical farming system and in a glasshouse during the winter. HLI, High light intensity; LLI, Low light intensity; GT, Glasshouse treatment.
TreatmentFresh Shoot Weight
(g plant−1)
Dry Shoot Weight
(g plant−1)
Fresh Root Weight
(g plant−1)
Leaf Number (plant−1)Leaf Area
(cm2 plant−1)
Nitrate Concentration per Kg of Fresh Weight
(mg kg−1)
HLI123.3 a8.77 a17.8 a21.0 a2005.7 a1250 b
LLI64.9 b4.82 b9.4 b17.8 b1457.6 b1748 b
GT58.1 b4.12 b5.4 c15.2 c1358.9 b3578 a
Statistical significance******************
Mean (n = 10) followed by different letters indicate significant differences (for each comparison criteria stated) according to the Duncan’s multiple range test (p < 0.05), *** significant at p < 0.001.
Publisher’s Note: MDPI stays neutral with regard to jurisdictional claims in published maps and institutional affiliations.

