Article

The Performance of Oat-Vetch Mixtures in Organic and Conventional Farming Systems

by
Katarzyna Pużyńska
1,*,
Agnieszka Synowiec
1,
Stanisław Pużyński
2,*,
Jan Bocianowski
3,
Kazimierz Klima
1 and
Andrzej Lepiarczyk
1
1
Department of Agroecology and Crop Production, Faculty of Agriculture and Economics, University of Agriculture in Krakow, Mickiewicza 21, 31-120 Krakow, Poland
2
Malopolska Agricultural Advisory Centre, Osiedlowa 9, 32-082 Karniowice, Poland
3
Department of Mathematical and Statistical Methods, Poznań University of Life Sciences, Wojska Polskiego 28, 60-637 Poznań, Poland
*
Authors to whom correspondence should be addressed.
Agriculture 2021, 11(4), 332; https://doi.org/10.3390/agriculture11040332
Submission received: 19 January 2021 / Revised: 29 March 2021 / Accepted: 3 April 2021 / Published: 8 April 2021
(This article belongs to the Special Issue Productive and Ecological Aspects of Mixed Cropping System)

Abstract

:
The research aimed to compare the yields and yield components of mixtures of oats with common vetch grown for seeds in organic and conventional farming systems. Moreover, the selection of oat cultivars for the mixture and its performance in a crop rotation experiment in different growing years was analyzed. Additionally, the leaf area index (LAI) and the relative content of chlorophyll (SPAD) of the mixtures were assessed. The field experiment with four-field crop rotation in organic or conventional farming systems was carried out in 2012–2014 in southern Poland. Common vetch (Vicia sativa L., cv. ‘Hanka’) was mixed with one of two oat (Avena sativa L.) cultivars, ‘Celer’ or ‘Grajcar.’ The effects of all of the factors on the mixtures’ canopy indices and yield were found. The canonical analysis revealed that the weather course, especially drought, had the largest effect on the oat-vetch mixtures’ performance. Moreover, the mixtures developed the highest LAI (5.28 m2∙m−2) and seed yield (4.57 t ha−1) in the conventional farming system. On the contrary, the share of vetch seeds in the mixtures was 24% higher in the organic system than in the conventional one. The selection of cv. ‘Grajcar’ oats for the mixture with vetch increased the share of vetch seeds in the yield by 16.5%. In summary, a balanced share of oat-vetch mixture components depends on the proper selection of the oat cultivar, especially for organic farming systems.

1. Introduction

In Europe, cereal-legume mixtures have long been considered minor crops. However, interest in their cultivation has been growing in recent years, as they are considered an important element of agricultural diversification [1]. For example, in Poland, in 2019, the cultivation area of cereal-legume mixtures was 0.27% (29,300 ha) of the total arable land, of which the majority were spring mixtures [2]. The mixtures are cultivated in organic and sustainable agricultural systems [3,4]; they are cultivated mainly for high-protein fodder, green fodder, hay, or green manure [5,6,7,8].
Crop mixtures are essential for crop rotations in organic farming [9,10,11], contributing to several ecosystem services [12]; they are responsible for the maintenance of greater species diversity in crop-rotation [13,14], an increase in biologically bound nitrogen in soil [15,16], and a decrease in disease and pest outcomes [17]. Moreover, cereal-legume mixtures with varying rooting depth improve soil structure, i.e., by loosening deeper layers of soil [18,19], making mechanical operations easier. Contrarily, in conventional farming, which is cash-oriented, the role of cereal-legume mixtures is marginal. That is because mineral fertilizers and pesticides replace the mixtures’ nutritional and pesticide properties. There has been a trend in agriculture in recent years to shift from traditional conventional farming to sustainable, more environmentally friendly farming, increasing the inclusion of these mixtures in crop rotation [20].
One of the spring cereal-legume mixtures, relatively popular in cultivation in temperate climate, is oats with common vetch [21]. Both components of this mixture differ in soil and climatic requirements and agrotechnology. They offer a premise for an appropriate selection of species and cultivars, and proportions of mixture, for sowing [22]. According to many authors, crop mixtures’ yielding depends on the proper selection of cultivars [13,23,24,25]. Common vetch is a valuable component of these mixtures due to the high protein content of its seeds. However, vetch grown in a mixture with oats is characterized by little competitive potential, especially for light [26]. This translates into a lower growth of vetch that develops smaller seeds of lower nutrient content.
On the other hand, even though a highly competitive species in mixtures [27], oats support the companion crop from lodging [28]. The maximum demand for water and nutrients of both mixture components elapses during the vegetation. For that reason, interspecific competition in mixtures is lower than in the case of intraspecific competition in pure sowing [20].
Several indices measure the condition of the crop canopy, i.e., the leaf area index (LAI) and the leaf chlorophyll content (SPAD). The LAI informs about the leaves’ area, which is equal to the assimilation area [29]. On the other hand, the SPAD shows the relative content of chlorophyll in the leaves, translating into their nitrogen nutrition [30]. As a result, there is a relationship between the LAI and SPAD values and the seed yield [13,31,32]. Klima et al. [13] correlate higher values of LAI of spring cereals mixtures with higher mixtures’ yields than their pure sowings. However, the LAI of the oat-vetch mixture has not been studied so far.
The main aim of the study was to compare the yield and yield components of mixtures of oats (Avena sativa L.) with common vetch (Vicia sativa L.) in two farming systems differing in fertilization and plant protection means. The selection of oat cultivars on the yield of mixtures, including temperature and rainfall during 2012–2014, was also analyzed. Additionally, the leaf area index (LAI) of mixtures and the relative chlorophyll content (SPAD) in oats and vetch leaves were measured in two phases of plants’ growth.

2. Materials and Methods

2.1. Field Site and Experiment Descriptions

The four-field crop rotation: potato—winter wheat—oats and common vetch mixture—winter spelt, in a randomized split-split-plot design, has been carried out since 2009 in the Experimental Station Mydlniki-Kraków, Poland (50°04′ N, 19°51′ E, 280 m a.s.l., Figure 1), on Stagnic Luvisol (SL) soil [33]. All crops were present each year, which means that the mixture of oats and vetch was sown every year following the winter wheat.
The investigations for this paper were carried out in the years 2012–2014. The examined soil texture was loam developed from loess; pH (KCl) 6.04; Ntot 0.858 g kg−1; P 423.2 mg kg−1 soil; K 148.2 mg kg−1 soil; and Corg 7.34%.
The first factor of the experiment was the farming system: (i) organic—without any artificial mean; and (ii) conventional with synthetic pesticides and mineral fertilizers. The second factor was selecting the oat cultivars: ‘Celer’ or ‘Grajcar’ for the mixture with common vetch cv. ‘Hanka’. The course of temperature and precipitation in 2012–2014 was considered the third factor.
The oat and vetch mixtures were sown at the optimal agrotechnical dates for southern Poland, 23 March 2012; 16 April 2013; and 20 March 2014, at a planned density of plants per m−2 500 and 75 for the oats and vetch, respectively. The mixtures were sown on plots of 24 m2 area (3 × 8 m), using a plot drill (Hege 80) at a row space of 13.0 cm. A total of 16 plots were present each year (four replications for every mixture in both systems). Soil tillage was similar in organic and conventional plots. It consisted of a deep pre-winter plowing (October) and shallow seedbed tillage using an active harrow and a string roller (April).
Every four years, 30 tons of composted manure per hectare was used under potato in the conventional and organic system. A mineral fertilization (kg ha−1) of 80 N, 65 P, and 100 K was applied only in the conventional plots. The doses of fertilizers followed good agricultural practices and generally accepted principles of spring cereal cultivation. Nitrogen was applied as ammonium nitrate (34% N); one-third of the dose administered before sowing, and two-thirds as a top dressing. The potassium salt (60% K2O) and triple superphosphate (40% P2O5) were used in full doses before pre-winter plowing in October.
Additionally, in the conventional plots only, three-stage fungicide protection combined with pest control program was applied. Treatments were performed when the economic threshold of pests was exceeded, with a ca. one-month intervals between them. The following pesticides were used: fungicides—prochloraz + tebuconazole or thiophanate-methyl + conazole; insecticides—deltamethrin; beta-cyfluthrin or chlorpyrifos.
In the organic plots, only a mechanic weed control was performed each year by a Weeder harrow at the end of oats’ tillering and a manual weed removal before the mixture’s harvest.

2.2. Description of Cultivars

According to the breeders’ recommendations, the crop cultivars selected for this study are intended to cultivate mountainous areas of temperate climate, where they yield well.
The yellow-grained oat cv. ‘Celer’ has a 120 days to ripening phase BBCH 85 (German “Biologische Bundesanstalt, Bundessortenamt, und Chemische Industrie”) from sowing. The mass of a thousand grains is 41.0 g. The grains have a relatively high proportion of husk (28.2%). The protein and fat content of the grains are 6 (on a 9-point scale, where 9 means most favorable, 5—average 1—least favorable content). Plants are resistant to coronary and stem rust and of good resistance to other diseases. The cv. Celer is relatively short (90 cm), with high lodging resistance. The advised sowing rate of seeds is 550–600 m−2. Breeder: Małopolska Hodowla Roślin (HR), Sp. z o. o., Poland.
The oat cv.’Grajcar’ is an early sown cultivar of medium-early ripening, equal to 120 days to the ripening phase (BBCH 85) from sowing. It is a yellow-grained oat, with an average thousand-seed mass of (35.3 g). The grains have a relatively high proportion of husk (29.5%). The protein and fat content are 6 and 7, respectively. The plants are highly resistant to coronary and stem rust. It has average soil requirements. The plants are relatively short (89 cm). The advised sowing rate of seeds is 550–600 seeds m−2. Breeder: Małopolska Hodowla Roślin (HR), Sp. z o. o., Poland.
‘Hanka’ is common vetch (Vicia sativa L.) cultivar of a traditional type of growth, i.e., not self-ending. Plants are lush, 50–160 cm high, rich in leaves ending with sticking tendrils; seeds are brown. The cultivar is very fertile, with seeds of high protein (32%) and low tannins (0.05%). Seeds are ready for harvest 120 days after sowing. The thousand-grain mass is 52 g. It can be grown for seeds, green fodder, or green manure. The cultivar is appropriate for mixing with cereals. Breeder: Firma Nasienna Granum, Poland.

2.3. Leaf Area Index and Leaf Greenness Index

Two indexes of a canopy condition were measured. First, the leaf area index (LAI), characterizing the leaf assimilation area capable of absorbing photosynthetically active radiation (400–700 nm), using a SunScan Canopy Analysis System—SS1-COM Complete System (SunScan Canopy Analysis System, Delta-T Devices Ltd., Burwell, Cambridge, UK). Second, the leaf relative chlorophyll content in soil plant analysis development values (SPAD), using a 502DL chlorophyll meter (Minolta SPAD-502DL, Spectrum Technologies Inc., Plainfield, IL, USA).
The following formulas were used for the calculation of the LAI index (Equations (1) and (2)):
K ( x , θ ) : = x 2 + tan ( θ ) 2 x + 1.702 ( x + 1.12 ) 0.708
where:
  • x is the ellipsoidal leaf angle distribution parameter (ELADP),
  • θ is the zenith angle of the direct beam,
τ ( x , θ ) : = exp ( K ( x , θ ) L )
where:
  • τ is the gap fraction,
  • L is the leaf area index,
  • K(x,θ) is the extinction coefficient.
The measurement of relative chlorophyll content by the chlorophyll meter was according to the formula (Equation (3)):
M = k   log 10 I 0 ( 650 ) I ( 940 ) I ( 650 ) I 0 ( 940 )
where:
  • k is a confidential proportionality coefficient = 40;
  • I0(650) is the intensity of incident monochromatic light at 650 nm wavelength;
  • I(940) is the intensity of transmitted light at 940 nm wavelength;
  • I(650) is the intensity of transmitted light at 650 nm wavelength;
  • I0(940) is the intensity of incident monochromatic light at 940 nm wavelength.
The LAI and the SPAD measurements were performed each year on two dates, i.e., LAI1 and SPAD1 in the oats’ tillering phase (BBCH 29), and LAI2 SPAD2 in the grain watery ripe phase (BBCH 71). The SPAD measurements were performed separately for oats and vetch plants, while the LAI were measured for the mixtures’ canopy at four random spots per plot. The SPAD was measured on leaves of 25 plants of oats and vetch per plot. For the measurement, only fully developed leaves were chosen. The oat’s SPAD readings were taken from the middle part of the leaf blade; for vetch this area was the middle leaflet on the pinnate leaf.

2.4. Yield Measurements

Before harvesting, the oat and vetch plants were sampled to determine the number of oat panicles per m−2 and grains per panicle, and the number of vetch pods and seeds per pod. The plants were sampled from four random spots of 0.125 m−2 each (0.25 m × 0.5 m) across each plot, but three edge rows on both plot sides were omitted. All sampled plants were analyzed, and the results were recalculated to a 1 m2 area.
The harvest was carried out with a plot harvester (Seedmaster, Wintersteiger) at the oats’ fully ripe growth stage (BBCH 97). After the harvest, the oats’ grain and vetch seeds from each plot (24 m2) were weighed. Additional samples of grains and seeds (ca. 20–40 g) were taken to determine their dry mass at 105 °C for 24 h. The yield (t ha−1) was then calculated at 15% seed moisture. The thousand-grain mass of the oats and seeds of vetch were also determined.
The spatial arrangement of the experiment, with genotypes (cultivars) and farming systems including replications, is in Supplementary Figure S1. A flowchart of the methods is in Supplementary Figure S2.

2.5. Statistical Analysis of Results

The normality of the distribution of the observed traits was tested with Shapiro–Wilk’s normality test to check whether the analysis of variance (ANOVA) met the assumption that the ANOVA model’s residuals follow a normal distribution. Next, the effects of the main factors of the experiment: (i) farming system, (ii) oat cultivars, and (iii) years, and all the interactions between them, were estimated with a linear model for three-way ANOVA. The relationships between the traits were assessed based on Pearson’s correlation coefficients and tested with the t-test. Tukey’s test at p ≤ 0.05 tested the significance of mean differences.
The results were also analyzed with multivariate methods. The canonical variate analysis (CVA) was applied to present a multi-trait assessment of the similarity of the investigated treatments in a lower number of dimensions with the least possible loss of information. This enabled the graphic illustration of the variation in the traits of all treatments under analysis. The Mahalanobis distance was suggested as a measure of similarity of multi-trait treatments, whose significance was verified employing critical value Dcr known as the least significant distance. Pearson’s simple correlation coefficients were estimated between values of the first two canonical variates and values of the original individual traits to determine the relative share of each original trait in the multivariate variation of the treatments [34]. The GenStat v. 18 statistical software package was used for all the analyses. The GenStat v. 18 codes that have been implemented for the analyses are in Appendix A.

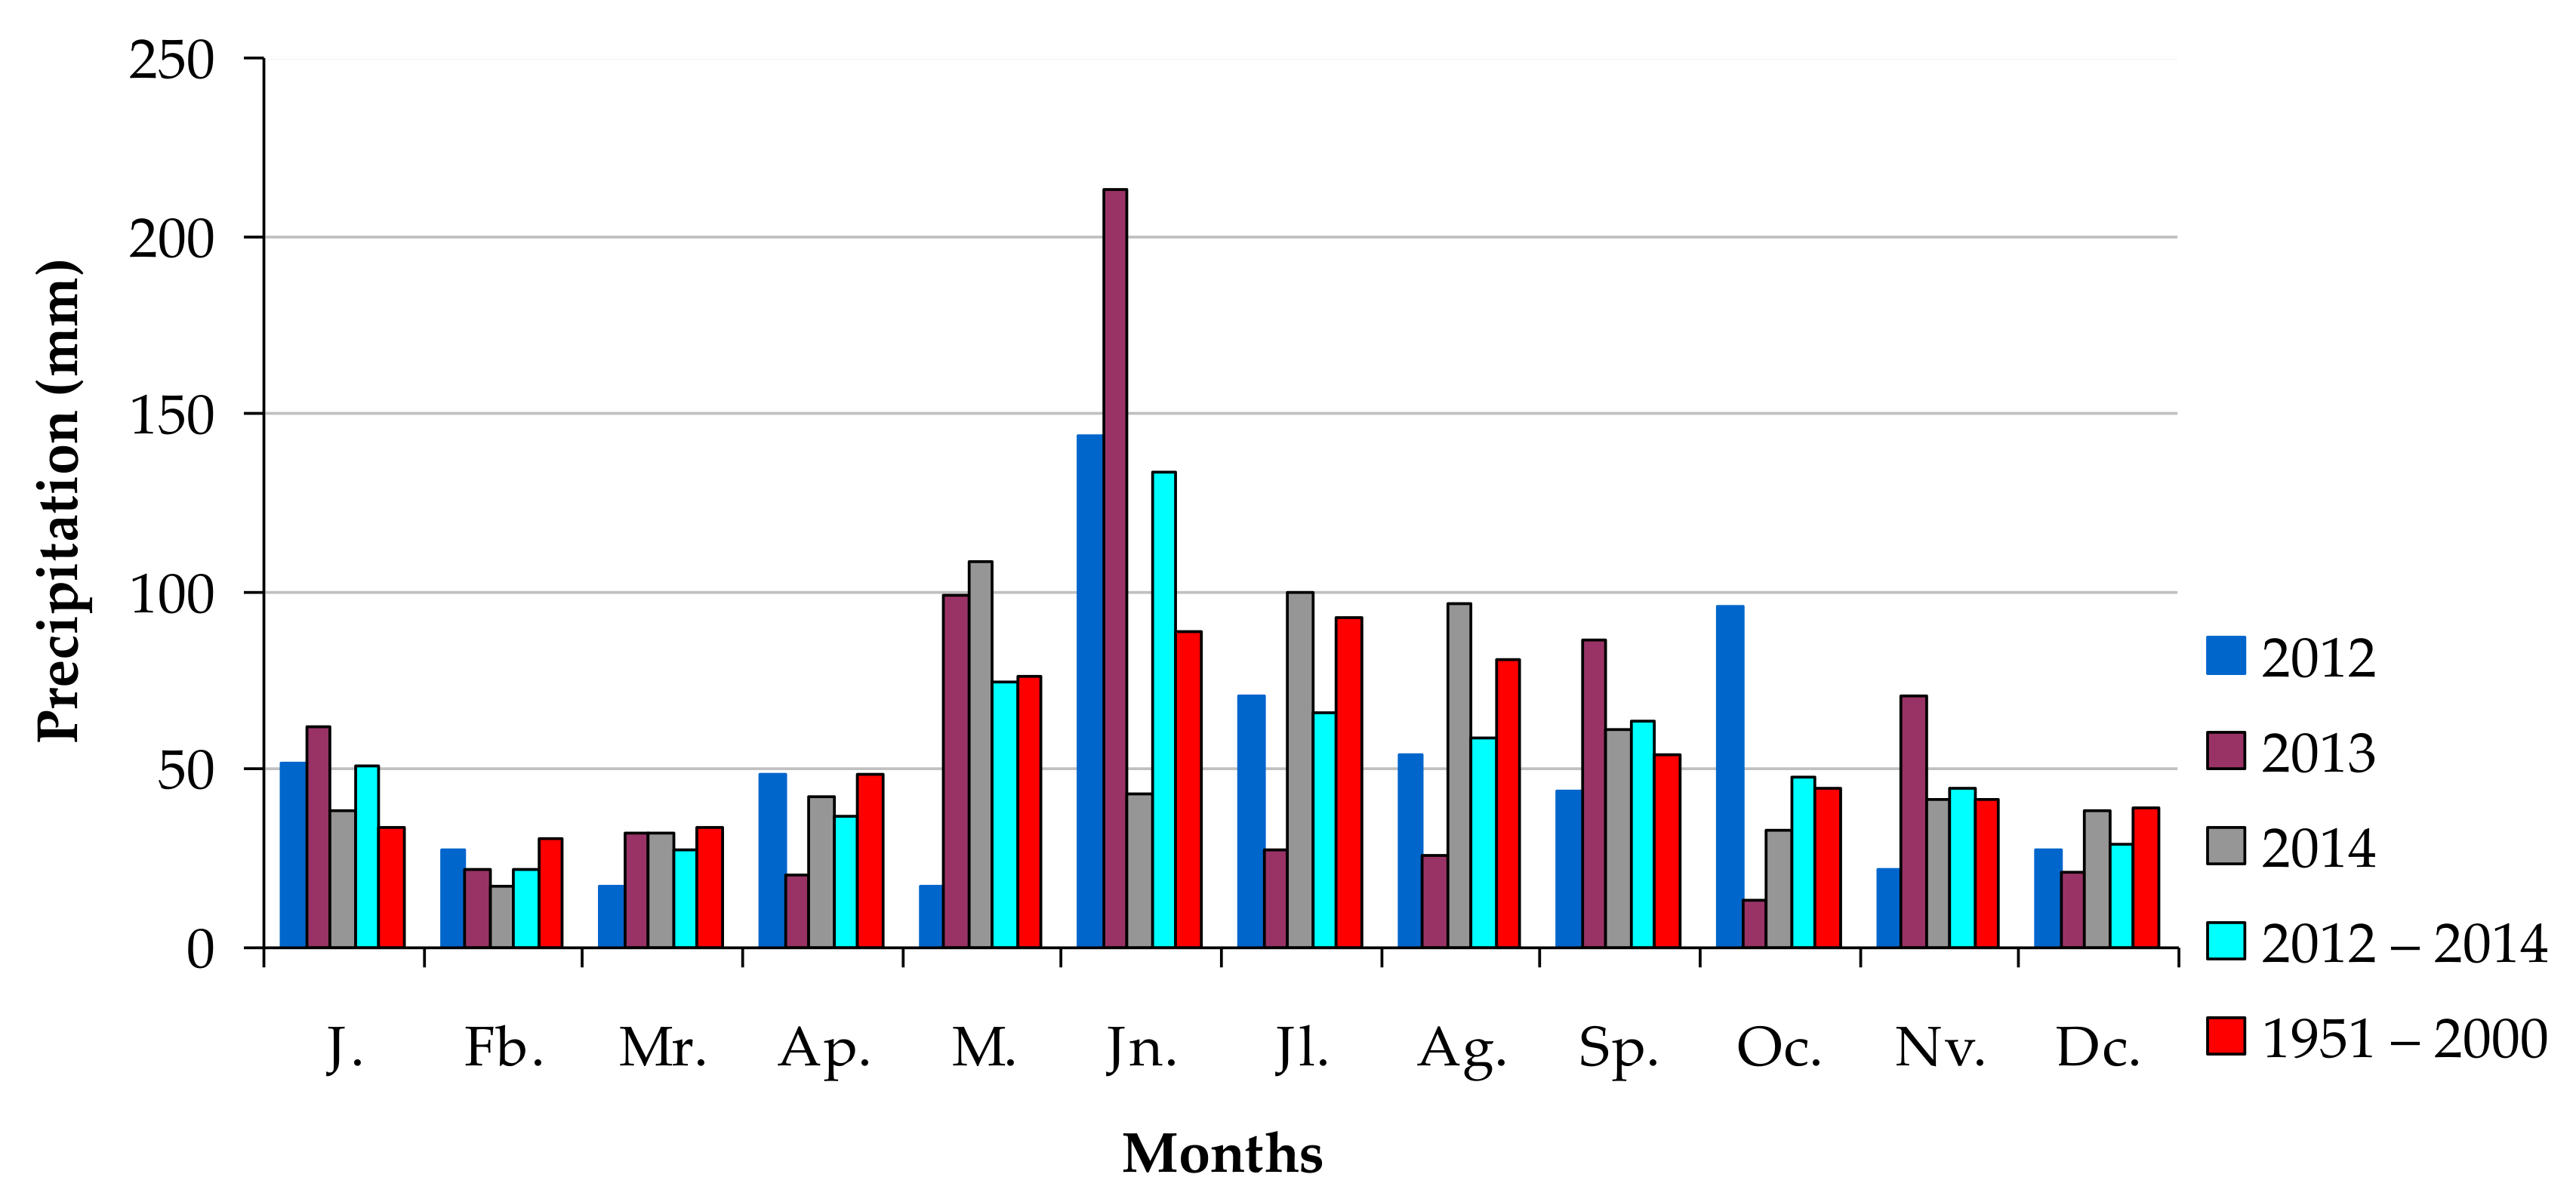
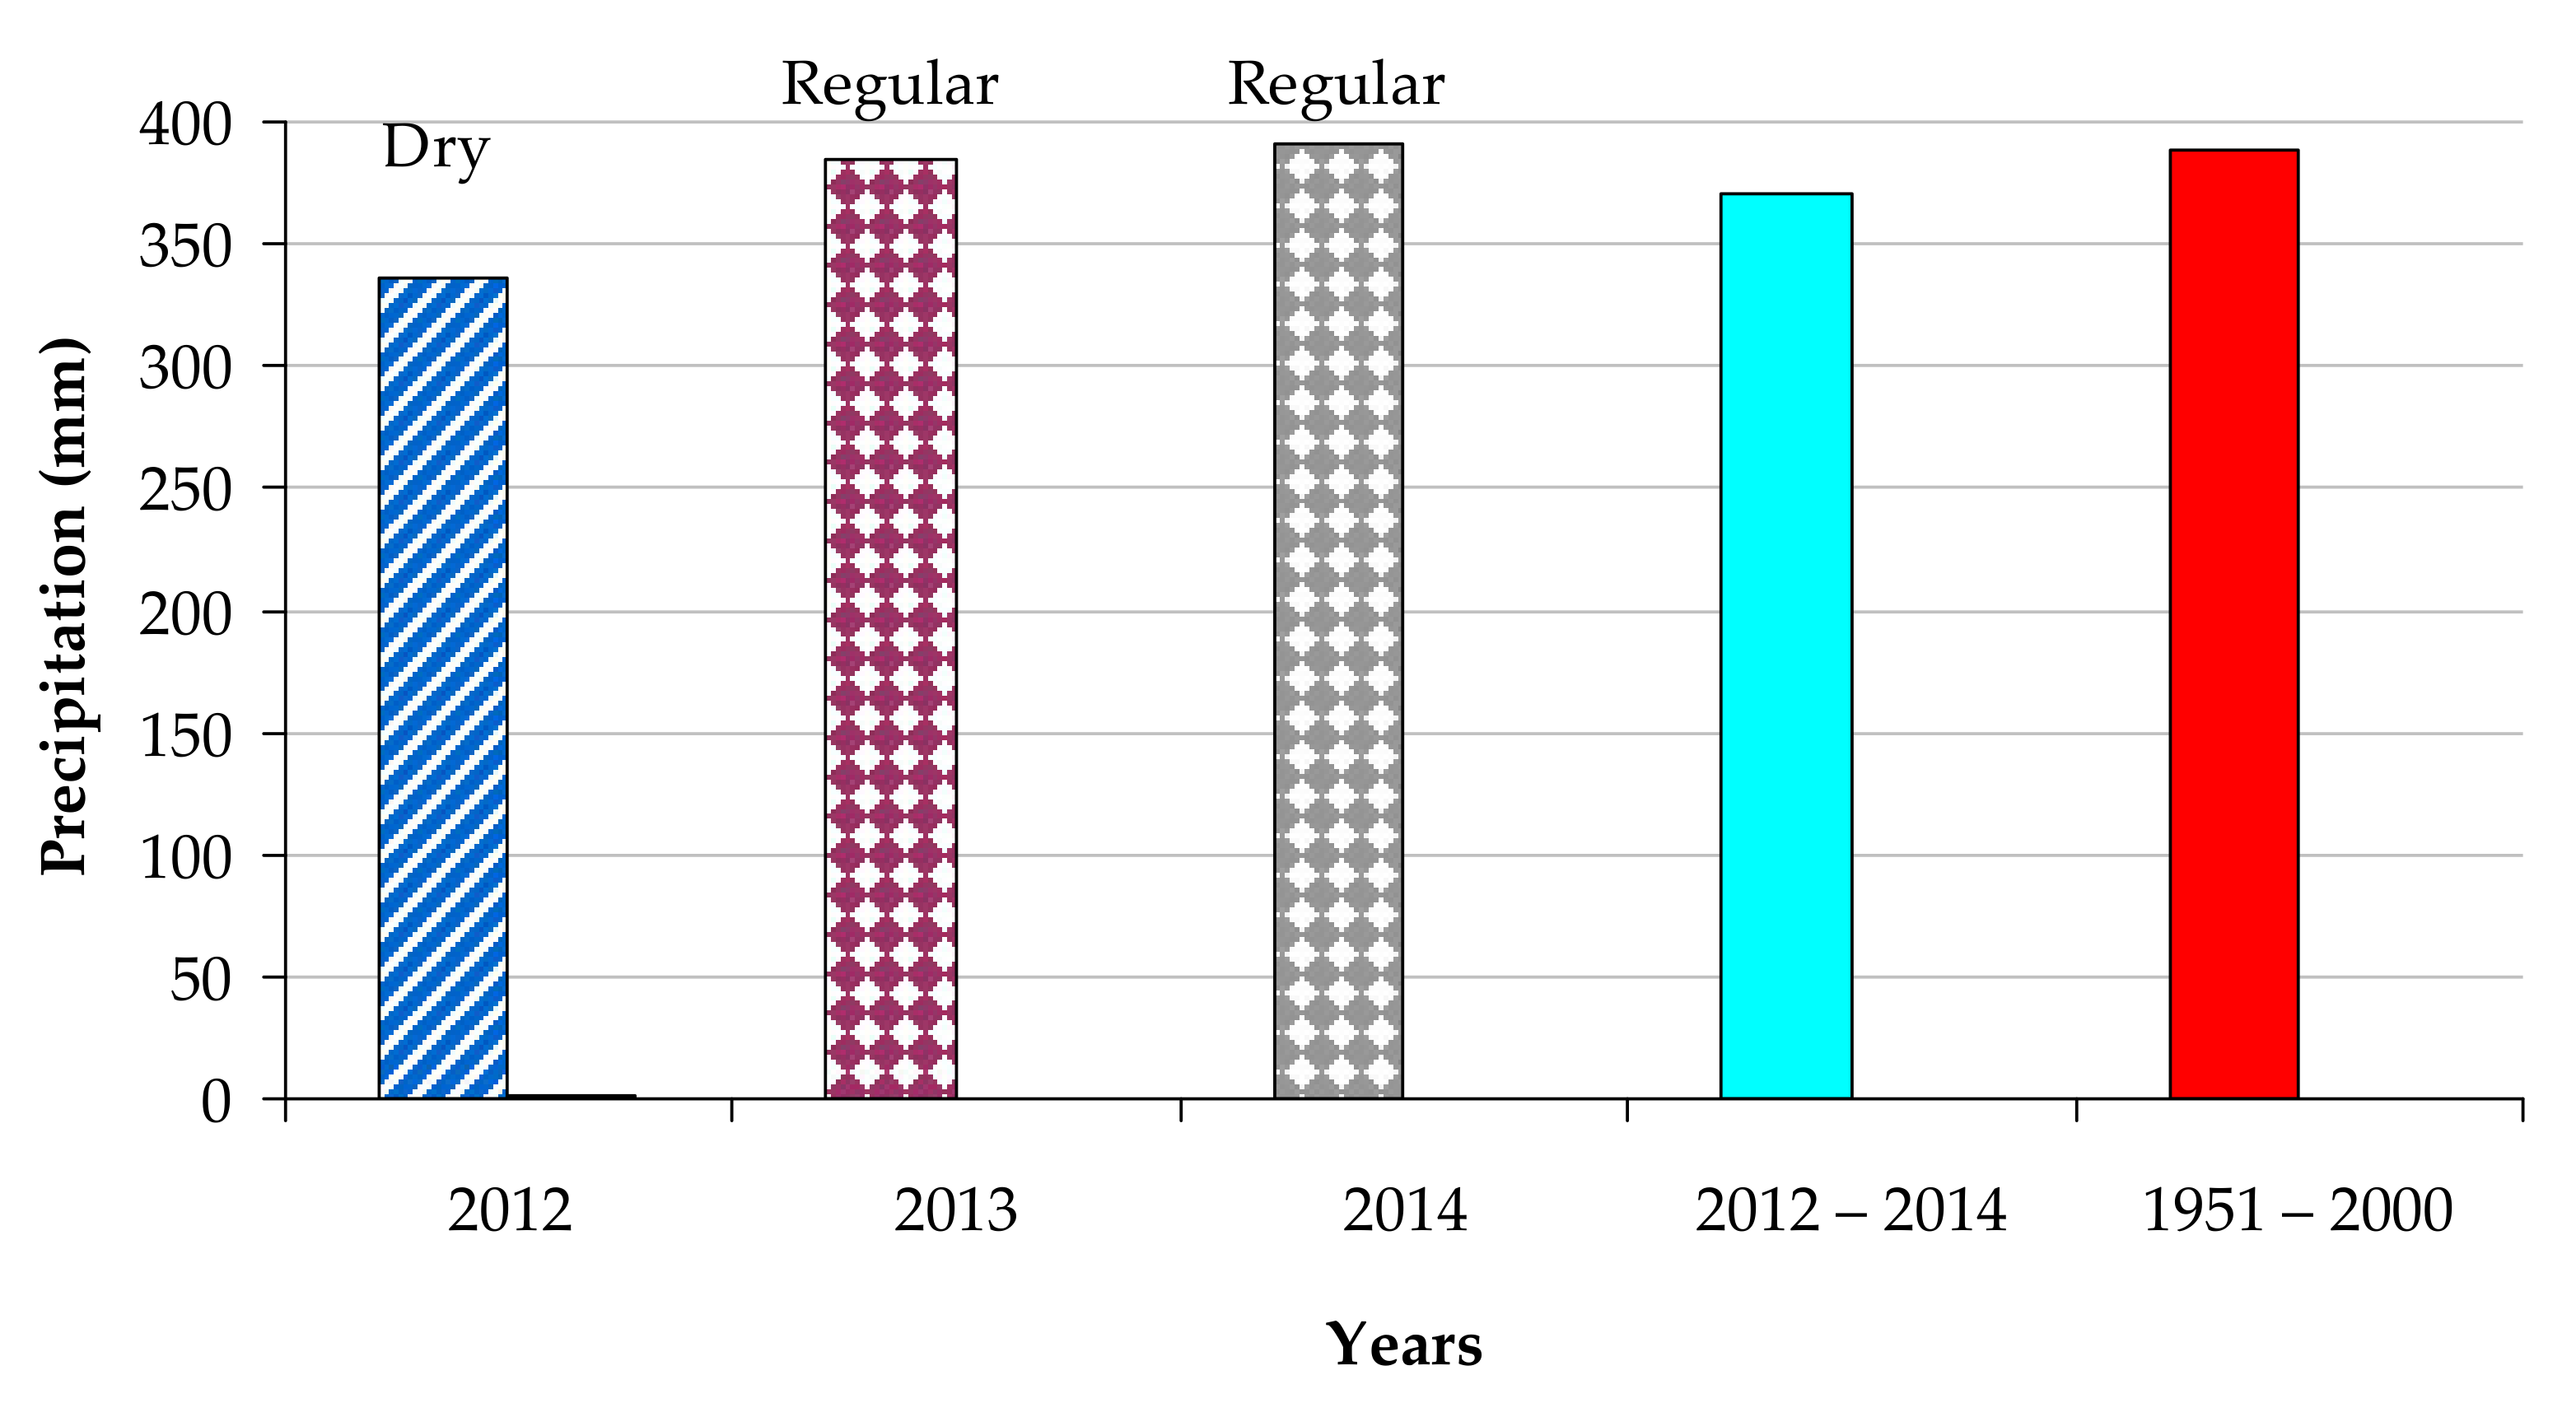
2.6. Weather Conditions

The weather data were collected from a meteorological station located in the Experimental Station Mydlniki-Kraków, Poland.
The sums of precipitation and the average daily air temperature in 2012–2014 differed from the standard multiyear period (1951–2000).
The humidity conditions (Figure 2) are based on the monthly precipitation for each study year. The distribution of precipitation in individual months is important for grain-legume mixture development. According to [35], the total rainfall during the vegetation period of oats in a temperate climate should range from 270 to 400 mm. The water demands of oats increase during their growth, reaching their highest values in June and July. The common vetch also has a high water demand, especially during flowering.
The amount of precipitation in individual months and years was characterized according to the criterion of [36] for southern Poland, which classifies each month and year as “regular”, or as one of three levels of “dryness”, or as one of three levels of “excessive rainfall”. The April–August of 2012 were dry (86% of the norm). During this year, the months of April and July were regular, May was very dry, August was dry, and June was very humid. The April–August of 2013 were classified as regular (99% of the norm). However, during this year, a large variation in precipitation was found, e.g., the months of April, July, and August were defined as very dry, May was humid, and June was extremely humid. The April–August of 2014 was regular (100.1% of the norm), with May classified as “wet” and June as “very dry” (Figure 3).
Large fluctuations in the air temperature were observed in individual months and years of the study (Figure 4). In all study years, the average temperature (°C) was higher than the standard multiyear period (1951–2000). The air temperature was classified based on deviations in individual months of the April–August period from the norm for Krakow (Poland), according to [37]. April and June 2012 were warm, while May, July, and August were very warm. In 2013, April and August were regular, May and June were warm, and July was extremely warm. In 2014, April was warm, and May, June, and August were regular. July 2014 was an extremely warm month.

3. Results

In our study, all quantitative traits had a normal distribution. The ANOVA indicated a statistically significant influence of years and the years’ × cultivar interaction for all eleven traits (Table S1).

3.1. Leaf Area and Leaf Greenness Indices

The leaf area index (LAI1) of the oat-vetch mixture measured in the tillering phase of oats was significantly differentiated (Table 1). The LAI1 of the mixtures in the conventional farming system was significantly higher (by 60%) than in the organic one. Additionally, the LAI1 was affected by the weather conditions, being the highest in the optimal year 2014 (1.60 m2 m−2), and the lowest in the year 2013 (0.90 m2 m−2), most probably due to a very dry April (Figure 4).
Interactions also differentiated the LAI1. Particularly, the interaction of oat cultivars and years was important, i.e., a significantly larger LAI1 was found in the mixture with cv. Celer in 2012, cv. Grajcar in 2013, and in 2014 the LAI1 was similar for both mixtures.
The LAI2 of the oat and vetch mixtures, measured at oats’ grain watery ripe (BBCH 71), was also significantly differentiated by the examined factors (Table 1). A higher LAI2 was again found in the conventional farming; however, the system’s difference diminished to 5%. Additionally, on average, the LAI2 of the mixture with oats cv. Celer was 6% higher, compared to the one with cv. Grajcar. It is worth mentioning that the LAI2 of mixtures with cv. Celer was similar, regardless of the farming system, whereas the LAI1 and LAI2 of mixtures with cv. Grajcar were higher in the conventional system by 41 and 11% compared to the organic one. The highest LAI2 value was again in a regular year, 2014, and the lowest in a dry 2012 year.
The oats’ leaf relative chlorophyll content (SPAD) was differentiated by the examined factors and their interactions (Table 2). In the oats tillering phase (o1), the oats leaf greenness index in the organic farming system was 6% higher than in the conventional farming. However, in the second term (o2), the difference between the farming systems diminished. Additionally, a significant difference was noted between the oats’ cultivars. Each time, higher SPAD values were found for the oats cv. Celer as compared to cv. Grajcar.
An interesting pattern was found for the oats’ SPAD concerning the years. In the oats’ tillering phase, higher chlorophyll content was noted in a regular 2014 year; however, in the watery ripe phase, the oats’ SPAD values were highest in the dry and warm 2012, i.e., by 18% compared to the 2014 year.
The chlorophyll content of the vetch was also significantly differentiated (Table 3). Contrary to oats, higher SPAD values for vetch were found in the conventional system, compared to the organic one, by 4% in v1 and v2 terms. A selection of oat cultivars to the mixture with vetch also differentiated the vetch’s chlorophyll content; in the v1 term, it was higher in the mixture with cv. Celer in comparison to the v2 term in the mixture with cv. Grajcar.
An interesting pattern of vetch’s chlorophyll content was noted concerning the years. In the v1 term, the SPAD of the vetch was similar for all the years. Contrarily, in the v2 term, the highest vetch SPAD values were noted in a regular year, 2014, and the lowest were noted in the dry 2012. This is the reverse of the oat’s SPAD values in the same term (SPADo2) (Table 4).

3.2. Yield of Mixtures and Their Components

The mixtures’ yield was 24% higher in the conventional system than the organic one (Table 4). An interaction was found for oat cultivars and years, e.g., the yield of the mixture with oats cv. Celer was significantly higher in a dry 2012 and a regular 2014, compared to 2013.
A significantly higher, by 38%, share of vetch seeds in the seed yield of mixtures was found in the organic system compared to the conventional one (Table 5). Additionally, on average, a higher share of vetch seeds was found in the mixture with oats cv. Grajcar, compared to oats cv. Celer. The share of vetch seeds in the yield was lowest in the dry 2012 and highest in the year 2013.
Oats produced more tillers per plant and more panicles per unit area in the conventional system (Table 6). Interestingly, even though oats cv. Grajcar produced more tillers in the mixture, as compared to the oats cv. Celer, Grajcar still had a lower number of panicles per area in comparison with Celer. The highest number of oats’ tillers and panicles was noted for both cultivars and farming systems in the dry year 2012. Despite a similar number of oats’ tillers in 2013 and 2014, there was a significant drop in the number of oat panicles per unit area in 2013, regardless of the farming system and oat cultivar.
Like the seed yield and the number of panicles per area, a significantly greater number of grains per oat panicle (by 31%) were present in the conventional system compared to the organic one (Table 7)—oats cv. Celer developed by 38% more grains per panicle in the mixtures, compared to the cv. Grajcar. It was found that the number of grains of cv. Celer was significantly higher in conventional farming, by 43%, compared to the organic one, whereas the number of grains of the cv. Grajcar was similar in both farming systems. The number of grains in the panicles was highest in the regular year 2014. In the other two years, the number of grains per panicle was similar.
The number of vetch pods per m−2 and the number of vetch seeds per pod (Table 8) followed, to some extent, the pattern of the share of vetch seeds in the mixture’s yield (Table 5). Compared to the conventional system, the number of vetch pods was 53% higher in the organic one. The highest number of vetch pods was found in 2013 in the mixture with cv. Grajcar. However, a significantly higher number of seeds per pod was noted in conventional farming over organic. The highest number of vetch seeds per pod was found in the mixture with cv. Grajcar in the regular year 2014. The weather also influenced the vetch pod and seed per pod production in a significant way. Interestingly, the highest number of pods per m−2 was found in the 2013 year, but the highest number of seeds per pod was found in the regular 2014 year (Table 8).
The thousand-grain mass (TGM) of oats was higher in the conventional system, whereas for vetch this was in the organic one (Table 9). Simultaneously, higher TGMs of both oats and vetch were noted in the mixtures with cv. Celer. The TGM of oat cv. Celer was similar, regardless of the farming system, but in the case of cv. Grajcar was by 7% higher in the conventional system than in the organic one. The TGM of vetch fitted well to this pattern, as it was similar in the mixture with Celer, but 13% lower in the mixture with cv. Grajcar in the conventional system, compared to the organic one. On average, the TGM of both oats and vetch was lowest in the dry 2012 and highest in the regular 2014 year.
The Pearson correlation coefficient analyses revealed several statistically significant interdependencies between the observed traits (Table S2, Figure 5). LAI1 (leaf area index in the oats’ tillering phase BBCH 29) was significantly positively correlated with: LAI2, leaf area index in the oats BBCH 71 phase; SPADo2, relative chlorophyll content in oat leaves in the oats BBCH 71 phase; yd, mixtures yield; no-p, number of oats panicles per m2; no-gr, number of oats grains per panicle, and no-sd, number of vetch seeds per pod. LAI2 was positively correlated with: SPADv2, relative chlorophyll content in vetch leaves in the oat BBCH 71 phase; sh-v, share of vetch in the mixture’s yield; no-gr; TGWo, thousand-grain mass of oats; TGWv, thousand-grain mass of vetch; no-pod, number of vetch pods per m2; and no-sd. SPADo2 was positively correlated with: yd and no-p; and negatively correlated with: SPADv2, sh-v, and no-pod. SPADv2 was positively correlated with: sh-v, TGWo, TGWv, no-pod, and no-sd; and negatively with yd and no-p. The yd was positively correlated with no-p and negatively correlated with sh-v, TGWv, no-pod, and no-sd. The sh-v was negatively correlated with no-p (−0.691) and positively with TGWo, TGWv, no-pod, and no-sd. The no-p negatively correlated with no-pod and no-sd. TGWo was positively correlated with no-gr, TGWv, and no-sd. TGWv positively correlated with no-pod and no-sd, and additionally, no-sd correlated with no-pod. SPADo1 was positively correlated with: LAI2, sh-v, no-gr, TGWo, TGWv, and no-sd; and negatively with yd and no-p. SPADv1 correlated positively with SPADo2 and SPADv1; and negatively with no-pod (Figure 5, Table S2).
The greatest diversity in all eleven traits, measured with Mahalanobis distances, was observed for the combination co-ce-12 (conventional variant-Celer-2012) and or-ce-13 (organic variant-Celer-2013) (Table S3). The Mahalanobis distance between them amounted to 74.44. The greatest similarity (distance: 11.73) was observed between co-ce-14 (conventional variant-Celer-2014) and co-gr-14 (conventional variant-Grajcar-2014).
The canonical analysis was performed to present the tested mixtures’ overall performances, based on all of the tested traits, for all of the three factors of this experiment (Figure 5). The first two canonical variates explained jointly 85.6% of the total variation between the treatments. The greatest, significant linear relationship with the first canonical variate was found for SPADv2, the share of vetch in the mixture’s yield, TGWv, number of vetch pods, number of vetch seeds per pod (positive dependencies), and SPADo2, the yield of mixture and number of panicles per m2 (negative dependencies). The second canonical variate was significantly positively correlated with LAI1, LAI2, and the number of vetch seeds per pod. The results point to the best performance of the mixtures in the conventional variant of the farming system and during the regular year 2014 (Figure 6). However, both mixtures performed well also in the organic system in 2014. The mixtures performed worst in both organic and conventional systems in 2012.

4. Discussion

The farming system affected the seed yield of mixtures by approximately 24% in favor of the mixtures grown conventionally, compared to those grown organically. These findings are consistent with several other studies [4,37,38,39,40,41,42,43] and result mainly from the direct growth- and yield-promoting effects of mineral nutrition of crops in the conventional system. However, Schram et al. [44] underline that crop yield differences between farming systems diminish with time; after 13 years, they amount to only 13% in favor of the conventional system over the organic one.
A detailed analysis revealed that the mixtures’ components, namely oats and common vetch, reacted differently to agricultural production intensification. The share of vetch seeds in the seed yield, number of pods per m2, and the thousand-seed mass of vetch were higher in an organic farming system. Reversely, oats yielded well in the conventional system. Under stressful conditions of a limited supply of soil resources, the legume component performs better than the cereal one, leading to the resilience of a total mixture yield [45]. Due to an extensive root system, legumes can activate phosphorus from organic compounds in the soil, mostly unavailable to cereals [46]. Moreover, they also use biologically bound nitrogen assimilated by the Rhizobium bacteria [47]. This effect clearly shows a complementarity of the components of the oat-vetch mixture. A proper selection of cereal components for mixture with a legume is of significance in this context. The interaction of oat cultivars and farming system variant, and the oat cultivar and year were observed in our study for almost all of the analyzed plant and canopy traits. In general, oats cv. Celer turned to be more competitive toward vetch in the mixture as compared to oats cv. Grajcar. Interestingly, both oat cultivars tested in this study were characterized by their breeder as having a very similar set of traits, i.e., time to ripening, thousand-grain mass, and plant height. The competitive effort of oat cultivars toward vetch was related to their productivity traits—specifically, even though oats cv. Grajcar developed more tillers in the mixture, as compared to cv. Celer they were less productive, i.e., displaying a lower density of panicles per m−2, a lower number of grains per panicle, and a lower thousand-grain mass. Contrarily, vetch was more productive in the mixture with cv. Grajcar as reflected by a higher number of vetch pods per m2, seeds per pod, and a share of vetch seeds in the mixture’s yield, compared to the mixture with cv. Celer. As a result, even though both mixtures had a similar total yield during the years of study, the mixture of oats cv. Grajcar and vetch cv. Hanka had a more optimal share of oats/vetch seeds in the yield than the mixture with cv. Celer. Noteworthy was the finding of the negative correlation of the mixture yield with the number of pods and percentage of vetch seeds in the mixture yield. The greater the yield of the mixture, the lower the percentage of vetch seeds. Contrarily, the lower the mixture’s yield, the greater the number of vetch pods per unit area. Both findings indicate strong competitive effects of oats toward vetch. Only a few studies discuss the influence of oat cultivar selection on the yield of the oat-vetch mixture, e.g., [48]. In our previous studies, we have shown that the oat cultivar is crucial for a good vetch yield, which is also influenced by the type of soil [49]. The share of vetch seeds in the mixture with oats is variable and influenced by several factors [50,51,52]. The main restrictions are weather conditions during the growing year. With low rainfall, vetch cannot withstand competition for water with oats, and its share in the yield is smaller [51,52,53].
In general, the leaf area index, which relates to the leaf assimilation area, and the leaf relative chlorophyll content (SPAD) were higher for the mixtures grown in the conventional system compared to the organic one. The LAI and chlorophyll content measured in SPAD values are good indices of the crop canopy status; many authors confirm their usefulness for estimating crop yields [54,55].
The results of the canonical analysis, performed for all of the tested factors, revealed that weather conditions were the main driver affecting the performance of the mixtures. The best year turned out a regular year, namely 2014. In 2012, a severe drought occurred in May and later in July, whereas June was very humid. In that year, regardless of oat cultivar and farming system variant, oats over-compete vetch by developing a significantly higher number of panicles than in 2013 and 2014. This shows that both oat cultivars tend to redistribute assimilates to produce higher grain yields in stressful conditions. This finding agrees with Zao et al. [56], who found a similar phenomenon in oats cv. Bia. According to those authors, under moderate drought stress there is a decreased biomass distribution to stems and leaves and a greater grain yield of oats. On the other hand, in 2013, when an excess of precipitation occurred in May and June and a severe drought in July and August, the share of vetch seeds in the mixtures’ yields was the highest and for oats this yield was the lowest. These results confirm the benefits of cultivating mixtures, namely maintaining a high yield of at least one mixture component in years with weather unfavorable for the other component of the mixture [57].

5. Conclusions

A greater share (by 62%) of vetch seeds in the mixture yield and a greater thousand-seeds mass of vetch (by 9.3%) was noted in the organic system. The proper selection of oat cultivar for mixing with vetch may support a higher share of vetch seeds in the yield. In this research, the less productive cultivar (with a lower number of panicles per m−2 and grains per panicle) was a better companion for vetch in the mixture. This study revealed that temperature and precipitation affect the final performance of the oat-vetch mixture. Under adverse weather conditions, a changeable share of both components of the mixture led to the yield compensation.
The canopy indices of the mixtures, LAI and SPAD, are diversified. However, the type of farming system and the oat cultivar selection significantly impact these traits. The LAI, SPAD, and the seed yield of mixtures were higher in the conventional farming system.
Summing up, the oat-vetch mixture is recommended for organic farming. However, the proper selection of the cereal component for this mixture is of high importance.

Supplementary Materials

The following are available online at https://www.mdpi.com/article/10.3390/agriculture11040332/s1, Figure S1: The spatial arrangement of replication with genotypes and management systems, Figure S2: Flowchart of methodology of the research; Table S1: Mean squares from three-way analysis of variance (ANOVA) for observed traits; Table S2: Correlation coefficients between the quantitative traits; Table S3: Mahalanobis distances between pairs of combinations of the three studied factors.

Author Contributions

Conceptualization, K.P. and S.P.; methodology, K.P. and S.P.; validation, A.L., K.K.; formal analysis, K.P., S.P., K.K., A.L., A.S.; investigation, K.P. and S.P.; data curation, K.P., S.P., J.B., and A.S.; writing—original draft preparation, K.P., A.S., S.P., writing—review and editing, KP, S.P., J.B., A.S.; visualization, K.P., S.P., J.B., A.S.; funding acquisition, K.P. and A.L. All authors have read and agreed to the published version of the manuscript.

Funding

This research was financed by the Ministry of Science and Higher Education of the Republic of Poland–partially, this research was funded by the Ministry of Science and Higher Education in Poland, for education in the years 2010–2015 as research project (grant no. N N310 446938).

Institutional Review Board Statement

Not applicable.

Informed Consent Statement

Not applicable.

Data Availability Statement

The data presented in this study are available on request from the corresponding authors.

Conflicts of Interest

The authors declare no conflict of interest.

Appendix A

The GenStat v. 18 codes:
JOB
IMPORT ‘Data.xls’;is=names
PRINT names
FOR Trait=LAI1,LAI2,SPADo1,SPADo2,SPADv1,SPADv2,yd,sh_v,no_p,no_gr,TGWo,TGWv,no_pod,no_sd
WSTATISTIC [p=test] Trait
ENDFOR
FOR Trait=LAI1,LAI2,SPADo1,SPADo2,SPADv1,SPADv2,yd,sh_v,no_p,no_gr,TGWo,TGWv,no_pod,no_sd
TREAT Year*System*Cultivar
BLOCK Repl/DuPol/MaPol
ANOVA [p=aovt,mean;fprob=y;pse=lsd;FACTORIAL=5] Trait
ENDFOR
TEXT [12] Name
READ Name
co_ce_12
co_gr_12
co_ce_13
co_gr_13
co_ce_14
co_gr_14
or_ce_12
or_gr_12
or_ce_13
or_gr_13
or_ce_14
or_gr_14:
SSPM [LAI1,LAI2,SPADo1,SPADo2,SPADv1,SPADv2,yd,sh_v,no_p,no_gr,TGWo,TGWv,no_pod,no_sd;group=Number] ssp
FSSPM ssp
CVA [p=roots,loadings,means,residuals,distances,tests] ssp;scores=cvm;DISTANCES=MahP
pen number=1;Labels=Name
DGRAPH [key=0] cvm$[*;2];cvm$[*;1]
TABULATE [p=mean;cl=Number] LAI1,LAI2,SPADo1,SPADo2,SPADv1,SPADv2,yd,sh_v,no_p,no_gr,TGWo,TGWv,no_pod,no_sd
FCORRELATION [p=corr,test] LAI1,LAI2,SPADo1,SPADo2,SPADv1,SPADv2,yd,sh_v,no_p,no_gr,TGWo,TGWv,no_pod,no_sd
ENDJOB

References

  1. Paut, R.; Sabatier, R.; Tchamitchian, M. Modelling crop diversification and association effects in agricultural systems. Agric. Ecosyst. Environ. 2020, 288, 106711. [Google Scholar] [CrossRef]
  2. Statistics Poland. Concise Statistical Yearbook of Poland; Zakład Wydawnictw Statystycznych: Warsaw, Poland, 2018. Available online: https://stat.gov.pl/files/gfx/portalinformacyjny/pl/defaultaktualnosci/5515/1/19/1/maly_rocznik_statystyczny_polski_2018.pdf (accessed on 20 May 2020).
  3. Kaut, A.H.E.E.; Mason, H.E.; Navabi, A.; O’Donovan, J.T.; Spaner, D. Organic and conventional management of mixtures of wheat and spring cereals. Agron. Sustain. Dev. 2008, 28, 363–371. [Google Scholar] [CrossRef] [Green Version]
  4. Klima, K.; Łabza, T. Yielding and economic efficiency of oats crops cultivated using pure and mixed sowing stands in organic and conventional farming systems. Żywn. Nauka. Technol. Jakość. 2010, 3, 141–147. [Google Scholar]
  5. Szpunar-Krok, E.; Bobrecka-Jamro, D.; Tobiasz-Salach, R. Yielding of naked oats and faba bean in Pure sowing and mixtures. Fragm. Agron. 2009, 26, 145–151. [Google Scholar]
  6. Jedel, P.E.; Salmon, D.F. Forage potential of spring and winter cereal mixtures in a short-year growing area. Agron. J. 1995, 87, 731–736. [Google Scholar] [CrossRef]
  7. Juskiw, P.E.; Helm, J.H.; Salmon, D.F. Forage yield and quality for monocrops and mixtures of small grain cereals. Crop. Sci. 2000, 40, 138–147. [Google Scholar] [CrossRef]
  8. Omokanye, A.; Lardner, H.; Lekshmi, S.; Jerey, L. Forage production, economic performance indicators and beef cattle nutritional suitability of multispecies annual crop mixtures in northwestern Alberta, Canada. J. Appl. Anim. Res. 2019, 47, 303–313. [Google Scholar] [CrossRef] [Green Version]
  9. Leszczyńska, D. State and conditions of cultivation of grain crops mixtures in Poland. J. Res. Appl. Agric. Eng. 2007, 52, 105–108. [Google Scholar]
  10. Leszczyńska, D. Actual state and conditions of cultivation of grain crops mixtures in Poland. J. Res. Appl. Agric. Eng. 2010, 55, 7–11. [Google Scholar]
  11. Staniak, M.; Księżak, J.; Bojarszczuk, J. Estimation of productivity and nutritive value of pea-barley mixtures in organic farming. J. Food Agric. Environ. 2012, 10, 318–323. [Google Scholar] [CrossRef]
  12. Blesh, J.; VanDusen, B.M.; Brainard, D.C. Managing ecosystem services with cover crop mixtures on organic farms. Agron. J. 2019, 111, 826–840. [Google Scholar] [CrossRef]
  13. Klima, K.; Synowiec, A.; Puła, J.; Chowaniak, M.; Pużyńska, K.; Gala-Czekaj, D.; Kliszcz, A.; Galbas, P.; Jop, B.; Dąbkowska, T.; et al. Long-term productive, competitive, and economic aspects of spring cereal mixtures in integrated and organic crop rotations. Agriculture 2020, 10, 321. [Google Scholar] [CrossRef]
  14. Gentsch, N.; Boy, J.; Guggenberger, G. Incorporation of diverse catch crop mixtures in crop rotation cycles increase biodiversity and nutrient availability in soils. In Horizonte des Bodens, Proceedings of the Jahrestagung der Deutsche Bodenkundliche Gesellschaft, Göttingen, Germany, 2–6 September 2017; DBG: Berlin, Germany, 2017. [Google Scholar]
  15. Blesh, J. Functional Traits in Cover Crop Mixtures: Biological Nitrogen Fixation and Multifunctionality. J. Appl. Ecol. 2018, 55, 38–48. [Google Scholar] [CrossRef] [Green Version]
  16. Lori, M.; Symnaczik, S.; Mäder, P.; De Deyn, G.; Gattinger, A. Organic farming enhances soil microbial abundance and activity—a meta-analysis and meta-regression. PLoS ONE 2017, 12, e0180442. [Google Scholar] [CrossRef]
  17. He, H.M.; Liu, L.N.; Munir, S.; Bashir, N.H.; Wang, Y.; Yang, J.; Li, C.Y. Crop diversity and pest management in sustainable agriculture. J. Integr. Agric. 2019, 18, 1945–1952. [Google Scholar] [CrossRef]
  18. Głąb, T.; Pużyńska, K.; Pużyński, S.; Palmowska, J.; Kowalik, K. Effect of organic farming on a Stagnic Luvisol soil physical quality. Geoderma 2016, 282, 16–25. [Google Scholar] [CrossRef]
  19. Saleem, M.; Pervaiz, Z.H.; Contreras, J.; Lindenberger, J.H.; Hupp, B.M.; Chen, D.; Zhang, Q.; Wang, C.; Iqbal, J.; Twigg, P. Cover Crop Diversity Improves Multiple Soil Properties via Altering Root Architectural Traits. Rhizosphere 2020, 16, 100248. [Google Scholar] [CrossRef]
  20. Gaudio, N.; Escobar-Gutiérrez, A.J.; Casadebaig, P.; Evers, J.B.; Gerard, F.; Louarn, G.; Colbach, N.; Munz, S.; Launay, M.; Marrous, H.; et al. Current knowledge and future research opportunities for modeling annual crop mixtures. A review. Agron. Sustain. Dev. 2019, 39, 20. [Google Scholar] [CrossRef] [Green Version]
  21. Pisulewska, E.; Klima, K.; Witkowicz, R.T.; Borowiec, F. Grain yield, fatty acid content and composition of oatscultivar Dukat as affected by sowing techniques. Food. Sci. Technol. Qual. 1999, 1, 246–252. [Google Scholar]
  22. Rudnicki, F. Biologiczne aspekty uprawy zbóż w mieszankach. In Stan i Perspektywy Uprawy Mieszanek Zbożowych; AR: Poznań, Poland, 1994; pp. 7–15. [Google Scholar]
  23. Kotwica, K.; Rudnicki, F. Production effects of growing spring cereal and cereal-and legume mixtures on good rye complex soil. Acta Sci. Pol. Agric. 2004, 3, 149–156. [Google Scholar]
  24. Rudnicki, F.; Wenda-Piesik, A.; Wasilewski, P. Sowing rate of components in pea-barley intercropping on the wheat soil complex. Zesz. Probl. Post. Nauk Rol. 2007, 516, 195–208. [Google Scholar]
  25. Klima, K.; Stokłosa, A.; Pużyńska, K. Agricultural and economic circumstances of cereal cultivation under differentiated soil and climate conditions. Zesz. Probl. Post. Nauk Rol. 2011, 559, 115–121. [Google Scholar]
  26. Ceglarek, F.; Rudziński, R.; Płaza, A.; Buraczyńska, D. Nutritive value of common vetch [Vicia sativa L.] grown in pure and mixed stands in the middle-east Poland. Zesz. Probl. Post. Nauk Rol. 2007, 516, 19–26. [Google Scholar]
  27. Sobkowicz, P.; Tendziagolska, E. Competition and Productivity in Mixture of Oats and Wheat. J. Agron. Crop Sci. 2005, 191, 377–385. [Google Scholar] [CrossRef]
  28. Artyszak, A. Dobór komponentów i skład mieszanek z udziałem jarych roślin strączkowych uprawianych na nasiona—Przegląd literatury. Post. Nauk Rol. 1993, 4, 81–87. [Google Scholar]
  29. Fang, H.; Baret, F.; Plummer, S.; Schaepman-Strub, G. An Overview of Global Leaf Area Index (LAI): Methods, Products, Validation, and Applications. Rev. Geophys. 2019, 57, 739–799. [Google Scholar] [CrossRef]
  30. Mendoza-Tafolla, R.O.; Juarez-Lopez, P.; Ontiveros-Capurata, R.-E.; Sandoval-Villa, M.; Alia-Tejacal, I.; Alejo-Santiago, G. Estimating Nitrogen and Chlorophyll Status of Romaine Lettuce Using SPAD and at LEAF Readings. Not. Bot. Horti Agrobot. Cluj Napoca 2019, 47. [Google Scholar] [CrossRef] [Green Version]
  31. Srinivasan, V.; Kumar, P.; Long, S.P. Decreasing, Not Increasing, Leaf Area Will Raise Crop Yields under Global Atmospheric Change. Glob. Change Biol. 2017, 23, 1626–1635. [Google Scholar] [CrossRef] [Green Version]
  32. Hirooka, Y.; Homma, K.; Maki, M.; Sekiguchi, K.; Shiraiwa, T.; Yoshida, K. Evaluation of the Dynamics of the Leaf Area Index (LAI) of Rice in Farmer’s Fields in Vientiane Province, Lao PDR. J. Agric. Meteorol. 2017, 73, 16–21. [Google Scholar] [CrossRef] [Green Version]
  33. IUSS Working Group WRB. World Reference Base for Soil Resources 2014, International Soil Classification System for Naming Soils and Creating Legends for Soil Maps—Update 2015; World Soil Resources Reports No. 106; FAO: Rome, Italy, 2014. [Google Scholar]
  34. Seidler-Łożykowska, K.; Bocianowski, J. Evaluation of variability of morphological traits of selected caraway (Carum carvi L.) genotypes. Ind. Crops Prod. 2012, 35, 140–145. [Google Scholar] [CrossRef]
  35. Dzieżyc, J. Czynniki Plonotwórcze Plonowanie Roślin; PWN: Warsaw, Poland, 1993; pp. 1–474. [Google Scholar]
  36. Kaczorowska, Z. Rainfall in Poland over a long-term cross-section. IG PAS Geogr. Work. 1962, 3, 117. [Google Scholar]
  37. Ziernicka, A. Classification of abnormalities in air temperature in southeast Poland. Zesz. Nauk. Akad. Rol. Kraków., Rol. 2001, 22, 5–18. [Google Scholar]
  38. Kirchmann, H.; Bergström, L.; Kätterer, T.; Andrén, O.; Andersson, R. Can Organic Crop Production Feed the World? In Organic Crop Production—Ambitions and Limitations; Springer: Dordrecht, The Netherlands, 2008; pp. 39–72. [Google Scholar]
  39. Murawska, B.; Piekut, A.; Jachymska, J.; Mitura, K.; Lipińska, K.J. Organic and Conventional Agriculture and the Size and Quality of Crops of Chosen Cultivated Plants. Pol. Akad. Nauk 2015, III/1, 663–675. [Google Scholar] [CrossRef]
  40. Sadowski, T.; Rychcik, B. Yield and chosen quality traits of oats grown in the period of conversion to organic cropping system. Acta Sci. Pol. Agric. 2009, 8, 47–55. [Google Scholar]
  41. Wesołowski, M.; Cierpiała, R. The effect of the ploughed-in type of stubble catch crop on yield and weed infestation of organically grown oats. Fragm. Agron. 2013, 30, 133–144. [Google Scholar]
  42. Klima, K.; Łabza, T.; Lepiarczyk, A. Participation of elements of cropping in the forming of the crop of glumiferous oats grown using traditional and organic systems. J. Res. App. Agric. Eng. 2014, 59, 115–118. [Google Scholar]
  43. Klima, K.; Smaczny, M. Yielding and competiveness of oats and spring vetch depending on cultivation system and sowing method. J. Res. App. Agric. Eng. 2015, 60, 146–149. [Google Scholar]
  44. Schrama, M.; de Haan, J.J.; Kroonen, M.; Verstegen, H.; Van der Putten, W.H. Crop Yield Gap and Stability in Organic and Conventional Farming Systems. Agric. Ecosyst. Environ. 2018, 256, 123–130. [Google Scholar] [CrossRef]
  45. Raseduzzaman, M.; Jensen, E.S. Does intercropping enhance yield stability in arable crop production? A meta-analysis. Eur. J. Agron. 2017, 91, 25–33. [Google Scholar] [CrossRef]
  46. Xue, Y.; Xia, H.; Christie, P.; Zhang, Z.; Li, L.; Tang, C. Crop Acquisition of Phosphorus, Iron and Zinc from Soil in Cereal/Legume Intercropping Systems: A Critical Review. Ann. Bot. 2016, 117, 363–377. [Google Scholar] [CrossRef]
  47. Albayrak, S.; Güler, M.; Töngel, M.Ö. Effects of seed rates on forage production and hay quality of vetch-triticale mixtures. Asian J. Plant Sci. 2004, 3, 752–756. [Google Scholar] [CrossRef] [Green Version]
  48. Lauk, R.; Lauk, E. Dual intercropping of common vetch and wheat or oats, effects on yields and interspecific competition. Agron. Res. 2009, 7, 21–32. [Google Scholar]
  49. Pużyńska, K.; Pużyński, S.; Synowiec, A.; Bocianowski, J.; Lepiarczyk, A. Grain Yield and Total Protein Content of Organically Grown Oats–Vetch Mixtures Depending on Soil Type and Oats’ Cultivar. Agriculture 2021, 11, 79. [Google Scholar] [CrossRef]
  50. Polishchuk, V.; Zuravel, S.; Kravchuk, M.; Klymenko, T. Organic technology of growing vetch and oatsmixture under condition of using organic and mineral preparations under different fertilization systems. Sci. Eur. 2020, 47, 4–12. [Google Scholar]
  51. Alemu, B.; Melaku, S.; Prasad, N.K. Effects of varying seed proportions and harvesting stages on biological compatibility and forage yield of oats (Avena sativa L.) and vetch (Vicia villosa R.) mixtures. Livest. Res. Rural. Dev. 2007, 19, 12. [Google Scholar]
  52. Pisulewska, E.; Klima, K. Plonowanie wyki siewnej uprawianej w warunkach górskich w zależności od jej udziału w mieszankach z owsem. Acta Agric. Silv. 1999, 37, 77–85. [Google Scholar]
  53. Behera, S.K.; Srivastava, P.; Pathre, U.V.; Tuli, R. An Indirect Method of Estimating Leaf Area Index in Jatropha Curcas L. Using LAI-2000 Plant Canopy Analyzer. Agric. Meteorol. 2010, 150, 307–311. [Google Scholar] [CrossRef]
  54. Wu, S.; Huang, J.; Liu, X.; Fan, J.; Ma, G.; Zou, J. Assimilating MODIS-LAI into Crop Growth Model with EnKF to Predict Regional Crop Yield. In Computer and Computing Technologies in Agriculture V, Proceedings of the International Conference on Computer and Computing Technologies in Agriculture (CCTA 2011), Beijing, China, 29–31 October 2011; Springer: Berlin/Heidelberg, Germany, 2012; pp. 410–418. [Google Scholar]
  55. Kwiatkowski, C.A.; Harasim, E. Chemical properties of soil in four-field crop rotations under organic and conventional farming systems. Agronomy 2020, 10, 1045. [Google Scholar] [CrossRef]
  56. Zhao, B.; Ma, B.L.; Hu, Y.; Liu, J. Source–Sink Adjustment: A Mechanistic Understanding of the Timing and Severity of Drought Stress on Photosynthesis and Grain Yields of Two Contrasting Oats (Avena sativa L.) Genotypes. J. Plant Growth Regul. 2020. [Google Scholar] [CrossRef]
  57. Reiss, E.R.; Drinkwater, L.E. Cultivar Mixtures: A Meta-analysis of the Effect of Intraspecific Diversity on Crop Yield. Ecol. Appl. 2018, 28, 62–77. [Google Scholar] [CrossRef]
Figure 1. Location of the study site. Source: https://www.google.com/maps/ (Accessed on 17 January 2021).
Agriculture 11 00332 g001
Figure 2. Sum of precipitation (mm) during the study.
Agriculture 11 00332 g002
Figure 3. The sum of precipitation (mm) in the April–August period in the years of study 2012–2014 compared to the multiyear (1951–2000). Descriptors dry and regular correspond to April–August periods of the 1951–2000 multiyear.
Agriculture 11 00332 g003
Figure 4. Mean temperatures (°C) during the study and in the 1951–2000 multiyear. Descriptors very warm and warm correspond to the 1951–2000 multiyear.
Agriculture 11 00332 g004
Figure 5. Heatmap for linear Pearson’s correlation coefficients between observed traits; rcr = 0.2875.
Agriculture 11 00332 g005
Figure 6. The distribution of all 12 combinations of farming systems, cultivars, and years of study in the two first canonical variates, based on all tested traits. In the diagram, the coordinates of a given combination of treatments are values of the first and second canonical variates. Co: conventional farming; or: organic farming; ce: Celer, gr: Grajcar; 2–4: years 2012–2014.
Agriculture 11 00332 g006
Table 1. Leaf area index (m2 m−2) of the oat-vetch mixture, measured at the oats tillering: LAI1 and the grain watery ripe phase; LAI2 for the farming system in 2012–2014.
Farming SystemYearsLAI1 at the Tillering of OatsLAI2 at the Oats Grain Watery Ripe Phase
Oat CultivarMean ± SD 1Oat CultivarMean ± SD
CelerGrajcarCelerGrajcar
Organic20121.030.890.96 ± 0.101.940.911.43 ± 0.73
20130.341.110.73 ± 0.541.811.731.77 ± 0.05
20141.191.091.14 ± 0.074.334.494.41 ± 0.11
Mean ± SD0.86 ± 0.451.03 ± 0.120.94 B2.69 ± 1.422.38 ± 1.882.53 B
Conventional20121.661.091.37 ± 0.401.240.991.12 ± 0.17
20130.841.301.07 ± 0.321.452.041.75 ± 0.42
20142.181.952.07 ± 0.165.284.915.09 ± 0.26
Mean ± SD1.56 ± 0.671.45 ± 0.451.50 A2.65 ± 2.272.65 ± 2.032.65 A
Mean20121.340.991.17 ± 0.25 y1.590.951.27 ± 0.45 z
20130.591.210.90 ± 0.43 z1.631.891.76 ± 0.18 y
20141.691.521.60 ± 0.12 x4.804.704.75 ± 0.07 x
Mean ± SD1.21 ± 0.561.24 ± 0.271.222.67 ± 1.84 a2.51 ± 1.95 b2.59
LSD 0.05 system0.1080.104
LSD 0.05 cultivarns 20.101
LSD 0.05 years0.1330.128
LSD 0.05 system × cultivar0.1170.142
LSD 0.05 system × years0.1870.180
LSD 0.05 cultivar × year0.1750.179
1 SD: standard deviation; 2 ns: non-significant. Homogeneous groups were created for the main factors. Mean values marked with the same letters are not significantly different according to Tukey’s test at a significance level p ≤ 0.05; Three-factors of experiment: (1) farming system variant—organic or conventional (letters A, B); (2) oat cultivars—Celer or Grajcar (letters a, b); (3) years—2012, 2013, and 2014 (letters x–z).
Table 2. The leaf chlorophyll content (relative content of chlorophyll) of oats in the mixtures with vetch, SPADo1—measured at oats tillering and SPADo2—measured at oats grain watery ripe phase, depending on the farming system and the oat cultivar in 2012–2014.
Farming SystemYearsSPADo1 at the Tillering of OatsSPADo2 at the Oats Grain Watery Ripe Phase
Cultivar of OatsMean ± SDCultivar of OatsMean ± SD
CelerGrajcarCelerGrajcar
Organic201239.838.239.0 ± 1.1263.963.063.4 ± 0.62
201340.035.937.9 ± 2.9329.936.833.4 ± 4.85
201443.444.844.1 ± 0.9548.051.249.6 ± 2.20
Mean ± SD41.1 ± 2.0739.6 ± 4.6340.3 A47.3 ± 17.050.3 ± 13.148.8
Conventional201230.339.735.0 ± 6.6863.143.253.1 ± 14.1
201341.735.138.4 ± 4.6444.437.440.9 ± 4.95
201442.538.640.6 ± 2.7751.847.349.6 ± 3.12
Mean ± SD38.1 ± 6.8537.8 ± 2.4238.0 B53.1 ± 9.4142.6 ± 4.9847.9
Mean201235.038.937.0 ± 2.78 y63.553.158.3 ± 7.36 x
201340.835.538.1 ± 3.79 y37.237.137.1 ± 0.05 z
201443.041.742.3 ± 0.91 x49.949.249.6 ± 0.46 y
Mean ± SD39.6 ± 4.13 a38.7 ± 3.13 b39.250.2 ± 13.2 a46.5 ± 8.33 b48.3
LSD 0.05 system1.59ns
LSD 0.05 cultivar0.8692.21
LSD 0.05 years1.413.05
LSD 0.05 system × cultivarns2.95
LSD 0.05 system × years1.994.03
LSD 0.05 cultivar × year1.844.16
For explanation, see Table 1.
Table 3. The leaf chlorophyll content (relative content of chlorophyll) of vetch in the mixtures with oats measured at oats tillering (SPADv1) and oats grain watery ripe phase (SPADv2), depending on the farming system and oats cultivar in 2012–2014.
Farming SystemYearsSPADv1 at the Tillering of OatsSPADv2 at the Oats Grain Watery Ripe Phase
Cultivar of OatsMean ± SDCultivar of OatsMean ± SD
CelerGrajcarCelerGrajcar
Organic201239.639.639.6 ± 0.0137.036.436.7 ± 0.37
201335.534.735.1 ± 0.5345.741.043.4 ± 3.32
201438.939.239.0 ± 0.2245.446.646.0 ± 0.83
Mean ± SD38.0 ± 2.2037.8 ± 2.6937.9 B42.7 ± 4.9741.3 ± 5.1042.0 B
Conventional201244.633.038.8 ± 8.2039.139.139.1 ± 0.00
201342.139.140.6 ± 2.1539.051.345.2 ± 8.66
201440.637.439.0 ± 2.2845.647.446.5 ± 1.27
Mean ± SD42.4 ± 1.9936.5 ± 3.1439.5 A41.3 ± 3.7745.9 ± 6.2143.6 A
Mean201242.136.339.2 ± 4.1138.037.837.9 ± 0.19 z
201338.836.937.8 ± 1.3442.446.144.3 ± 2.67 y
201439.838.339.0 ± 1.0345.547.046.3 ± 1.05 x
Mean ± SD40.2 ± 1.70 a37.2 ± 1.04 b38.742.0 ± 3.75 b43.6 ± 5.10 a42.8
LSD 0.05 system1.350.84
LSD 0.05 cultivar1.501.34
LSD 0.05 yearsns1.02
LSD 0.05 system × cultivar2.031.57
LSD 0.05 system × years2.26ns
LSD 0.05 cultivar × year2.261.44
For explanation, see Table 1.
Table 4. Seed yield (t ha−1) of oat-vetch mixtures depending on the farming system and oat cultivar in 2012–2014.
Farming SystemYearsCultivar of OatsMean ± SD
CelerGrajcar
Organic20124.104.134.12 ± 0.02
20132.172.082.13 ± 0.06
20142.312.442.38 ± 0.09
Mean ± SD2.86 ± 1.082.88 ± 1.092.87 B
Conventional20124.574.134.35 ± 0.31
20132.653.212.93 ± 0.40
20144.243.884.06 ± 0.25
Mean ± SD3.82 ± 1.023.74 ± 0.473.78 A
Mean20124.344.134.23 ± 0.15 x
20132.412.652.53 ± 0.17 z
20143.283.163.22 ± 0.08 y
Mean ± SD3.34 ± 0.963.31 ± 0.753.33
LSD 0.05 system0.038
LSD 0.05 cultivarns
LSD 0.05 years0.106
LSD 0.05 system × cultivarns
LSD 0.05 system × years0.128
LSD 0.05 cultivar × year0.137
For explanation, see Table 1.
Table 5. The share of vetch seeds (%) in the oat-vetch mixture yields depending on the farming system and oat cultivar in 2012–2014.
Farming SystemYearsCultivar of OatsMean ± SD
CelerGrajcar
Organic20125.1823.314.2 ± 12.8
201376.370.773.5 ± 3.97
201460.665.363.0 ± 3.28
Mean ± SD47.4 ± 37.453.1 ± 25.950.2 A
Conventional20121.213.912.56 ± 1.91
201351.845.048.4 ± 4.80
201429.754.442.0 ± 17.4
Mean ± SD27.6 ± 25.334.4 ± 26.831.0 B
Mean20123.2013.68.40 ± 7.36 z
201364.057.860.9 ± 4.38 x
201445.259.852.5 ± 10.4 y
Mean ± SD37.5 ± 31.1 b43.7 ± 26.1 a40.6
LSD 0.05 system2.70
LSD 0.05 cultivar2.85
LSD 0.05 years2.88
LSD 0.05 system × cultivarns
LSD 0.05 system × years4.07
LSD 0.05 cultivar × year4.07
For explanation, see Table 1.
Table 6. The average number of tillers per oat plant and number of oats panicles per m−2 in the oat-vetch mixtures, depending on the farming system and oat cultivar in 2012–2014.
Farming SystemYearsThe Average Number of Oats’ TillersThe Number of Oats Panicles per m−2
Cultivar of OatsMean ± SDCultivar of OatsMean ± SD
CelerGrajcarCelerGrajcar
Organic20121.371.701.54 ± 0.23602431517 ± 121
20131.241.401.32 ± 0.11108156132 ± 33.9
20141.281.351.31 ± 0.05208208208 ± 0.00
Mean ± SD1.29 ± 0.071.48 ± 0.191.39 B306 ± 261265 ± 146286 B
Conventional20121.731.831.78 ± 0.07645475560 ± 120
20131.551.731.64 ± 0.12123136129 ± 9.43
20141.431.481.45 ± 0.04313296305 ± 12.0
Mean ± SD1.57 ± 0.151.68 ± 0.181.62 A360 ± 264302 ± 170331 A
Mean20121.551.761.66 ± 0.15 x624453538 ± 121 x
20131.401.561.48 ± 0.12 y115146131 ± 21.7 z
20141.351.411.38 ± 0.04 y261252256 ± 6.01 y
Mean ± SD1.43 ± 0.10 b1.58 ± 0.18 a1.51333 ± 262 a284 ± 156 b308
LSD 0.05 system0.15910.9
LSD 0.05 cultivar0.1098.97
LSD 0.05 years0.10115.1
LSD 0.05 system × cultivarnsns
LSD 0.05 system × yearsns20.4
LSD 0.05 cultivar × yearns19.6
For explanation, see Table 1.
Table 7. The number of grains per oat panicle in the oat-vetch mixtures, depending on the farming system and oat cultivar in 2012–2014.
Farming SystemYearsCultivar of OatsMean ± SD
CelerGrajcar
Organic201213.220.817.0 ± 5.37
201321.67.714.7 ± 9.80
201419.215.817.5 ± 2.38
Mean ± SD18.0 ± 4.3314.8 ± 6.6016.4 B
Conventional201216.816.716.7 ± 0.04
201330.614.322.4 ± 11.5
201447.917.032.5 ± 21.8
Mean ± SD31.7 ± 15.616.0 ± 1.5023.9 A
Mean201215.018.716.9 ± 2.67 y
201326.111.018.5 ± 10.7 y
201433.616.425.0 ± 12.1 x
Mean ± SD24.9 ± 9.35 a15.4 ± 3.97 b20.1
LSD 0.05 system2.85
LSD 0.05 cultivar3.98
LSD 0.05 years4.40
LSD 0.05 system × cultivar4.86
LSD 0.05 system × years5.80
LSD 0.05 cultivar × year6.22
For explanation, see Table 1.
Table 8. The pod number per m2 and seed number per pod of vetch grown in the oat-vetch mixtures, depending on the farming system and oat cultivar in 2012–2014.
Farming SystemYearsNo. of Vetch Pods per m2No. of Seeds per Pod
Cultivar of OatsMean ± SDCultivar of OatsMean ± SD
CelerGrajcarCelerGrajcar
Organic2012152190171 ± 272.733.232.98 ± 0.35
2013567948758 ± 2694.725.014.86 ± 0.21
2014414714564 ± 2126.186.996.59 ± 0.57
Mean ± SD378 ± 210617 ± 388497 A4.54 ± 1.735.08 ± 1.884.81 B
Conventional2012407658 ± 252.972.232.60 ± 0.52
2013326224275 ± 725.015.185.10 ± 0.12
2014257488373 ± 1637.337.587.46 ± 0.18
Mean ± SD208 ± 149263 ± 209235 B5.11 ± 2.185.00 ± 2.685.05 A
Mean201296133115 ± 26 z2.852.732.79 ± 0.09 z
2013447586516 ± 99 x4.865.094.98 ± 0.16 y
2014335601468 ± 188 y6.767.297.02 ± 0.38 x
Mean ± SD293 ± 179 b440 ± 266 a366 ±4.82 ± 2.0 b5.04 ± 2.28 a4.93
LSD 0.05 system49.60.07
LSD 0.05 cultivar31.40.21
LSD 0.05 years38.70.24
LSD 0.05 system × cultivar44.40.22
LSD 0.05 system × years54.80.29
LSD 0.05 cultivar × year54.60.35
For explanation, see Table 1.
Table 9. The thousand-grain mass (TGM) of oats and vetch (g) in the oat-vetch mixture, depending on the farming system and oat cultivar in 2012–2014.
Farming SystemYearsTGM of OatsTGM of Vetch
Cultivar of OatsMean ± SDCultivar of OatsMean ± SD
CelerGrajcarCelerGrajcar
Organic201237.530.133.8 ± 5.2251.651.951.8 ± 0.17
201342.933.438.1 ± 6.7554.556.455.5 ± 1.34
201446.535.941.2 ± 7.5163.458.861.1 ± 3.22
Mean ± SD42.3 ± 4.5633.1 ± 2.9237.7 B56.5 ± 6.1055.7 ± 3.5156.1 A
Conventional201236.230.433.3 ± 4.0849.940.145.0 ± 6.94
201343.433.838.6 ± 6.7850.754.652.7 ± 2.71
201447.742.044.8 ± 3.9859.653.256.4 ± 4.53
Mean ± SD42.4 ± 5.8135.4 ± 5.9838.9 A53.4 ± 5.3649.3 ± 8.0051.3 B
Mean201236.830.233.5 ± 4.65 z50.846.048.4 ± 3.38 z
201343.233.638.4 ± 6.76 y52.655.554.1 ± 2.03 y
201447.139.043.0 ± 5.75 x61.556.058.7 ± 3.87 x
Mean ± SD42.4 ± 5.18 a34.3 ± 4.40 b38.354.9 ± 5.71 a52.5 ± 5.64 b53.7
LSD 0.05 system1.000.614
LSD 0.05 cultivar0.5721.06
LSD 0.05 years1.430.857
LSD 0.05 system × cultivar0.8091.22
LSD 0.05 system × years1.921.21
LSD 0.05 cultivar × year1.741.21
For explanation, see Table 1.
Publisher’s Note: MDPI stays neutral with regard to jurisdictional claims in published maps and institutional affiliations.

