Article

Biological Indicators of Soil Condition on the Kabanyolo Experimental Field, Uganda

1
Faculty of Soil Science, Lomonosov Moscow State University, Leninskie Gory 1, Building 12, 119991 Moscow, Russia
2
Department of Agricultural Production, School of Agricultural Sciences, Makerere University, Kampala P.O. Box 7062, Uganda
*
Author to whom correspondence should be addressed.
Agriculture 2021, 11(12), 1228; https://doi.org/10.3390/agriculture11121228
Submission received: 30 September 2021 / Revised: 3 December 2021 / Accepted: 4 December 2021 / Published: 6 December 2021
(This article belongs to the Special Issue Fertilizer Use, Soil Health and Agricultural Sustainability)

Abstract

:
Soil biological activity is an integral characteristic reflecting the state of soil fertility, biodiversity, and the activity of soil processes carried out by soil organisms. In Africa, studies of soil biological properties are few compared to the agrochemical research. In this paper, we present an assessment of multiple biochemical and microbiological properties of soil from an agricultural field located in the African tropical savanna. We determined basal respiration, substrate-induced respiration, C of microbial biomass, the potential activity of denitrification, nitrogen fixation activity, and estimated prokaryotic components in the soil microbial complex by quantitative PCR. Basal respiration of soils ranged from 0.77 ± 0.04 to 1.90 ± 0.23 μg C-CO2·g−1·h−1, and substrate-induced respiration ranged from 3.31 ± 0.17 to 7.84 ± 1.04 μg C-CO2·g−1·h−1. The C reserves of microbial biomass averaged 403.7 ± 121.6 μg C·g−1 of soil. The N2O emission from the upper layer on average amounted to 2.79 ng N-N2O·g−1·day−1, and the potential denitrification activity reached 745 ± 98 ng N-N2O·g−1·h−1. The number of copies of bacterial genes varied from (0.19 ± 0.02) × 108 to (3.52 ± 0.8) × 108 copies·g−1, and of archaea—from (0.10 ± 0.01) × 107 to (0.29 ± 0.01) × 107 copies·g−1 of soil. These results were in good agreement with the studies in other seasonally wet tropical regions: the biological activity was relatively low. The difference between biological indicators of the experimental field and the reference profile were insignificant except for nitrogen loss, which was higher in the ploughed field. Biological indicators strongly varied in space; we explained their heterogeneity by non-uniform management practices in the course of agrochemical field experiments in the past. The use of organic fertilisers may cause the release of climatically active gases due to intensive microbial respiration and denitrification, but the intensity of emission would strongly depend on the cultivation and management method.

1. Introduction

Most of the soils in tropical Africa are strongly weathered and, thus, are poor in major nutrients [1]. Growing population and consequently increasing demand for food result in expanding pressure on agricultural land [2], resulting in soil degradation and the loss in soil fertility [3,4]. In Uganda, major nutrients such as N, P, and K, vital for crop production, have been depleted, resulting in unprecedented soil fertility decrease. In Uganda’s soils, total carbon (C) stocks decreased by 30% between 2006 and 2010 alone, with losses estimated at between 705.59 and 849.94 Tg C [5]. Various cultural practices, including the use of cover and rotational crops, composts, tillage systems, and others, have been promoted as management options for enhancing soil quality and fertility [6]. Applying these practices allowed for an increase in the abundance and diversity of total soil microbes, the population of beneficial organisms, and decreasing crop pests [6].
Soil health is one concept that is new in the country and depends on the maintenance of four major functions: soil organic carbon transformations, nutrient cycles, soil structure maintenance, and the regulation of pests and diseases [7]. However, in a broad sense, soil health reflects the complexity of the soil ecosystem that includes crops, weeds, soil animals, and microbiome rather than soil internal properties [8]. Most biological indicators are based on the dynamic soil properties that are difficult to measure; for example, recognised leble C had twofold to 20-fold more significant inter-laboratory variability than other commonly used soil tests, leading to a high degree of uncertainty associated with the interpretation of results [9]. Van Bruggen and Semenov [10] discussed the approaches to assessing the microbial communities in soils as indicators of soils condition. They decided that all the methods have certain deficiencies which could lead to erroneous conclusions. In tropical Africa, organic carbon stock seems to reflect soil condition better than other characteristics. The main biological properties indicating good soil condition are microbial biomass, microbial activity, carbon cycling, nitrogen cycling, microbial resilience and biodiversity, the bioavailability of contaminants, and various soil physical and chemical properties [11].
Choosing appropriate cultural practices that limit or prevent damage of root diseases is essential for the long-term and sustainable management of soil. It is recognised that successful management of soil fertility and plant productivity is a combination of many factors and individuals coming together to provide optimal conditions for a healthy plant [12]. Application of mineral fertilisers generally improves plant nutrition but, in some cases, may have a negative long-term effect on soil biological activity, which is believed to be the most important indicator of the sustainability of the soil–plant system [13,14]. In humid tropical soils, the biological processes have not been well understood, and emphasis has been on chemical and physical properties. In Uganda, the soil biological indicators have been used in several studies [15,16], but many gaps exist in our knowledge. This study aimed to assess soil biological indicators associated mainly with soil organic carbon, microbiological activity, and biodiversity on typical Ferralsol at an experimental farm of Makerere University Agricultural Research Institute, Kabanyolo, in the vicinity of Kampala, the capital city of Uganda. The particular objective of the study was to compare cultivated field with a non-ploughed soil using these indicators. Methodologically, we aimed to identify the indicators that are less sensitive to spatial variation of soil properties. Moreover, we compared the obtained results with few existing data on soil biological indicators in tropical pedoenvironments.

2. Materials and Methods
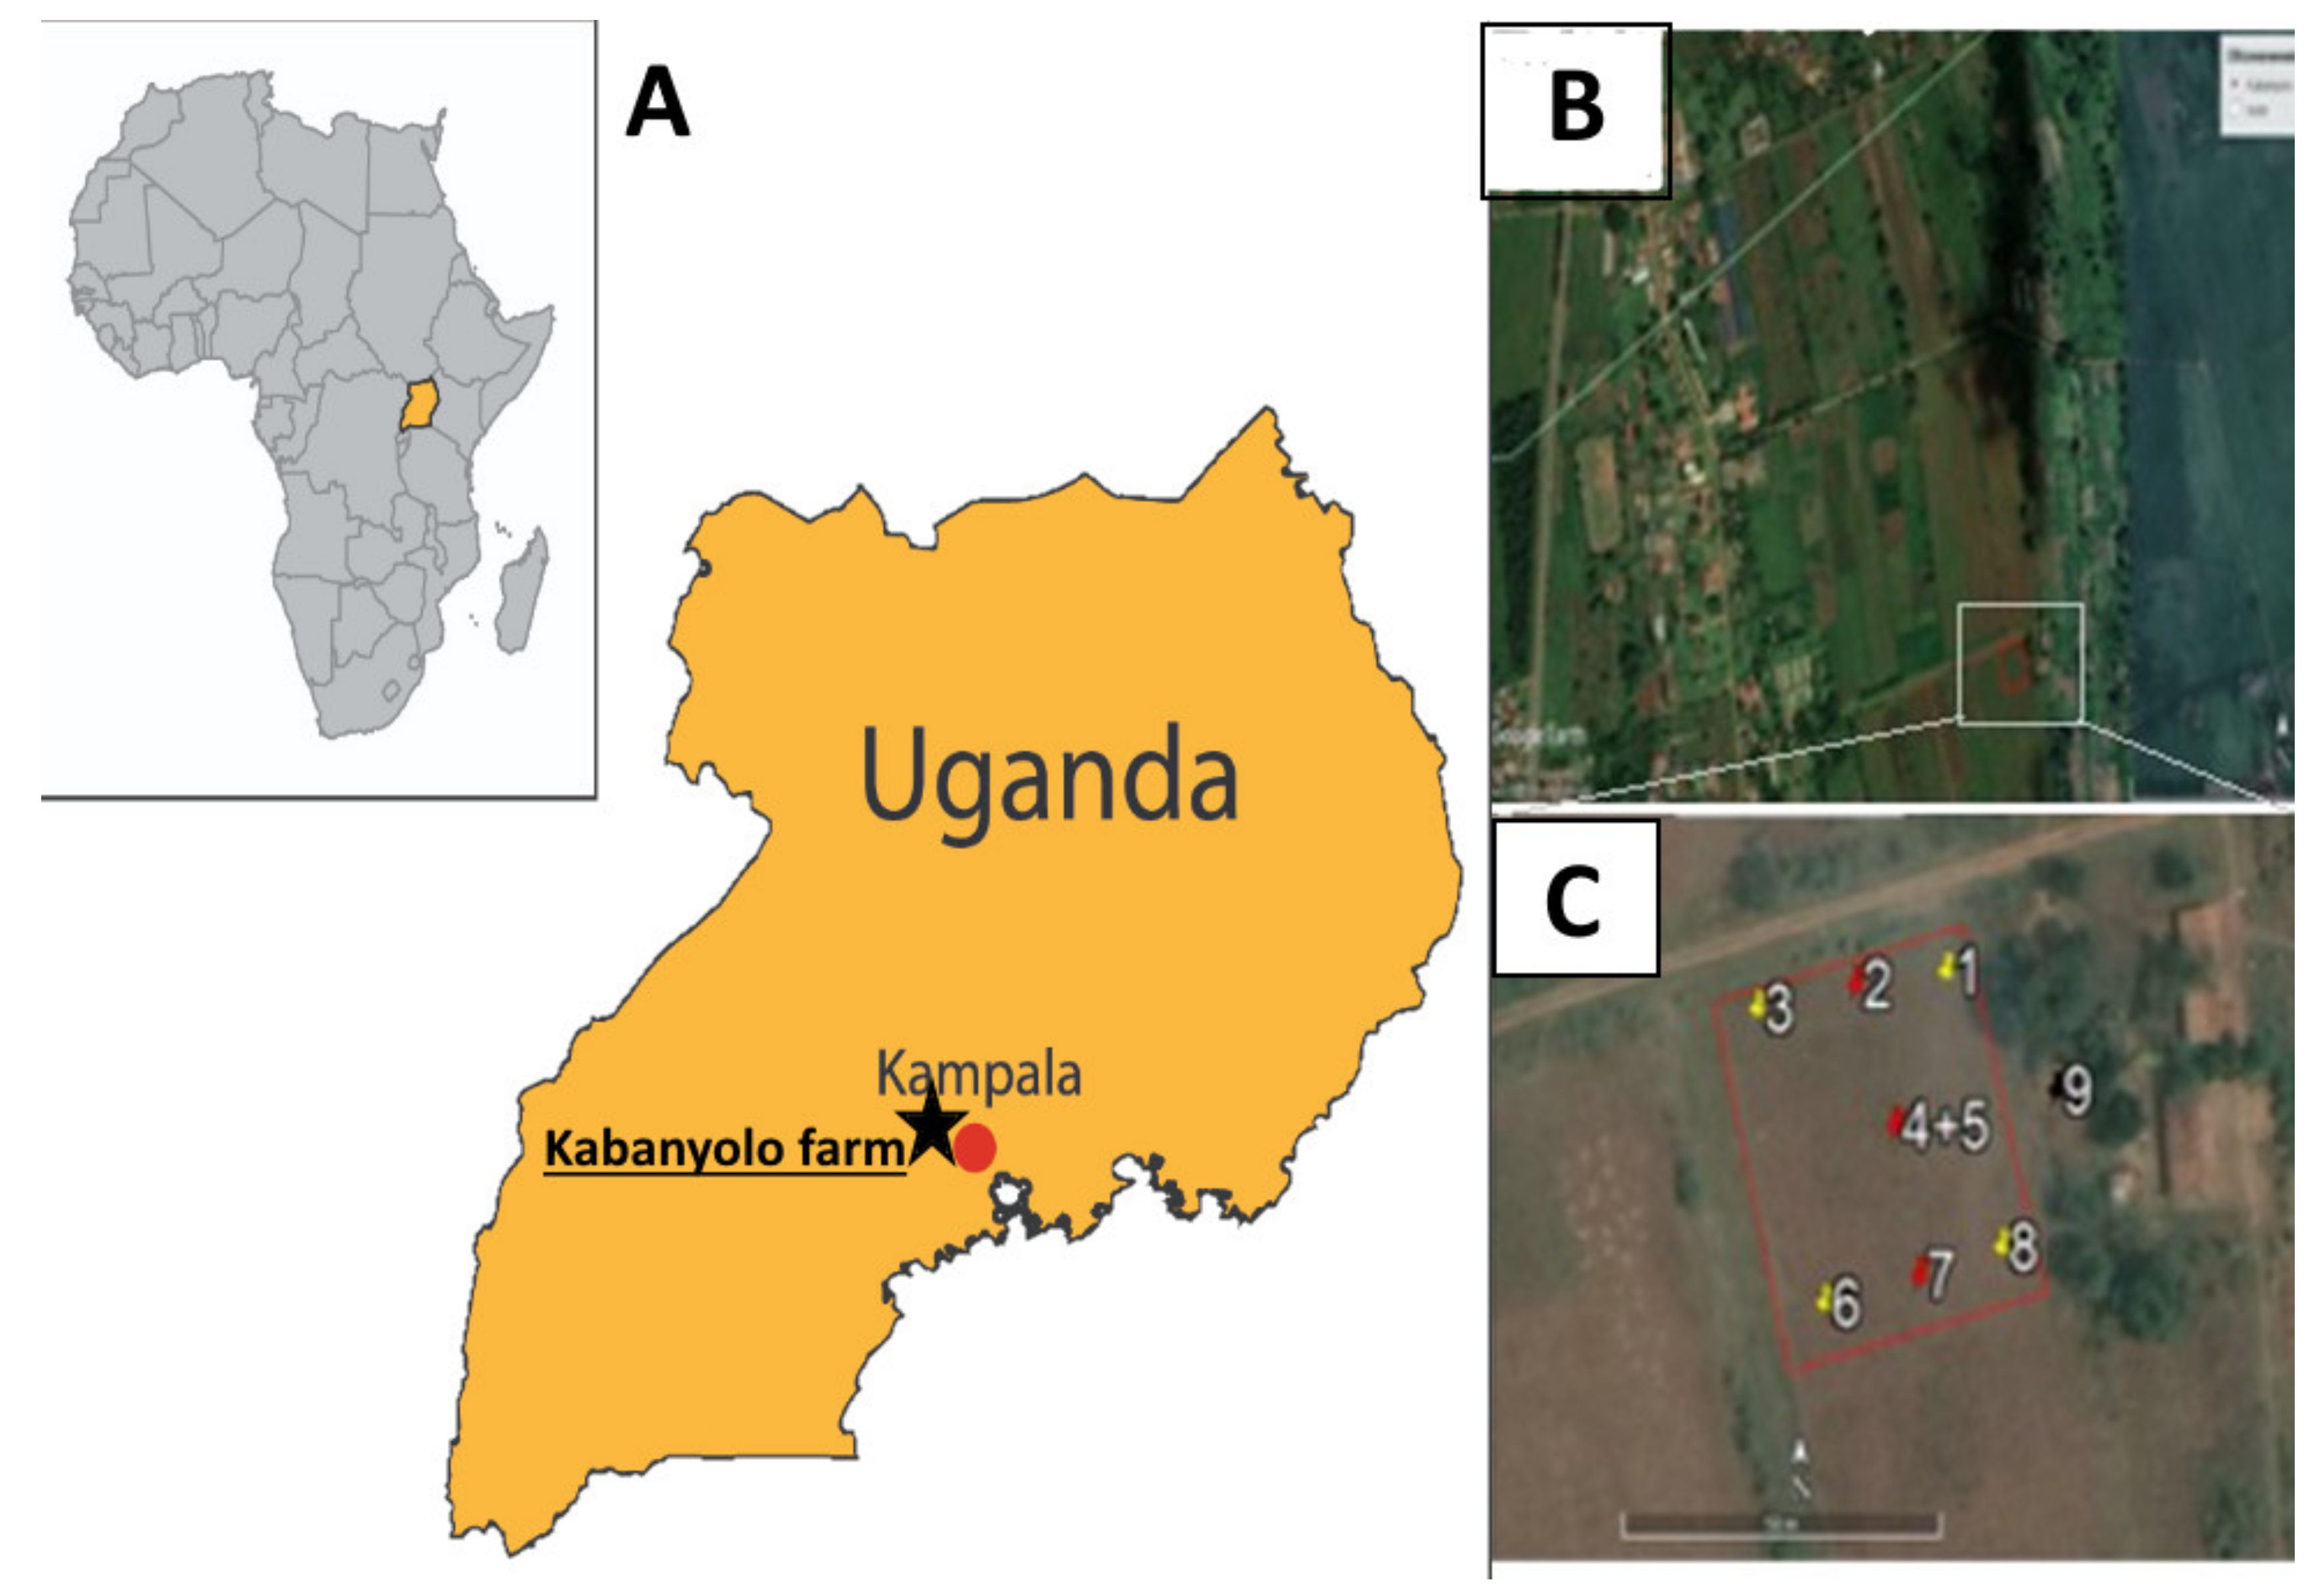
2.1. Study Area

Soil studies were carried out on the territory of Makerere University Agricultural Research Institute, Kabanyolo (MUARIK), in December 2019. The geographical coordinates of the Institute are 0′27′′60′′ N, 32′36′′24′′ E, and the altitude is 1250 to 1320 m above sea level (Figure 1). Kabanyolo province is located within the administrative boundaries of the Wakiso district, 14 km north of Kampala. Geomorphologically, this area is located on the East African Plateau between two arms of the East African rift system. Kabanyolo is a part of the Lake Victoria basin, with an average annual rainfall of 1218 mm. Periods without rain last from June to July and from December to February, and the average annual temperature is 21.5 °C [17]. The Köppen classification is Aw—tropical savanna climate. According to the agroecological zoning of Uganda [18], the studied site is located in an area where bananas and coffee predominate, while other crops such as sweet potatoes, beans, and maize are commonly produced for food security. Precipitations are unstable, and the soils have medium and high productivity. The acreage per capita is small. The territory not used for agriculture is occupied by mosaic forests and pastures suitable for intensive animal husbandry. The soils of the MURIK experimental farm were classified in the USDA Soil Taxonomy system as clay and sandy clay Ultisols or Ferralsols [19]. The territory of MURIK is used for many field experiments, and thus soil management, crops, and the application of fertilisers is diverse across the farm.
The experimental field sized 0.2 ha is located on a gentle slope of the eastern aspect. The field was ploughed before the sowing of legume seeds. The land use history of the experimental plot has mainly been annual crops, with maize being planted in rotational with beans or soybean with low and not consistent application of mineral fertilisers such as urea (50 to 200 kg N per ha) and diammonium phosphate (DAP) (less than 100 kg P2O5 per ha). According to the comments of the local workers, in the past, some of the experiments divided the field into multiple plots, and each plot was managed differently and might receive different doses of fertilisers. Unfortunately, we did not find the description of the particular field experiments for this site.

2.2. Sampling

Sampling was carried out in December 2019, at the end of the rainy season. Eight sampling points (nos. 1–8) were located within the experimental field, and one point (9) with a soil profile was located outside the cultivated field under grass cover not to disturb the soil at the experimental field (Figure 1C). Within the field, we collected five mixed surface samples (point nos. 1, 3, 5, 6, 8) using the square method. Nine soil samples were collected from three points from the depths 0–10, 10–20, and 20–30 cm at each point (nos. 2, 4, 7) to characterise the variation in soil health indicators with depth. Each sample was packed in a sterile zip bag and provided with an accompanying label. Transportation of samples took no more than 72 h. The samples for microbiological analysis were transported in a dried state using silica gel to avoid dampening of the samples. At the reference point outside the field, we made a soil profile (point no. 9) for soil classification and the general characteristic of soil properties. Soil samples were collected from all soil genetic horizons for chemical analyses.

2.3. Soil Chemical Analyses

Most soil chemical analyses were performed in the laboratory of the Soil Geography Department of the Faculty of Soil Science of Lomonosov Moscow State University, following the internationally approved manuals [20,21]. We measured soil pH potentiometrically in H2O and KCl with a soil/water ratio of 1:2.5. Organic carbon was determined using wet oxidation method (Tyurin method equivalent to the Walkey and Black technique: carbon oxidised with 0.4 N K2Cr2O7 in 1:1 H2SO4 water solution and then the excess of chromic acid titrated with (NH4)2SO4·FeSO4·6H2O using diphenylamine as an indicator), and available phosphorus and potassium were extracted with Melich-3 (HCl-H2SO4) with a correction coefficient 1.5. Determination of the exchangeable cations and base saturation (1 M pH 7.0 ammonium acetate) was carried out using a mechanical programmable vacuum extractor [20] on ICP Arcos by atomic emission spectroscopy with inductively coupled plasma at the following wavelengths: Ca 317.933 nm; K 766.491 nm; Mg 280.270 nm; Na 589.592 nm; Fe 275.573 nm. Moreover, we extracted Fe of iron (hydr)oxides with Na dithionate-citrate-bicarbonate (DCB) solution and measured its concentration using ICP Arcos.

2.4. Analysis of the Intensity of the Nitrogen and Carbon Cycle Processes

2.4.1. Pre-Preparation of Soil Samples

The dried soil samples were crushed in a mortar, sifted through a sieve with a diameter of 1 mm, and thoroughly mixed. Then, the soil samples (3 g) were placed in glass vials with a volume of 15 mL. To restore the microbiological activity, we moistened the soil by adding 0.75 mL of water and incubated it at room temperature for five days. The repeatability of samples and measurements was threefold.
The concentration of CO2, CH4, and N2O was determined using a Crystal 5000.2 gas chromatograph produced by Chromatek (Yoshkar-Ola, Russia). The thermal conductivity detector (TCD) and the flame ionisation detector (PID) were connected in series to one of the metal chromatographic columns, where a carrier gas was helium. The electronic capture detector (ECD) was connected to the second column; a carrier gas was nitrogen. Both columns had a length of 2 m and diameter 1 mm, and the filler was Hayesep-D 80/100. Nitrogenase activity was measured by the intensity of transformation of C2N2 to C2H4 on a Crystal 2000 gas chromatograph with a flame ionisation detector and a column filled with Porapak N 80/100 (length—1 m, diameter—3 mm). A gas sample for analysis on a chromatograph was taken with a 0.5 mL gastight syringe.

2.4.2. The Processes of the C Cycle

We assessed CO2 emission by soil microorganisms using two indicators: basal respiration (RB) and substrate-induced respiration (RS) [22]. RB was evaluated by the accumulation of CO2 in rubber-capped vials after incubation of soil samples for 24 h at 22 °C. To determine the RS, we added glucose at the rate of 2.5 mg per 1 g of soil; the vials were hermetically sealed with rubber lids and a gas sample was taken after 3 h of incubation. The incubation time of each sample was measured and used in calculations. When determining the RB and RS, we took into account the initial CO2 content in the air.
For determination of CH4 formation by anaerobic microorganisms, an aqueous glucose solution was introduced into the vials with soil samples at the rate of 2.5 mg g−1, hermetically sealed with rubber stoppers, fixed with clamps, purged with argon for two minutes to remove O2, and after 24 h at 22 °C, the amount of CH4 formed was analysed.

2.4.3. Processes of the N Cycle

When measuring the RS, the intensity of N2O formation was evaluated under aerobic conditions simultaneously with basal respiration. The potential activity of N2O formation by denitrifiers was measured using by acetylene method, in which acetylene plays the role of an inhibitor of nitrous oxide reductase [23]. As a result, N2O becomes the final and only product of denitrification. To determine the potential activity of denitrification, we added an aqueous solution of KNO3 (0.3 mg g−1) and glucose (2.5 mg g−1) to each vial. The vials were hermetically sealed with rubber stoppers, fixed with clamps, and purged with argon for two minutes to remove O2, after which 1 mL of acetylene was injected into each vial with a syringe to inhibit N2O reductase. Vials were shaken sharply to distribute acetylene over the entire volume of the soil. The accumulated N2O was measured after 24 h at 22 °C.
To determine nitrogen fixation activity, we introduced glucose (20 mg g−1) into 15 mL vials 24 h before the measurement, and then closed it with cotton plugs. After 24 h of incubation, the vials were hermetically sealed with rubber stoppers and 0.5 mL of acetylene (C2H2) was added to the gas phase with a syringe. Nitrogenase, having a low specificity with respect to the catalysed substrate, can reduce acetylene to ethylene. Therefore, the nitrogenase activity was judged by the rate of ethylene accumulation, and measurements were carried out after 2–3 h at 22 °C. The incubation time recorded for each vial was used when calculating the nitrogen fixation activity in the soil. As a control, empty vials with acetylene introduced into them were used. The nonspecific release of ethylene from the soil was assessed by the accumulation of C2H4 during the measurement of BR and RS, taking into account differences in incubation duration (differences in incubation time were taken into account during calculations).

2.4.4. Computation of Additional Parameters of the State of Soil Microbial Communities

The ratio of RB/Rs was computed as shown below:
Carbon of microbial biomass (mkg C·g−1 of soil) [24]:
Cmb = 40.04 × RS (µL CO2·g−1 soil·h−1) + 0.37
The microbial metabolic coefficient qCO2 (µg C-CO2·mg−1 C·h−1) was calculated as follows:
qCO2 = RB/Cmb

2.4.5. Estimation of Prokaryotic Components in the Soil Microbial Complex by Quantitative PCR (qPCR)

Total DNA extraction was performed from soil samples of 0.25 g using the PowerSoil DNA Isolation Kit (MO BIO Laboratories, Inc, Carlsbad, CA, USA) according to the manufacturer’s protocol. The fluorescent intercalating dye Sybr Green, which binds to double-stranded DNA, was used. The total volume of the reaction mixture was 20 mL, DNA—1 mL, Master mix—10 mL, forward primer—0.1 mL, reverse primer—0.1 mL, H2O—8.8 mL. The master mix was the SuperMix SybrGreen Biorad preparation—concentrated buffer with deoxyribonucleotides, Sso7d-fusion polymerase, MgCl2, SybrGreen dye, and sstabilisers [23]. The primers used and their nucleotide sequences are presented in Table 1 [25,26].
Protocol (temperature profile) for amplification was as follows: 95 °C for three minutes and then 49 cycles of the treatment (95 °C for 10 s → 50 °C for 10 s → 72 °C for 20 s + fluorescence detection). The program creates a melting curve at the gradient temperature increase from 65 to 95 °C for 5 s per half a degree with fluorescence detection [27].
The amplification reaction was carried out in a DTLite4 device (DNA Technology), and the fluorescence intensity was measured at each cycle. Previously, the dependence of the fluorescence intensity on the logarithm of the DNA concentration of the standard samples was calibrated, according to which the DNA concentration of the samples was determined using the CFX Manager software. Solutions of cloned fragments of the ribosomal operon Escherichia coli were used as standards for bacteria for the archaea FG-07 strain of Halobacterium salinarum. We determined the DNA concentration of conservative sites present in the genetic material and counted in the number of copies of these areas per gram of soil for bacteria and archaea by the following equation:
A = 400 × Q,
where A is the number of copies of the conservative section of DNA per gram of soil; Q is the concentration of DNA in solution, calculated from the calibration graph program CFX Manager; and 400 is a conversion factor derived from the initial mass and manipulations with the DNA sample extracted from soil.

2.4.6. Statistical Processing of Results

Statistical data were processed (ANOVA, variance analysis) with the aid of the Statistica 10.0 (StatSoft, Hamburg, Germany) software. In ANOVA, the following factors were selected: (1) type of use to differences between field and background; (2) the depth of horizons. In the variance analysis, the Duncan test (p = 0.05) was selected to determine the significant differences between sample averages of indicators. The points for which none of the pairs of average values of the indicators in upper horizons differed significantly were combined into homogeneous groups. Graphical representation of the obtained results was carried out using Microsoft Excel 2010 (Redmond, WA, USA).

3. Results

3.1. Soil Properties

3.1.1. Natural Soil Properties and Classification

The soil profile near the experimental field under natural grassland vegetation had a moderately acid reaction that became strongly acid at a depth of more than 79 cm (Table 2). Organic carbon concentration was not very high in the topsoil (16.6 g kg−1) but exceeded 10 g kg−1 in all soil horizons. Labile K and P concentrations were the highest in the Bo1 horizon at depths between 40 and 79 cm. Among the exchangeable cations, Ca was the most abundant, followed by Mg. Cation exchange capacity was low and decreased with depth, and base saturation varied between 66.6 and 80.1%. Non-silicate Fe concentration extracted with DCB solution was high throughout the profile, with the highest values in the Bo horizons. According to the World Reference Base for Soil Resources, the profile was classified as Plinthic Ferralsol (Hypereutric).

3.1.2. Cultivated Topsoil Properties

The topsoil of the studied soil showed a strong spatial variation of properties. The mean values for most soil characteristics were similar to those detected for the upper soil horizon in the reference profile.
In general, the topsoil of the studied site was moderately acid, poor in organic carbon, saturated with bases, and relatively rich in available P and exchangeable K. For tropical Africa, this soil should be regarded as potentially fertile and suitable for multiple crops, being in line with the previous studies at the experimental farm [17].

3.2. Indicators of Biological Activity

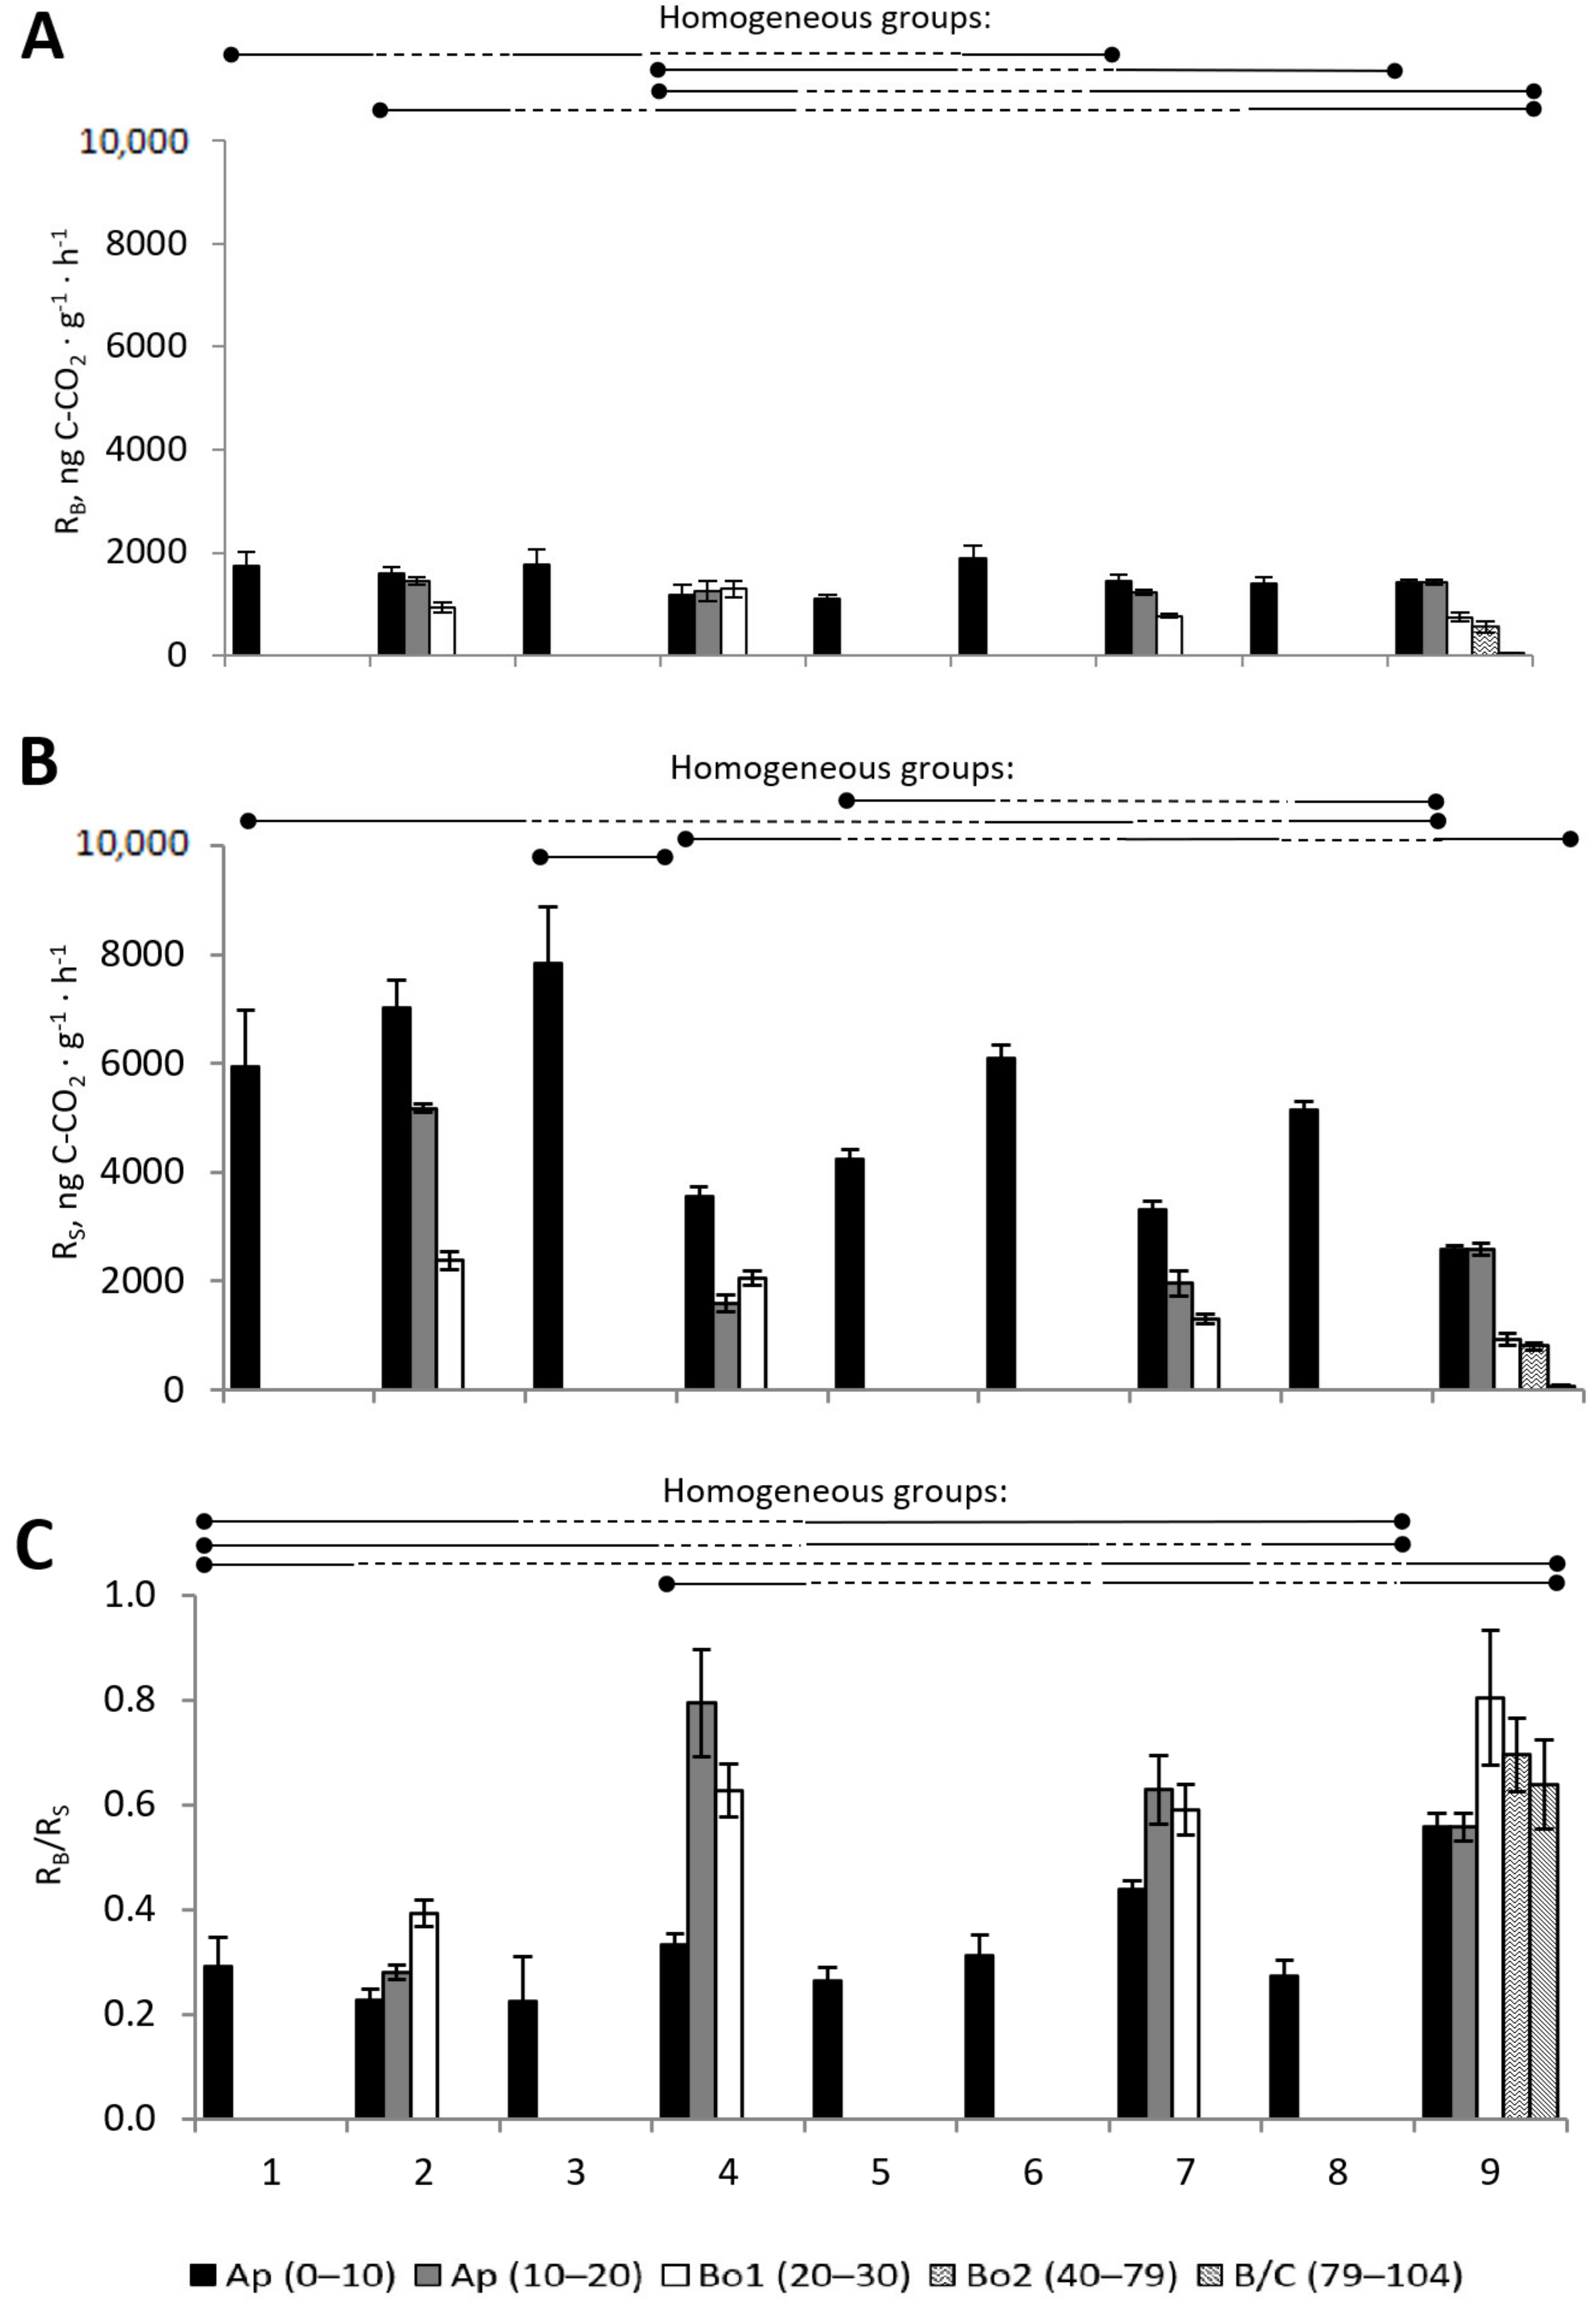
3.2.1. Basal and Substrate-Induced Respiration

Basal respiration of soils on the territory of the experimental field ranged from 0.77 ± 0.04 to 1.90 ± 0.23 μg C-CO2·g−1·h−1 (Figure 2A). The decrease in RB with depth is well described by a linear dependence (R2 = 97.2). The impact of land use on RB was not significant (F = 3.5879; p = 0.0682). The intensity level of basal respiration changed significantly only with depth (F = 36.1807; p = 0.000002). Substrate-induced respiration (RS) in the upper layer of the Ap horizon in different parts of the experimental field ranged from 3.31 ± 0.17 (point 7) to 7.84 ± 1.04 μg C-CO2·g−1·h−1 (point 3) (Figure 2B). RS also did not differ significantly in the field and in the background soil (F = 2.5166; p = 0.12535), and differences were revealed only with depth (F = 6.5127; p = 0.0162). On average, the ratio RB/RS for the 0–10 layer of the experimental field was 0.29 (Figure 2C).

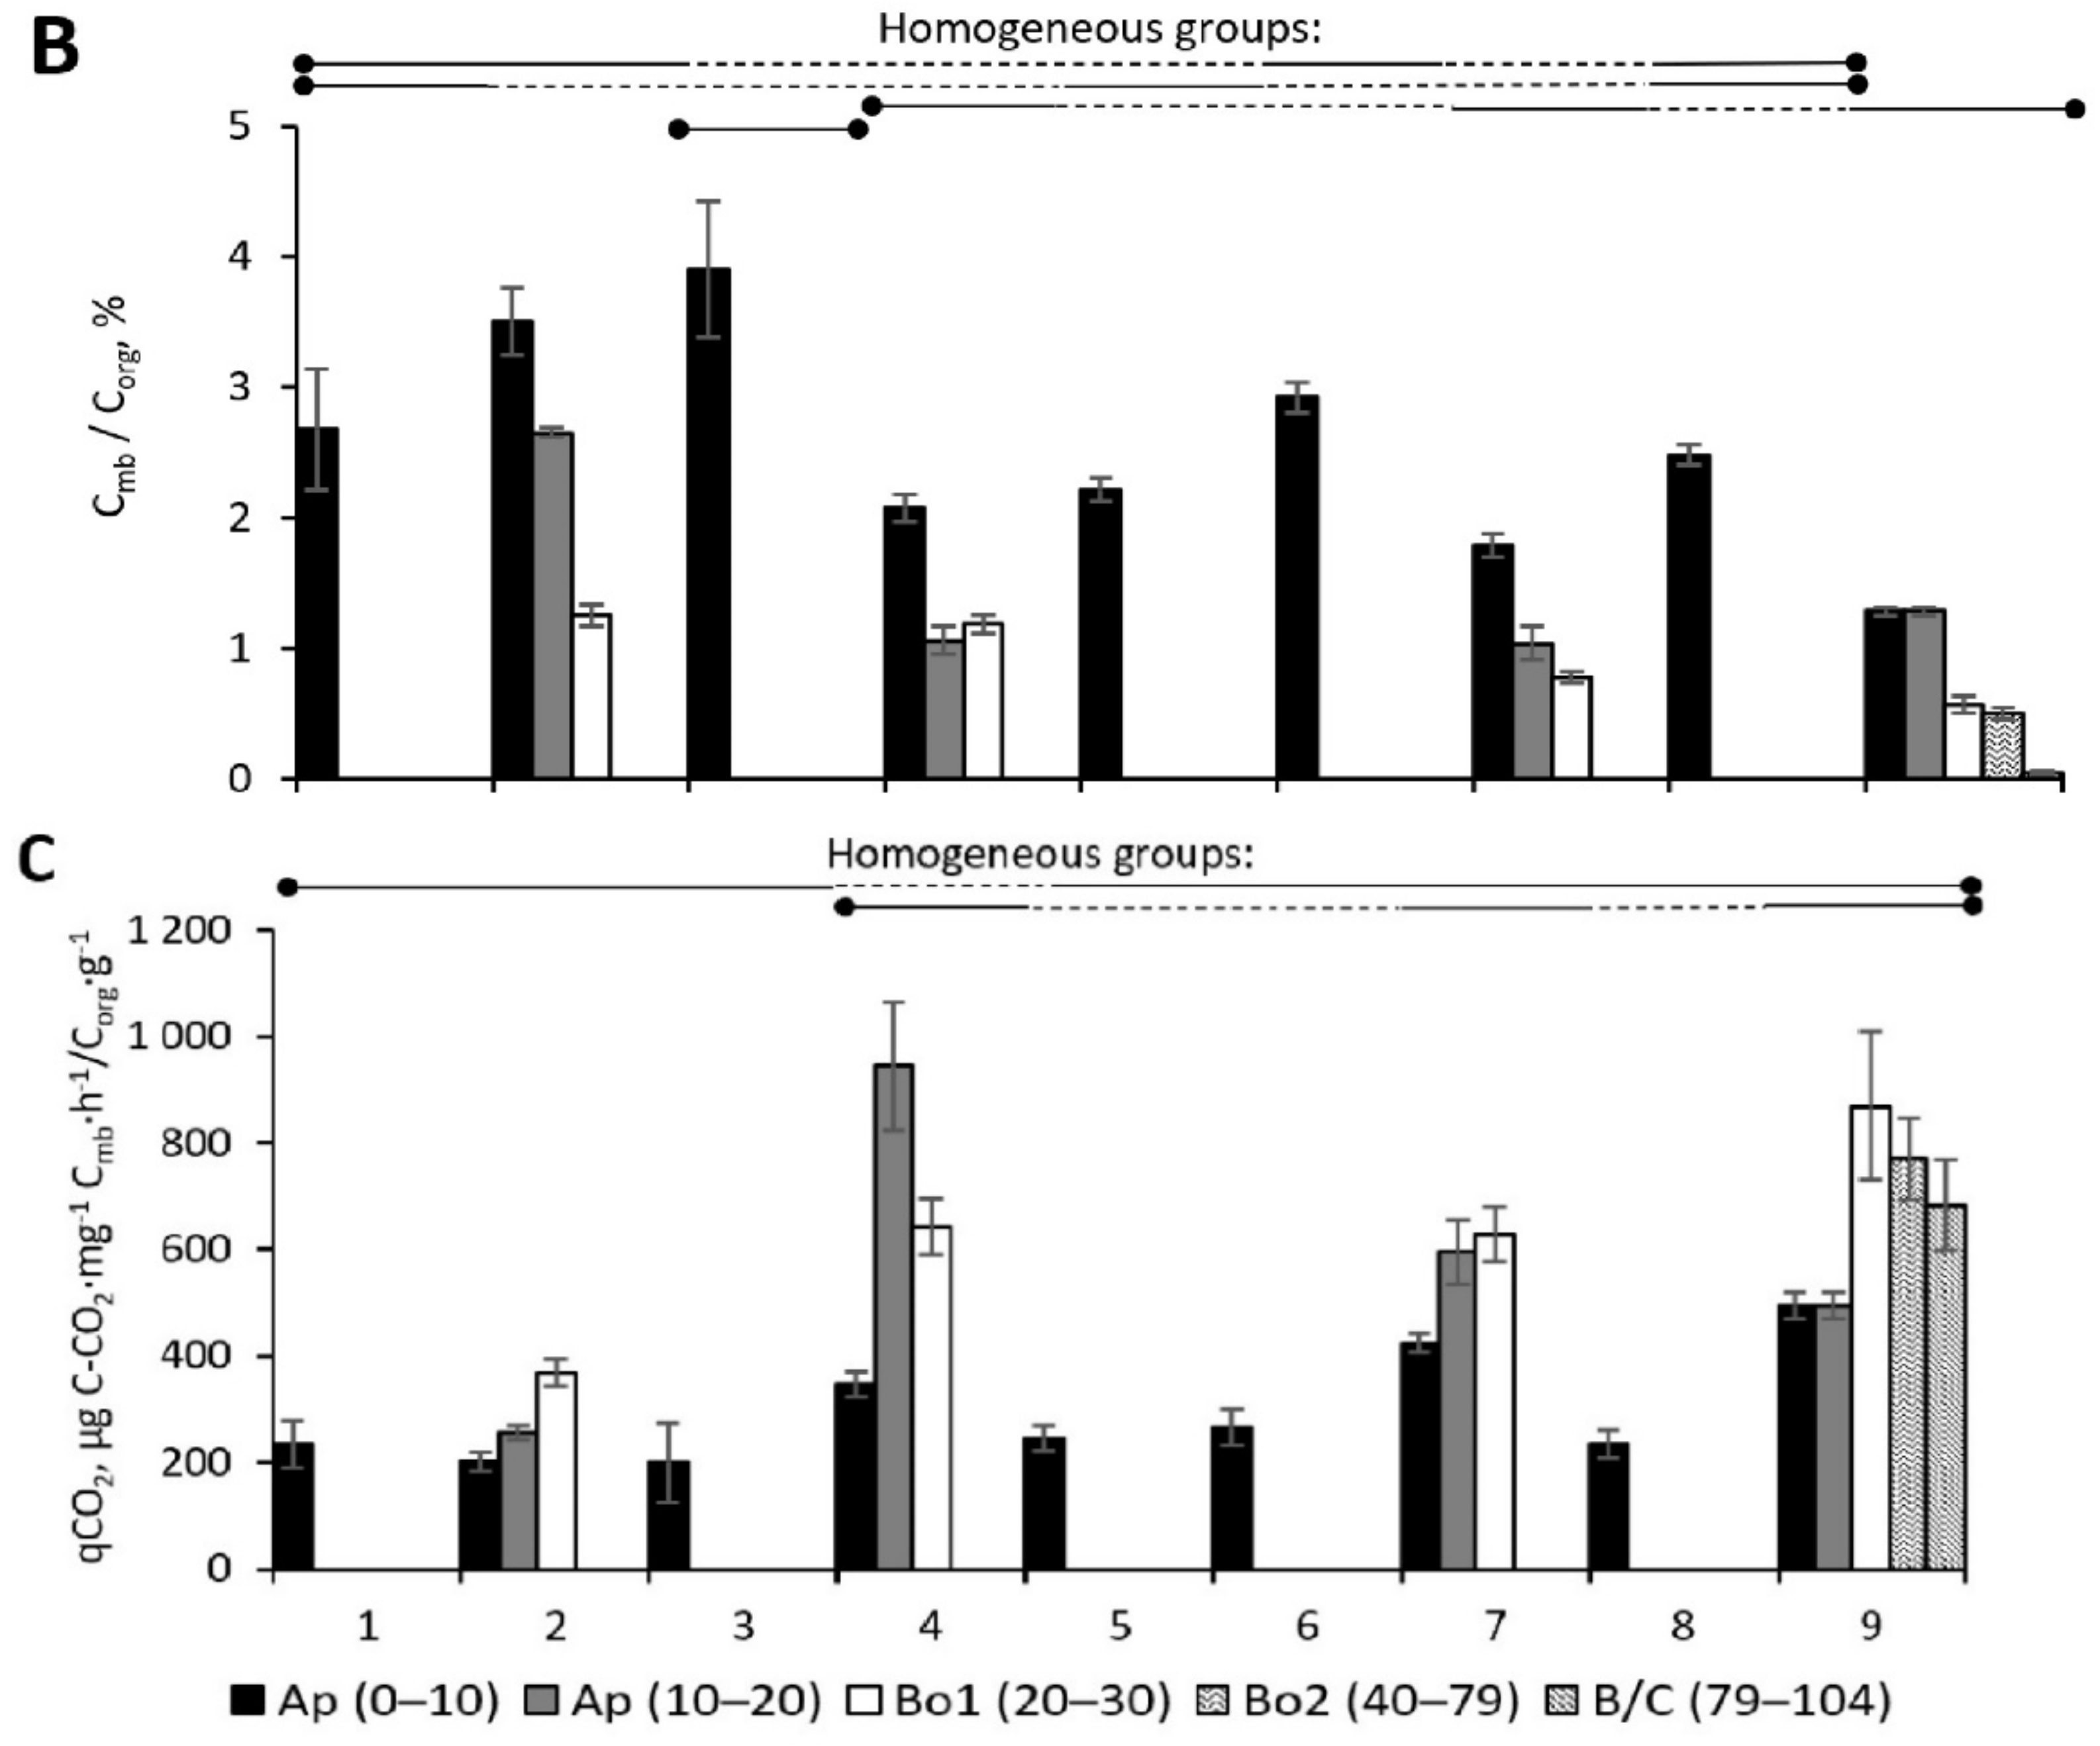
3.2.2. Microbial Biomass C Stock

The carbon reserves of microbial biomass in the upper part of the arable horizon of the experimental field, calculated on the basis of these RS values (Figure 2B), averaged 403.7 ± 121.6 μg C·g−1 of soil (Table 3). The decrease in this indicator is expressed with a depth inside the arable horizon from an average of 2.70% in the surface layer to 1.59% in the 10–20 cm layer. The proportion of microbial biomass carbon from organic carbon did not significantly differ in the field and the control soil (F = 3.76771; p = 0.0620) but depended on the depth (F = 6.7681; p = 0.0145).

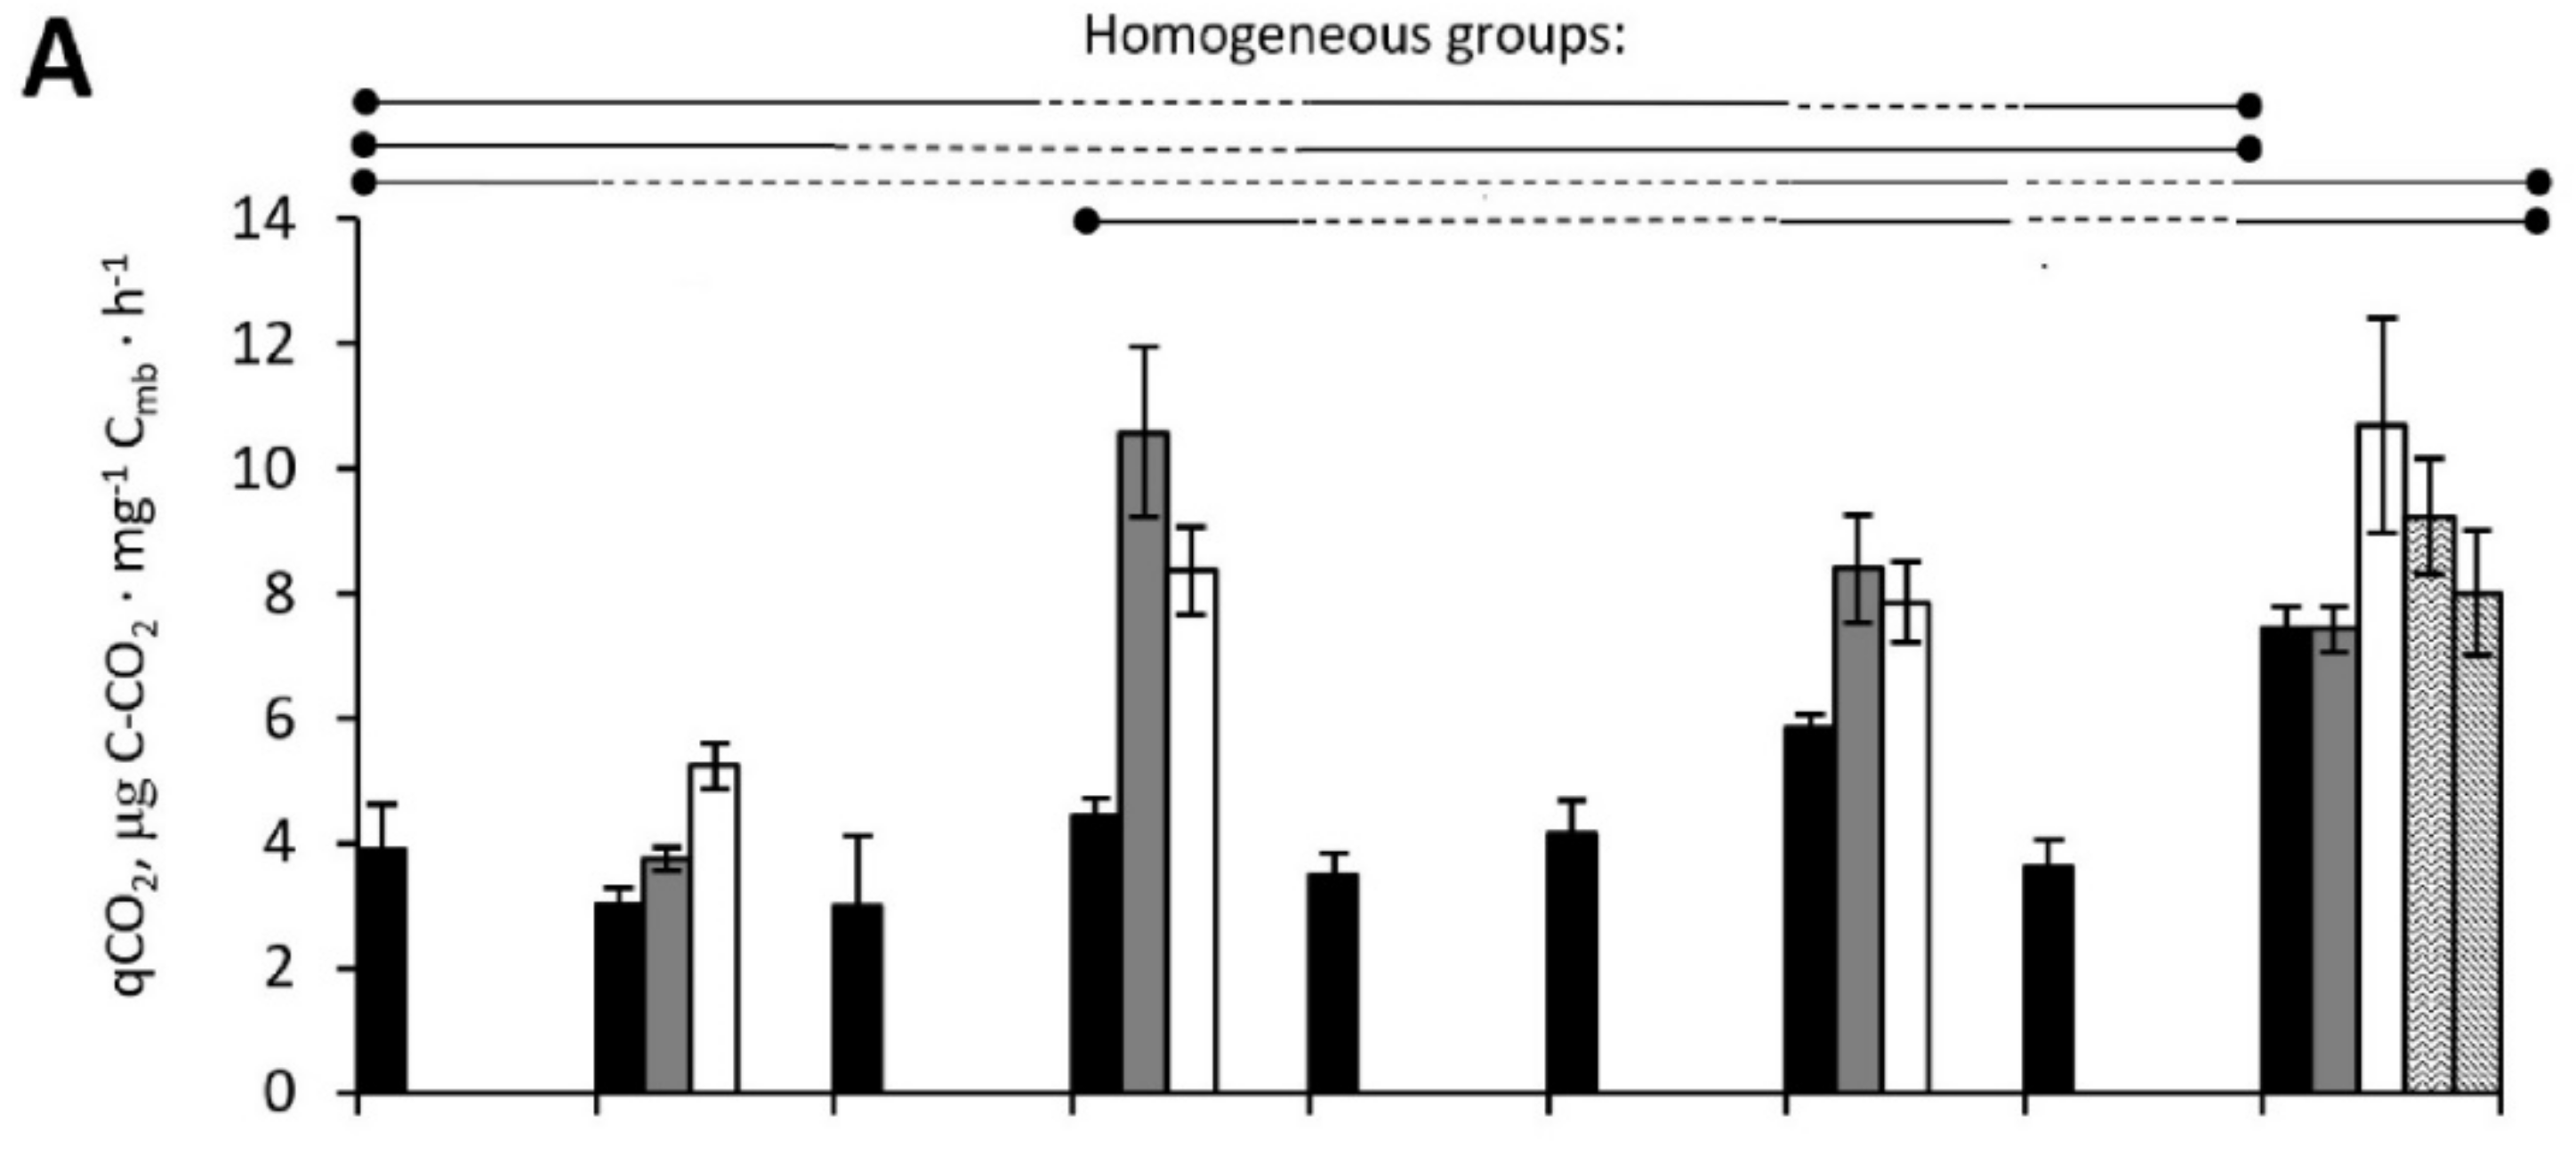
3.2.3. Microbial Metabolic Coefficient qCO2

The background soil was characterised by very high values of the microbial metabolic coefficient—from 7.44 ± 0.35 μg C-CO2·mg−1 Cmb·h−1 in the Ap horizon to 10.71 ± 1.72 μg C-CO2·mg−1 Cmb·h−1 in the Bo1 horizon (Figure 3A). In the topsoil, the variation in qCO2 and related coefficients were high. It was remarkable that in most cases, qCO2 coefficient was higher at the depths 10–20 and 20–30 cm depth than in the surficial soil layer.

3.2.4. CH4 Production

Under the deficit of oxygen and the presence of readily available organic matter, the rate of methane formation for the upper layer of Ap was only 0.88 ± 0.52 ng C-CH4·g−1·day−1. Among the sampling points, there was variation in the depth of maximum CH4 production. In points 4 and 7, as well as in the profile of the background soil, a decrease in the activity of methanogens with depth was detected in a few cases. On the contrary, in point 2 of the experimental field, there was a slight increase in methanogenesis activity in the lower part of the arable layer. In general, the levels of CH4 genesis did not differ at different points of the field with background (F = 0.1459; p = 0.7053) and with depth (F = 0.2551; p = 0.6173).

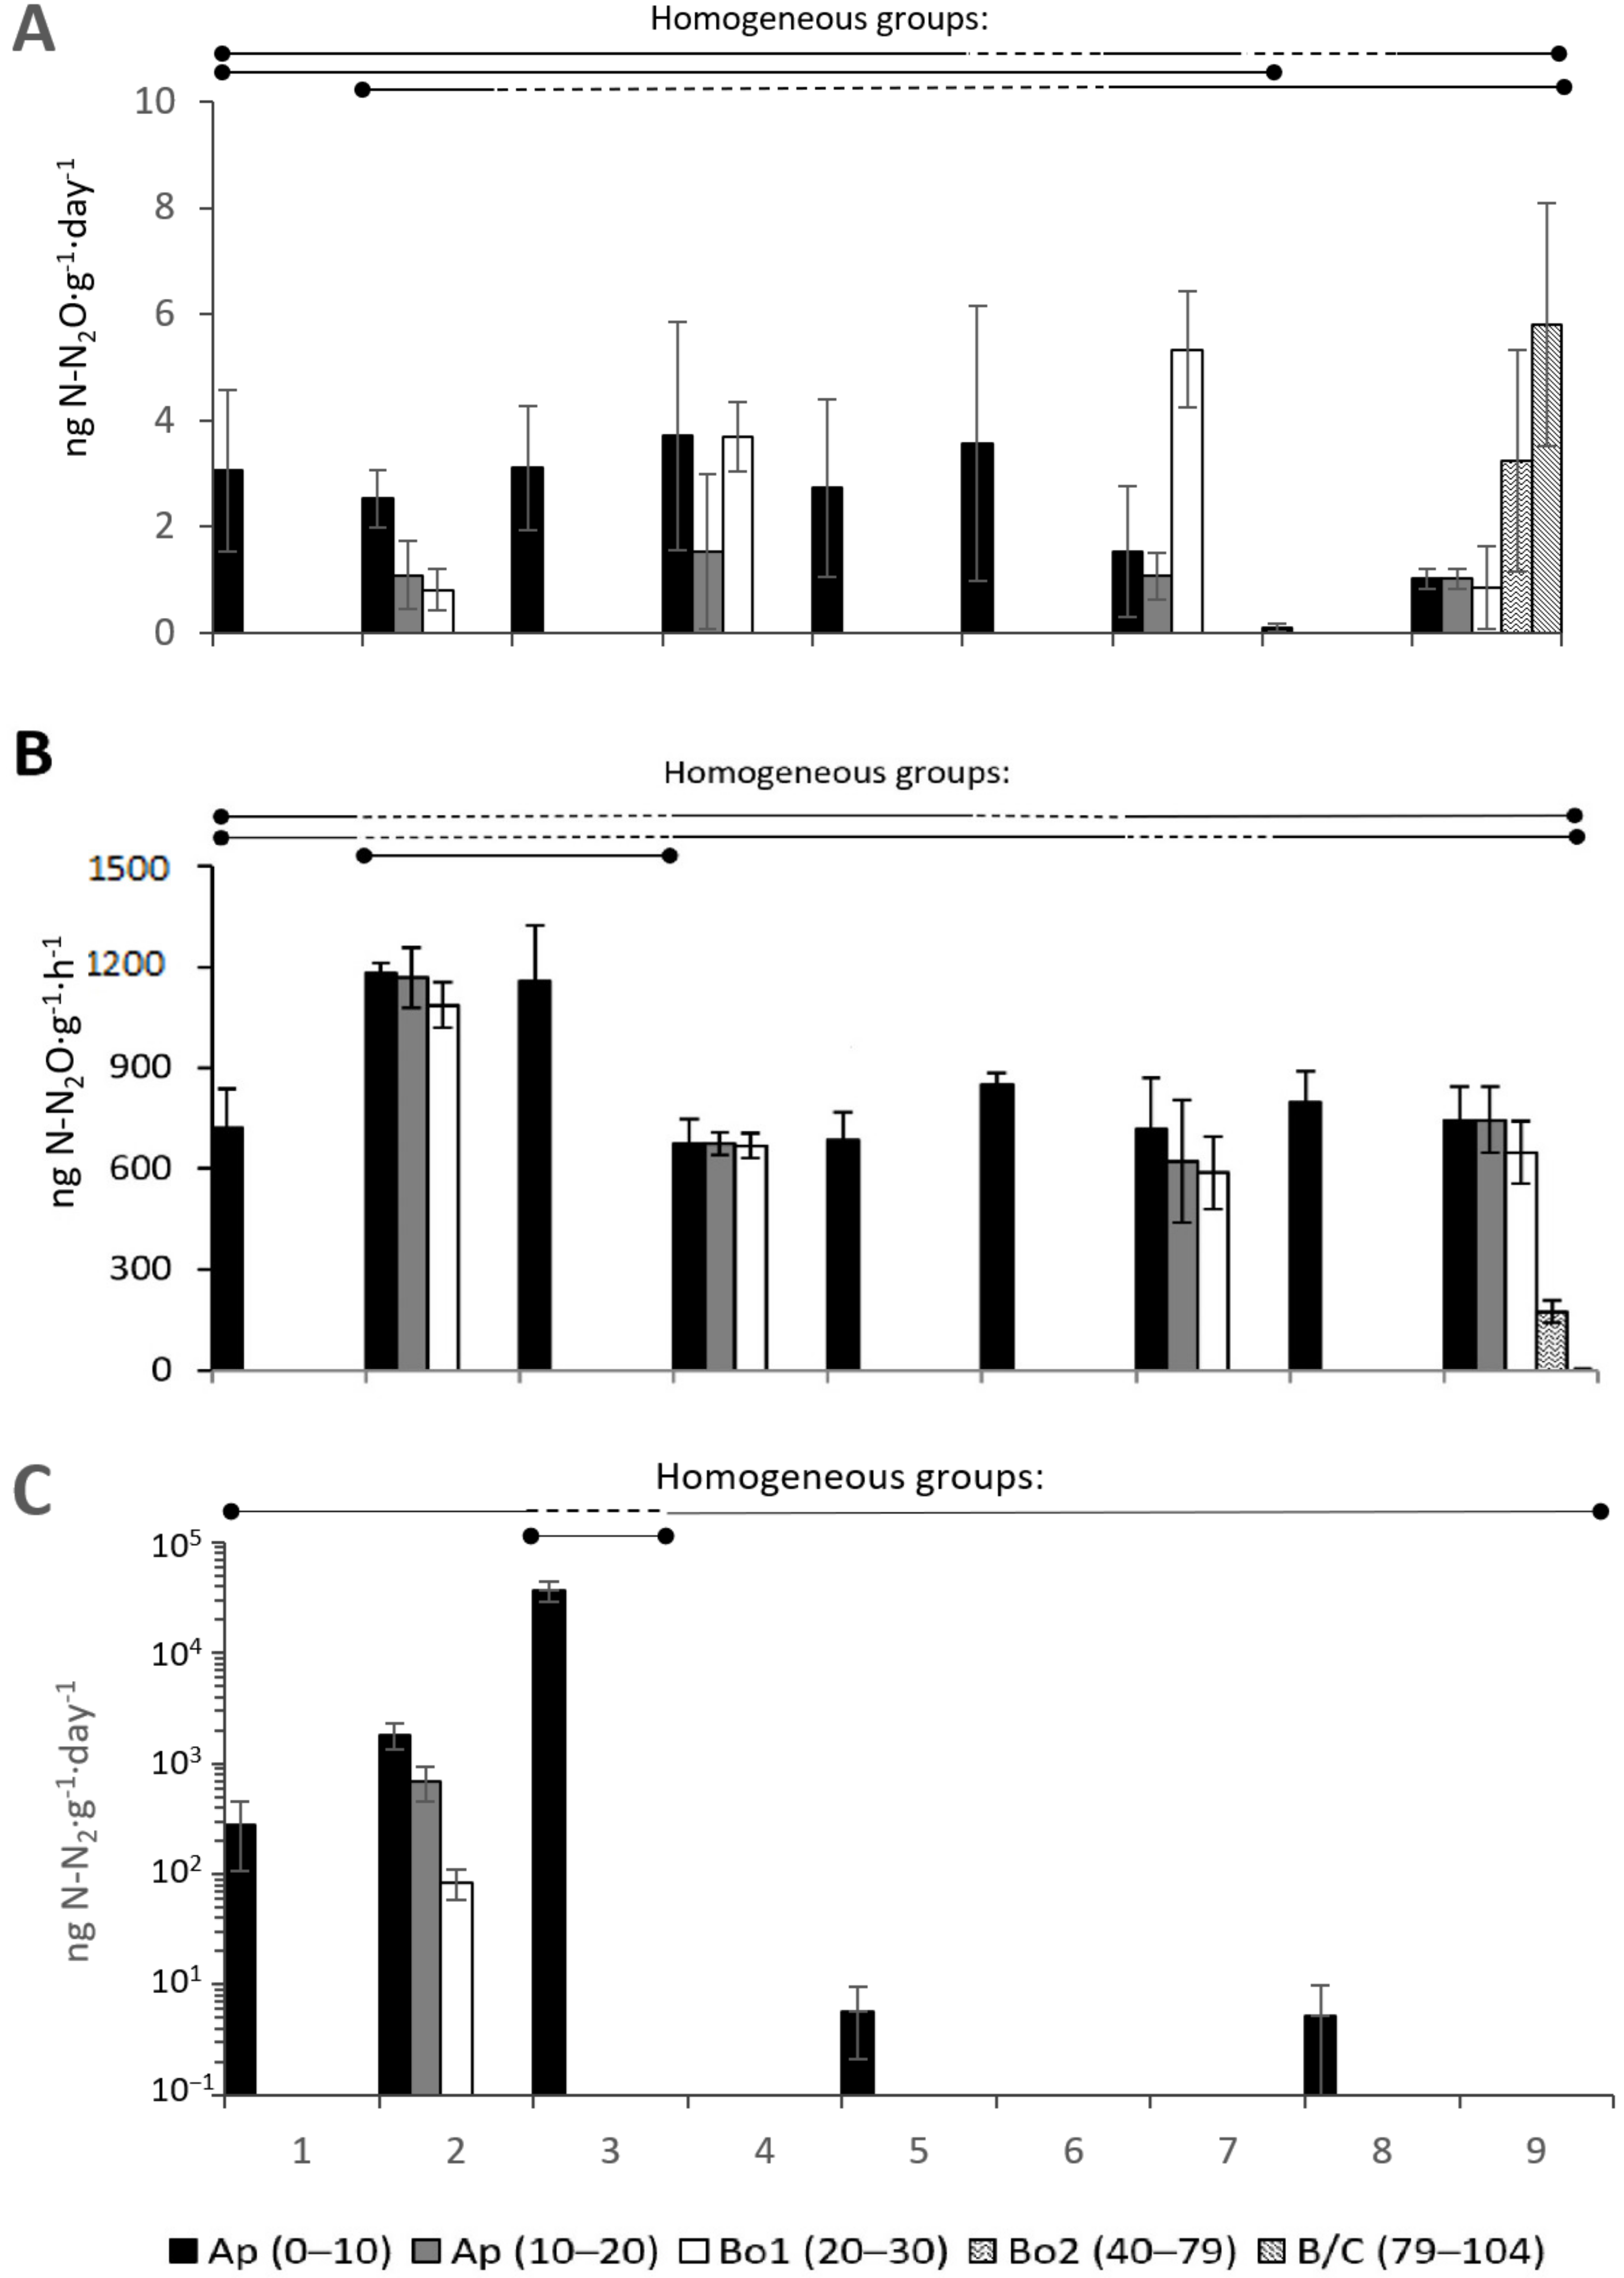
3.2.5. N2O Formation and Nitrogen Fixation Activity

The N2O emission from the upper layer in different parts of the experimental field ranged from 1.53 ± 1.23 to 3.71 ± 2.15 ng N-N2O·g−1·day−1 and on average amounted to 2.79 ng N-N2O·g−1·day−1 (Figure 4A). In general, the level of N2O emission from the soils of the experimental field was twice as high as in the background soil, where it reached only 1.02 ± 0.19 ng N-N2O·g−1·day−1. This indicator distinguished the entire arable horizon of the field soils (i.e., 0–20 cm) from horizon A of the background soil (F = 5.4423; p = 0.0268). Nevertheless, ANOVA showed no difference in actual N2O emission with depth between the field and background (F = 0.7115; p = 0.4059). The exception was the SE part of the field (point 8), where the formation of nitrous oxide was almost not recorded. This spatial pattern most probably depends on the history of land use, especially on the non-uniformity of application of fertilisers.
The vertical pattern of N2O emission in different parts of the field differed. Thus, in one point, located in the northern part of the field, the intensity of N2O formation was the highest in the upper part of the arable horizon and decreased down the soil profile. In the centre of the field (point 4), the production of N2O in the upper part of the Ap and the horizon AB was the same. In the reference profile and at point 7, the maximum N2O emission was shifted to the lower horizons (Figure 4A). The maximum N2O production level of 5.81 ± 2.29 ng N-N2O·g−1·day−1 was detected in the lower part of the reference soil profile in the deepest horizon BC, which showed microbiological penetration to the subsoil layers.
With the simultaneous introduction of C in the form of glucose and N in the nitrate form into the soil, the potential denitrification activity increased by orders of magnitude in most soil samples (Figure 4B). A more pronounced reaction of denitrifiers was registered throughout the entire depth of the arable horizon of the experimental field but not in the profile of the reference soil. In the reference soil, the potential denitrification activity reached 745 ± 98 ng N-N2O·g−1·h−1 in the upper horizon. The arable layer was similar in most of the field, except for the points 2 and 3, where it was almost twice higher than in the other points and reached 1160–1180 ng N-N2O·g−1·h−1. Still the levels of potential N2O production turned out to be similar in the field soil and the reference soil (F = 1.0658; p = 0.3104) and by depth (F = 0.5019; p = 0.4843).
The nitrogenase activity varied in different parts of the experimental field. Extremely high activity of nitrogen fixators was detected in the roadside part of the experimental field at points 1, 2, and 3 (Figure 4C). A decrease in the activity of nitrogen fixation with depth was noted at point 2. In the rest of the field (points 4–8) and the background soil profile, the nitrogenase activity of the soils was low or completely absent. Thus, the levels of potential activity of nitrogen fixation did not differ in the field soil and the reference soil (F = 1.0658; p = 0.3104) and by depth (F = 0.5019; p = 0.4843).

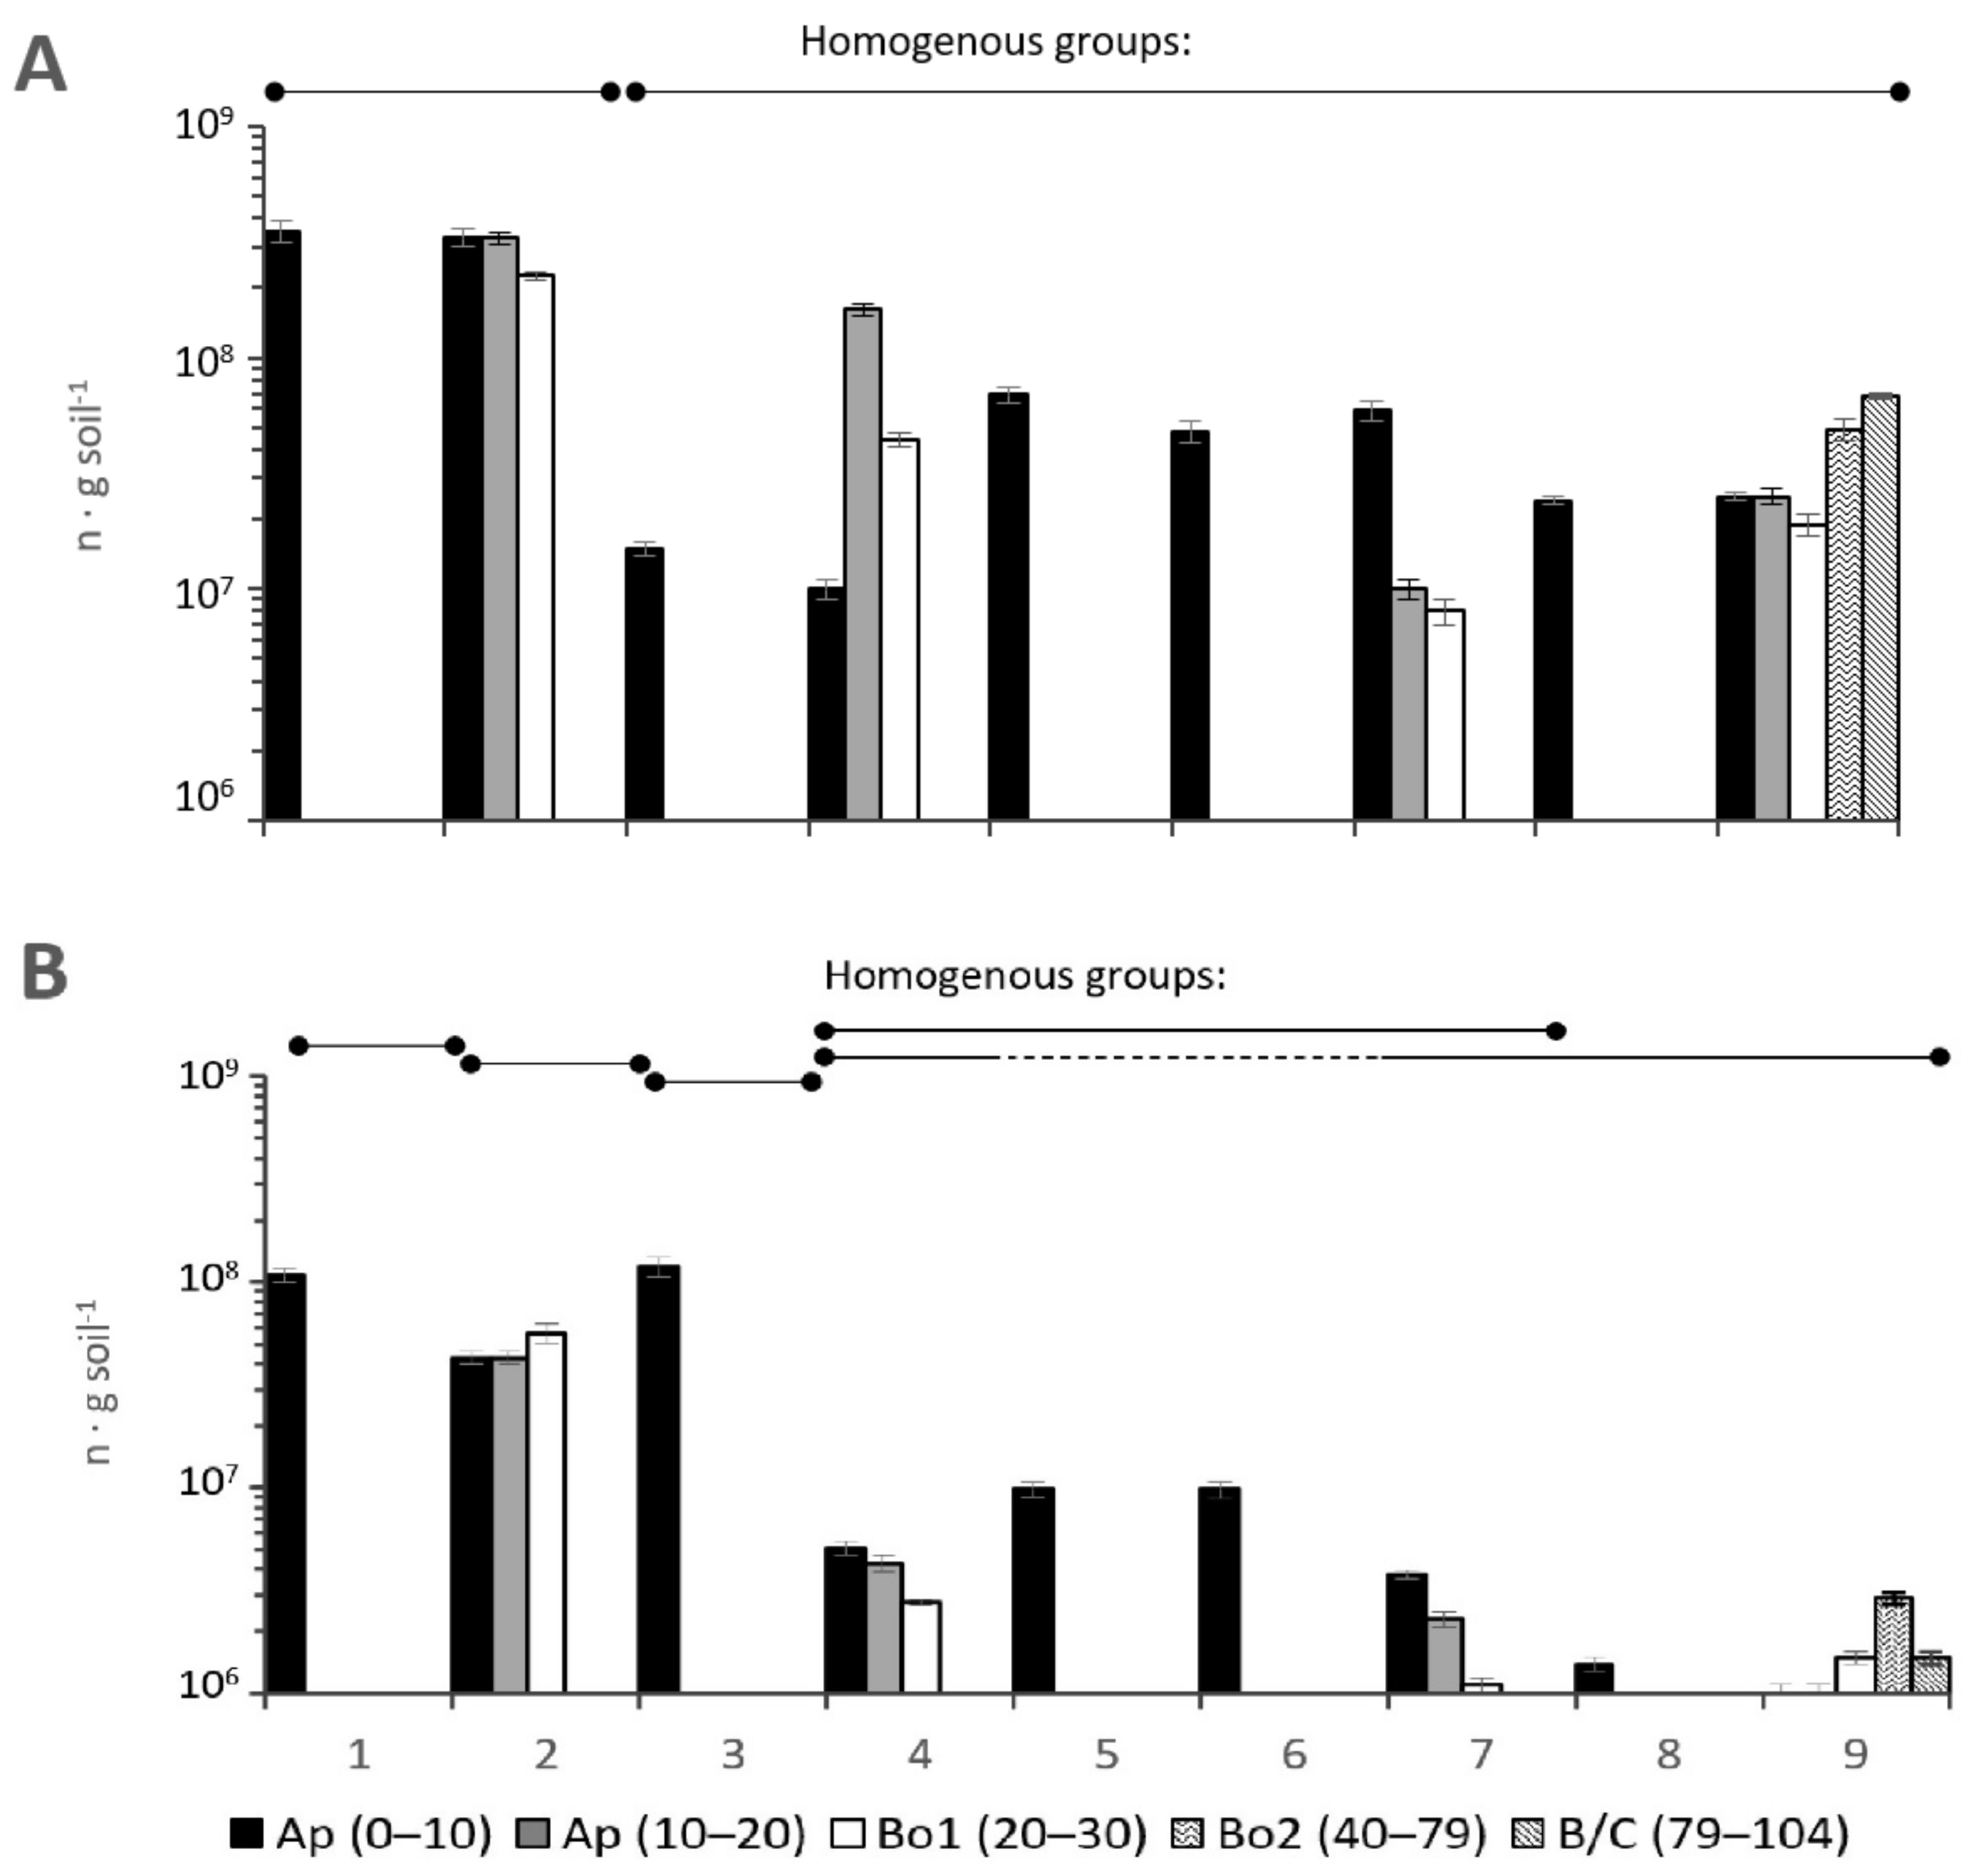
3.2.6. The Number of Copies of Genes of Prokaryotes

The number of copies of bacterial genes varied significantly depending on the sampling points and the depth of the soil horizon. The highest values were recorded for samples of the upper horizons of points 1 and 2: the number of copies of bacterial genes in the upper horizons were (3.52 ± 0.8) × 108 and (3.30 ± 0.7) × 108 copies·g1, respectively (Figure 5A). At points 2 and 7, the number of bacteria decreased with depth (Figure 5A). On the contrary, at point 4, an increase of an order of magnitude in the number of copies of bacterial genes in the subsurface layer of 10–20 cm was registered. In the background soil, the number of copies varied from (0.19 ± 0.02) × 108 to (0.68 ± 0.06) × 108 copies·g−1, but the maximum content of bacterial genes was detected in the deepest horizon Bo2. The number of bacterial genes varied significantly with depth (weighted means current effect: F = 24.7450, p = 0.00002).
In the reference profile, the content of copies of the archaea genes was low, from (0.10 ± 0.01) × 107 to (0.29 ± 0.01) × 107 copies·g−1 of soil with a maximum in the middle part of the profile. The number of copies in the soils of the experimental field varied widely, from (0.10 ± 0.01) × 107 to (11.85 ± 1.20) × 107 (Figure 5B). Notable contents of archaea genes were found at points 1–3, while at the other points, the number of these genes was much lower. The impact of land use on the number of bacterial and archaeal genes was not significant (F = 1.0734; p = 0.0514).

3.2.7. ANOVA for Microbial Processes

Multivariate analysis of variation (ANOVA) was performed, using as grouping variables the depth of sampling and the location of the soil on or outside the field, whereas independent variables were the values of microbiological activity. The Rs, RB, CH4 emission; qCO2/Corg, Cmb/Corg, N2O emission; and N2 fixation activity were taken into account. The differences between the horizons were significant (Wilks lambda = 0.28478; F = 6.9065; p = 0.000147), while there were no differences between the field and the background (Wilks lambda = 0.5446; F = 2.3000; p = 0.5833).
ANOVA for individual microbial processes (the emission of CO2 and CH4, and activity of N2 fixation) did not reveal differences between the field and the background. Only in the upper part of the arable horizon (0–5 cm) was a significant (p < 0.05) increase in Cmb observed in the field, along with a decrease in qCO2. Moreover, we detected a difference in the intensity of the actual emission of N2O under different types of land use, as was shown above.

4. Discussion

4.1. Chemical Parameters of the Habitat of the Soil Microbial Pool

In the process of assessing the biological potential of soils and the rates of ongoing processes, it is essential to have an idea of the physical and chemical parameters of the habitat of microorganisms. As mentioned above, the main soil characteristics corresponded to that previously reported for the study area that indicate favourable conditions for most crops [17], although Kabanyolo farm was reported to receive an excess of N-containing fertilisers [28]. Physical properties of the farm were reported to be unfavourable for soil biota [29]: on the one hand, infiltration rates of the topsoil were low, resulting in anaerobic conditions in the upper part of the arable layer [30]. On the other hand, this layer dried out during the rainless period, negatively affecting biological activity [19]. The periods of excessive moisture were also evidenced by some redoximorphic features in the soil profile. Both excessive and insufficient moisture in the surficial layer may have been responsible for the inverse vertical distribution of indicators of biological activity such as metabolic coefficient with depth at some sampling points, e.g., the in topsoil at the points 2, 4, 7, and 9 where the surficial layer exhibited lower values than deeper soil horizons.
The presence of organic matter is of paramount importance for the functioning of the soil microbiome. In the studied soils, the average content of C in the root layer and down to 50 cm was 1.36% (Table 2). For African equatorial conditions, this value of organic C content may be considered moderate [31,32,33]. According to the findings of Musinguzi et al. [34], the optimal SOC concentration in the topsoil of Uganda’s tropical savanna lies between 1.9 and 2.2%. The presence of organic compounds at a depth revealed in the study may affect the distribution of the number of microorganisms.
In the studied soils of the experimental field, high content of available phosphorus (Table 2) was revealed in the surface horizon due to regular fertilisation of the soils of the experimental field. This level of provision of the root layer with phosphorus is considered to be high [35]. This factor might have an additional stimulating effect on the development of both soil microorganisms and plants. The high level of exchange bases also contributed to the soil fertility of this area; at the same time, the degree of potassium saturation in the soil of the experimental field is insufficient and uneven (Table 2).

4.2. Participation of the Soil Microbiome in the C Cycle

Little is known about the respiration of agricultural soils in Uganda. Most of the results available for Africa deal with soils under different climatic conditions; for semi-arid soil in Mali, the reported results both for RB and RS were several times higher, while the microbial biomass C concentration was more than 10 times lower than in the present study [36]. Calculations show that at this level of CO2 emissions, the annual carbon losses resulting from microbial respiration from the arable horizon of the considered agrocenosis are at least 31.1 t ha−1. Consequently, continuous application of organic fertilisers is required to compensate for the loss of organic C from the soil.
With the additional intake of organic substances, the respiration intensity in the soils of the experimental field increased by 3–4 times as expected (Figure 2B). The increase in substrate-induced CO2 emission from the samples of the experimental field can be estimated as high and significantly higher than in the background soil, where the introduction of organic substances did not show such a stimulating effect. Thus, on the one hand, this indicates an insufficient content of available organic matter in the soil of the experimental field for the full functioning of soil organisms; on the other hand, it shows a high potential activity of the soil microbiome of this farmland.
The values of soil microbial biomass correspond well with the data obtained for similar bioclimatic conditions in India [37] and Ghana [38], calculated on the basis of Rs data (Figure 2B, Table 3), indicating the availability of soil organic carbon and, in general, favourable conditions for the functioning of the microbial community. High values of the metabolic coefficient qCO2 (Figure 3A) indicate high energy costs for maintaining the vital activity of microorganisms due to adverse effects, which include deep ploughing and intensive use of mineral fertilisers [39].
The qCO2/Corg ratio (Figure 3C) characterises the efficiency of using soil organic matter by microorganisms, and high values indicate low efficiency [39]. It is shown that the ploughing of virgin soils contributes to an increase in the indicator, while the application of nitrogen fertilisers reduces it. On the studied soils, lower values of qCO2/Corg were observed under arable land compared to the background soil. High values of the metabolic coefficient qCO2 (Figure 3A) indicate high energy costs for maintaining the vital activity of microorganisms due to adverse effects, which include deep ploughing and intensive use of mineral fertilisers [22,40]. It is also known that the metabolic coefficient can decrease during the soil or biological successions [22], and for soils of stable ecosystems, take values 2–4 or lower [41]. This level of qCO2 was obtained for the upper layer of the arable horizon almost throughout the field. At the same time, qCO2 sharply increased with the depth. A decrease in qCO2 in the arable layer due to ploughing has been reported previously [42].
In general, there was no significant difference between the reference profile and the soils of the experimental field in the indicators related to the C cycle in soils. We consider that the existing system of soil management does not affect soil health significantly.
In the process of transformation of C-containing compounds, as a result of the activity of the soil microbial community, under a number of conditions, methane can be formed—a greenhouse gas that is significantly more active than carbon dioxide. The ability of the studied soils to form methane is estimated as weak.

4.3. Participation of the Soil Microbiome in the N Cycle

Nitrous oxide, N2O, the strongest and longest-lived greenhouse gas, is formed in soils as a product of the microbial transformation of nitrogen compounds, denitrification processes, and autotrophic and heterotrophic nitrification, etc. In general, the level of N2O formation in the soil of the experimental field is low. However, it is the actual emission of N2O from wet samples that is a process that significantly changes as a result of ploughing and determines the difference between the field and the background. This phenomenon indicates a more significant loss of nitrogen during ploughing. The highest activity of denitrifiers was detected in the lower part of the reference soil profile at a depth of 79–104 cm (Figure 4A). The minimum biological activity of all other processes was noted.
The introduction of glucose, which allows for assessing the microbial potential of gaseous nitrogen losses from the soil when additional, organic substances were received, caused an increase in N2O production (Figure 4B). Thus, the intake of fresh organic matter can cause significant N2O emission into the atmosphere from these soils if the maximum accumulation of organic substrates due to ploughing and other measures is shifted from the upper horizon to the lower, sub-arable part of the profile. The availability of nitrogen compounds also limits the intensity of nitrous oxide release from soils. The obtained data should be taken into account when planning the application of organic fertilisers. It is possible that composting would be an option for decreasing the rate of climatically active gases release from soil.
The calculation shows that the balance between the processes of nitrogen intake (nitrogen fixation) and its losses (denitrification) turned out to be negative for the studied farmland: at least 0.93 kg ha−1 of nitrogen can be lost annually only in the form of N2O from the upper arable 20 centimetre soil layer. This value may increase due to the activation of denitrification when fresh organic matter and nitrogen-containing substrates enter the soil, as well as waterlogging in wet seasons. Unfortunately, the loss of N to the atmosphere is an inevitable consequence of soil management, which should be included in the overall balance of climatically active gases in agriculture.
ANOVA showed that nitrogen loss increased in the experimental field compared to the reference profile. We ascribed this phenomenon to the intensification of oxidation of organic matter due to ploughing.

4.4. The Number of Copies of Prokaryotic Genes (Bacteria and Archaea)

The comparison of the number of copies of bacterial genes in the upper arable horizons of various sections of the experimental field showed strong heterogeneity of the distribution of procaryotic organisms at the experimental field. There were two provisional clusters of field sections: with a high content of copies (1.62 × 10⁸–3.52 × 10⁸ copies·g−1 of soil), and the other with lower concentration (0.10 × 10⁸–0.69 × 10⁸ copies·g−1 of soil) in the other parts of the experimental field. The registered increase in the number of copies of bacterial genes in a layer of 10–20 cm in the centre of the experimental field corresponds with the respiratory activity of the soil microbiome (Figure 5A). Moreover, in the reference soil, the maximum content of bacterial genes was detected in the deepest horizon Bo2, which corresponds with the detected increase in denitrification activity and, accordingly, the intensity of N2O formation (Figure 4A). A similar situation was observed when estimating the number of copies of archaea genes. It means that in tropical soils, biological activity is not limited to the topsoil. Deeper layers may be involved in the biochemical processes in these soils.
For the topsoil, the obtained results were close to the data reported for arable Luvisols and Acrisols in Zambia [43]. Comparing the number of copies of bacterial genes in the studied soils of the MUARIK (Figure 5A) with similar values for the soils of temperate areas showed that the studied samples were closest to Retisols and were an order of magnitude inferior to the values characteristic for soils richer in organic matter such as Phaeozems and Chernozems [44].

4.5. Soil Biological Indicators and Fertilisers

Tropical strongly weathered soils are generally poor in nutrients and thus require the application of fertilisers [1]. The topsoils of the studied soils in Kabanyolo were relatively rich in P and K, indicating that fertilisers were used at the study site. This explains the satisfactory mean level of soil health indicators. However, the difference in P and K levels within the sampling site was large (Table 2), which may have resulted from the non-uniform application of the dressing. Although we did not find correspondence between K and P levels and biochemical and microbiological indicators, we expect that relatively high levels of nutrients have a beneficial effect on soil health through enhanced plant growth.
This particular study did not imply an active experiment with the application of fertilisers, and thus cannot be regarded as evidence of the effect of fertilisers on soil biological activity. However, the indirect impact of the use of urea and DAP on soil biochemical properties may be detected in the soils under study. Spatial heterogeneity of soil properties could be attributed to the non-uniformity of application of fertilisers, which is a function of management approaches on the farm. Moreover, in the past the field was divided into several experimental plots that received different doses of fertilisers. Relatively low doses of nitrogen and phosphate applied still regulate the spatial pattern of the microbiological activity in soils. The increase in soil biological indicators values is definitely associated with higher amounts of fertilisers, while background soil health characteristics are low in tropical soils. Further research is needed to understand better the effect of fertilisers on soil health in tropical environments.
Many studies [2,3,17,19] stress the critical role of soil organic matter in Africa in supporting soil biological activity and biodiversity. In this respect, the use of organic fertilisers should be recommended. Ideally, an integrated system that includes crop rotation and integrated use of organic and mineral fertilisers should be promoted in African agriculture [4]. The deficit of manure and high mineralisation rates under a hot tropical climate may be limiting factors for using organic fertilisers.

5. Conclusions

On the basis of a detailed study, we are able to conclude that the studied soils were characterised by the not very high metabolic activity of the soil microbial pool. Basal respiration and substrate-induced respiration of soils, the C reserves of microbial biomass, the N2O emission from the upper layer of soil, and the potential denitrification activity were similar to the few results reported for other tropical regions of the world, including sub-Saharan Africa. The number of copies of bacterial genes was in the same order as the values reported for arable soils in Zambia. For the microbial pool to be activated and maintained at a high metabolic level, a complex system of reclamation and the introduction of potash and organic fertilisers is required.
Nevertheless, the use of organic fertilisers may have a negative effect on the carbon footprint of tropical agriculture. In our case, annual carbon losses due to microbial respiration in ploughed soils can be more than 30 t ha−1 when applying organic fertilisers, and nitrogen losses due to denitrifications, especially in wet periods of the year, can reach several t ha−1. Nitrogen losses were higher at the ploughed experimental field than in the intact reference profile. The resulting negative balance of carbon and nitrogen should be considered when selecting schemes for agrotechnical maintenance of these agricultural lands to preserve soil fertility and ensure favourable conditions for the functioning of the microbiome that ensures soil fertility.
Soil cultivation did not affect most of the biological indicators of soil condition. The only indicator that showed an expressed reaction on ploughing was N2O emission, which was much higher on the cultivated field than in the control soil.
Biological indicators are potentially useful for soil studies, and future research in Africa may be focused on their application to estimate soil biological parameters of using fertilisers or not in order to see differences in soils at high and low yield parameters, or to see annual variability in biological activity.

Author Contributions

Conceptualisation, P.K. and A.S.; methodology, A.I.; software, A.I. and L.P.; investigation, E.D., I.I., P.M. and E.O.; laboratory investigation A.I., E.D., L.P. and N.M.; writing—original draft preparation, A.I. and L.P.; writing—review and editing, P.K., P.M., J.B.T., and E.O.; visualisation, A.I.; supervision, A.S. and P.K.; project administration, P.K.; funding acquisition, P.K. All authors have read and agreed to the published version of the manuscript.

Funding

This research was supported by the Federal Task Program Research and development in priority areas of development of the scientific and technological complex of Russia for 2014–2020, grant number RFMEFI61319X0095.

Institutional Review Board Statement

Not applicable.

Data Availability Statement

The primary data may be received from the authors upon request.

Acknowledgments

The research was performed in the framework of the state assignment «Soil microbiomes: genomic diversity, functional activity, geography and biotechnological potential», theme no. 121040800174-6, and according to the development program of the Interdisciplinary Scientific and Educational School of Lomonosov Moscow State University, “The future of the planet and global environmental change”. The authors express their personal gratitude to the staff of the Kabanyolo experimental farm.

Conflicts of Interest

The authors declare no conflict of interest. The funders had no role in the design of the study; in the collection, analyses, or interpretation of data; in the writing of the manuscript; or in the decision to publish the results.

References

  1. Hartemink, A.E. Soil Fertility Decline in the Tropics: With Case Studies on Plantations; CABI Publishing: Wallingford, UK, 2003; p. 360. [Google Scholar]
  2. Sanchez, P.A. Soil fertility and hunger in Africa. Science 2002, 295, 2019–2020. [Google Scholar] [CrossRef] [Green Version]
  3. Stewart, Z.P.; Pierzynski, G.M.; Middendorf, B.J.; Prasad, P.V. Approaches to improve soil fertility in sub-Saharan Africa. J. Exp. Bot. 2020, 71, 632–641. [Google Scholar] [CrossRef] [PubMed] [Green Version]
  4. Baah-Ofori, R.N.; Amoakohene, M. A review of soil fertility management communication in sub-Saharan Africa. J. Agric. Rural. Dev. Trop. Subtrop. (JARTS) 2021, 122, 1–12. [Google Scholar] [CrossRef]
  5. Zhang, Е.; Zhan, J.; Zhang, Q.; Yao, L.; Liu, W. Impacts of land use/cover change on terrestrial carbon stocks in Uganda. Phys. Chem. Earth 2017, 101, 195–203. [Google Scholar] [CrossRef]
  6. Abawi, G.S.; Widmer, T.L. Impact of soil health management practices on soilborne pathogens, nematodes and root diseases of vegetable crops. Appl. Soil Ecol. 2000, 15, 37–47. [Google Scholar] [CrossRef]
  7. Kibblewhite, M.G.; Ritz, K.; Swift, M.J. Soil health in agricultural systems. Philos. Trans. R. Soc. B Biol. Sci. 2007, 363, 685–701. [Google Scholar] [CrossRef] [PubMed] [Green Version]
  8. Kihara, J.; Bolo, P.; Kinyua, M.; Nyawira, S.S.; Sommer, R. Soil health and ecosystem services: Lessons from sub-Sahara Africa (SSA). Geoderma 2020, 370, 114342. [Google Scholar] [CrossRef]
  9. Wade, J.; Culman, S.W.; Hurisso, T.T.; Miller, R.O.; Baker, L.; Horwath, W.R. Sources of variability that compromise smineralisable carbon as a soil health indicator. Soil Sci. Soc. Am. J. 2018, 82, 243–252. [Google Scholar] [CrossRef] [Green Version]
  10. Van Bruggen, A.H.; Semenov, A.M. In search of biological indicators for soil health and disease suppression. Appl. Soil Ecol. 2000, 15, 13–24. [Google Scholar] [CrossRef]
  11. Arias, M.E.; González-Pérez, J.A.; González-Vila, F.J.; Ball, A.S. Soil health: A new challenge for microbiologists and chemists. Int. Microbiol. 2005, 8, 13–21. [Google Scholar]
  12. Chaparro, J.M.; Sheflin, A.M.; Manter, D.K.; Vivanco, J.M. Manipulating the soil microbiome to increase soil health and plant fertility. Biol. Fertil. Soils 2012, 48, 489–499. [Google Scholar] [CrossRef]
  13. Singh, B. Are nitrogen sfertilisers deleterious to soil health? Agronomy 2018, 8, 48. [Google Scholar] [CrossRef] [Green Version]
  14. Tripathi, S.; Srivastava, P.; Devi, R.S.; Bhadouria, R. Influence of synthetic sfertilisers and pesticides on soil health and soil microbiology. In Agrochemicals Detection, Treatment and Remediation; Vara Prasad, M.N., Ed.; Butterworth-Heinemann: Oxford, UK, 2020; pp. 25–54. [Google Scholar] [CrossRef]
  15. Okalebo, J.R.; Othieno, C.O.; Nekesa, A.O.; Ndungu-Magiroi, K.W.; Kifuko-Koech, M.N. Potential for agricultural lime on improved soil health and agricultural production in Kenya. In Proceedings of the 9th African Crop Science, Cape Town, South Africa, 28 September–2 October 2009; Volume 9, pp. 339–341. [Google Scholar]
  16. Kaweesa, S.H.; Ndah, H.T.; Schuler, J.; Melcher, A.; Loiskandl, W. Understanding the conditions of conservation agriculture adoption in Lango region, Uganda. Agroecol. Sustain. Food Syst. 2020, 44, 1260–1279. [Google Scholar] [CrossRef]
  17. Okiror, P.; Lejju, J.B.; Bahati, J.; Rugunda, G.K.; Sebuuwufu, C.I.; Mulindwa, P.; Ocan, J.J. Suitability of Kabanyolo soils for fruit and vegetable production. Open J. Soil Sci. 2017, 7, 19–33. [Google Scholar] [CrossRef] [Green Version]
  18. Ministry of Lands, Housing and Urban Development, Republic of Uganda. The National Land Use Policy; Ministry of Lands, Housing and Urban Development, Republic of Uganda: Kampala, Uganda, 2013; p. 62.
  19. Magunda, M.K.; Larson, W.E.; Linden, D.R.; Nater, E.A. Changes in microrelief and their effects on infiltration and erosion during simulated rainfall. Soil Technol. 1997, 10, 57–67. [Google Scholar] [CrossRef]
  20. Van Reeuwijk, L.P. Procedures for Soil Analysis; ISRIC Technical paper 9; ISRIC: Wageningen, The Netherlands, 2002; p. 90. [Google Scholar]
  21. Bashour, I.I.; Sayegh, A.H. Methods of Analysis for Soils of Arid and Semi-Arid Region; Food and Agriculture Organization of the United Nations: Rome, Italy, 2007; p. 119. Available online: https://msibsri4313.files.wordpress.com/2013/11/methods-of-soil-analysis-for-arid-semiarid-regions.pdf (accessed on 11 October 2021).
  22. Anderson, J.P.E.; Domsch, K.H. Application of eco-physiological quotients (qCO2 and qD) on microbial biomasses from soils of different cropping histories. Soil Biol. Biochem. 1990, 22, 251–255. [Google Scholar] [CrossRef]
  23. Berg, B.; Wessén, B.; Ekbohm, G. Nitrogen level and decomposition in Scots pine needle litter. Oikos 1982, 38, 291–296. [Google Scholar] [CrossRef]
  24. Anderson, J.P.E.; Domsch, K.H. A physiological method for the quantitative measurement of microbial biomass in soils. Soil Biol. Biochem. 1978, 10, 215–221. [Google Scholar] [CrossRef]
  25. SsoFast EvaGreen Supermix. Available online: http://www.bio-rad.com/webroot/web/pdf/lsr/literature/10014647A.pdf (accessed on 8 July 2021).
  26. Yu, Y.; Lee, C.; Hwang, S. Analysis of community structures in anaerobic processes using a quantitative real-time PCR method. Water Sci. Technol. 2005, 52, 85–91. [Google Scholar] [CrossRef]
  27. Manucharova, N.A.; Ksenofontova, N.A.; Belov, A.A.; Kamenskiy, N.N.; Arzamazova, A.V.; Zenova, G.M.; Kinzhaev, R.R.; Trofimov, S.Y.; Stepanov, A.L. Prokaryotic component of oil-contaminated oligotrophic peat soil under different levels of mineral nutrition: Biomass, diversity, and activity. Euras. Soil Sci. 2021, 54, 89–97. [Google Scholar] [CrossRef]
  28. Fierer, N.; Jackson, J.A.; Vilgalys, R.; Jacksson, R.B. Assessment of soil microbial community structure by use of taxon-specific quantitative PCR assays. Appl. Environ. Microbiol. 2005, 71, 4117. [Google Scholar] [CrossRef] [PubMed] [Green Version]
  29. Tenywa, J.S.; Amoding-Katushabe, A.; Jumba, F. Distribution of nitrate and related nutrient stocks in a fertilised horticultural valley soil in central Uganda. Afr. J. Rural. Dev. 2020, 4, 413–420. Available online: http://afjrd.org/jos/index.php/afjrd/article/view/2118 (accessed on 11 October 2021).
  30. Pidgeon, J.D. The measurement and prediction of available water capacity of ferrallitic soils in Uganda. J. Soil Sci. 1972, 23, 431–441. [Google Scholar] [CrossRef]
  31. Banage, W.B.; Visser, S.A. Soil moisture and temperature levels and fluctuations in one year in a Uganda soil catena. East Afr. Agric. For. J. 1967, 32, 450–455. [Google Scholar] [CrossRef]
  32. Twongyirwe, R.; Sheil, D.; Majaliwa, J.G.M.; Ebanyat, P.; Tenywa, M.M.; van Heist, M.; Kumar, L. Variability of soil organic carbon stocks under different land uses: A study in an afro-montane landscape in southwestern Uganda. Geoderma 2013, 193, 282–289. [Google Scholar] [CrossRef]
  33. Musinguzi, P.; Tenywa, J.S.; Ebanyat, P.; Basamba, T.A.; Tenywa, M.M.; Mubiru, D.N.; Zinn, Y.L. Soil organic fractions in cultivated and uncultivated Ferralsols in Uganda. Geoderma Reg. 2015, 4, 108–113. [Google Scholar] [CrossRef]
  34. Tumwebaze, S.B.; Byakagaba, P. Soil organic carbon stocks under coffee agroforestry systems and coffee monoculture in Uganda. Agric. Ecosyst. Environ. 2016, 216, 188–193. [Google Scholar] [CrossRef]
  35. Musinguzi, P.; Ebanyat, P.; Tenywa, J.S.; Basamba, T.A.; Tenywa, M.M.; Mubiru, D.N. Critical soil organic carbon range for optimal crop response to mineral fertiliser nitrogen on a Ferralsol. Exp. Agric. 2016, 52, 635–653. [Google Scholar] [CrossRef]
  36. Mallarino, A.P.; Sawyer, J.E.; Barnhart, S.K. A General Guide for Crop Nutrient and Limestone Recommendations in Iowa; Extension and Outreach Publications 82; Iowa State University, University Extension: Ames, IA, USA, 2013; pp. 1–12. Available online: https://lib.dr.iastate.edu/extension_pubs/82 (accessed on 11 October 2021).
  37. Hall, N.M.; Kaya, B.; Dick, J.; Skiba, U.; Niang, A.; Tabo, R. Effect of improved fallow on crop productivity, soil fertility and climate-forcing gas emissions in semi-arid conditions. Biol. Fertil. Soils 2006, 42, 224–230. [Google Scholar] [CrossRef] [Green Version]
  38. Srivastava, S.C.; Singh, J.S. Effect of cultivation on microbial carbon and nitrogen in dry tropical forests soil. Biol. Fertil. Soils 1989, 8, 343–348. [Google Scholar] [CrossRef]
  39. Gyapong, K.A.B.; Ayisi, C.L. The effect of organic manures on soil fertility and microbial biomass carbon, nitrogen and phosphorus under maise-cowpea intercropping system. Discourse J. Agric. Food Sci. 2015, 3, 65–77. [Google Scholar]
  40. Bastida, F.; Zsolnay, A.; Hernández, T.; García, C. Past, present and future of soil quality indices: A biological perspective. Geoderma 2008, 147, 159–171. [Google Scholar] [CrossRef]
  41. Susyan, E.A.; Wirth, S.; Ananyeva, N.D.; Stolnikova, E.V. Forest succession on abandoned arable soils in European Russia e Impacts on microbial biomass, fungal-bacterial ratio, and basal CO2 respiration activity. Eur. J. Soil Biol. 2011, 47, 169–174. [Google Scholar] [CrossRef]
  42. Saviozzi, A.; Levi-Minzi, R.; Cardelli, R.; Riffaldi, R. A comparison of soil quality in adjacent cultivated, forest and native grassland soils. Plant Soil 2001, 233, 251–259. [Google Scholar] [CrossRef]
  43. Ohigashi, T.; Schloter, M.; Schulz, S.; Munthali, K.; Uchida, Y. Changes in soil prokaryotic diversity in response to land-use changes in Sub-Saharan Africa. Soil Syst. 2021, 5, 62. [Google Scholar] [CrossRef]
  44. Zhelezova, A.D.; Tkhakakhova, A.K.; Yaroslavtseva, N.V.; Garbuz, S.A.; Lazarev, V.I.; Kogut, B.M.; Kutovaya, O.V.; Kholodov, V.A. Microbiological parameters of aggregates in typical chernozems of long-term field experiments. Euras. Soil Sci. 2017, 50, 701–707. [Google Scholar] [CrossRef]
Figure 1. Study location in Wakiso, Uganda: (A)—general map, (B)—Makerere University Agricultural Research Institute Kabanyolo, (C)—Experimental field/sampling points.
Agriculture 11 01228 g001
Figure 2. Indicators of respiratory activity of the microbial community participating in Table 2. (A)—basal respiration (RB), ng−1·h−1; (B)—substrate-induced respiration (Rs), ng C-CO2·g−1·h−1; (C)—the ratio of basal and substrate-induced respiration. 1–8—points of the experimental field; 9—background soil. Homogeneous groups include those points for which the differences between the averages are statistically insignificant.
Agriculture 11 01228 g002
Figure 3. Relative indices of the functioning of microbial communities in the profiles of the background and soil of the experimental field: (A)—the metabolic coefficient of microbial communities, qCO2; (B)—the proportion of carbon of microbial biomass from organic carbon, %; (C)—the ratio of qCO2/Corg. Homogeneous groups include those points for which the differences between the averages are statistically insignificant.
Agriculture 11 01228 g003aAgriculture 11 01228 g003b
Figure 4. Indicators of the activity of the microbial community involved in the transformation of nitrogen in soils of the experimental field. (A)—the formation of N2O during the moistening of soil samples; (B)—the potential activity of denitrification during the introduction of glucose and nitrates; (C)—the potential activity of nitrogen fixation. Homogeneous groups include those points for which the differences between the averages are statistically insignificant.
Agriculture 11 01228 g004
Figure 5. The number of copies of genes in the background and soils of the experimental field: (A)—bacterial; (B)—archaeal. 1–8—points of the experimental field; 9—reference soil. Homogeneous groups include those points for which the differences between the averages are statistically insignificant. Vertical bars denote 0.95 confidence intervals.
Agriculture 11 01228 g005
Table 1. The DNA-specific primers used in this study.
Target Group of Organisms/GenePrimers
1—Forward;
2—Reverse
The Nucleotide Sequence of the Probe (5′-3′3′)
Archaeaarc915f
arc1059r
AGGAATTGGCGGGGGAGCAC
GCCATGCACCWCCTCT
BacteriaEub338
Eub518
ACT CCT ACG GGA GGC AGCAG
ATT ACC GCG GCT GCT GG
Table 2. Some chemical properties of the profile of Plinthic Ferralsol (Hypereutric) and its surface horizons on the experimental field.
Horizon, Depth, cmOCpHH20pHKClP2O5 K2OCa2+Mg2+K+Na+CECBSFed
g kg1 mg kg−1cmolc kg−1%
Soil profile outside the field
Ap (0–20)15.05.514.7158.91109.94.751.520.180.0028.3477.32.60
AB (20–40)12.35.465.1216.6073.22.791.160.050.0115.0080.13.12
Bo1 (40–79)12.05.114.9310.5063.82.231.120.040.0054.6473.03.42
Bo2 (79–104)11.74.974.8613.4038.11.510.990.000.0053.7766.63.38
Surficial horizon of the soil on the experimental field (mean values, n = 11)
Ap (0–20)14.4 ± 0.95.52 ± 0.204.84 ± 0.2654.11 ± 43.98128.27 ± 58.135.10 ± 1.171.48 ± 0.200.26 ± 0.180.005 ± 0.0038.09 ± 0.6082.74 ± 13.34-
AB (20–30)13.2 ± 1.05.30 ± 0.614.97 ± 0.3846.73 ± 42.9694.30 ± 76.694.38 ± 3.031.37 ± 0.550.14 ± 0.130.010 ± 0.0016.89 ± 2.8181.63 ± 20.82-
OC—organic carbon; CEC—cation exchange capacity; BS—base saturation; Fed—iron, extracted with Na dithionite-citrate-bicarbonate solution.
Table 3. Microbial biomass, μg C·g−1of soil.
HorizonApApABBoBC
Depth, cm0–1010–2020–3040–7979–104
Mean for the experimental field403.7 ± 121.6217.8 ± 128.3143.6 ± 36.7
Reference profile193.2 ± 4.970.0 ± 8.460.7 ± 4.75.81 ± 1.0
Publisher’s Note: MDPI stays neutral with regard to jurisdictional claims in published maps and institutional affiliations.

