Article

Fertilization Regulates Accumulation and Allocation of Biomass and Nutrients in Phoebe bournei Seedlings

1
College of Forestry, Fujian Agriculture and Forestry University, Fuzhou 350002, China
2
Department of Forest and Conservation Sciences, Faculty of Forestry, University of British Columbia, 2424 Main Mall, Vancouver, BC V6T 1Z4, Canada
3
NurserytoForest Solutions, North Saanich, BC V8L 5K7, Canada
*
Author to whom correspondence should be addressed.
Agriculture 2021, 11(12), 1187; https://doi.org/10.3390/agriculture11121187
Submission received: 7 November 2021 / Revised: 17 November 2021 / Accepted: 17 November 2021 / Published: 24 November 2021

Abstract

:
To study the effect of N-P-K fertilization on Phoebe bournei seedlings’ organs dry biomass, and nutrients accumulation and allocation, and to further uncover how nutrients regulating dry biomass formation through fertilization, we utilized the “3414” experiment design. The results showed that N, P, and K fertilizer promoted dry biomass accumulation, and root, stem, and total plant N, P, and K content and accumulation in seedlings. The dry biomass accumulations of root, stem, and total plant increased first and then decreased with the increase of N, P, and K application rates, which was basically consistent with the change in dry biomass allocations and N, P, and K contents, accumulations, and allocations. Root N accumulation, root P accumulation, and total plant K accumulation were the key indicators for seedlings growth. N fertilizer had the greatest effect on total dry biomass and root N accumulation, was the most important fertilizer for the growth of Phoebe bournei seedlings, can regulate the growth of root and leaves, is beneficial to root growth at medium-low N fertilizer levels (N: 0.266–0.532 g·plant−1), and leaves growth at high N fertilizer level (N: 0.798 g·plant−1). P fertilizer rate can regulate the seedling stem growth, reaching the maximum at the medium level P application (P2O5: 0.1332 g·plant−1). K fertilizer had the greatest effect on the root P accumulation and total K accumulation, promoting K transport from leaves to root, improved root and stem growth, and inhibited leaves growth. The N, P, and K fertilizer three-factor application can better promote nutrient uptake than double-factor and single-factor fertilization, with highest dry biomass accumulation at the medium level of N, P, K fertilizer (N: 0.532 g·plant−1; P2O5: 0.1232 g·plant−1; K2O: 0.356 g·plant−1). In conclusion, N, P, and K fertilization promoted the N, P, and K absorption, increased root, stem, and leaves N, P, and K content and accumulation, and promoted the seedling dry biomass accumulation, but reversed under excessive application of N, P, and K fertilizer; and N fertilizer was beneficial to root and leaves growth, P fertilizer to stem growth, and K fertilizer to material transfer, which provided a theoretical basis for robust Phoebe bournei seedling cultivation.

1. Introduction

Nitrogen (N), phosphorus (P), and potassium (K) are essential nutrients for plant growth and development, act as components of important organic compounds, and play significant roles in various physiological and metabolic processes [1,2,3]. N, P, and K fertilization improve seedling quality and stress resistance through promoting their growth and biomass accumulation [4,5,6,7], but their types and concentrations can restrict seedling growth state and rate [8,9].
Nutrient accumulation and allocation in plants reflect their demand and specific nutrient elements absorption capacity under certain ecological conditions as well as plant–environment interaction [10,11]. Fertilization changes soil ecological condition, significantly affecting plants nutrient content, accumulation, and allocation in plant organs [12,13,14]. N, P, and K fertilization showed different nutrient elements enrichment, appropriate N, P, and K fertilization increased contents and accumulations of seedlings in different organs [5,15,16]. Too little or excessive fertilization was not conducive to nutrient element absorption, with antagonism between nutrient elements [17,18,19]. Plant biomass accumulation has been proven to be closely related to nutrients accumulation [20]. Furthermore, the effect of fertilization on plants’ growth, development, and biomass is largely dependent on the coordination of nutrients uptake, assimilation, and allocation in plant organs [21,22]. Therefore, fertilization plays an important role in promoting good seedling quality. At present, most fertilization studies focused on plants nutrient content, accumulation, and allocation in plant organs under single or two fertilization conditions of N, P, and K fertilizers, while there are few studies on the combined effect of N, P, and K fertilizer. Second, what kind of fertilization method and rate is most conducive to nutrient absorption and the growth of roots, stems, and leaves was rarely reported. At the same time, how N, P, and K combined fertilization affecting the content, accumulation, and allocation of macro-elements in plant organs, and their relationship with the growth of seedlings were also poorly understood.
However, different species perform differently under different fertilization conditions [5,15,16]. Phoebe bournei (Hemsl.) Yang is an endangered and rare tree species in China, whose wood has unique attributes and high economic value, leading to increase market demand [23,24]. Additionally, the production of robust seedlings is essential for meeting P. bournei planting demands [25]. At present, extensive studies on P. bournei seedling biology, ecophysiology, afforestation technology, and seedling cultivation have been conducted [26,27,28]. Recently, the emphasis of research on the cultivation of robust P. bournei seedlings was the effects of fertilization time, rate, and type [29,30]; however, studies on nutrient absorption, biomass, and nutrient accumulation and allocation as affected by fertilization, and which kind of fertilization method and rate is conducive to the growth of roots, stems, and leaves in P. bournei seedling have been rare.
Compared with other fertilization methods, the “3414” fertilization concept utilizes the incomplete orthogonal regression design as a three-factor and four-level fertilizer test, which has advantages of complete factors, multiple levels, simple operation, and convenient analysis, and meets the professional requirements of fertilizer decision [31]. Therefore, this study used “3414” field experiment, to assess the characteristics of dry biomass, nutrients accumulation, and allocation, to uncover the regulatory effects of fertilization on dry biomass, and nutrient accumulation and allocation, to reveal biomass and nutrient relationships, and to obtain the fertilization method and rates that are most conducive to the growth of roots, stems, and leaves, which can provide the theoretical basis for rational fertilization, and high-quality and efficiency propagation of P. bournei seedlings.

2. Materials and Methods

2.1. Site Description

The experiment was conducted at the Fujian Agriculture and Forestry University, Fuzhou, Fujian Province, China (119°23′ E, 26°09′ N) field nursery in 2018. This area belongs to subtropical marine climate. The annual average temperature is 19.6 °C, with an extreme minimum temperature of −2.5 °C, and an extreme maximum of 42.3 °C. The number of annual sunshine hours is 1848 h. The effective accumulated temperature ≥10 °C was 5880 °C, with 326 day >0 °C. The annual precipitation is 1490 mm, with the annual average humidity of 77% [32].

2.2. Materials

One-year-old P. bournei bareroot seedlings were provided by the Fujian Academy of Forestry. In March 2018, well-grown seedlings with similar height (20.2 ± 0.9 cm) and diameter (2.3 ± 1.0 mm) with well-developed buds, were selected for the experimental population. These seedlings had, respectively, total N, P, and K contents of 1.219, 1.555, and 14.022 g·kg−1 at the start of the experiment.
The soil substrate used was a mixture of red laterite soil, vermiculite, and sand (6:2:2 by volume). The soil mixture was characterized as having 5.78 g·kg−1 organic matter, pH 5.30, and effective N-P-K content of 17.0, 15.6, and 239.1 mg·kg−1, respectively. Seedlings were grown in plastic pots (diameter × height, 25 × 25 cm), and the dry soil weight of each pot was 6.0 kg. The fertilizers used were urea (N, 46%), superphosphate (P2O5, 12%), and potassium chloride (K2O, 60%) for the experiment [32].

2.3. Experimental Design

The test followed the “3414” fertilizers experimental design [31], which was set as three factors with N, P, and K. Every factor had four fertilization levels (0, 1, 2, 3): 0 as control (no fertilizer), the common fertilizer rates as level 2 (medium fertilizer), 0.5-times of level 2 as level 1 (low fertilizer), and 1.5-times of level 2 as level 3 (high fertilizer), respectively. The common fertilizer rates in the test were 0.532, 0.133, and 0.356 g·plant−1 for N, P2O5, and K2O, respectively [28,30]. The specific rates of fertilizer applied to each treatment are shown in Table 1, calculated in terms of N, P2O5, and K2O. This study utilized 1260 seedlings, and each treatment was replicated three times, with 30 plants at each treatment replication [32]. The field fertilizer experiment replications were randomly arranged (complete randomized design) to minimize any environmental effects as well as avoiding clustering of a specific treatment.

2.4. Experimental Management

This field experiment was performed under semi-controlled conditions (i.e., ambient conditions) that lasted for 10 months from March to December in 2018. P was used as the base fertilizer, while N and K were applied in different stages according to the seedling annual growth characteristics [32]. The applied fertilization regime varied over time (April: 25% N and 20% K, June: 35% N and 25% K, August: 25% N and 35% K, and October: 15% N and 20% K) through liquid application of fertilizer (concentration 0.05%). With P. bournei seedlings as shade plant, the nursery is equipped with a 2.7 m high shed providing light intensity equivalent to 75% natural light. Seedlings were watered on a varying schedule based on maintaining the desired soil water status of ~75% field capacity (i.e., determined by the empirical method of topsoil coloration resulting in watering at ~7 days during March to April, ~15 days during May to July, not watered in August, ~10 days during September to November, ~15 days in December) [32].

2.5. Seedling Measurement Parameters

In December 2018, after growth cessation, a random sample of three replications of three seedlings per treatment (total of nine seedlings) were harvested to measure their biomass (Figure 1). Seedlings were washed with water, divided into three parts (roots, stems, and leaves), fixed at 105 °C for 15 min, and then dried at 75 °C for ~12 h to achieve a stable weight. Samples’ dry weights were measured with 0.001 g accuracy by electronic scales (AL204, Metiler-Toledo, Melbourne, Australia). The dry biomass accumulation of P. bournei seedlings under different N-P-K fertilization is presented in Table 2.
T6 had the greatest biomass accumulation for total plant, leaf, stem, and root. P and K increased all organs biomass accumulation, N increasing total plant, stem and root biomass at low-medium level. N, P, and K firstly increased root, stem, leaves, and total dry biomass accumulation, followed by a decrease, reaching the maximum value at medium level with increasing the concentration [32].
Roots, stems, and leaves were made into analytical samples by grinding with a plant crusher, and then processing through a 0.5 mm plastic sieve. Samples were put into a self-sealing bag for the determination of total N, P, and K. Samples of 0.30 g were prepared by the elimination method to produce the test solution, N, P, and K contents were determined by Kjeldahl method (ATN-300, Hongji, Shanghai, China) [33], molybdenum-antimony colorimetric method (UV-2600A, Unicom, Shanghai, China) [34], FP640 flame photometry (Shanghai Precision Scientific Instrument Co., Ltd., Shanghai, China) [35], respectively. Each indicator was repeated three times.

2.6. Data Processing and Analysis

2.6.1. Calculation of Comprehensive Index

Based on the seedling dry biomass (root, stem, and leaves) and N, P, K content data, the following parameters and indices were calculated:
Accumulation of N (P, K) in each organ of seedling (root, stem, and leaves) (mg·plant−1) = dry biomass (g·plant−1) in each organ (root, stem, and leaves) × N (P, K) content in each organ (root, stem, and leaves) (g·kg−1),
Total seedling N (P, K) accumulation (mg·plant−1) = root N (P, K) accumulation + stem N (P, K) accumulation + leaves N (P, K) accumulation,
Dry biomass or N (P, K) allocation rate of each organ = dry biomass mass or N (P, K) accumulation in each organ / total seedling dry biomass mass or N (P, K) accumulation × 100%

2.6.2. Data Analysis

The “3414” fertilizers experiment can analyze the single factor, two-factor, and three-factor interaction effects of N, P, and K fertilization with 14 treatment combinations. In the single-factor effect treatments, when the “2” level is fixed by P and K fertilizers, four levels of N fertilizer were T2 (0 level), T3 (low level), T6 (medium level), and T11 (high level). When the “2” level is fixed by N and K fertilizers, four levels of P fertilizer were T4 (0 level), T5 (low level), T6 (medium level), T7 (high level). When the “2” level is fixed by N and K fertilizers, four levels of K fertilizer were T8 (0 level), T9 (low level), T6 (medium level), T10 (high level). The three-factor interaction experiment of N × P × K was set at T1–14 treatments [31,32].
We used Excel 2010 and SPSS 22.0 (Chicago, IL, USA) to conduct the range analyses which was the difference between the maximum value and the minimum at different levels, and to analyze average values for signal-factor effects of N, P, and K fertilizer factors. A factorial analysis of variance (ANOVA), the Duncan’s multiple comparisons (α = 0.05), stepwise regression analysis, path analysis, and correlation analysis were performed by SPSS 22.0 (Chicago, IL, USA) for three-factor interaction effect of N, P, and K fertilizer. Graphs were constructed with GraphPad Prism 7 (GraphPad Software Inc., San Diego, CA, USA) software.

3. Results

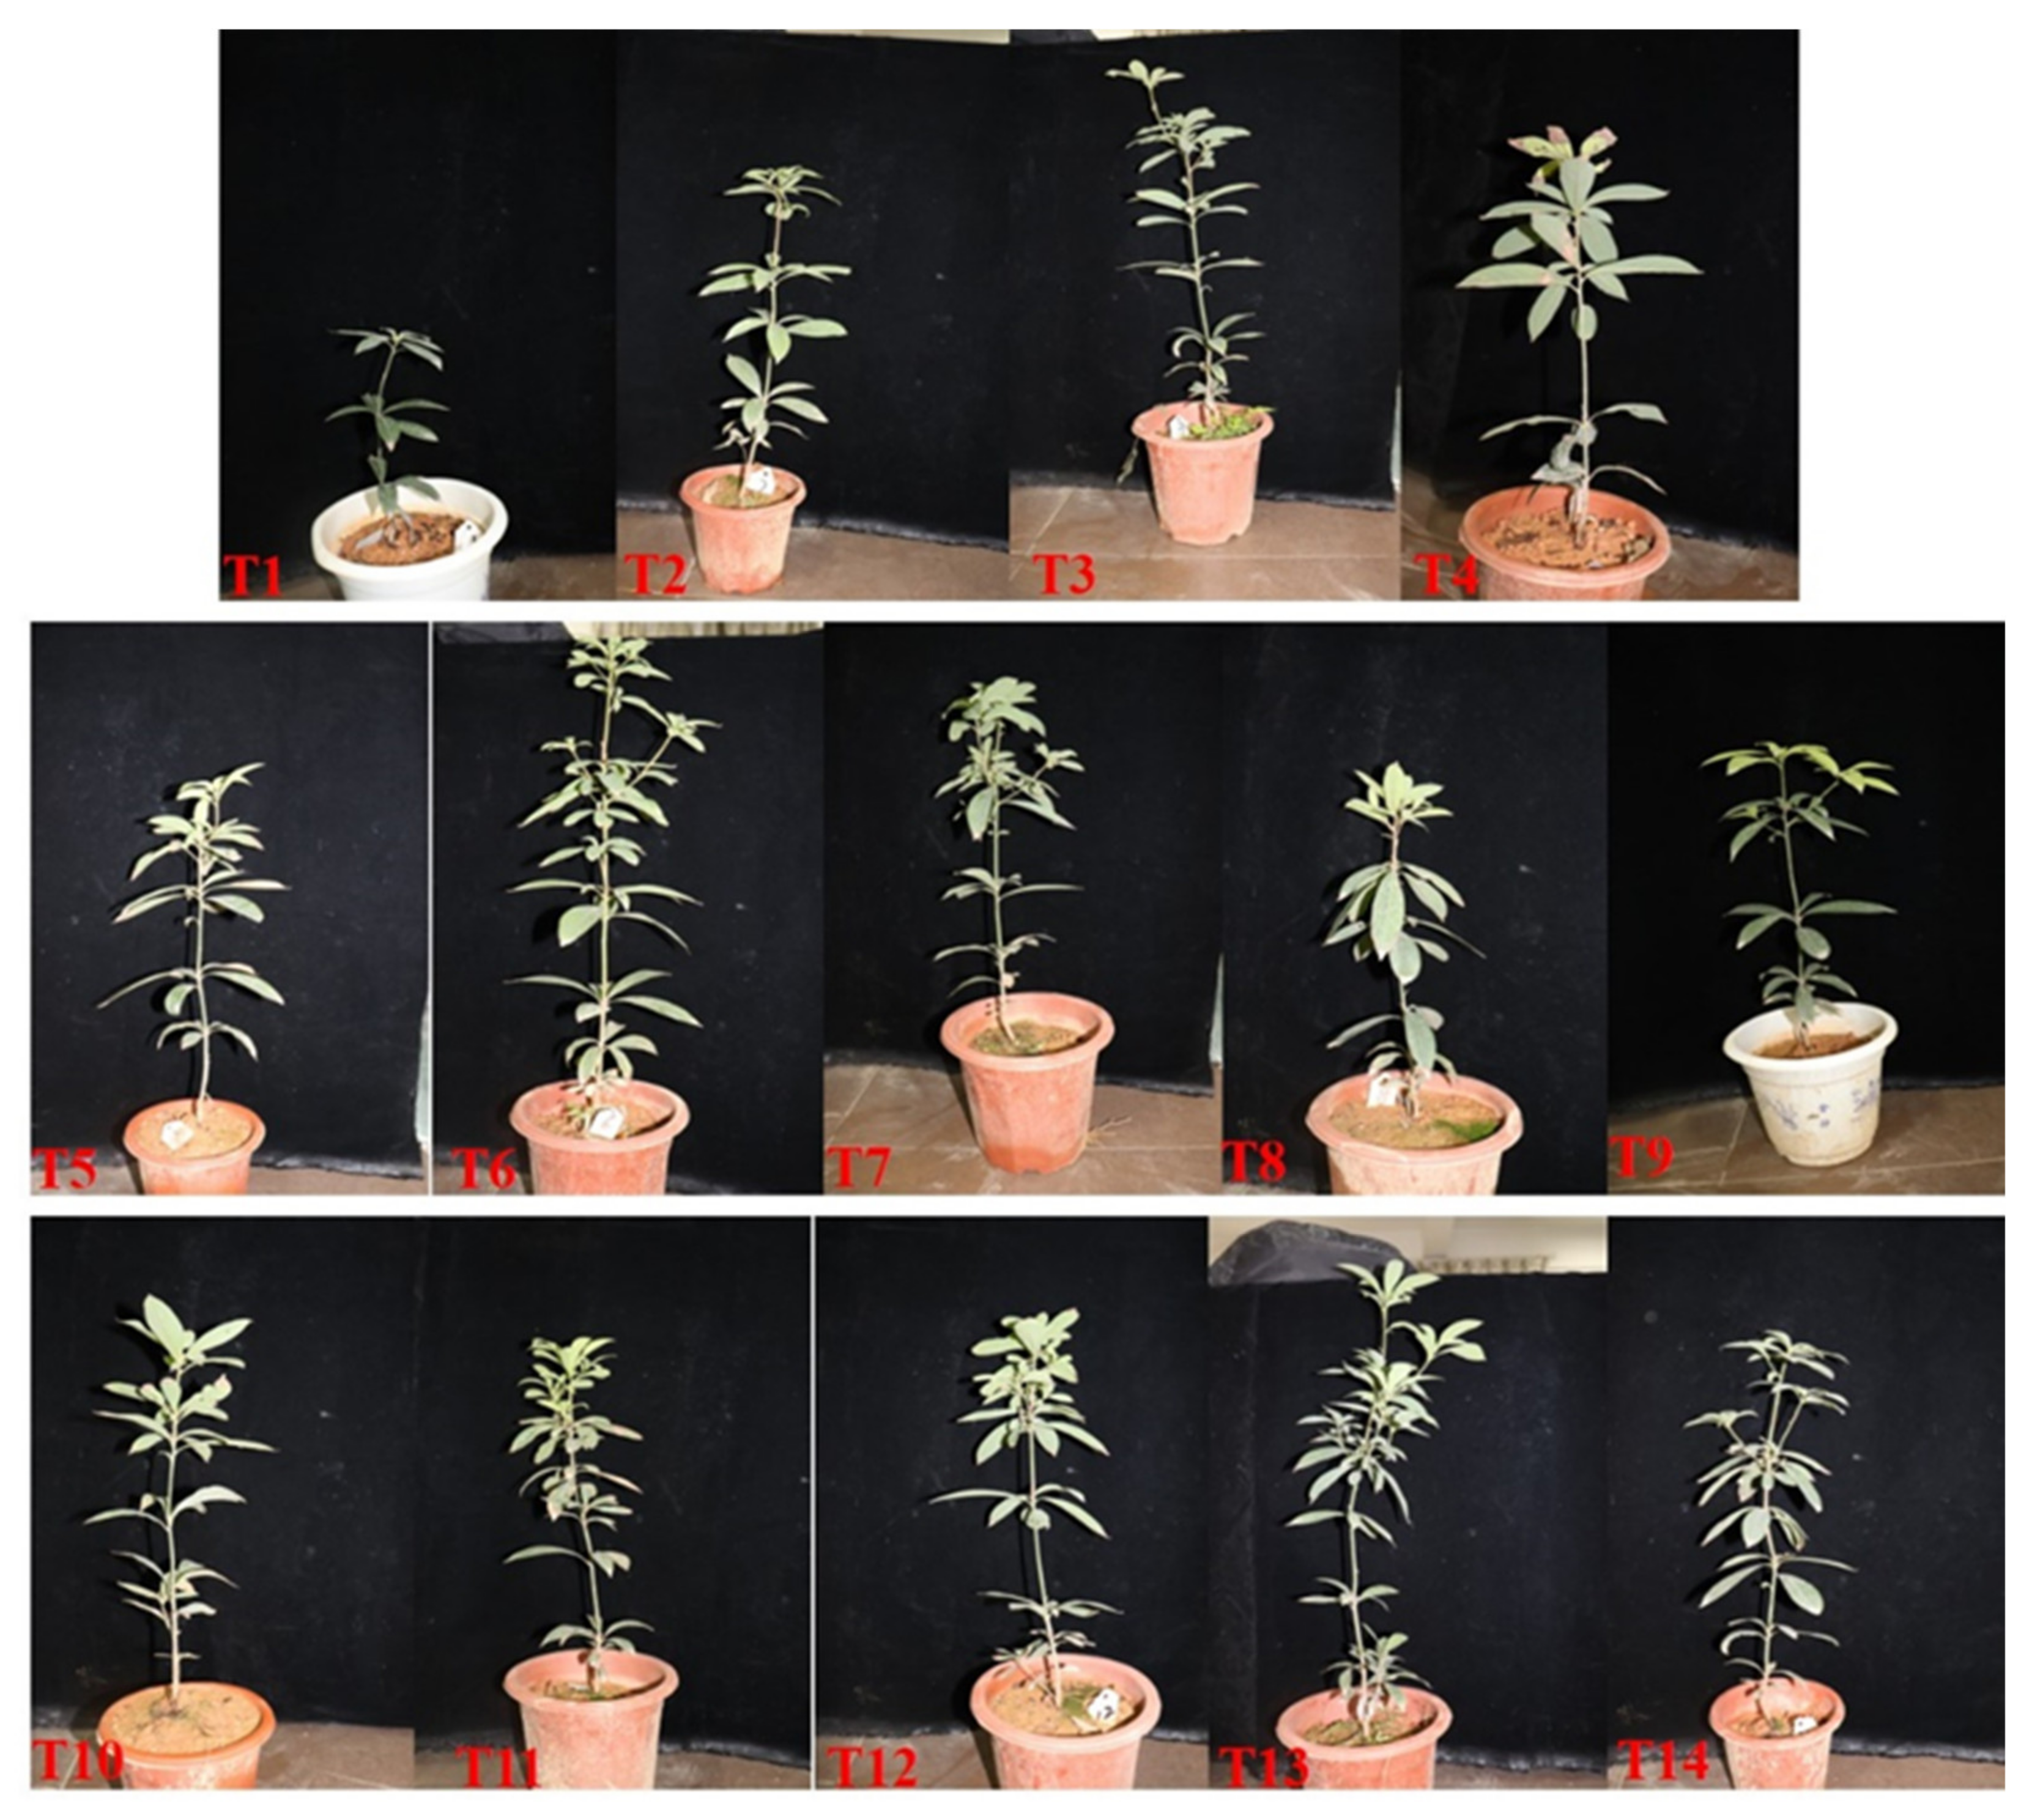
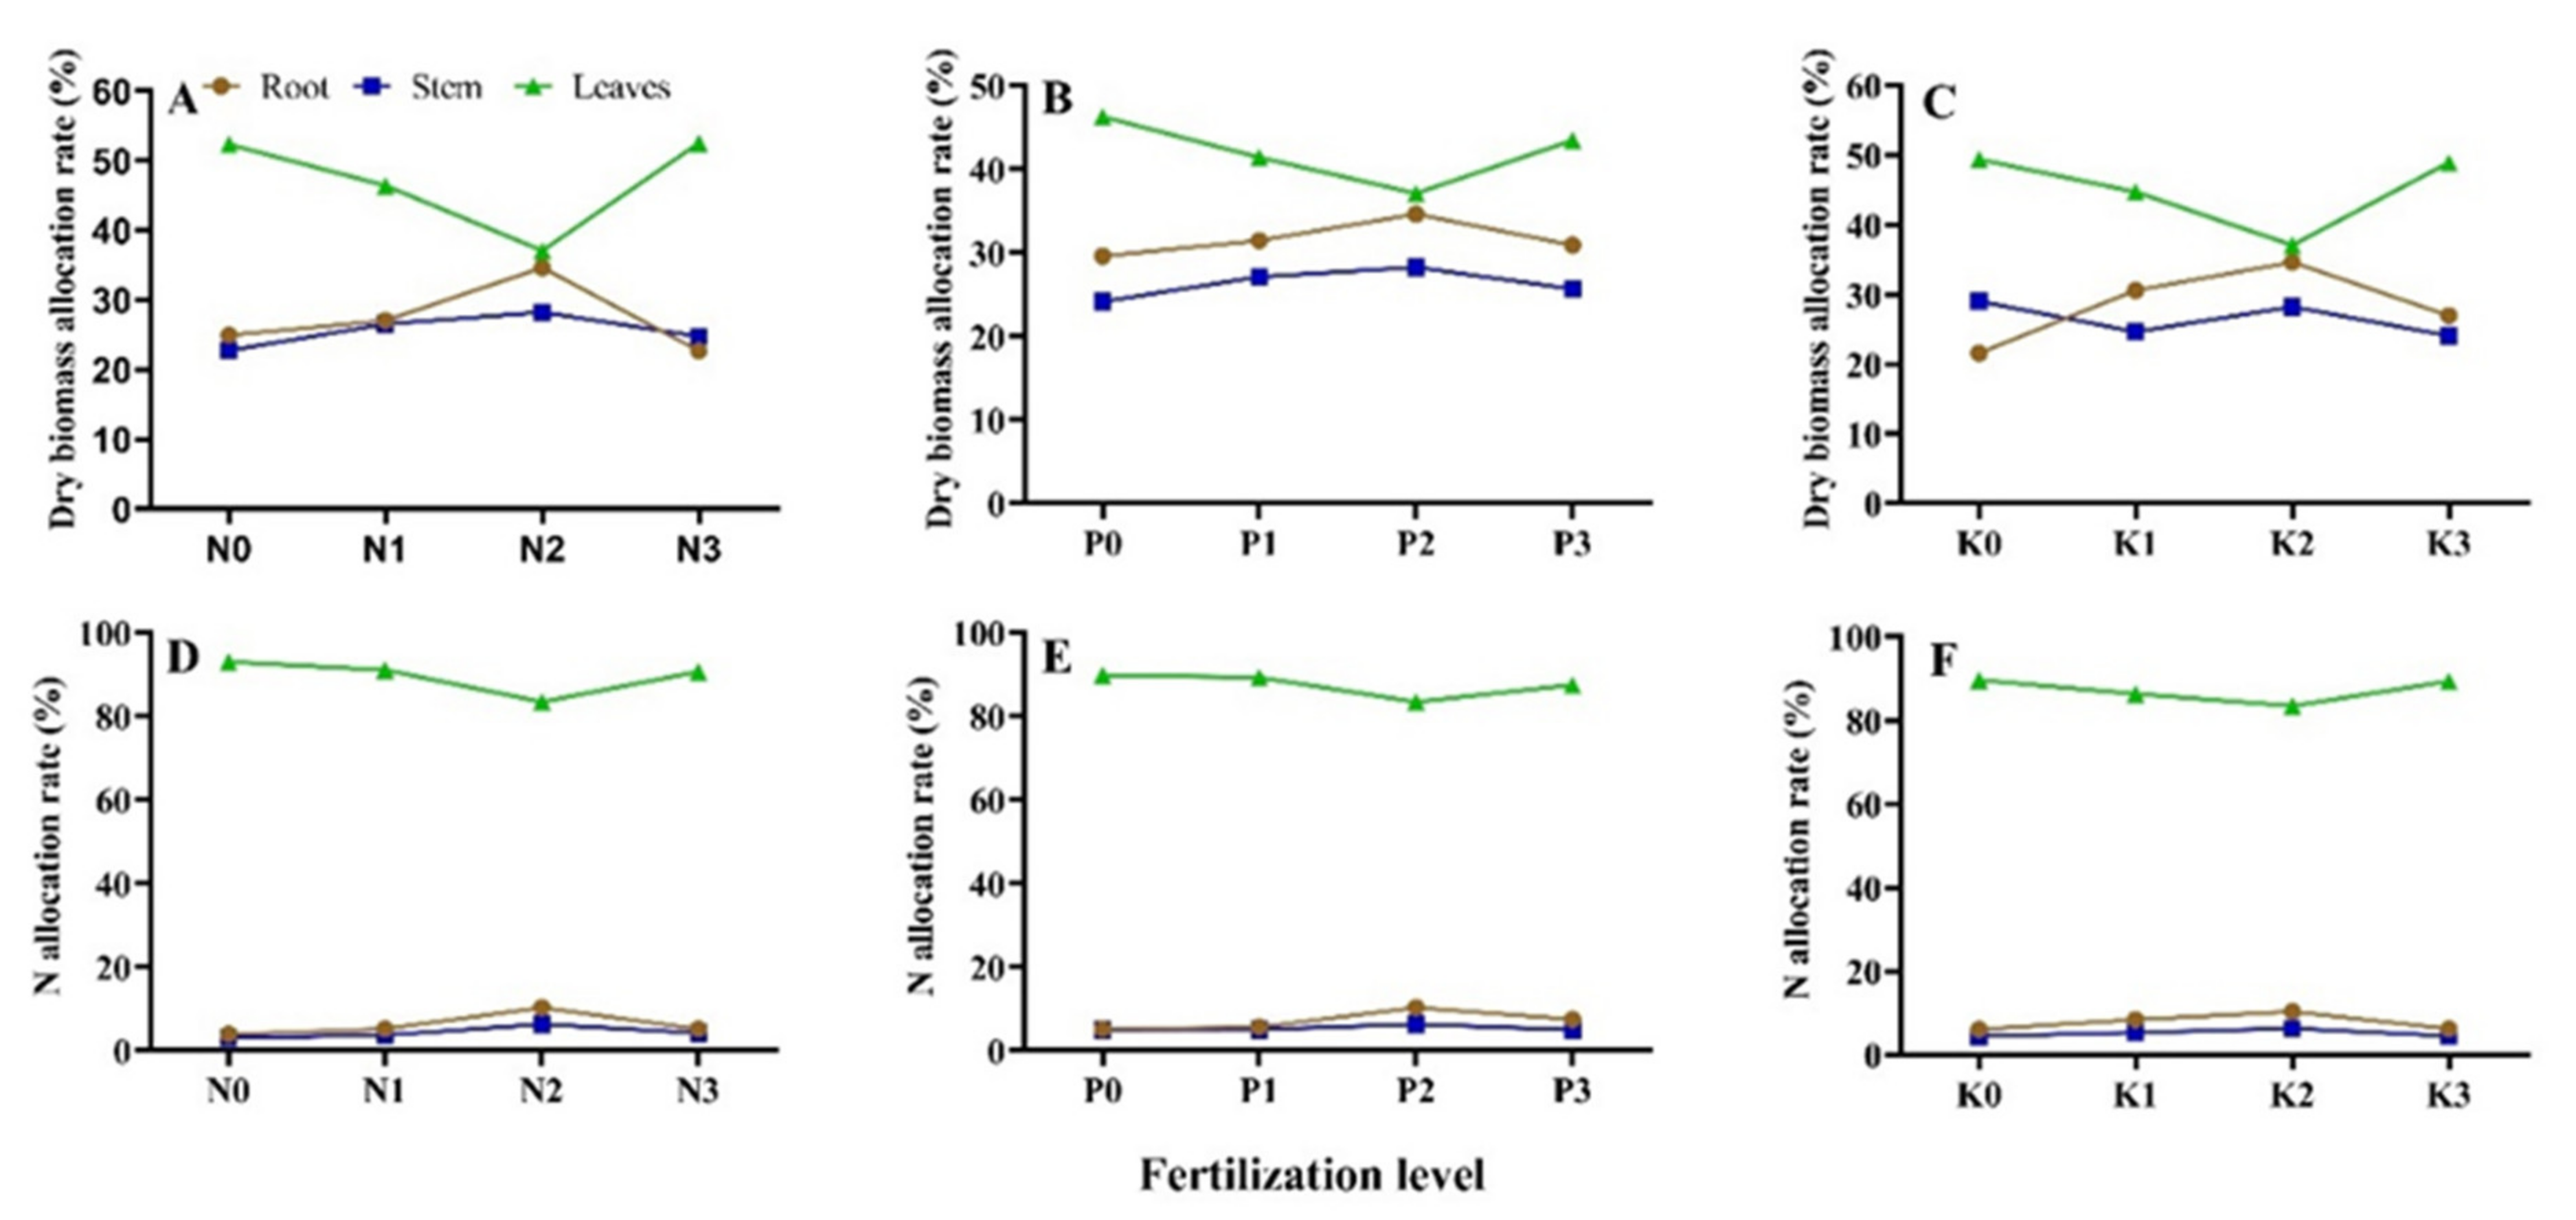
3.1. Seedlings Dry Biomass Allocation under Different N-P-K Fertilization

The different fertilizer application ratios significantly affected P. bournei seedlings leaves, stem, and root dry biomass contribution rate (Table 3). Leaves dry biomass allocation rate was highest, followed by root and stem under all N, P, and K fertilization application rates. The greatest biomass contribution rate was observed for leaves at T11 and T2, stem at T13, and root at T6. Some of biomass allocation rates were lower than T1 (the control) for all treatments (leaves of T7, T5, and T6, stem exception of T13, T8, and T6, and root T8, T11, T13, T2, T10, T3, and T14).
In the single-factor effect treatments, different N, P and K fertilization levels influenced the dry biomass contribution rate (Figure 2A–C); the root biomass allocation rate firstly increased, then decreased, reaching the maximum value at a medium level; the leaves biomass allocation rate was the opposite of the root biomass allocation; the stems biomass allocation rate changed course with increase in the application of N, P and K fertilizer.

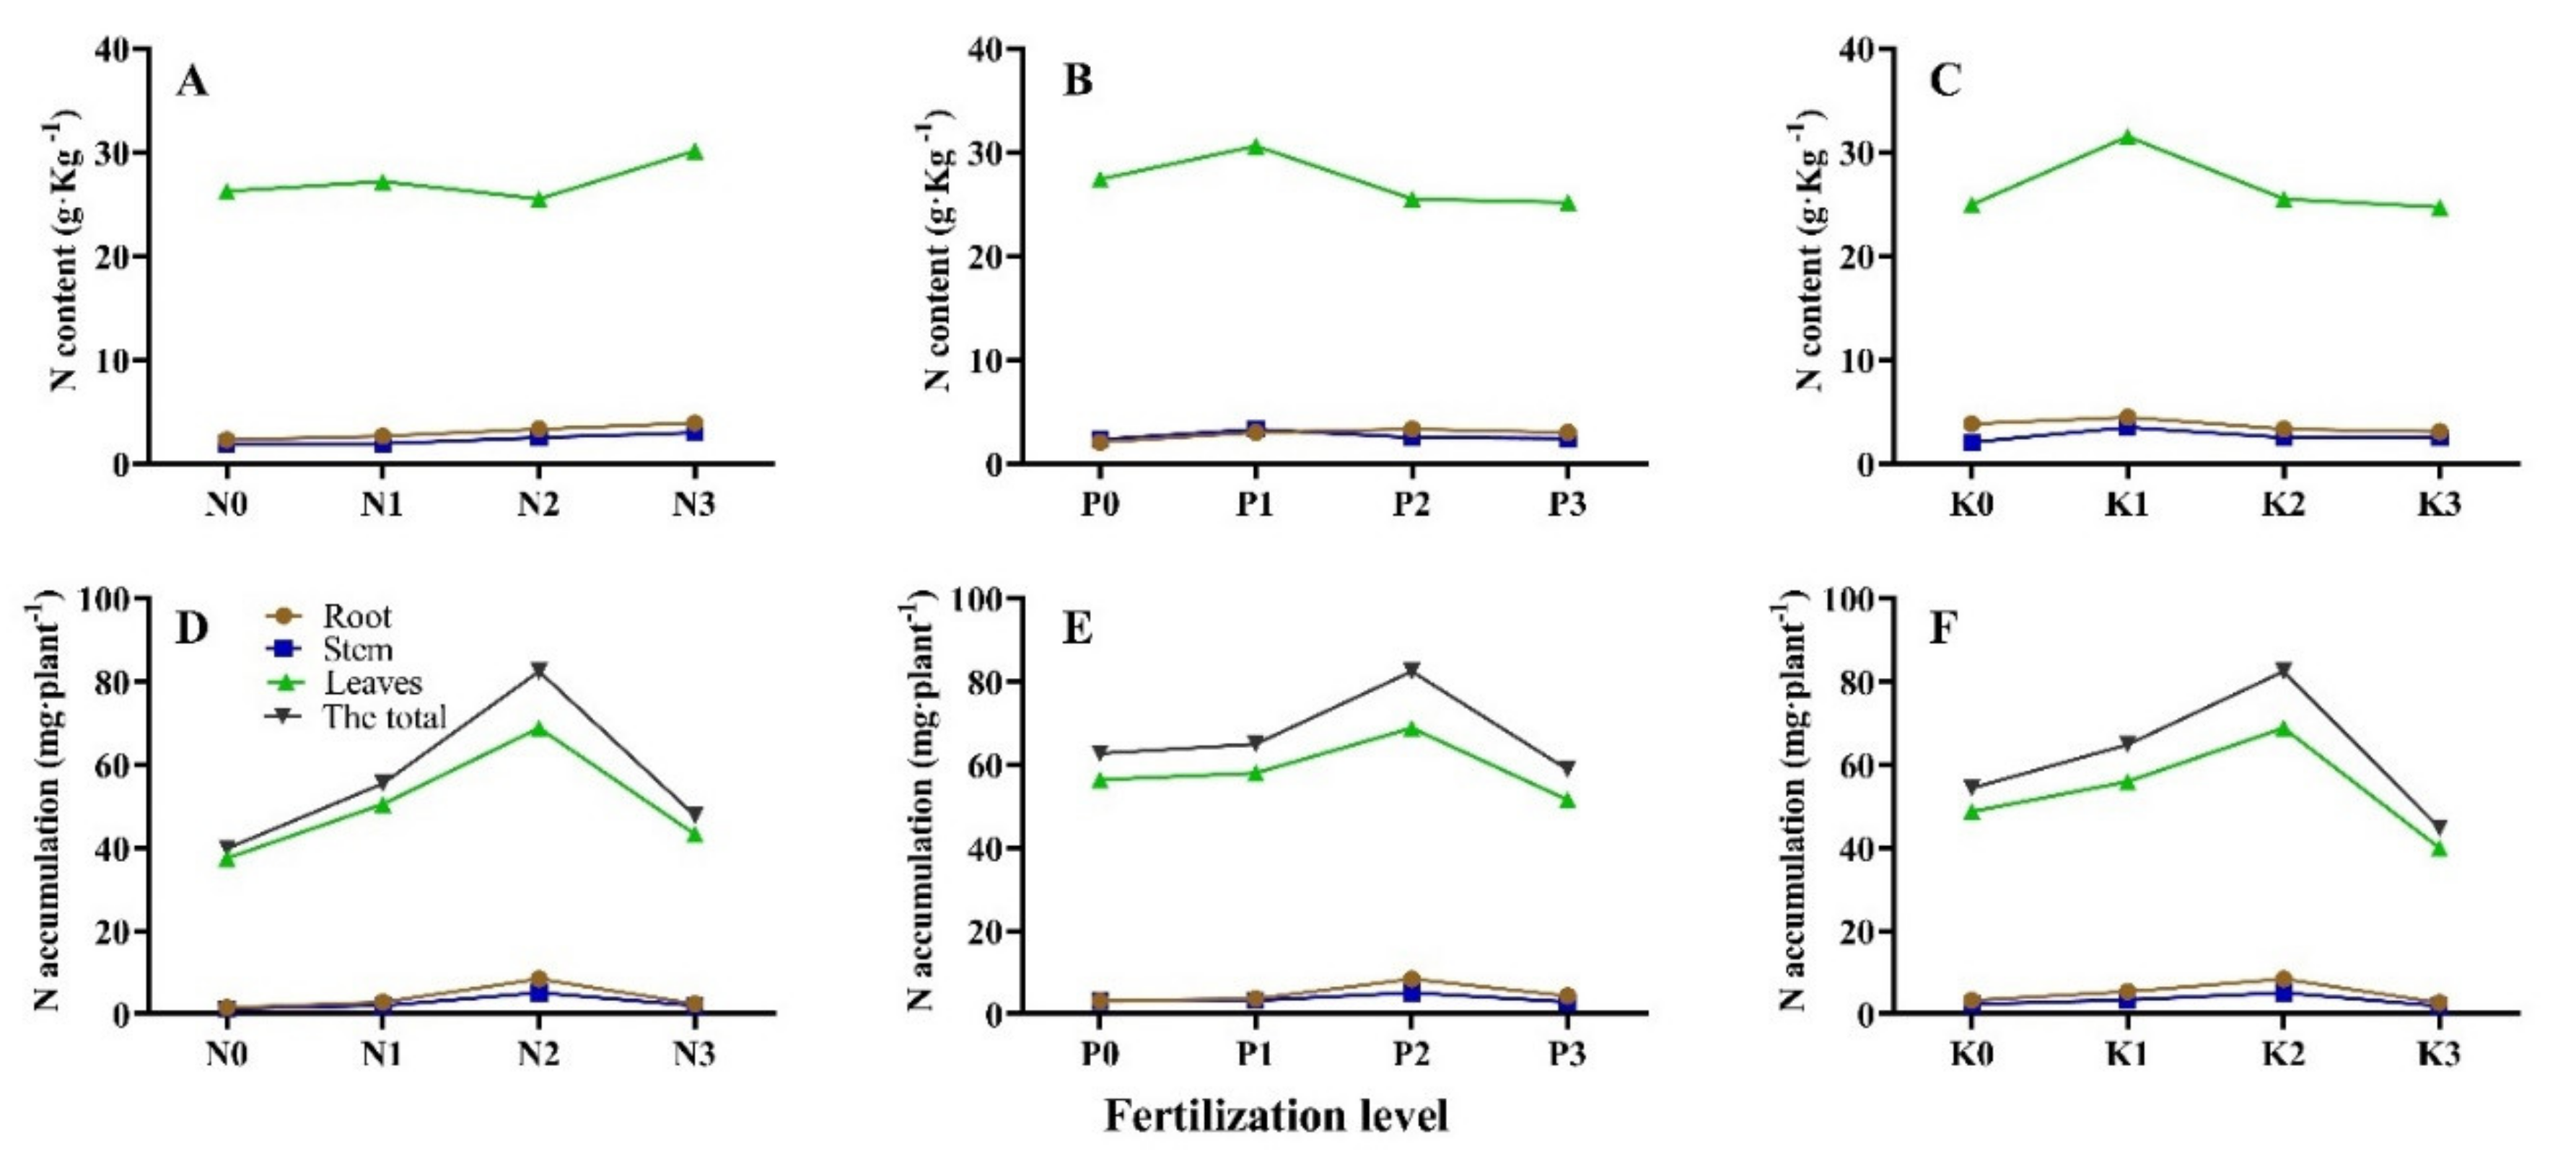
3.2. Seedling N Accumulation and Allocation under Different N-P-K Fertilization

The different fertilizer application ratios significantly affected P. bournei seedlings total plant, leaves, stem, and root N content and accumulation (Table 4). T6 had the greatest N accumulation for total plant, leaves, stem, and root, while T9 had the greatest N content for leaves, stem, and root. Root, stem, and leaves N, P, and K content and accumulation were all higher than T1 with the exception of stem T2. The different fertilizer application ratios significantly affected P. bournei seedlings leaves, stem, and root N contribution rate (Table 3). Leaves N allocation rate was highest, followed by root and stem under all N, P, and K fertilization application rates. The greatest N contribution rate was observed for leaves (T2), stem (T6), and root (T6). N allocation rates of some treatments were lower than T1 (root exception of T2, stem of T2, T3, T11, T8, and T10, and leaves of T2, T3).
In the single-factor effect treatments, different N, P, and K fertilization level influenced N content and accumulation (Figure 3). N content increased with the increase of N application rate, and root, stem and leaves, and total plant N accumulation increased then decreased, reaching the maximum value at medium level. With the increase of P and K fertilization, root, stem, and leaves, and total plant N content and accumulation increased then decreased, accumulation reaching the maximum value at medium level. Different N, P, and K fertilization level influenced N allocation rates (Figure 2D–F). With the increase of N, P, and K fertilizer application, root and stem N allocation rate first increased then decreased, reaching the maximum value at medium level, while leaves produced the opposite trend.

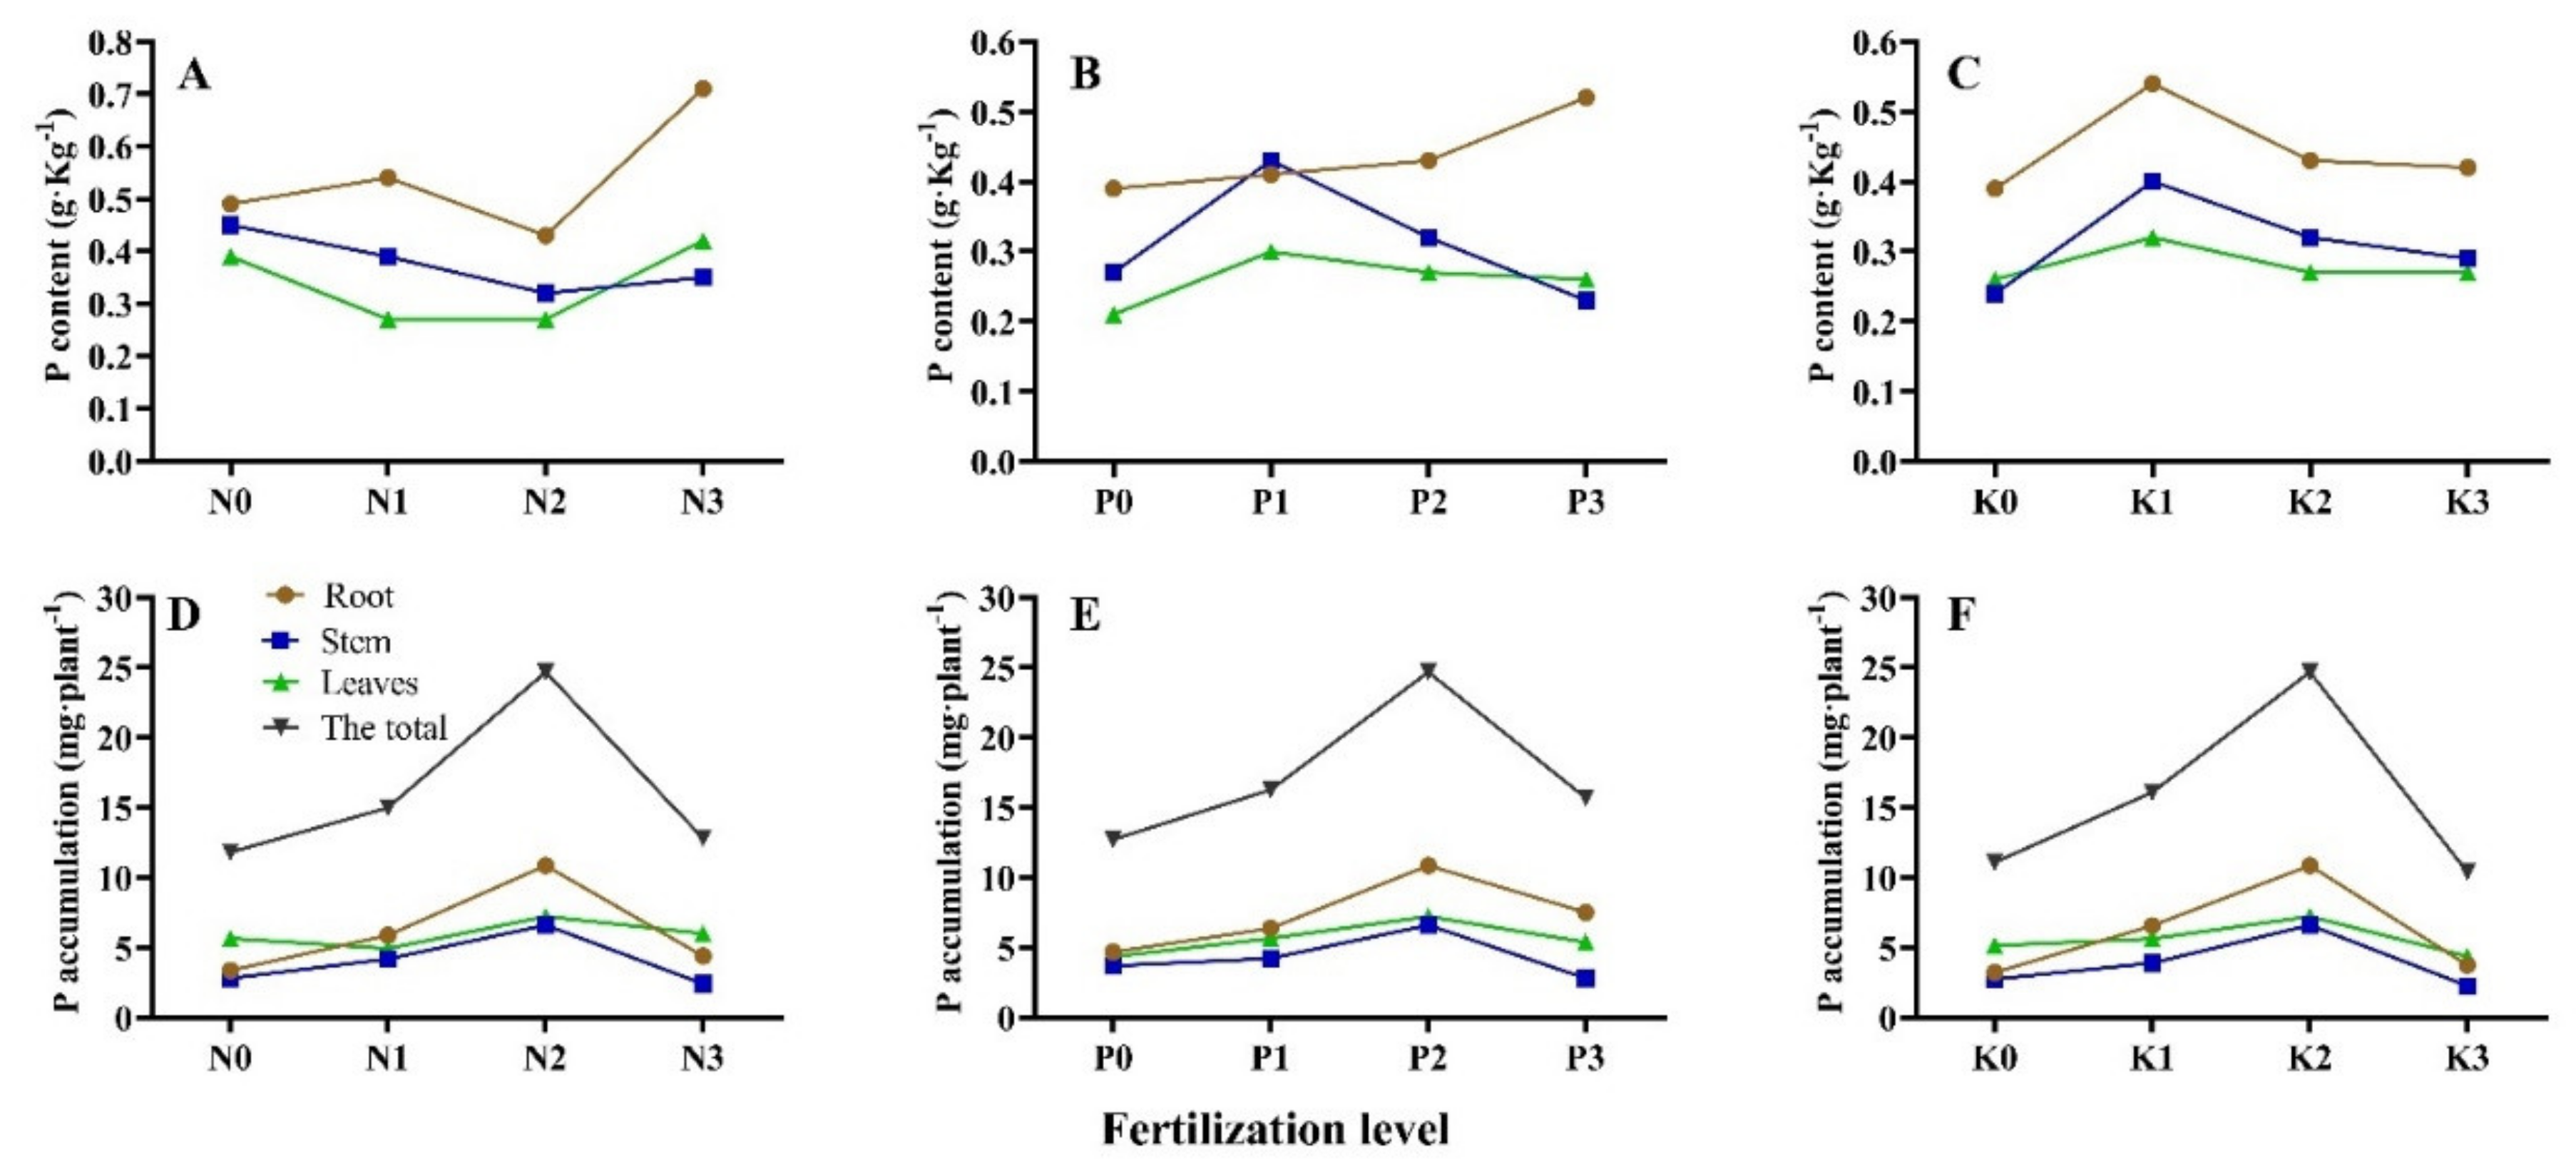
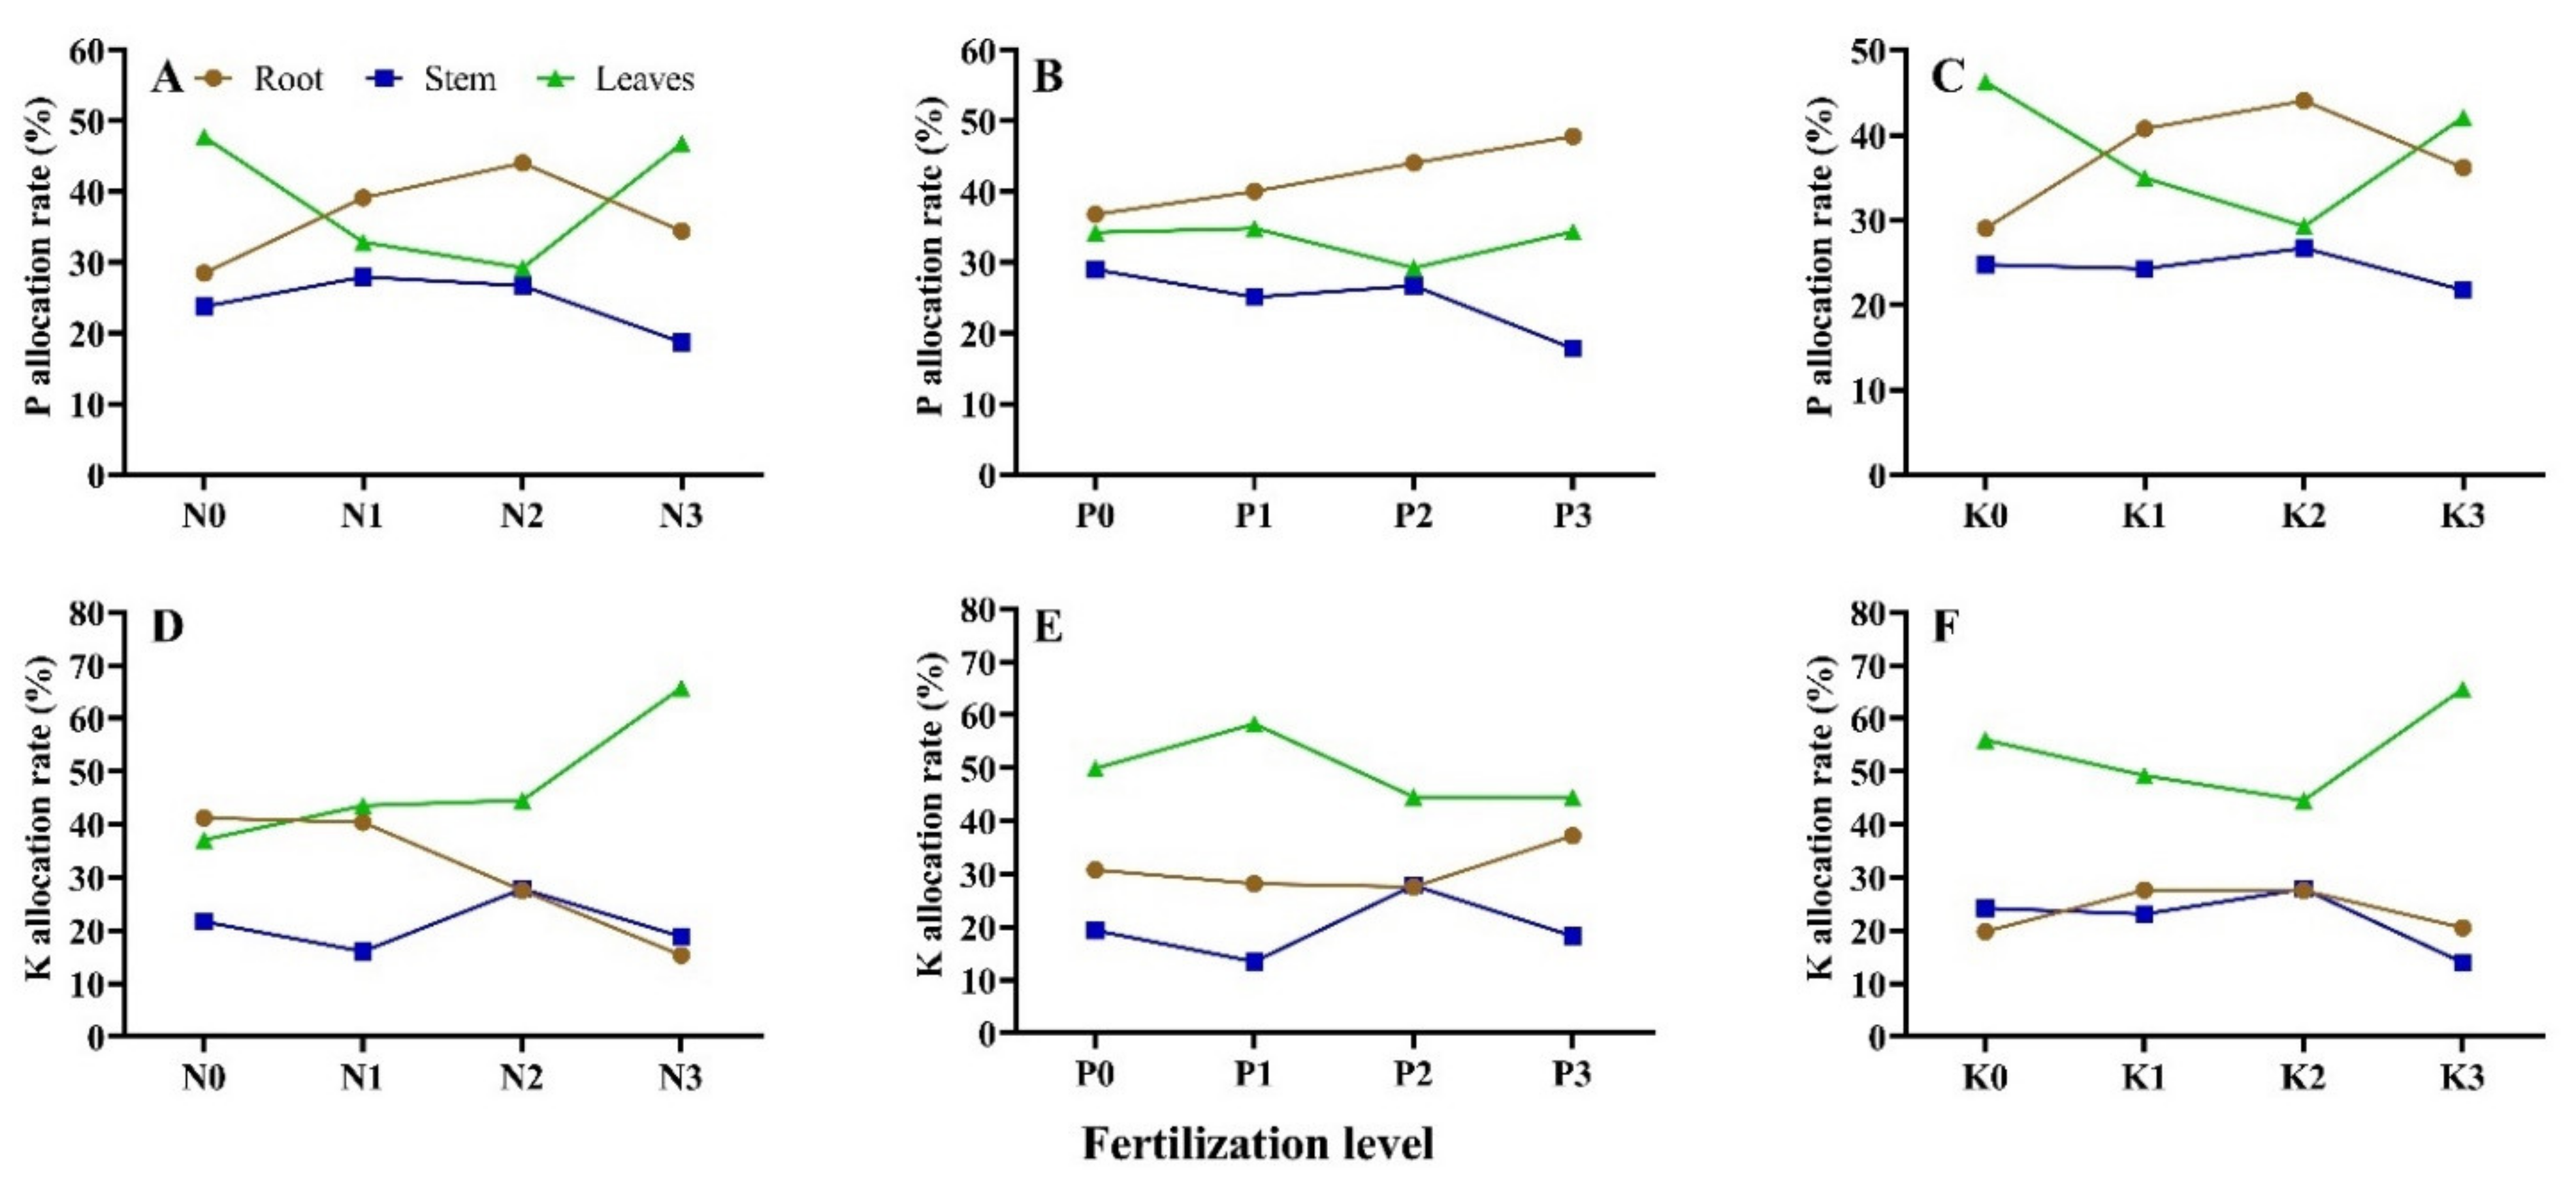
3.3. Seedling P Accumulation and Allocation under Different N-P-K Fertilization

The different fertilizer application ratios significantly affected P. bournei seedlings total plant, leaves, stem, and root P content and accumulation (Table 5). The greatest P accumulation was observed for total plant, stem, and root at T6, and leaf at T13; while the greatest P content was observed for leaf at T13, stem at T2 and T5, and root at T11. Leaves (T2 and T11), stem, and root P contents were higher than T1, and root, stem, leaf and total plant P accumulation of all treatments were higher than T1 exception for leaf of T10 and T4.
In the single-factor effect treatments, different N, P, and K fertilization levels influenced P contents and accumulation (Figure 4). With the increase of N fertilizer application leaves and stem P content first decreased then increased, and root changed with inflection; and with the increase of P, K fertilizer application, root, leaves, and stem P content first increased then decreased, except root P content increased with P fertilizer application. With the increase of N, P, and K fertilizer application, root, stem leaves and total plant P accumulation first increased then decreased, except leaf P accumulation first decreased then increased with the increase of N fertilizer application, reaching the maximum value at medium level.
The different fertilizer application ratios significantly affected P. bournei seedlings leaves, stem, and root P contribution rate (Table 6). Leaves P allocation rate was highest, followed by root and stem under P, K, and N-P-K fertilization application rates, and root P allocation rate was highest, followed by leaves and stem under P fertilization application rates. The greatest P contribution rate was observed for leaves at T1, and T13, stem at T4, T3, T6, and T5, and root at T7 and T6. P allocation rates higher than T1 were observed for leaves (no treatment), for stem (exception of T12), and for root (exception of T8, T2, and T13).
In the single-factor effect treatments (Figure 5A–C), different N, P, and K fertilization levels influenced P allocation rates. With the increase of N and K fertilizer application, root P allocation rate first increased then decreased. With the increase of P fertilizer application, root P allocation rate increased. With the increase of N, P, and K fertilizer application, stem P allocation rate changed with inflection. With the increase of N and K fertilizer application, leaves P allocation rate first decreased then increased; with the increase of P fertilizer application, leaves P allocation rate changed inflection.

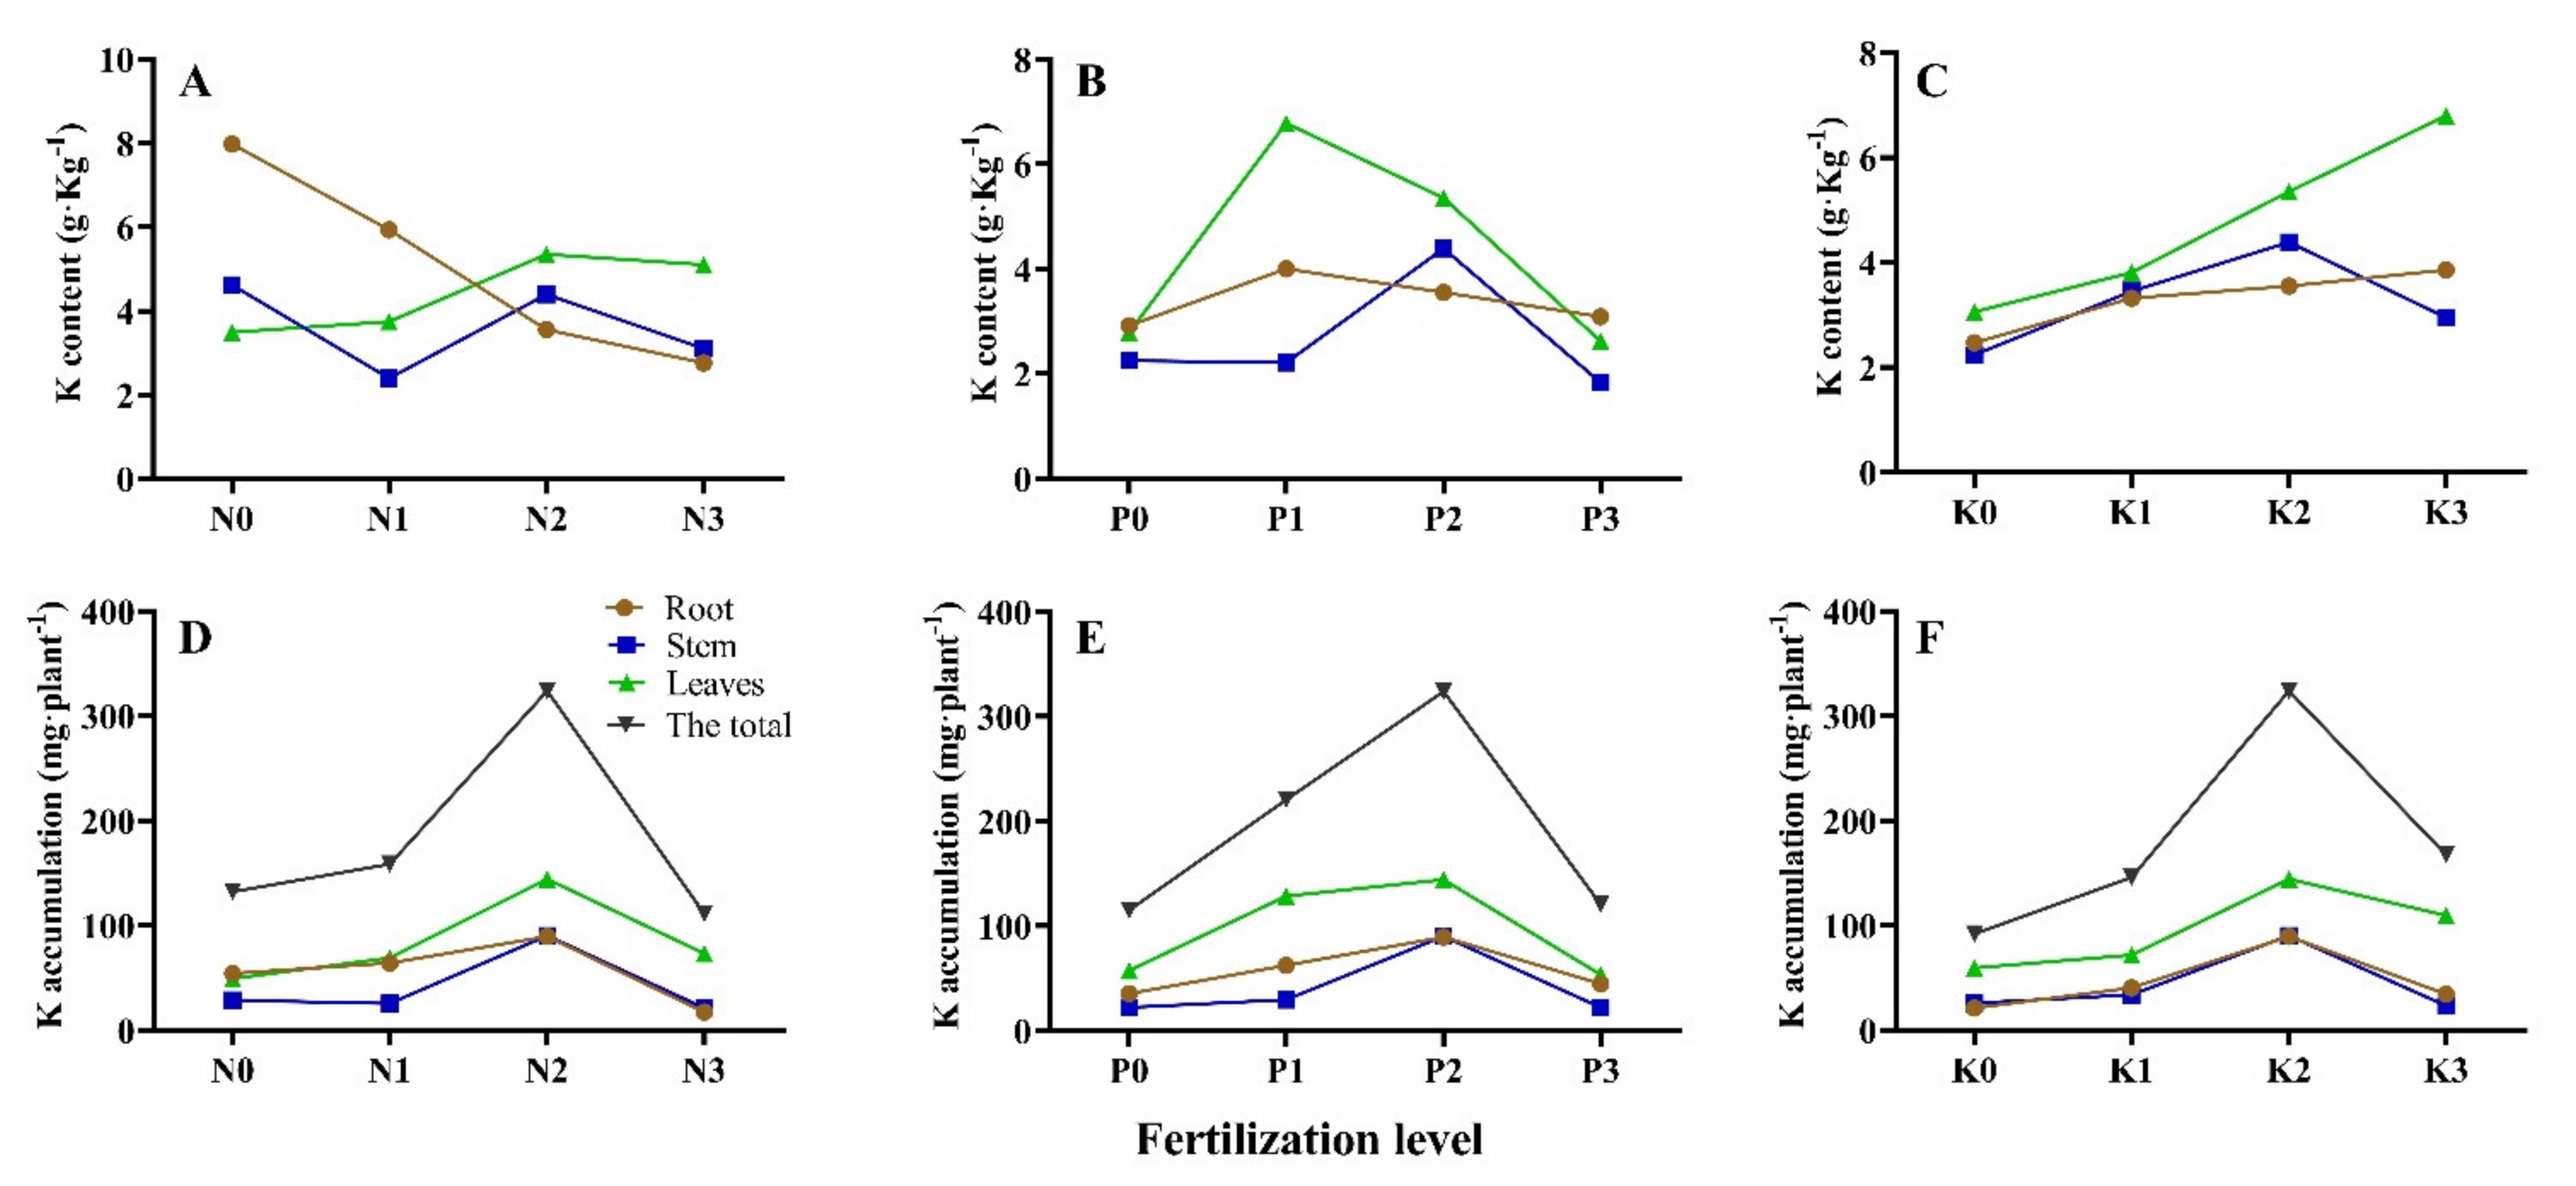
3.4. Seedling K Accumulation and Allocation under Different N-P-K Fertilization

The different fertilizer application ratios significantly affected P. bournei seedlings K content and accumulation (Table 7). T6 had the greatest K accumulation for total plant, leaves, stem, and root, while the greatest K contents was observed for leaf at T5 and T10, stem at T2 and T6, root at T2. Higher than K contents of T1 were observed for leaves (T5, T6, T9, T10, T11, T12, and T13), root, and stem (all treatments), root, stem, leaves, and total plant K accumulation of all treatments were higher than T1. The different fertilizer application ratios significantly affected P. bournei seedlings leaves, stem, and root K contribution rate (Table 6). Leaves K allocation rate was highest, followed by root and stem under N, P, and K fertilization application rates. The greatest K contribution rate was observed for leaves at T11 and T10, stem at T13, and root at T2 and T3. K allocation rates was observed for root (exception of T10, T13, T8, and T11), stem (exception of T3, T10, T14, and T5), and leaf (T11 and T10) higher than T1.
In the single-factor effect treatments, different N, P, and K fertilization levels influenced K content and accumulation (Figure 6). Root K content decreased with the increase of N fertilizer application, first increased then decreased with the increase of P fertilizer application, and increased with the increase of K fertilizer application. Stem K content changed inflection with the increase of N and P fertilizer application and increased then decreased with the increase of K fertilizer application. Leaves K content first increased then decreased with the increase of N and P fertilizer application and increased with the increase of K fertilizer application. Root K accumulation first increased then decreased with the increase of N, P, and K fertilizer application. Stem K accumulation changed inflection with the increase of N fertilizer application, and first increased then decreased with the increase of P and K fertilizer application. Additionally, leaves and total plant K accumulation first increased then decreased with the increase of N, P, and K fertilizer application. Root, stem, leaves, and total plant K accumulation reached the maximum value at medium level. Different N, P, and K fertilizer levels influenced K allocation rate (Figure 5D–F). Root K allocation rate decreased with the increase of N fertilizer application, first decreased then increased with the increase of P fertilizer application, first increased then decreased with the increase of K fertilizer application. Stem K allocation rate changed inflection with the increase of N, P, and K fertilizer application. Leaves K allocation rates were the opposite of root K allocation rates.

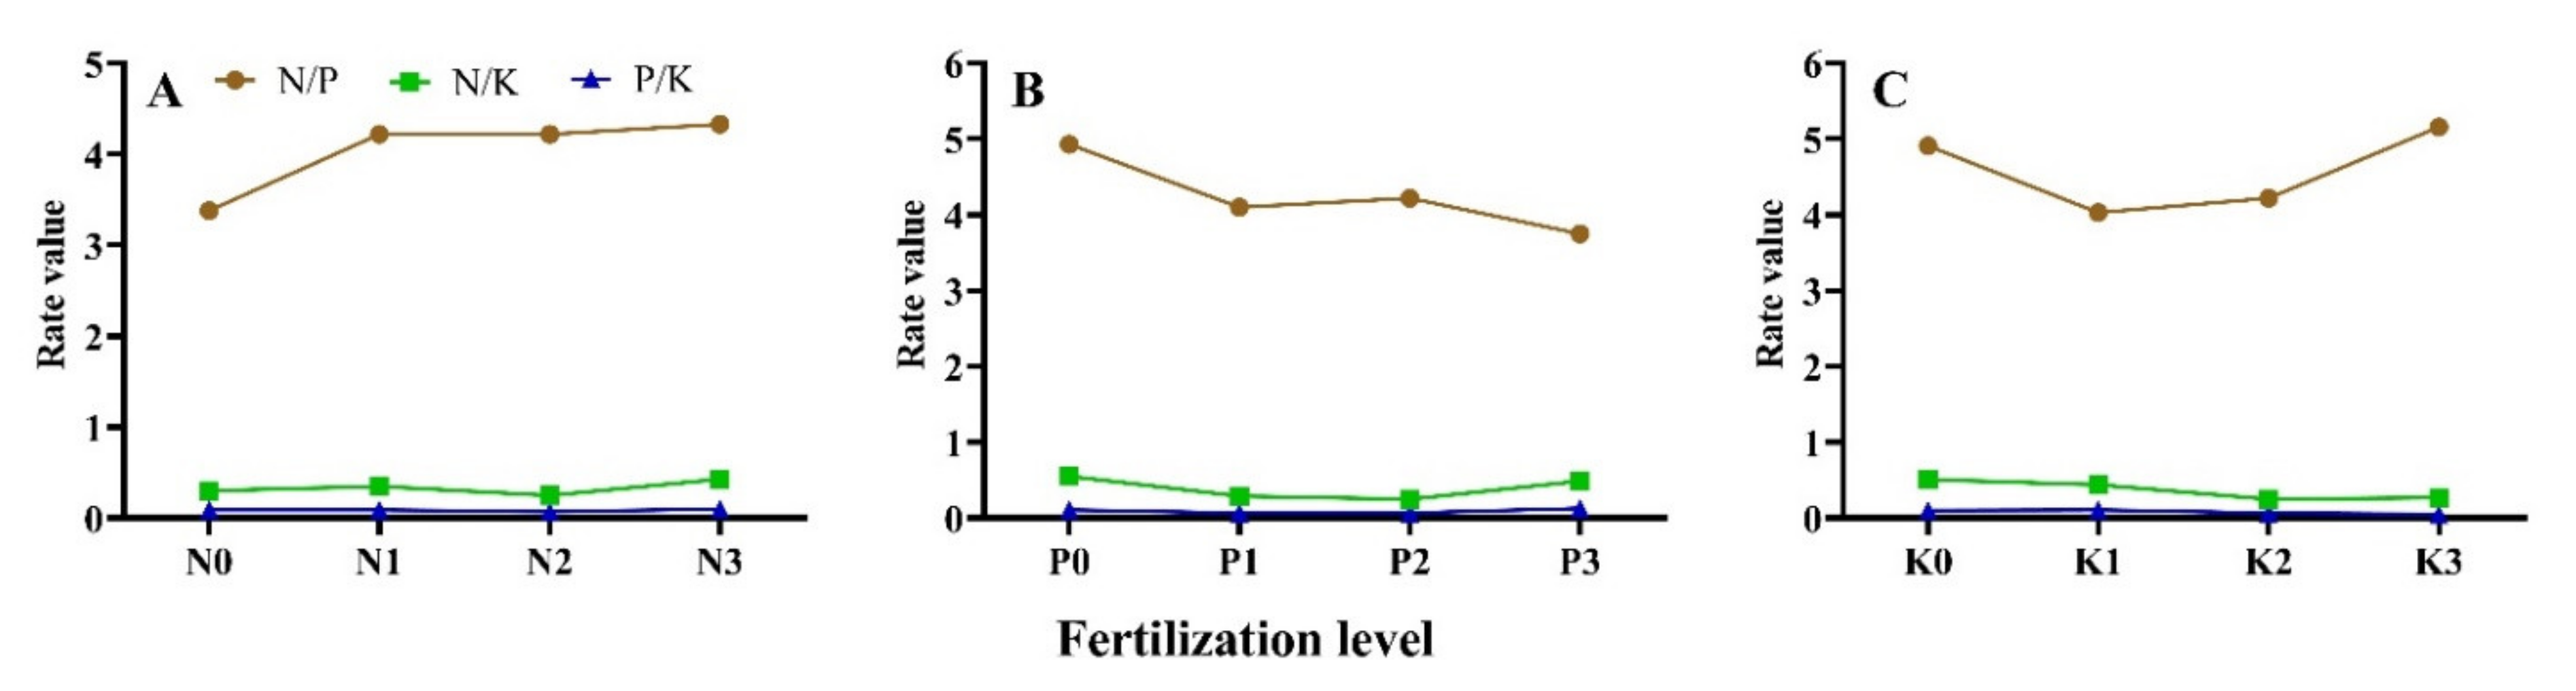
3.5. Seedling N, P, and K Element Absorption Balance under Different N-P-K Fertilization

The different fertilizer application ratios significantly affected P. bournei seedlings N/P, N/K, and P/K values (Table 8). The greatest values were observed for N/P (T10 and T14), N/K (T4), and P/K (T7), and the lowest values for N/K (T6) and P/K ((T10). Higher than T1 values were observed for N/P (exception of T2), N/K (T4, T7, T8, T9, T11, and T14), and P/K (T7).
In the single-factor effect treatments, different N, P, and K fertilizer levels influenced N/P, N/K, and P/K values (Figure 7). N/P value first increased then decreased with the increase of N and K fertilizer application, changed inflection with the increase of P fertilizer application. N/K value first decreased then increased with the increase of P and K fertilizer application, changed inflection with the increase of N fertilizer application. P/K value first decreased then increased with the increase of N and P fertilizer application, increased then decreased with the increase of K fertilizer application.

3.6. Stepwise Regression and Path Analysis of Various Indexes under Different N-P-K Fertilization

Considering total plant dry biomass accumulation of P. bournei seedlings as the dependent variable Y, 33 indexes of content, accumulation, and allocation of dry biomass and nutrients of P. bournei seedlings as independent variables were subjected to stepwise regression analysis, and the resulting regression equation of total dry biomass accumulation is Y = 3.388 + 0.294X1 + 0.0216X4 − 20.940X5 − 0.111X10 + 0.156X11 − 1.872X16 − 0.750X18 + 0.987X19 − 0.026X22 + 0.016X24 + 7.80X26 − 0.313X29 − 0.101X31 + 2.504X32 − 4.910X33 (The complex correlation coefficient R = 0.998, p < 0.01), showing that root N accumulation (X1), total N accumulation (X4), root N allocation rate (X5), leaves N content (X10), root P accumulation (X11), stem P allocation rate (X16), root P content (X18), stem P content (X19), stem K accumulation (X22), total K accumulation (X24), stem K allocation rate (X26), stem K content (X29), N/P (X31), N/K (X32), and P/K (X33) constituted important factors that affected total dry biomass accumulation of P. bournei seedlings. By the path analysis, results showed that total N accumulation, root N accumulation, root P accumulation, total K accumulation, and stem K accumulation had significant or highly significant and positively correlated with total dry biomass, and direct path coefficients greater than 0.250 were root N accumulation, total K accumulation, root P accumulation, stem K accumulation, stem K content (Table 9), indicating that root N accumulation, root P accumulation, and total K accumulation indicators were the key indicators for the growth of P. bournei seedlings.

3.7. Correlation Analysis between Dry Biomass Allocation Rate in Each Organ and Important Indexes of P. bournei Seedlings under N-P-K Fertilization

The root dry biomass allocation rate was highly significant and positively correlated to the total dry biomass, root N accumulation, total N accumulation, root P accumulation, and total K accumulation, and significant and positively correlated with stem K accumulation, and significantly negatively correlated with root P content and N/K ratio (Table 10). Leaves dry biomass allocation rate correlations with the important indicators of total dry biomass accumulation were exactly the opposite to the root. Stem dry biomass allocation rate was highly significant and positively correlated with total dry biomass, stem K accumulation, and stem K allocation rate, significantly positively correlated with total K accumulation, and significantly negatively correlated with leaves N content (Table 10).

3.8. Seedling Range Analysis of Important Indexes under N-P-K Fertilization

The effects of different fertilizers on the main indexes of P. bournei seedlings were analyzed using the range analysis (Table 11). By analysis of ordination of N, P, and K fertilizer, N fertilizer had the greatest influence on total dry biomass, root N accumulation, total N accumulation, root N allocation rate, root P content, and stem K accumulation. P fertilizer had the greatest effect on stem P allocation rate, stem K allocation rate, stem K content, N/P, N/K, and P/K. K fertilizer had the greatest effect on leaves N content, root P accumulation, and total K accumulation. The fertilizer affecting total dry biomass was N, K, and P fertilizer in order. The indicators that had the same order as effect of N, P, and K fertilizer on total dry biomass were root N accumulation, total N accumulation, and root P content.

4. Discussion

Different NPK fertilization treatment showed different effects on nutrients contents (N, P, and K), accumulations and allocations, and biomass accumulation and allocation of each organ in P. bournei seedlings. T2 had the greatest leaves N contribution rate, K root contribution rate, root K content, stem P and K content. T6 had the greatest root biomass contribution rate, stem, root and total plant N, P, and K accumulation, leaf N and K accumulation, stem K content, stem N and P contribution rate, root N, P contribution rate, and lowest N/K value. T9 had greatest leaves, stem, and root N content. T10 had the greatest leaves K content and contribution rate, N/P value, and lowest P/K value. T11 had the greatest leaves biomass and K contribution rate, root P content. T13 had the greatest stem biomass, leaves P content and accumulation, leaves P contribution rate, and stem K contribution rate. These findings showed that combination with N, P, and K fertilization affected N, P, and K uptake, each organ N, P, and K content and proportion, then each organ N, P, and K storage and allocation, thus changing the growth of organs and plants of P. bournei seedlings. When N, P, K fertilizer were T6 (N: 0.532 g·plant−1; P2O5: 0.123 g·plant−1; K2O: 0.356 g·plant−1), the dry biomass and nutrients accumulation, and contribution rate were the highest.

4.1. Effect of N Fertilizer on Nutrients Accumulation and Allocation in P. bournei Seedlings

N fertilization increased root and stem N, P, and K content, leaf N content of P. bournei seedlings, and increased root, stem, leaves, and total N, P, and K accumulation, showing that N fertilizer could promote N, P, and K absorption of P. bournei seedlings, and was beneficial to N, P, and K accumulation. This result was consistent with the results such as wheat, cotton, and Camptotheca acuminate [15,36,37]. With the increase of N application rate, root and total N, P, and K accumulation first increased and then decreased, meaning it was possible that excessive N fertilizer would poison the roots of P. bournei seedlings and reduce the ability to absorb nutrients, resulting in N, P, K accumulation decrease [38,39]. With the increase of N application rate, leaves N and P allocation rate first decreased and then increased (opposition to root and stem), indicating that low-medium level N fertilization is more beneficial to root and stem growth, and high-level N fertilization is more beneficial to leaves growth. At the same time, due to the effect of growth dilution, the P. bournei seedlings improved leaves P content at high level [40]. Low level N fertilization improved the root growth, enhancing root absorptive capacity, root increasing the demand for K+ as a transport element [41]. With the increase of N application rate, plant N content increased (especially leaves), enhancing photosynthetic capacity. Then, the outward transport of photosynthetic products increased, increasing correspondingly leaves K allocation rate, and decreasing root K allocation rate, leading to inflectional change in the K content, accumulation, and allocation rate of the stem [42].

4.2. Effect of P Fertilizer on Nutrients Accumulation and Allocation in P. bournei Seedlings

P fertilization increased root, stem, leaves, and total N, P, and K accumulation, and increased root, stems and leaves N and P contents, and root and stems K content, indicating that P fertilizer promoted N, P, and K absorption of P. bournei seedlings, beneficial to N, P, and K nutrients accumulation. P deficiency to reduce nutrients absorption, appropriate P fertilizer rate to promote nutrients absorption, and excessive P fertilizer to cause nutrients losses of plants [43,44], which is consistent with root, stem, leaves, and total N, P, and K accumulation of P. bournei seedlings. This study showed each organ of P. bournei seedlings N, P, and K accumulation increased first and then decreased with the increase of P application rate and reaching the maximum at medium level. P fertilization can promote the transport of photosynthetic products from the aboveground to the root system, change the allocation pattern of P. bournei seedlings, and transfer the growth center from leaves to root [45]. Therefore, P fertilizer increased root N, P, and K, stem N and P allocation rate, and reduced leaves N, P, and K allocation rate, with root allocation rate higher than leaves and stem of P. bournei seedlings. The root P allocation rate increased correspondingly with the increase of P application, increased root N (growth element) allocation rate, reduced N and P transport to the aboveground, and reduced root K (the transport element) allocation rate, falling leaves N and P allocation rate accordingly [41,46]. When P application rate reached medium level, the root growth reached the maximum value, then N and K allocation of various organs were in the opposite development direction, which was more conducive to the growth of leaves.

4.3. Effect of K Fertilizer on Nutrients Accumulation and Allocation in P. bournei Seedlings

K fertilizer increased root, stem, and total plant N, P, and K accumulation and leaf N and K accumulation, and root and stem N, P, K content, and leaf N and P content. It showed that K fertilizer promoted root, stem, and leaf N, P, and K absorption and increased N, P, and K accumulation of P. bournei seedlings, consistent with some research results [17,47,48]. With the increase of K fertilizer rate, root, stem, and leaf N and P contents, and root, stem, leaf and total N, and P accumulation increased first and then decreased, indicating that excessive K fertilization may cause poisoning to the root system of P. bournei seedlings, reducing N and P absorption [49]. K fertilization can increase the K+ concentration in the soil solution with the K+ concentration difference between the soil and the root surface, increase the deficit intensity and range, expand K supply effective space, and increase K absorbed by plants [50,51], increasing the root, stem, leaf and total K accumulation, root and stem K content of P. bournei seedlings. Leaves are an important nutrient storage organ for seedlings. With the increase of K fertilizer application, leaf K content was increased first, then leaf K unstable compounds with N and P were transferred to the root and stem. This can increase root N and P, and stem P allocation rate, decrease leaf N, P, and K allocation rate, increase root and stem K content, and root and stem N, P, and K allocation rate correspondingly. Therefore, K fertilizer promoted K transport from leaf to root with photosynthetic products, improving root and stem growth and inhibiting leaf growth [52,53,54].

4.4. N, P, and K Fertilizer Regulate Dry Biomass Accumulation and Allocation of P. bournei Seedlings

Plant dry biomass accumulation is closely related to the absorption and allocation of nutrient elements, which are the important basis for rational fertilization [55,56]. Root, stem, and total dry biomass accumulation of P. bournei seedlings increased first and then decreased with the increase of N, P, and K fertilization, basically consistent with N, P, and K accumulation trends. Stepwise regression and path analysis showed root N, root P, and total K accumulation were the key indicators of P. bournei seedlings growth. This indicated that root N and P accumulation promoted root growth, increased root N, P, and K uptake, allocated N, P, and assimilation substances by K element to promote P. bournei seedlings growth [52]. N fertilizer had the greatest effect on total dry biomass and root N accumulation, and K fertilizer on the root P and total K accumulation, showing that N and K fertilizer could regulate organ dry biomass accumulation and seedling growth of P. bournei seedlings.
Fertilization not only promotes the seedling growth, but also regulates the growth pattern by changing the dry biomass allocation rate in each organ of the seedling [57,58]. Correlation analysis showed that root dry biomass allocation rate was extremely significantly positively correlated with total dry biomass, root N, total N, root P, and total K accumulation. Root dry biomass allocation rate was significantly positively correlated with stem K accumulation, and significantly negative with root P content and N/K value. The correlation analysis results of the root dry biomass allocation rate were exactly opposite to leaves dry biomass allocation rate. Except total dry biomass, the correlation between root and leaves dry biomass allocation rate and root P content had the largest absolute coefficient value. N fertilizer most affected root P content of P. bournei seedlings. Medium-level N fertilization increased root dry biomass allocation rate of P. bournei seedlings, and high-level N fertilization increased leaves showed that with the combination of P and K, adjusting N fertilizer rate can regulate root and leaves growth of P. bournei seedlings, beneficial to root growth at medium and low levels, and to leaves growth at high level. The stem dry biomass allocation rate was extremely significantly positively correlated with total dry biomass, stem K accumulation, and stem K allocation rate, and was significantly positively correlated with total K accumulation. In these four indexes, only stem K allocation rate was not significantly related to root and leaf, indicating that stem K allocation could characterize the stem growth of P. bournei seedlings. P fertilization had the greatest effect on stem K allocation rate, increasing stem K allocation rate. Stem K allocation rate increased first and then decreased with the increase P fertilizer application rate, reaching the maximum value at medium level. Therefore, with the combination of N and K, adjusting P fertilizer rate can regulate the stem growth of P. bournei.

5. Conclusions

The application of N, P, and K fertilizer promoted the dry biomass accumulation, increased the contents and accumulations of N, P, and K in root, stem and total plant, but the effects on leaves were varied greatly and irregularly. Root N accumulation, root P accumulation, and total plant K accumulation were the key indexes for P. bournei seedlings growth. The dry biomass accumulations of root, stem, and total plant increased first and then decreased with the increase of N, P, and K application rates, which was basically consistent with the change trends of dry biomass allocations, N, P, and K contents, accumulations and allocations. Fertilization changed the allocation of nutrient elements and dry biomass in plant organs. Application of N, P, and K fertilizer increased the root N, P, and K allocation rates and stem P allocation rate, decreased the leaves P and K allocation rates of P. bournei seedlings, and increased the stem N allocation rate at medium application of N, P, and K. Although N fertilizer was an important fertilizer for the growth of P. bournei seedlings among the three kinds of N, P, and K fertilizers, the combination of three kinds of fertilizers was the best application, which can promote nutrient absorption. When the application rates of N, P, and K fertilizer were at medium levels, the plant dry biomass accumulation was the largest. Under the combination of P and K fertilizer, roots and leaves growth could be regulated by adjusting the rate of N fertilizer, with beneficial root growth at middle-low level, and leaves growth at high level of N application. Under the combination of N and K fertilizer, the seedling diameter growth could be regulated by adjusting the rate of P fertilizer, reaching the maximum at medium level of P fertilizer.

Author Contributions

Conceptualization, S.C.G., Y.A.E.-K. and J.-L.F.; data curation, Z.-J.Y., L.-H.C. and L.-M.H.; data analysis, Z.-J.Y. and Y.C.; investigation, X.-H.W., L.-H.C. and L.-M.H.; methodology, Z.-J.Y., X.-H.W. and J.W.; project administration, J.-L.F.; resources, Z.-J.Y.; supervision, J.-L.F.; writing—original draft, Z.-J.Y. and J.-L.F.; writing—review and editing, S.C.G. and Y.A.E.-K. All authors have read and agreed to the published version of the manuscript.

Funding

This study was funded by the Fujian Soil and Water Conservation Research Project (KH180280A) and Fujian Forest Seedling Science and Technology Research Project (KLh16H04A).

Institutional Review Board Statement

Not applicable.

Informed Consent Statement

Not applicable.

Acknowledgments

We are grateful to the Fujian Academy of Forestry for providing the Phoebe bournei seedlings.

Conflicts of Interest

The authors declare no conflict of interest.

References

  1. Chrysargyris, A.; Panayiotou, C.; Tzortzakis, N. Nitrogen and phosphorus levels affected plant growth, essential oil composition and antioxidant status of lavender plant (Lavandula angustifolia Mill.). Ind. Crop. Prod. 2016, 83, 577–586. [Google Scholar] [CrossRef]
  2. Xu, J.; Wu, L.; Tong, B.; Yin, J.; Huang, Z.; Li, W.; Li, X. Magnesium supplementation alters leaf metabolic pathways for higher flavor quality of oolong tea. Agriculture 2021, 11, 120. [Google Scholar] [CrossRef]
  3. Hermans, C.; Hammond, J.; White, P.; Verbruggen, N. How do plants respond to nutrient shortage by biomass allocation? Trends Plant. Sci. 2006, 11, 610–617. [Google Scholar] [CrossRef]
  4. Shalizi, M.N.; Goldfarb, B.; Burney, O.T.; Shear, T.H. Effects of five growing media and two fertilizer levels on polybag—Raised Camden Whitegum (Eucalyptus benthamii Maiden & Cambage) seedling morphology and drought hardiness. Forests 2019, 10, 543. [Google Scholar] [CrossRef] [Green Version]
  5. Chen, Z.; Ma, H.; Xia, J.; Hou, F.; Shi, X.; Hao, X.; Hafeez, A.; Han, H.; Luo, H. Optimal pre-plant irrigation and fertilization can improve biomass accumulation by maintaining the root and leaf productive capacity of cotton crop. Sci. Rep. 2017, 7, 17168. [Google Scholar] [CrossRef] [Green Version]
  6. Vandamme, E.; Wissuwa, M.; Rose, T.; Ahouanton, K.; Saito, K. Strategic phosphorus (P) application to the nursery bed increases seedling growth and yield of transplanted rice at low P supply. Field Crop. Res. 2016, 186, 10–17. [Google Scholar] [CrossRef]
  7. Oliet, J.A.; Puértolas, J.; Planelles, R.; Jacobs, D.F. Nutrient loading of forest tree seedlings to promote stress resistance and field performance: A Mediterranean perspective. New For. 2013, 44, 649–669. [Google Scholar] [CrossRef]
  8. Bernstein, N.; Gorelick, J.; Zerahia, R.; Koch, S. Impact of N, P, K, and humic acid supplementation on the chemical profile of medical Cannabis (Cannabis sativa L.). Front. Plant. Sci. 2019, 10, 736. [Google Scholar] [CrossRef] [Green Version]
  9. Ladha, J.; Reddy, P.M. Nitrogen fixation in rice systems: State of knowledge and future prospects. Plant. Soil 2003, 252, 151–167. [Google Scholar] [CrossRef]
  10. Raza, M.A.; Bin Khalid, M.H.; Zhang, X.; Feng, L.Y.; Khan, I.; Hassan, M.J.; Ahmed, M.; Ansar, M.; Chen, Y.K.; Fan, Y.F.; et al. Effect of planting patterns on yield, nutrient accumulation and distribution in maize and soybean under relay intercropping systems. Sci. Rep. 2019, 9, 1–14. [Google Scholar] [CrossRef] [Green Version]
  11. Harmand, J.-M.; Njiti, C.F.; Bernhard-Reversat, F.; Puig, H. Aboveground and belowground biomass, productivity and nutrient accumulation in tree improved fallows in the dry tropics of Cameroon. For. Ecol. Manag. 2004, 188, 249–265. [Google Scholar] [CrossRef]
  12. Deng, S.; Shi, K.; Ma, J.; Zhang, L.; Ma, L.; Jia, Z. Effects of fertilization ratios and frequencies on the growth and nutrient uptake of Magnolia wufengensis (Magnoliaceae). Forests 2019, 10, 65. [Google Scholar] [CrossRef] [Green Version]
  13. Pogrzeba, M.; Rusinowski, S.; Krzyżak, J. Macroelements and heavy metals content in energy crops cultivated on contaminated soil under different fertilization—Case studies on autumn harvest. Environ. Sci. Pollut. Res. 2018, 25, 12096–12106. [Google Scholar] [CrossRef] [PubMed] [Green Version]
  14. Ding, J.; Jiang, X.; Ma, M.; Zhou, B.; Guan, D.; Zhao, B.; Zhou, J.; Cao, F.; Li, L.; Li, J. Effect of 35 years inorganic fertilizer and manure amendment on structure of bacterial and archaeal communities in black soil of northeast China. Appl. Soil Ecol. 2016, 105, 187–195. [Google Scholar] [CrossRef]
  15. Chen, B.; Wang, Q.; Ye, Z.; Stiles, S.; Feng, G. Optimisation of phosphorus fertilization promotes biomass and phosphorus nutrient accumulation, partitioning and translocation in three cotton (Gossypium hirsutum) genotypes. Crop. Pasture Sci. 2020, 71, 56–69. [Google Scholar] [CrossRef]
  16. Szczepanek, M.; Siwik-Ziomek, A. P and K accumulation by rapeseed as affected by biostimulant under different NPK and S ferti-lization doses. Agronomy 2019, 9, 477. [Google Scholar] [CrossRef] [Green Version]
  17. Soratto, R.P.; Job, A.L.G.; Fernandes, A.; Assunção, N.S.; Fernandes, F.M. Biomass accumulation and nutritional requirements of potato as affected by potassium supply. J. Soil Sci. Plant. Nutr. 2020, 20, 1051–1066. [Google Scholar] [CrossRef]
  18. Li, M.; Zhang, H.; Yang, X.; Ge, M.; Ma, Q.; Wei, H.; Dai, Q.; Huo, Z.; Xu, K.; Luo, D. Accumulation and utilization of nitrogen, phosphorus and potassium of irrigated rice cultivars with high productivities and high N use efficiencies. Field Crop. Res. 2014, 161, 55–63. [Google Scholar] [CrossRef]
  19. Ju, X.; Kou, C.; Christie, P.; Dou, Z.; Zhang, F. Changes in the soil environment from excessive application of fertilizers and manures to two contrasting intensive cropping systems on the North China Plain. Environ. Pollut. 2007, 145, 497–506. [Google Scholar] [CrossRef] [PubMed] [Green Version]
  20. Kamil, K.R.; Anita, K.; Roman, K.K.; Konieczna, A. Evaluation of a different fertilisation in technology of corn for silage, sugar beet and meadow grasses production and their impact on the environment in Poland. Afr. J. Agric. Res. 2015, 10, 1351–1358. [Google Scholar] [CrossRef] [Green Version]
  21. Soratto, R.P.; Fernandes, A.M. Phosphorus effects on biomass accumulation and nutrient uptake and removal in two potato culti-vars. Agron. J. 2016, 108, 1225–1236. [Google Scholar] [CrossRef] [Green Version]
  22. Malhi, S.S.; Johnston, A.M.; Schoenau, J.J.; Wang, Z.L.; Vera, C.L. Seasonal biomass accumulation and nutrient uptake of wheat, barley and oat on a Black Chernozem Soil in Saskatchewan. Can. J. Plant. Sci. 2006, 86, 1005–1014. [Google Scholar] [CrossRef]
  23. Wang, X.; Wei, X.; Wu, G.; Chen, S. High nitrate or ammonium applications alleviated photosynthetic decline of Phoebe bournei seedlings under elevated carbon dioxide. Forests 2020, 11, 293. [Google Scholar] [CrossRef] [Green Version]
  24. Ding, W.; Liping, N.; Xing, H.; Wei, Z.; Zhoua, Q.; Nong, R.; Chen, J. Essential oil extracted from leaf of Phoebe bournei (Hemsl.) yang: Chemical constituents, antitumor, antibacterial, hypoglycemic activities. Nat. Prod. Res. 2018, 34, 2524–2527. [Google Scholar] [CrossRef] [PubMed]
  25. Cao, J.; Shang, H.; Chen, Z.; Tian, Y.; Yu, H. Effects of elevated ozone on stoichiometry and nutrient pools of Phoebe bournei (Hemsl.) Yang and Phoebe Zhennan, S. Lee et F. N. Wei seedlings in subtropical China. Forests 2016, 7, 78. [Google Scholar] [CrossRef] [Green Version]
  26. Zhang, J.; Zhu, Y.; Pan, Y.; Huang, H.; Li, C.; Li, G.; Tong, Z. Transcriptomic profiling and identification of candidate genes in two Phoebe bournei ecotypes with contrasting cold stress responses. Trees 2018, 32, 1315–1333. [Google Scholar] [CrossRef]
  27. He, S.; Ma, Y.; Fei, Y. Research on the species composition and features of Phoebe plant community in Laifeng County, Hubei Province. J. Mt. Agri. Biol. 2017, 36, 45–49. [Google Scholar]
  28. Wang, W.; Wei, X.A.; Liao, W.; Blanco, J.; Liu, Y.; Liu, S.; Liu, G.; Zhang, L.; Guo, X.; Guo, S. Evaluation of the effects of forest management strategies on carbon sequestration in evergreen broad-leaved (Phoebe bournei) plantation forests using FORECAST ecosystem model. For. Ecol. Manag. 2013, 300, 21–32. [Google Scholar] [CrossRef] [Green Version]
  29. Fan, R.; Sun, J.; Yang, F.; Quanlin, Z.; Zheng, Y.; Zhong, Q.; Cheng, D. Divergent scaling of respiration rates to nitrogen and phosphorus across four woody seedlings between different growing seasons. Ecol. Evol. 2017, 7, 8761–8769. [Google Scholar] [CrossRef] [PubMed]
  30. Dong, L.; Zhu, X.; Lin, X.; Xu, Z. Effects of fertilization on the growth of three Lauraceae seedlings in containers. North. Hortic. 2011, 13, 73–77. [Google Scholar]
  31. Li, J.; Zhang, M.; Chen, F.; Yao, B. Improving rice modeling success rate with ternary non-structural fertilizer response model. Sci. Rep. 2018, 8, 9071. [Google Scholar] [CrossRef]
  32. Yang, Z.-J.; Wu, X.-H.; Grossnickle, S.C.; Chen, L.-H.; Yu, X.-X.; El-Kassaby, Y.A.; Feng, J.-L. Formula fertilization promotes Phoebe bournei robust seedling cultivation. Forests 2020, 11, 781. [Google Scholar] [CrossRef]
  33. Thilakarathna, M.S.; Chapagain, T.; Ghimire, B.; Pudasaini, R.; Tamang, B.B.; Gurung, K.; Choi, K.; Rai, L.; Magar, S.; Bk, B.; et al. Evaluating the effectiveness of rhizobium inoculants and micronutrients as technologies for nepalese common bean smallholder farmers in the real-world context of highly variable hillside environments and indigenous farming practices. Agriculture 2019, 9, 20. [Google Scholar] [CrossRef] [Green Version]
  34. Zhang, S.; Guo, X.; Yun, W.; Xia, Y.; You, Z.; Rillig, M. Arbuscular mycorrhiza contributes to the control of phosphorus loss in paddy fields. Plant. Soil 2020, 447, 623–636. [Google Scholar] [CrossRef]
  35. Artyszak, A.; Gozdowski, D. Influence of various forms of foliar application on root yield and technological quality of sugar beet. Agriculture 2021, 11, 693. [Google Scholar] [CrossRef]
  36. Wang, X.; Bian, S.; Chang, P.; Wang, N.; Xuan, L.; Zhang, M.; Dong, B.; Zhang, C.; Wu, J.; Ying, Y.; et al. The effects of different nitrogen sources on camptothecin content and related gene expression in Camptotheca acuminata seedlings. J. For. Res. 2019, 31, 1347–1357. [Google Scholar] [CrossRef]
  37. Barunawati, N.; Giehl, R.F.H.; Bauer, B.; von Wirén, N. The influence of inorganic nitrogen fertilizer forms on micronutrient retranslocation and accumulation in grains of winter wheat. Front. Plant. Sci. 2013, 4, 320. [Google Scholar] [CrossRef] [Green Version]
  38. Ou, X.; Li, S.; Liao, P.; Cui, X.; Zheng, B.; Yang, Y.; Liu, D.; Zheng, Y. The transcriptome variations of Panax notoginseng roots treated with different forms of nitrogen fertilizers. BMC Genom. 2019, 20, 965. [Google Scholar] [CrossRef] [Green Version]
  39. Gu, X.; Ding, M.; Lu, W.; Lu, D. Nitrogen topdressing at the jointing stage affects the nutrient accumulation and translocation in rainfed waxy maize. J. Plant. Nutr. 2019, 42, 657–672. [Google Scholar] [CrossRef]
  40. Bélanger, G.; Ziadi, N.; Lajeunesse, J.; Jouany, C.; Virkajarvi, P.; Sinaj, S.; Nyiraneza, J. Shoot growth and phosphorus–nitrogen relationship of grassland swards in response to mineral phosphorus fertilization. Field Crop. Res. 2017, 204, 31–41. [Google Scholar] [CrossRef]
  41. Hasanuzzaman, M.; Bhuyan, M.H.M.B.; Nahar, K.; Hossain, M.S.; Mahmud, J.A.; Hossen, M.S.; Masud, A.A.C.; Moumita; Fujita, M. Potassium: A vital regulator of plant responses and tolerance to abiotic stresses. Agronomy 2018, 8, 31. [Google Scholar] [CrossRef] [Green Version]
  42. Bassi, D.; Menossi, M.; Mattiello, L. Nitrogen supply influences photosynthesis establishment along the sugarcane leaf. Sci. Rep. 2018, 8, 2327. [Google Scholar] [CrossRef] [Green Version]
  43. Zhang, Y.; Xie, D.; Ni, J.; Zeng, X. Optimizing phosphate fertilizer application to reduce nutrient loss in a mustard (Brassica juncea var. tumida)-maize (Zea mays L.) rotation system in Three Gorges Reservoir area. Soil Tillage Res. 2019, 190, 78–85. [Google Scholar] [CrossRef]
  44. Zheng, H.; Pan, X.; Deng, Y.; Wu, H.; Liu, P.; Li, X. AtOPR3 specifically inhibits primary root growth in Arabidopsis under phosphate deficiency. Sci. Rep. 2016, 6, 24778. [Google Scholar] [CrossRef] [Green Version]
  45. Carstensen, A.; Herdean, A.; Schmidt, S.B.; Sharma, A.; Spetea, C.; Pribil, M.; Husted, S. The impacts of phosphorus deficiency on the photosynthetic electron transport chain. Plant. Physiol. 2018, 177, 271–284. [Google Scholar] [CrossRef] [Green Version]
  46. Hu, B.; Chu, C. Nitrogen–phosphorus interplay: Old story with molecular tale. New Phytol. 2020, 225, 1455–1460. [Google Scholar] [CrossRef] [PubMed] [Green Version]
  47. Chrysargyris, A.; Xylia, P.; Botsaris, G.; Tzortzakis, N. Antioxidant and antibacterial activities, mineral and essential oil composition of spearmint (Mentha spicata L.) affected by the potassium levels. Ind. Crop. Prod. 2017, 103, 202–212. [Google Scholar] [CrossRef]
  48. Hu, W.; Jiang, N.; Yang, J.; Meng, Y.; Wang, Y.; Chen, B.; Zhao, W.; Oosterhuis, D.M.; Zhou, Z. Potassium (K) supply affects K accumulation and photosynthetic physiology in two cotton (Gossypium hirsutum L.) cultivars with different K sensitivities. Field Crop. Res. 2016, 196, 51–63. [Google Scholar] [CrossRef]
  49. Wang, X.; Mohamed, I.; Ali, M.; Abbas, M.H.H.; Shah, G.M.; Chen, F. Potassium distribution in root and non-root zones of two cotton genotypes and its accumulation in their organs as affected by drought and potassium stress conditions. J. Plant. Nutr. Soil Sci. 2018, 182, 72–81. [Google Scholar] [CrossRef] [Green Version]
  50. Zahoor, R.; Dong, H.; Abid, M.; Zhao, W.; Wang, Y.; Zhou, Z. Potassium fertilizer improves drought stress alleviation potential in cotton by enhancing photosynthesis and carbohydrate metabolism. Environ. Exp. Bot. 2017, 137, 73–83. [Google Scholar] [CrossRef]
  51. Sheng, X. Growth promotion and increased potassium uptake of cotton and rape by a potassium releasing strain of Bacillus edaphicus. Soil Biol. Biochem. 2005, 37, 1918–1922. [Google Scholar] [CrossRef]
  52. Rogiers, S.Y.; Coetzee, Z.; Walker, R.R.; Deloire, A.; Tyerman, S. Potassium in the Grape (Vitis vinifera L.) Berry: Transport and function. Front. Plant. Sci. 2017, 8, 1629. [Google Scholar] [CrossRef]
  53. Bu, M.A.H.A.; Ahmad, R.; Iqbal, J.; Maqbool, M.M.; Ali, A.; Ishaque, M.; Hussain, S. Nutritional and physiological significance of potassium application in maize hybrid crop production. Pak. J. Nutr. 2012, 11, 187–202. [Google Scholar] [CrossRef] [Green Version]
  54. Ibrahim, M.H.; Jaafar, H.Z.E.; Karimi, E.; Ghasemzadeh, A. Primary, secondary metabolites, photosynthetic capacity and antioxidant activity of the Malaysian herb Kacip Fatimah (Labisia Pumila Benth) exposed to potassium fertilization under greenhouse conditions. Int. J. Mol. Sci. 2012, 13, 15321–15342. [Google Scholar] [CrossRef]
  55. Wu, J.; Lin, H.; Guo, L.; Dong, J.; Zhang, L.; Fu, W. Biomass and nutrients variation of Chinese fir rooted cuttings under conventional and exponential fertilization regimes of nitrogen. Forests 2019, 10, 615. [Google Scholar] [CrossRef] [Green Version]
  56. Cakmak, I.; Hengeler, C.; Marschner, H. Partitioning of shoot and root dry matter and carbohydrates in bean plants suffering from phosphorus, potassium and magnesium deficiency. J. Exp. Bot. 1994, 45, 1245–1250. [Google Scholar] [CrossRef]
  57. Geng, Y.; Cao, G.; Wang, L.; Wang, S. Effects of equal chemical fertilizer substitutions with organic manure on yield, dry matter, and nitrogen uptake of spring maize and soil nitrogen distribution. PLoS ONE 2019, 14, e0219512. [Google Scholar] [CrossRef] [PubMed] [Green Version]
  58. Hocking, P.; Randall, P.; DeMarco, D. The response of dryland canola to nitrogen fertilizer: Partitioning and mobilization of dry matter and nitrogen, and nitrogen effects on yield components. Field Crop. Res. 1997, 54, 201–220. [Google Scholar] [CrossRef]
Figure 1. P. bournei seedlings growth under different N-P-K fertilization (T1–T14).
Agriculture 11 01187 g001
Figure 2. Changes of dry biomass and N allocation rate in P. bournei seedlings under the single-factor of N, P, and K fertilizer. ((A,D): the single-factor of N fertilizer; (B,E): the single-factor of P fertilizer; (C,F): the single-factor of K fertilizer). In the X axis label, N, P and K refer to N fertilizer, P fertilizer and K fertilizer, respectively, and numbers 0, 1, 2, and 3, respectively, represent no, low, medium, and high levels of fertilization. Figures 3–7 were the same.
Agriculture 11 01187 g002
Figure 3. Changes of N content and accumulation in P. bournei seedlings under the single-factor N, P, and K fertilizer. (A,D): the single-factor of N fertilizer; (B,E): the single-factor of P fertilizer; (C,F): the single-factor of K fertilizer.
Agriculture 11 01187 g003
Figure 4. Changes of P content and accumulation in P. bournei seedlings under the single-factor of N, P, and K fertilizer. (A,D): the single-factor of N fertilizer; (B,E): the single-factor of P fertilizer; (C,F): the single-factor of K fertilizer.
Agriculture 11 01187 g004
Figure 5. Changes of P and K allocation rate in P. bournei seedlings under the single-factor of N, P, and K fertilizer. (A,D): the single-factor of N fertilizer; (B,E): the single-factor of P fertilizer; (C,F): the single-factor of K fertilizer.
Agriculture 11 01187 g005
Figure 6. Changes of K content and accumulation in P. bournei seedlings under the single-factor of N, P, and K fertilizer. (A,D): the single-factor of N fertilizer; (B,E): the single-factor of P fertilizer; (C,F): the single-factor of K fertilizer.
Agriculture 11 01187 g006
Figure 7. Changes of N, P, and K element absorption balance in P. bournei seedlings under the single-factor of N, P, and K fertilizer. (A): the single-factor of N fertilizer; (B): the single-factor of P fertilizer; (C): the single-factor of K fertilizer.
Agriculture 11 01187 g007
Table 1. Fertilizer rates used in the “3414” fertilization experiment (Reprinted from ref. [32].)
No.Treatment 1N (g·plant−1) 1P2O5 (g·plant−1) 1KO2 (g·plant−1) 1
T1N0P0K00 (0)0 (0)0 (0)
T2N0P2K20 (0)2 (0.1332)2 (0.356)
T3N1P2K21 (0.266)2 (0.1332)2 (0.356)
T4N2P0K22 (0.532)0 (0)2 (0.356)
T5N2P1K22 (0.532)1 (0.0666)2 (0.356)
T6N2P2K22 (0.532)2 (0.1332)2 (0.356)
T7N2P3K22 (0.532)3 (0.1998)2 (0.356)
T8N2P2K02 (0.532)2 (0.1332)0 (0)
T9N2P2K12 (0.532)2 (0.1332)1 (0.178)
T10N2P2K32 (0.532)2 (0.1332)3 (0.534)
T11N3P2K23 (0.798)2 (0.1332)2 (0.356)
T12N1P1K21 (0.266)1 (0.0666)2 (0.356)
T13N1P2K11 (0.266)2 (0.1332)1 (0.178)
T14N2P1K12 (0.532)1 (0.0666)1 (0.178)
1 0, 1, 2 and 3 numbers, respectively, represent no, low, medium, and high levels fertilization (T1–T14). The values in parentheses represent the specific rate of fertilization.
Table 2. Dry biomass accumulation of P. bournei seedlings under different N-P-K fertilization (Reprinted from ref. [32].)
No.Root/g·plant−1Stem/g·plant−1Leaf/g·plant−1Total Plant/g·plant−1
T10.83 ± 0.05 f0.80 ± 0.09 g1.26 ± 0.09 g2.89 ± 0.23 e
T20.68 ± 0.06 g0.62 ± 0.04 h1.43 ± 0.12 g2.73 ± 0.27 e
T31.08 ± 0.09 e1.06 ± 0.09 de1.86 ± 0.13 de4.01 ± 0.32 c
T41.56 ± 0.06 b1.35 ± 0.04 b2.06 ± 0.04 bcd4.97 ± 0.14 b
T51.21 ± 0.02 d0.99 ± 0.03 ef1.90 ± 0.03 cde4.10 ± 0.07 c
T62.52 ± 0.04 a2.06 ± 0.14 a2.70 ± 0.20 a7.27 ± 0.41 a
T71.45 ± 0.05 c1.21 ± 0.03 c2.05 ± 0.16 bcd4.71 ± 0.34 b
T80.85 ± 0.01 f1.15 ± 0.01 cd1.95 ± 0.02 cde3.95 ± 0.14 c
T91.22 ± 0.07 d0.98 ± 0.06 ef1.78 ± 0.06 ef3.97 ± 0.20 c
T100.89 ± 0.05 f0.79 ± 0.03 g1.62 ± 0.15 f3.30 ± 0.12 d
T110.62 ± 0.04 g0.68 ± 0.05 h1.44 ± 0.12 g2.73 ± 0.16 e
T121.52 ± 0.11 bc1.10 ± 0.02 cd2.03 ± 0.01 bcd4.65 ± 0.32 b
T131.09 ± 0.09 e1.40 ± 0.04 b2.20 ± 0.07 b4.69 ± 0.12 b
T141.19 ± 0.03 de0.95 ± 0.03 f2.06 ± 0.06 bc4.20 ± 0.12 c
Different letters indicate significant differences between the 14 treatments as determined by Duncan’s multiple range test (p < 0.05). Tables 3–8.
Table 3. Dry biomass and N allocation rate of P. bournei seedlings under different N-P-K fertilization.
No.Dry Biomass Allocation Rate (%)N Allocation Rate (%)
RootStemLeavesRootStemLeaves
T128.67 ± 0.65 ef 127.66 ± 0.97 cd43.67 ± 0.32 de4.54 ± 0.25 g4.69 ± 0.23 bc90.77 ± 0.41 bc
T224.92 ± 0.26 h22.76 ± 0.36 i52.32 ± 0.11 a3.90 ± 0.10 h3.08 ± 0.24 e93.02 ± 0.19 a
T327.03 ± 0.19 g26.53 ± 0.23 e46.44 ± 0.42 c5.21 ± 0.16 f3.71 ± 0.08 de91.08 ± 0.15 b
T429.59 ± 0.05 de24.14 ± 0.21 gh46.26 ± 0.16 c5.15 ± 0.21 fg4.98 ± 0.62 bc89.87 ± 0.71 bcd
T531.47 ± 0.32 c27.11 ± 0.12 de41.42 ± 0.44 f5.63 ± 0.03 ef5.05 ± 0.10 bc89.32 ± 0.10 cde
T634.64 ± 1.24 a28.26 ± 0.41 bc37.09 ± 0.83 g10.28 ± 0.46 a6.27 ± 0.89 a83.45 ± 1.10 h
T730.89 ± 0.46 c25.66 ± 0.69 f43.44 ± 1.14 e7.45 ± 0.42 c5.02 ± 0.41 bc87.52 ± 0.83 fg
T821.58 ± 0.06 j29.01 ± 0.02 b49.41 ± 0.04 b6.01 ± 0.07 de4.39 ± 0.08 bcd89.61 ± 0.14 cde
T930.61 ± 0.29 cd24.65 ± 0.39 g44.74 ± 0.68 d8.40 ± 0.86 b5.30 ± 0.10 b86.31 ± 0.84 g
T1026.98 ± 0.26 g24.08 ± 0.82 gh48.94 ± 1.08 b6.18 ± 0.47 de4.43 ± 0.25 bcd89.39 ± 0.68 cde
T1122.70 ± 0.39 i24.76 ± 0.06 g52.54 ± 0.44 a5.10 ± 0.12 fg4.23 ± 0.18 cd90.67 ± 0.18 bc
T1232.64 ± 1.28 b23.64 ± 0.25 h43.72 ± 1.04 de6.02 ± 0.35 de4.95 ± 0.11 bc89.04 ± 0.35 de
T1323.16 ± 0.96 i29.88 ± 0.35 a46.96 ± 0.61 c5.19 ± 0.37 fg5.27 ± 1.03 b89.54 ± 1.24 cde
T1428.26 ± 0.07 f22.62 ± 0.13 i49.13 ± 0.05 b6.63 ± 0.25 d5.08 ± 0.84 bc88.29 ± 2.25 ef
1 See Table 2 for code explanation.
Table 4. N content and accumulation of P. bournei seedlings under different NPK fertilization.
No.N Content/g·kg −1N Accumulation/mg·plant−1
RootStemLeavesRootStemLeavesTotal
T11.72 ± 0.08 j 11.85 ± 0.01 e22.65 ± 0.48 g1.43 ± 0.13 i1.48 ± 0.16 ef28.52 ± 1.80 h31.43 ± 2.05 g
T22.31 ± 0.08 hi1.93 ± 0.01 e26.25 ± 0.40 d1.57 ± 0.18 i1.24 ± 0.04 f37.47 ± 3.53 g39.87 ± 4.31 f
T32.67 ± 0.07 g1.94 ± 0.03 e27.17 ± 0.24 c2.89 ± 0.22 g2.06 ± 0.20 def50.55 ± 3.84 de55.50 ± 4.24 d
T42.07 ± 0.06 i2.32 ± 0.31 de27.40 ± 0.04 c3.23 ± 0.20 f3.12 ± 0.41 bc56.36 ± 0.94 bc62.71 ± 1.22 bc
T53.01 ± 0.02 f3.31 ± 0.04 abc30.59 ± 0.05 b3.66 ± 0.05 de3.28 ± 0.11 bc58.02 ± 0.69 b64.96 ± 0.84 b
T63.36 ± 0.01 de2.52 ± 0.41 bcde25.50 ± 0.31 e8.46 ± 0.14 a5.16 ± 0.72 a68.83 ± 4.73 a82.45 ± 4.85 a
T73.01 ± 0.06 f2.44 ± 0.10 cde25.16 ± 0.33 ef4.37 ± 0.14 c2.94 ± 0.11 bcd51.53 ± 4.71 cde58.85 ± 4.84 cd
T83.83 ± 0.04 bc2.08 ± 0.04 de24.95 ± 0.01 ef3.27 ± 0.07 f2.39 ± 0.07 cde48.74 ± 0.57 e54.39 ± 0.70 d
T94.49 ± 0.60 a3.51 ± 0.15 a31.49 ± 0.33 a5.43 ± 0.40 b3.44 ± 0.15 b55.96 ± 2.28 bcd64.83 ± 2.05 bc
T103.09 ± 0.06 ef2.49 ± 0.09 cde24.71 ± 1.14 f2.75 ± 0.15 gh1.97 ± 0.12 def40.00 ± 4.95 fg44.73 ± 5.19 ef
T113.92 ± 0.05 b2.98 ± 0.11 abcd30.13 ± 0.37 b2.43 ± 0.14 h2.02 ± 0.20 def43.28 ± 3.49 f47.73 ± 3.81 e
T122.47 ± 0.02 gh2.81 ± 0.09 abcde27.35 ± 0.24 c3.76 ± 0.28 d3.09 ± 0.10 bc55.61 ± 0.73 bcd62.46 ± 1.05 bc
T133.15 ± 0.25 ef2.48 ± 0.51 cde26.75 ± 0.35 cd3.41 ± 0.27 ef3.49 ± 0.81 b58.87 ± 2.25 b65.76 ± 3.05 b
T143.58 ± 0.11 cd3.44 ± 1.73 ab27.40 ± 0.38 c4.24 ± 0.12 c3.26 ± 1.61 bc56.54 ± 1.37 bc64.04 ± 1.24 bc
1 See Table 2 for code explanation.
Table 5. P content and accumulation of P. bournei seedlings under different N-P-K fertilization.
No.P Content/g·kg−1P Accumulation/mg·plant−1
RootStemLeavesRootStemLeavesTotal
T10.35 ± 0.03 g 10.19 ± 0.00 i0.37 ± 0.02 b2.87 ± 0.07 h1.54 ± 0.19 e4.72 ± 0.44 de9.14 ± 0.56 g
T20.49 ± 0.01 c0.45 ± 0.01 a0.39 ± 0.04 ab3.35 ± 0.28 gh2.79 ± 0.16 cd5.66 ± 1.02 cd11.80 ± 1.39 ef
T30.54 ± 0.00 b0.39 ± 0.00 b0.27 ± 0.03 cd5.87 ± 0.54 d4.18 ± 0.39 b4.93 ± 0.42 de14.98 ± 0.32 d
T40.39 ± 0.03 f0.27 ± 0.02 ef0.21 ± 0.00 d4.68 ± 0.25 ef3.69 ± 0.16 bc4.35 ± 0.14 e12.72 ± 0.22 e
T50.41 ± 0.03 def0.43 ± 0.02 a0.30 ± 0.06 c6.37 ± 0.54 cd4.23 ± 2.13 b5.66 ± 1.15 cd16.27 ± 3.25 cd
T60.43 ± 0.00 d0.32 ± 0.01 d0.27 ± 0.01 cd10.86 ± 0.11 a6.60 ± 0.62 a7.22 ± 0.47 b24.68 ± 0.97 a
T70.52 ± 0.01 bc0.23 ± 0.01 h0.26 ± 0.01 cd7.50 ± 0.38 b2.79 ± 0.07 cd5.39 ± 0.40 cd15.69 ± 0.75 cd
T80.39 ± 0.03 ef0.24 ± 0.02 gh0.26 ± 0.00 cd3.21 ± 0.08 h2.74 ± 0.24 cd5.13 ± 0.09 cde11.08 ± 0.38 ef
T90.54 ± 0.03 b0.40 ± 0.01 b0.32 ± 0.03 c6.56 ± 0.17 c3.90 ± 0.29 b5.63 ± 0.41 cd16.09 ± 0.18 cd
T100.42 ± 0.01 de0.29 ± 0.02 e0.27 ± 0.04 c3.76 ± 0.31 g2.26 ± 0.09 de4.38 ± 0.31 e10.40 ± 0.38 fg
T110.71 ± 0.03 a0.35 ± 0.02 c0.42 ± 0.02 ab4.40 ± 0.08 f2.40 ± 0.32 de6.00 ± 0.50 c12.79 ± 0.79 e
T120.42 ± 0.00 de0.25 ± 0.00 fgh0.39 ± 0.03 ab6.45 ± 0.45 c2.78 ± 0.08 cd7.84 ± 0.57 b17.07 ± 0.48 bc
T130.49 ± 0.01 c0.29 ± 0.02 e0.44 ± 0.02 a5.12 ± 0.29 e4.06 ± 0.38 b9.60 ± 0.44 a18.78 ± 0.99 b
T140.38 ± 0.02 fg0.27 ± 0.03 efg0.27 ± 0.04 cd4.52 ± 0.18 f2.52 ± 0.33 de5.47 ± 0.86 cd12.52 ± 1.13 e
1 See Table 2 for code explanation.
Table 6. P and K allocation rate of P. bournei seedlings under different N-P-K fertilization.
No.P Allocation Rate (%)K Allocation Rate (%)
RootStemLeavesRootStemLeaves
T131.54 ± 2.41 ef 116.87 ± 1.24 f51.59 ± 1.61 a21.87 ± 2.35 d17.89 ± 1.25 e60.24 ± 3.57 b
T228.49 ± 1.45 f23.78 ± 2.69 bcd47.73 ± 2.11 b41.25 ± 4.98 a21.66 ± 2.49 d37.08 ± 5.42 f
T339.17 ± 2.81 c27.94 ± 3.08 ab32.89 ± 3.72 e40.43 ± 2.66 ab16.04 ± 3.67 f43.53 ± 4.21 e
T436.78 ± 1.77 cd28.98 ± 4.87 a34.24 ± 4.42 e30.77 ± 0.97 c19.34 ± 4.33 e49.89 ± 0.65 c
T540.07 ± 7.52 bc25.12 ± 5.47 abc34.80 ± 5.21 e28.17 ± 3.59 c13.49 ± 5.77 g58.34 ± 2.94 b
T644.05 ± 1.93 ab26.71 ± 6.53 ab29.24 ± 6.10 f27.60 ± 1.12 c27.87 ± 6.04 b44.54 ± 0.81 de
T747.81 ± 0.70 a17.84 ± 7.79 ef34.35 ± 7.28 e37.23 ± 0.73 b18.33 ± 7.53 e44.44 ± 1.25 de
T829.00 ± 0.27 f24.73 ± 8.31 bc46.27 ± 8.08 bc19.82 ± 0.93 d24.24 ± 8.83 c55.94 ± 1.48 b
T940.77 ± 1.43 bc24.25 ± 9.68 bcd34.98 ± 9.41 e27.63 ± 0.57 c23.14 ± 9.77 c49.23 ± 0.36 c
T1036.18 ± 2.79 cde21.73 ± 10.58 cde42.09 ± 10.28 d20.51 ± 0.31 d13.97 ± 10.53 g65.53 ± 0.74 a
T1134.46 ± 2.22 de18.69 ± 11.52 ef46.85 ± 11.08 bc15.37 ± 0.36 e18.86 ± 11.94 e65.77 ± 1.21 a
T1237.77 ± 2.51 cd16.31 ± 12.39 f45.93 ± 12.88 bc30.86 ± 1.65 c19.04 ± 12.14 e50.10 ± 1.76 c
T1327.27 ± 1.27 f21.60 ± 13.97 cde51.13 ± 13.83 a20.40 ± 1.43 d30.99 ± 13.90 a48.61 ± 1.72 cd
T1436.26 ± 2.30 cd20.20 ± 14.38 def43.54 ± 14.07 cd28.72 ± 2.31 c13.61 ± 14.59 g57.67 ± 1.74 b
1 See Table 2 for code explanation.
Table 7. K content and accumulation of P. bournei seedlings under different N-P-K fertilization.
No.K Content/g·kg−1K Accumulation/mg·plant−1
RootStemLeavesRootStemLeavesTotal
T12.06 ± 0.20 i 11.75 ± 0.16 f3.77 ± 0.72 d17.08 ± 2.25 g13.97 ± 1.46 i47.32 ± 8.22 i78.36 ± 10.72 i
T27.98 ± 0.06 a4.62 ± 0.42 a3.49 ± 0.87 de54.25 ± 4.84 d28.60 ± 2.35 e49.22 ± 10.23 hi132.07 ± 11.24 fg
T35.93 ± 0.39 b2.39 ± 0.09 e3.74 ± 0.61 d64.09 ± 4.99 b25.42 ± 3.69 efg68.95 ± 6.29 f158.46 ± 3.14 de
T42.92 ± 0.13 fg2.25 ± 0.01 e2.79 ± 0.02 f35.41 ± 1.19 f22.26 ± 4.48 fgh57.41 ± 1.22 gh115.07 ± 1.71 h
T54.00 ± 0.72 c2.21 ± 0.01 e6.78 ± 0.10 a62.42 ± 10.72 bc29.72 ± 5.03 de128.50 ± 0.10 b220.64 ± 10.78 b
T63.55 ± 0.08 de4.39 ± 0.04 a5.35 ± 0.24 b89.28 ± 1.79 a90.31 ± 6.74 a144.32 ± 9.28 a323.91 ± 16.26 a
T73.09 ± 0.01 fg1.83 ± 0.01 f2.62 ± 0.14 f44.83 ± 1.55 e22.06 ± 7.62 fgh53.57 ± 3.70 ghi120.47 ± 5.48 gh
T82.47 ± 0.17 hi2.24 ± 0.11 e3.06 ± 0.05 ef21.07 ± 1.70 g25.75 ± 8.59 ef59.36 ± 0.60 g91.79 ± 11.29 i
T93.32 ± 0.25 ef3.45 ± 0.19 c3.81 ± 0.28 cd40.26 ± 0.86 ef33.71 ± 9.06 cd71.74 ± 0.89 f145.80 ± 0.75 ef
T103.86 ± 0.04 cd2.95 ± 0.12 d6.80 ± 0.34 a34.33 ± 2.09 f23.37 ± 10.38 fg109.64 ± 4.97 c167.34 ± 7.97 cd
T112.76 ± 0.08 gh3.10 ± 0.20 d5.10 ± 0.25 b17.10 ± 1.38 g20.99 ± 11.14 gh73.02 ± 2.96 f111.10 ± 6.32 h
T123.66 ± 0.03 cde3.12 ± 0.02 d4.44 ± 0.13 c55.63 ± 3.61 cd34.32 ± 12.59 c90.25 ± 2.14 d180.19 ± 2.11 c
T133.30 ± 0.15 ef3.89 ± 0.21 b3.88 ± 0.09 cd35.92 ± 3.82 f54.48 ± 13.31 b85.36 ± 0.62 de175.76 ± 7.18 c
T143.24 ± 0.38 ef1.91 ± 0.03 f3.74 ± 0.09 d38.47 ± 4.55 ef18.19 ± 14.84 h77.10 ± 3.86 ef133.77 ± 7.29 fg
1 See Table 2 for code explanation.
Table 8. N, P, K element absorption balance of P. bournei seedlings under different N-P-K fertilization.
NumberTreatmentN/PN/KP/K
T1N0P0K03.44 ± 0.18 c 10.40 ± 0.05 ef0.12 ± 0.02 ab
T2N0P2K23.38 ± 0.04 c0.30 ± 0.04 h0.09 ± 0.01 cde
T3N1P2K24.22 ± 0.99 abc0.35 ± 0.03 g0.09 ± 0.02 cde
T4N2P0K24.93 ± 0.16 ab0.55 ± 0.01 a0.11 ± 0.00 abc
T5N2P1K24.10 ± 0.80 abc0.29 ± 0.02 h0.07 ± 0.01 def
T6N2P2K24.22 ± 1.58 abc0.25 ± 0.00 i0.07 ± 0.02 ef
T7N2P3K23.75 ± 0.13 bc0.49 ± 0.02 b0.13 ± 0.00 a
T8N2P2K04.91 ± 0.20 ab0.51 ± 0.01 ab0.10 ± 0.01 bc
T9N2P2K14.03 ± 0.14 abc0.44 ± 0.01 cd0.11 ± 0.00 abc
T10N2P2K35.16 ± 1.52 a0.27 ± 0.02 hi0.05 ± 0.02 f
T11N3P2K24.33 ± 0.97 abc0.43 ± 0.02 de0.10 ± 0.02 bc
T12N1P1K23.66 ± 0.07 bc0.35 ± 0.00 g0.09 ± 0.00 bcd
T13N1P2K13.96 ± 0.92 abc0.37 ± 0.01 fg0.10 ± 0.02 bcd
T14N2P1K15.14 ± 0.48 a0.48 ± 0.03 bc0.09 ± 0.00 bcd
1 See Table 2 for code explanation.
Table 9. Path coefficients between main indices and total dry biomass of P. bournei seedlings under N-P-K fertilization.
Main IndexCorrelation CoefficientDirect Path Coefficient
Total N accumulation0.836 **0.24
Root N accumulation0.880 **0.437
Leaves N content0.028−0.233
Total K accumulation0.837 **0.806
Root P accumulation0.875 **0.282
Stem K accumulation0.811 **−0.432
Stem K content0.195−0.252
Root P content−0.239−0.061
Stem P content−0.0450.068
N/P0.047−0.077
P/K−0.252−0.097
** Highly significant correlation at p < 0.01.
Table 10. Correlation analysis of dry biomass content and accumulation in each organ and main indices of P. bournei seedlings under fertilization.
Main IndexRootStemLeaves
Total dry biomass0.62 **0.39 **−0.79 **
Total N accumulation0.46 **0.23−0.55 **
Root N accumulation0.61 **0.19−0.68 **
Leaves N content0.09−0.26 *0.07
Total K accumulation0.54 **0.25 *−0.64 **
Stem K accumulation0.34 *0.44 **−0.56 **
Stem K content−0.040.000.04
Root P accumulation0.72 **0.19−0.77 **
Root P content−0.32 *−0.120.36 *
Stem P content−0.02−0.190.12
N/P−0.13−0.090.17
N/K−0.25 *−0.080.27 *
P/K−0.120.020.10
* Significant correlation at p < 0.05; ** highly significant correlation at p < 0.01.
Table 11. Range analysis of effect of N-P-K fertilization on main indexes of P. bournei seedlings.
Main IndexRang ValueFertilizer Effect
Ordination
NPK
The total dry biomass4.543.173.97N > K > P
Root N accumulation6.895.236.03N > K > P
The total N accumulation42.5828.0637.72N > K > P
Root N allocation rate6.395.134.27N > P > K
Leaves N content4.635.436.54K > P > N
Root P accumulation7.516.187.65K > N > P
Stem P allocation rate9.2511.144.98P > N > K
Root P content0.280.130.15N > K > P
Stem P content0.130.20.16P > K > N
Stem K accumulation69.3268.0566.94N > P > K
The total K accumulation212.81208.84232.12K > N > P
Stem K allocation rate11.8314.3813.9P > K > N
Stem K content2.232.562.15P > N > K
N/P0.951.181.13P > K > N
N/K0.180.30.26P > K > N
P/K0.030.060.06P = K > N
Publisher’s Note: MDPI stays neutral with regard to jurisdictional claims in published maps and institutional affiliations.

