Article

An Agronomic Approach to Pine Nut Production by Grafting Stone Pine on Two Rootstocks

Fruit Production Program, Institute of Agrifood Research and Technology (IRTA), Torre Marimon, 08140 Caldes de Montbui, Spain
*
Author to whom correspondence should be addressed.
Agriculture 2021, 11(11), 1034; https://doi.org/10.3390/agriculture11111034
Submission received: 10 August 2021 / Revised: 1 October 2021 / Accepted: 14 October 2021 / Published: 22 October 2021
(This article belongs to the Special Issue Development and Cultivar Improvement of Nut Crops)

Abstract

:
Stone pine (Pinus pinea) grows in natural stands within the Mediterranean basin and its nut is highly appreciated for its nutritional profile. Nevertheless, a decline in this species due to biotic and abiotic damages is currently being clearly observed. This situation has led to its development as a nut crop, to try to save its production and obtain regular harvests over the years. Under this agronomic scenario, the aim of this work was to compare the behavior of the stone pine grafted onto two rootstocks, P. pinea (PP) and P. halepensis (PH), by evaluating cone productivity, tree growth response, mast seeding patterns and pine nut composition. The field test was composed of 14 PH and 14 PP, randomly distributed into groups of 4–5 trees/rootstock. Data were from seven productive growing seasons. The results show higher growth and ripe cone production on PP rather than PH, although the productivity (cones/m2 canopy) was similar. Any effect of rootstock was observed on the mast seeding pattern and weight of cones, while the pine nut composition showed differences in the fatty acids content. The global quality of production was similar in PH and PP.

1. Introduction

Stone pine (Pinus pinea L.) is widespread in the Iberian Peninsula, where up to 80% of the world’s planted and naturalized forest surface is concentrated [1]. This autochthonous south European species shows a narrow genetic diversity due to its residual survival in the Iberian Peninsula from the last glaciation [2,3]. However, it is endowed with a great phenotypic plasticity, which allowed its current spread in areas well differentiated climatically [4]. Its dissemination in the Mediterranean basin was in the past linked to forestation, dune containment and wood production, but currently interest is focused on pine nut production. This production is already arousing the interest of other warm areas in the world such as Chile, Argentina, or New Zealand [5].
Nuts of stone pine have been highly appreciated since ancient times [6] and now are one of the most expensive nuts in the world market, around a stable price of 65 EUR/Kg, according to the nut industry [7]. Traditionally, the cones are obtained from forest trees. However, the world market demand is not being satisfied with the extraction of cones exclusively from natural stands. Moreover, in recent years, a dramatic decrease in production occurred in the Iberian Peninsula, associated with both climate change, with recurrent droughts, and western conifer seed bug (WCSB) attack, Leptoglossus occidentalis Heidemann [8]. The WCSB can affect all of the female reproductive structures of the stone pine [9], and all the cones, easily causing reductions of up to 50% in the final kernel yield [8,10,11]. This scenario favours the commercialisation of other pine species from China, Russia, and North Korea (Pinus koraiensis, Pinus gerardiana, or Pinus sibirica) which are sold as a substitutes of P. pinea nuts [12]. However, their nutritious and dietetic characteristics are not comparable to those of the stone pine fruit. The ‘Royal pine-nut’ contains over 30% protein, and a high level of the essential omega-6 fatty acid, linoleic, the highest compared with pine nuts obtained from other pine species [6,13].
In this sense, silvicultural management techniques have been successfully used in improving the natural stand production [14,15], although the solution to guarantee a sustainable production of P. pinea seems to diverge into the management of this species as a horticultural crop. The first step was the use of grafts, which allows a notable reduction of the trees unproductive period, being much shorter than the expected in planting seedlings [5,16,17,18]. Recently, a new improvement has been added by grafting selected scions from outstanding individuals with high productivity [19]. Also, the success reached in some preliminary trials using Pinus halepensis as a rootstock of stone pine led to the extension of P. pinea plantations to calcareous and compact soils [20,21,22].
The main challenge in turning the stone pine into a nut crop lies in its own reproductive characteristics. This species requires more than three years to form the edible pine nut. During that period, three kinds of cones (first, second year and third year cones) coexist and compete for resources in the same tree at the same time [1,16].
The aim of the present study was to compare the behaviour of outstanding stone pine clones grafted on two rootstocks, P. pinea and P. halepensis, in a trial plot. The comparison were through evaluating the cone productivity, the tree growth response, the mast seeding patterns, and the pine nut composition from both rootstocks. The data considered were from seven harvests, which represent five completed cohorts.

2. Materials and Methods

2.1. Field Test and Plant Material

The trial plot, established in the autumn of 2009, was located at IRTA’s station Torre Marimon (Caldes de Montbui, Catalonia, Spain), at 2°10′ E, 41°37′ N and 160 m a.s.l. on the pre-littoral north–east depression of Spain. The field borders the Riera de Caldes water course.
Trees were grown in this Mediterranean area, with an average annual temperature of 14.9 °C, with absolutes from –8.6 to 39.7 °C. The mean annual rainfall ranges were from 472 to 954 mm. Climatic data were obtained from the Torre Marimon meteorological station located next to the trial plot. The soil texture is sandy with a clayish alluvial horizon below 50 cm, it has low fertility, and it is lightly alkaline. The soil preparation included manuring and deep ploughing with a ripper.
All the planted stone pines were grafted at a nursery. First, P. halepensis and P. pinea seedlings were grown in pots and were grafted at two-years-old (in 2008). A top wedge graft was used, replacing the leader shoot of the rootstock by a soft scion of the donor clone Pinus pinea. The stone pine scions used were collected from two adult trees of the ‘Litoral of Catalonia’, a Spanish Provenance Region of P. pinea [23], which stands out for its regular production. After grafting, plants were bred in the nursery for one more year. Any differences in the affinity and survival of the grafts were detected between the heteroblastic and the homoblastic grafts.
The planting distance was 6 × 3 m. The field test was designed with 14 stone pines grafted onto P. halepensis and 14 stone pines onto P. pinea, randomly distributed by groups of 4–5 trees per rootstock. They received an initial water supply (an amount of 100 l per tree) at planting and after two weeks. After that, the plantation was rain fed. The spring rainfall during the assay (2014 to 2020) ranged from 75 to 300 mm and the annual rainfall ranged from 387 to 810 mm. Weed competence was mechanically controlled, mowing the plot three times per year. The last three years, two sprays of Deltamethrin insecticide were applied to dampen the western conifer seed bug (WCSB) attack. The first was applied during the emergence of adults from hibernation and the other when the presence of the second generation was detected in the orchard.

2.2. Growing and Production Measurements

Tree height and diameter were measured at planting and annually from 2013 to 2020 (trunk diameter, just under graft, and total height). Canopy tree development was evaluated by measuring the diameter of the crown and canopy projection extracted from zenithal images and was subsequently processed with the free software ImageJ [24]. All growing measurements were taken during winter (December to February) to ensure that the trees were not in the growing season.
Yearly, cones from different ages were counted per tree: strobili (P1), conelets of the 2nd year (P2), and ripe cones (P3).
Harvests from 2014 to 2020 (seven consecutive years) were widely studied. Ripe cones of each tree were weighed to obtain the fresh weight of the production, per tree (FW-P). Later, ripe cones were oven dried until opening at 45 °C for approximately two weeks in order to reach the 5–6% humidity used as a proxy of the accepted commercial value [25]. Dried cones were weighted (DW-C) and the extracted pine nuts too (W-PN). Then, the empty PN were separated by flotation in water. Potentially edible pine nuts, those that sank, were weighed to obtain the commercial PN quantification per tree (W-EPN). The FW-P were divided by the total number of P3 to obtain the individual fresh weight per cone (FW-C). The seed efficiency (Sef) was calculated per cone as the ratio EPN number/total number of PN and the yield efficiency (Yef) as the ratio of W-EPN/FW-P.
On the other hand, 150 g of unshelled EPN were obtained from three trees of each rootstock and analysed (in a certified laboratory) for chemical nut composition: starch, protein, sugars, crude fibre, and fat; and the distribution of saturated, monounsaturated, and polyunsaturated fatty acids.

2.3. Statistical Analysis

Growth and productive parameters were analysed using a univariate split-plot approach to repeated measures analyses, where the rootstock factor was nested to each tree with a randomized effect. The fixed factors considered were the rootstock, the year, and the interaction of both. All sources of variation were considered in the REML model. In the case of any significant interaction, the analysis was carriedout separately by year to obtain the post hoc Tukey’s HSD test.
The different analyses were performed using the software JMP Base Version: 8.0.1.

3. Results

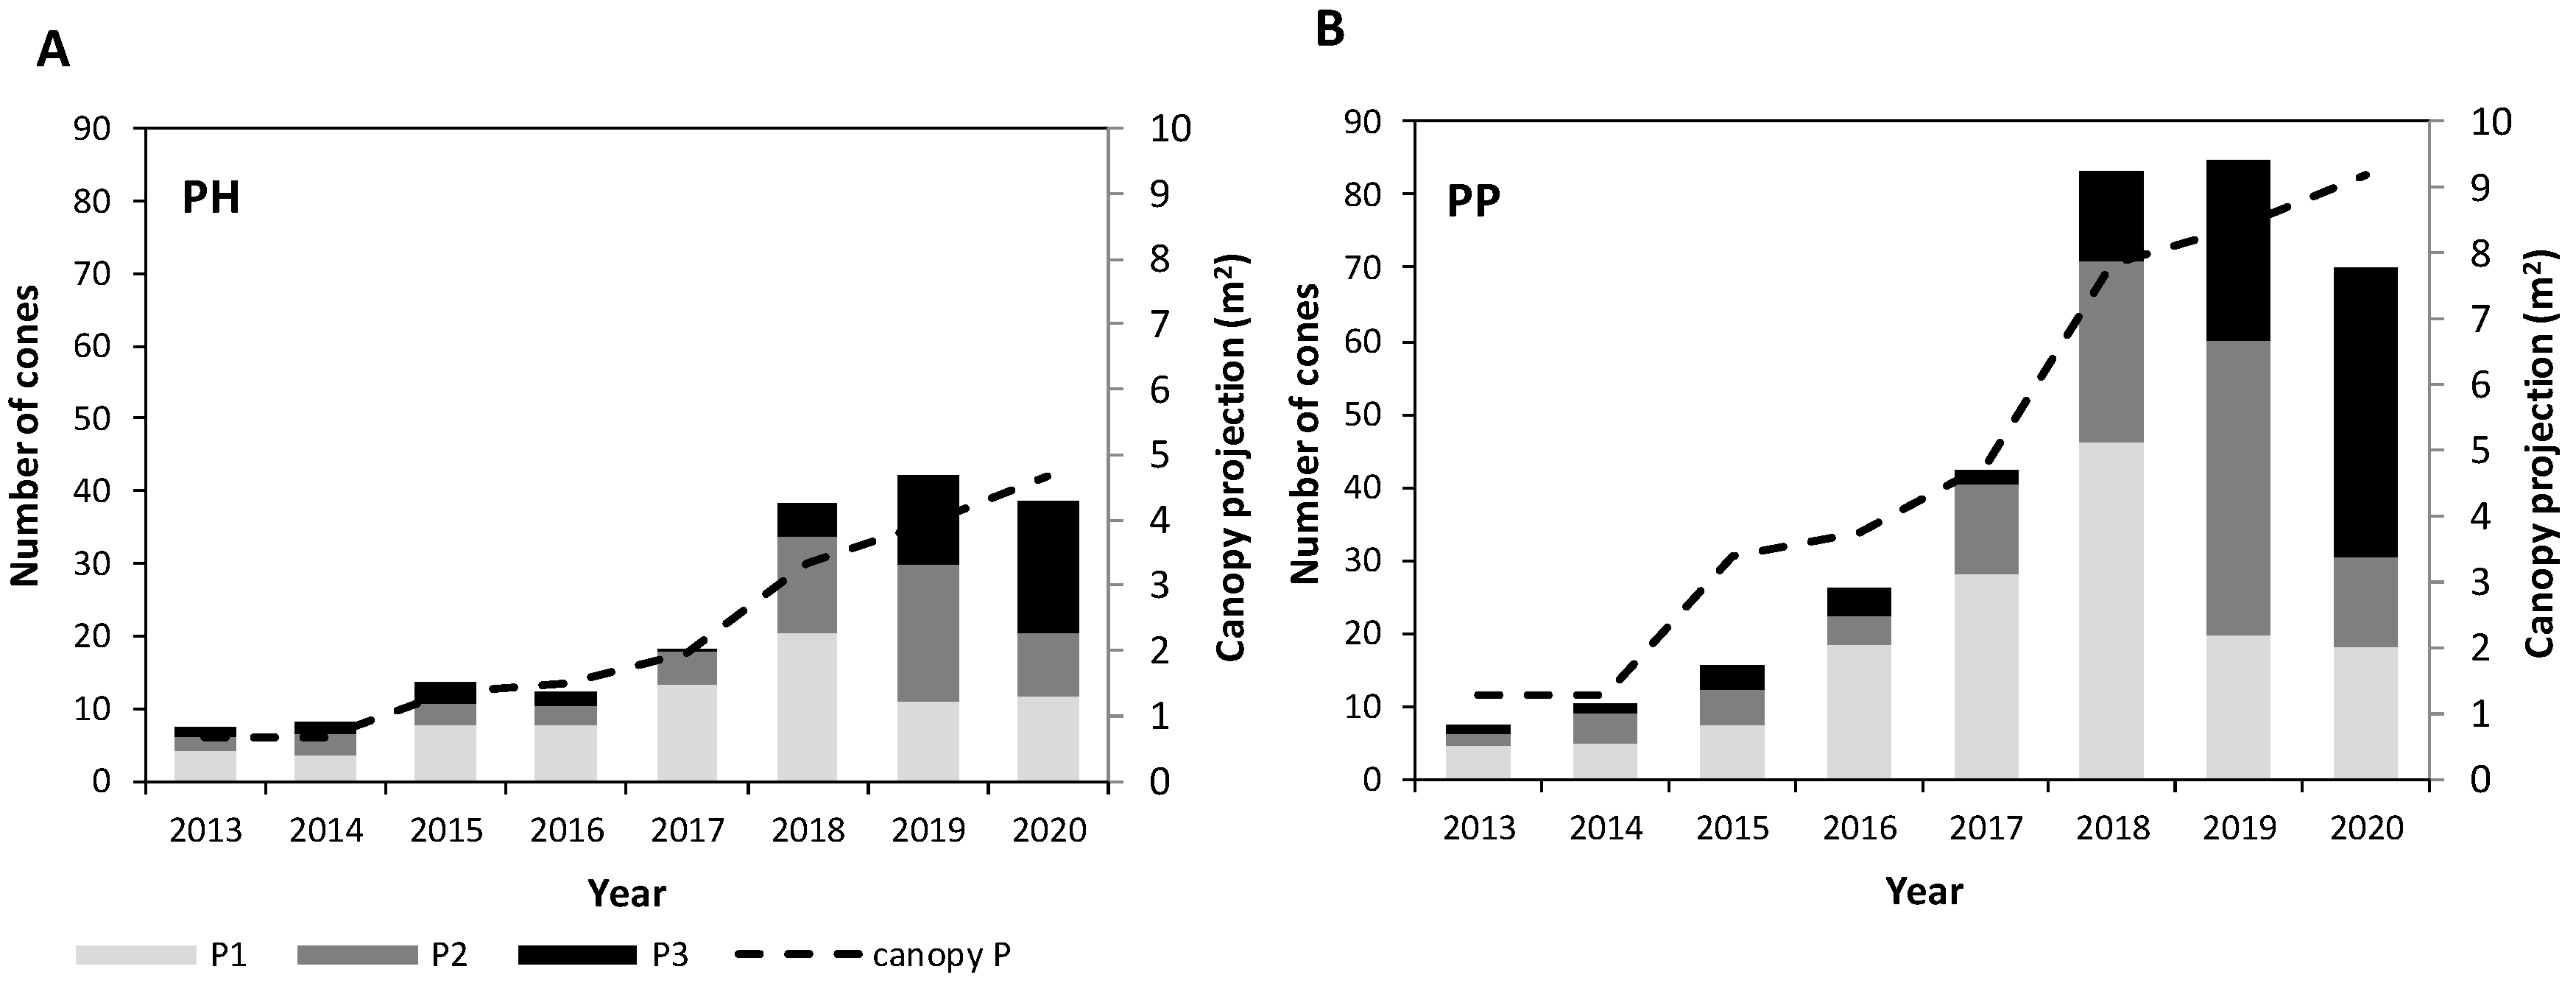
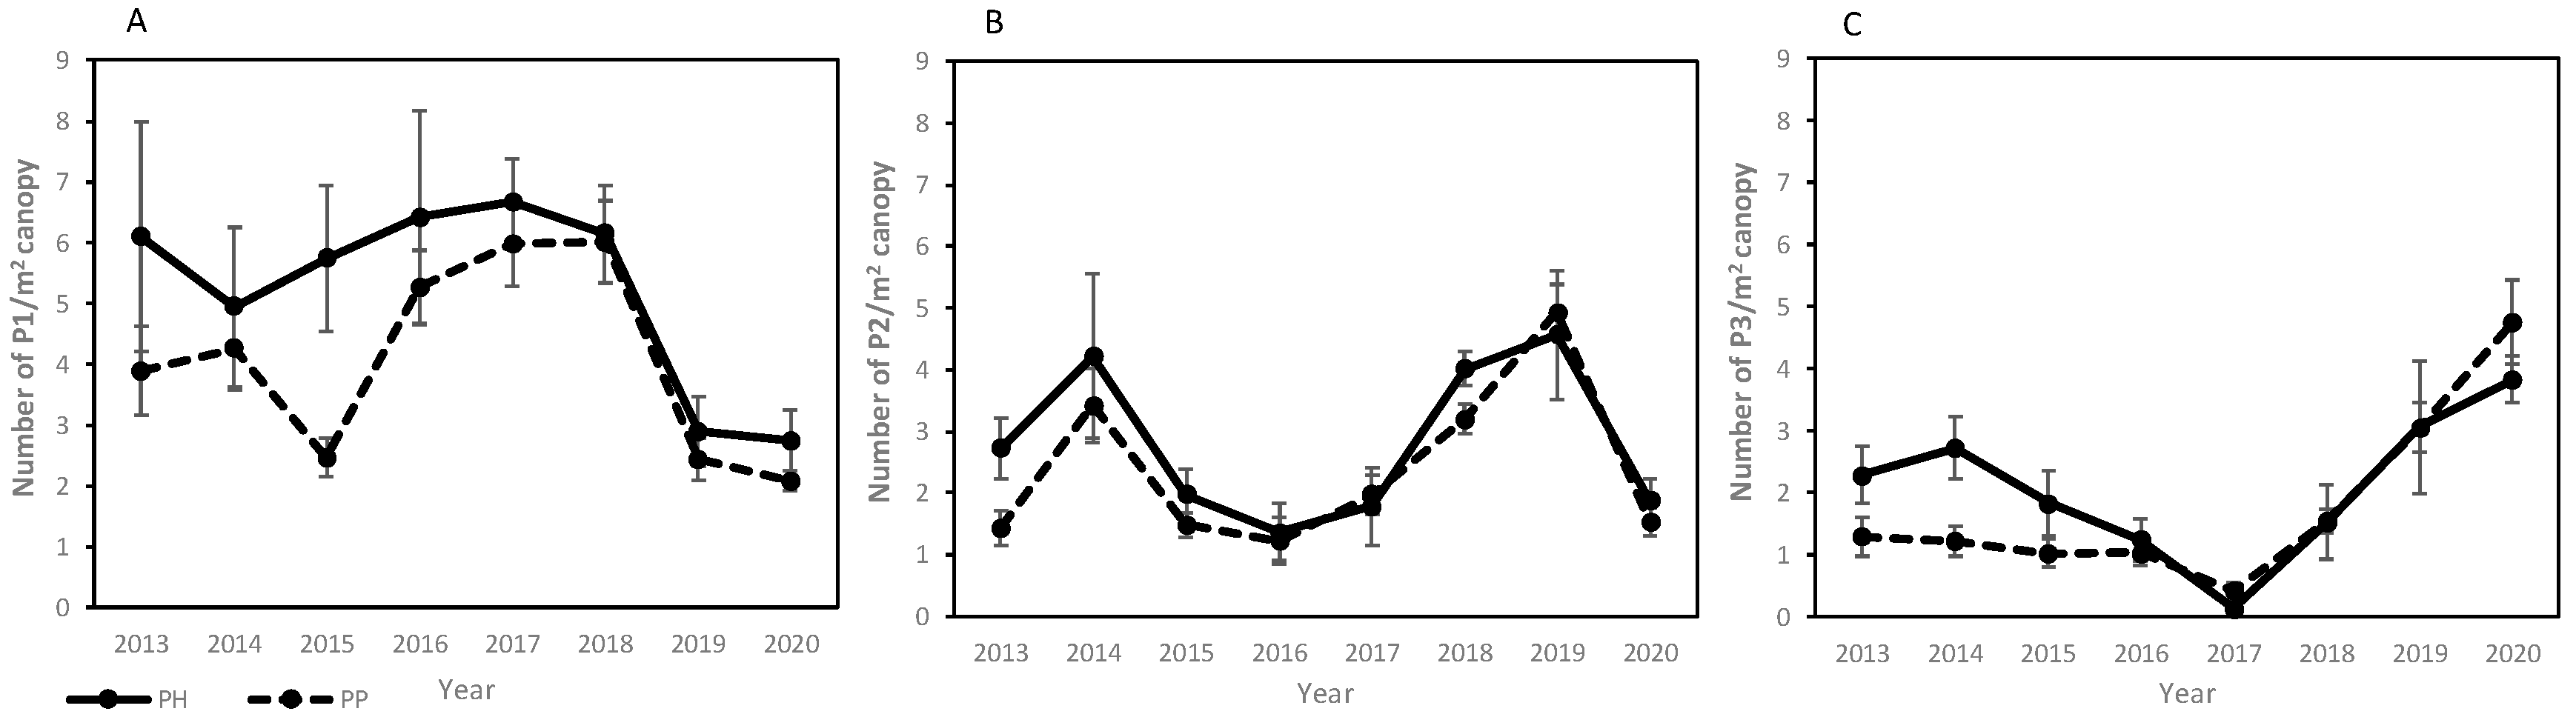
3.1. Evaluation of Cone Production

Interaction Rootstock × Year was significant in all the analysed parameters (Table 1). There was a progressive increase in P1, P2, and P3 throughout the years in both rootstocks. Only in 2017 did a productive problem mitigate the progressive increase in P3 production in all trees of the field plot, probably due to the WCSB damages (sprays started the following season).
First cones were harvested on five-year-old trees and no differences between rootstocks in cone production were detected until the age of seven. From 2018 on, those differences became more evident and the number of cones and the production per tree were significantly different between rootstocks, being higher in PP than in PH (Table 1). The weight of the edible pine nuts (W-EPN) maintained a similar tendency and at age eleven the W-EPN had an average than 3.5 Kg/tree in PP vs. 1.5 Kg/tree in PH.
FW-C increased year by year but no effect of rootstock was detected. In the 2020 harvest, the average weight of ripe cones was 505.1 ± 84.6 g and 532.3 ± 39.5 g, in PP and PH, respectively. The same behaviour was observed in Sef and Yef along the years, except for 2019. Data of this year were not included in the analysis because samples were not correctly stored, and it was assumed that fungal infection affected the dry weight. For PH, Sef ranged from 71.0 ± 3.7 (2016) to 92.92 ± 0.9 (2020), whereas for PP it ranged from 82 ± 14.7 (2014) to 93.1 ± 7.2 (2018) (Table 1).
Figure 1 shows the evolution of the total reproductive tree load (strobili + cones of 2nd year + ripe cones) according to age. In 2018, the juvenile phase seemed to be finished in both species, and during the last three years, the number of cones per tree (total reproductive load) was quite stable. From 2018 onwards, the productive response of the trees was positively favoured due to the application of insecticide sprays neutralizing the WCSB attack on the trees. In 2018, there was a peak of P1 in both rootstocks, which was linked with the peak of P2 in 2019 and with the exceptionally high harvest of 2020. Both rootstocks showed a decrease in P1 production in 2019 and 2020, but the total reproductive load tended to be maintained. The maximum number of total cones per tree between rootstocks was higher in PP (around 80) compared with PH (around 40), although the reproductive patterns were quite similar.

3.2. Growth vs. Cone Production

Differences in growth parameters (height, normal diameter, and canopy projection) were also attributable to the rootstocks. During the juvenile age, PH and PP rootstocks presented a similar growth rate; however, in adult trees with an age eleven (2020), canopy projection doubled for PP (Figure 1) compared to PH (9.2 vs. 4.7 m2 for PP and PH, respectively). Diameter of the trunk (data not shown) followed a similar pattern: in 2013 the diameter, just under grafting, was 5.1 and 7.6 cm, while in 2020 it was 14.9 and 24.5 cm for PH and PP, respectively.
Focusing on productivity, few differences between rootstocks were observed when the production (number of P1, P2 and P3) was divided by the square meters of the canopy (Figure 2). The statistical analysis of P1/m2 of canopy, P2/m2 of canopy and P3/m2 of canopy revealed that there was no significant Year x Rootstock interaction. Moreover, only in the case of P1/m2 did differences exist between rootstocks, being the average of all the years: 5.20 strobili/m2 vs. 4.05 corresponding to PH and PP, respectively. The productivity in conelets (P2) and ripe cones (P3) increased and decreased, according to years, following a similar pattern between rootstocks (Figure 2).
Since 2016 (at 7 years old), most of trees had some male cones, with a homogeneous increase along the years.

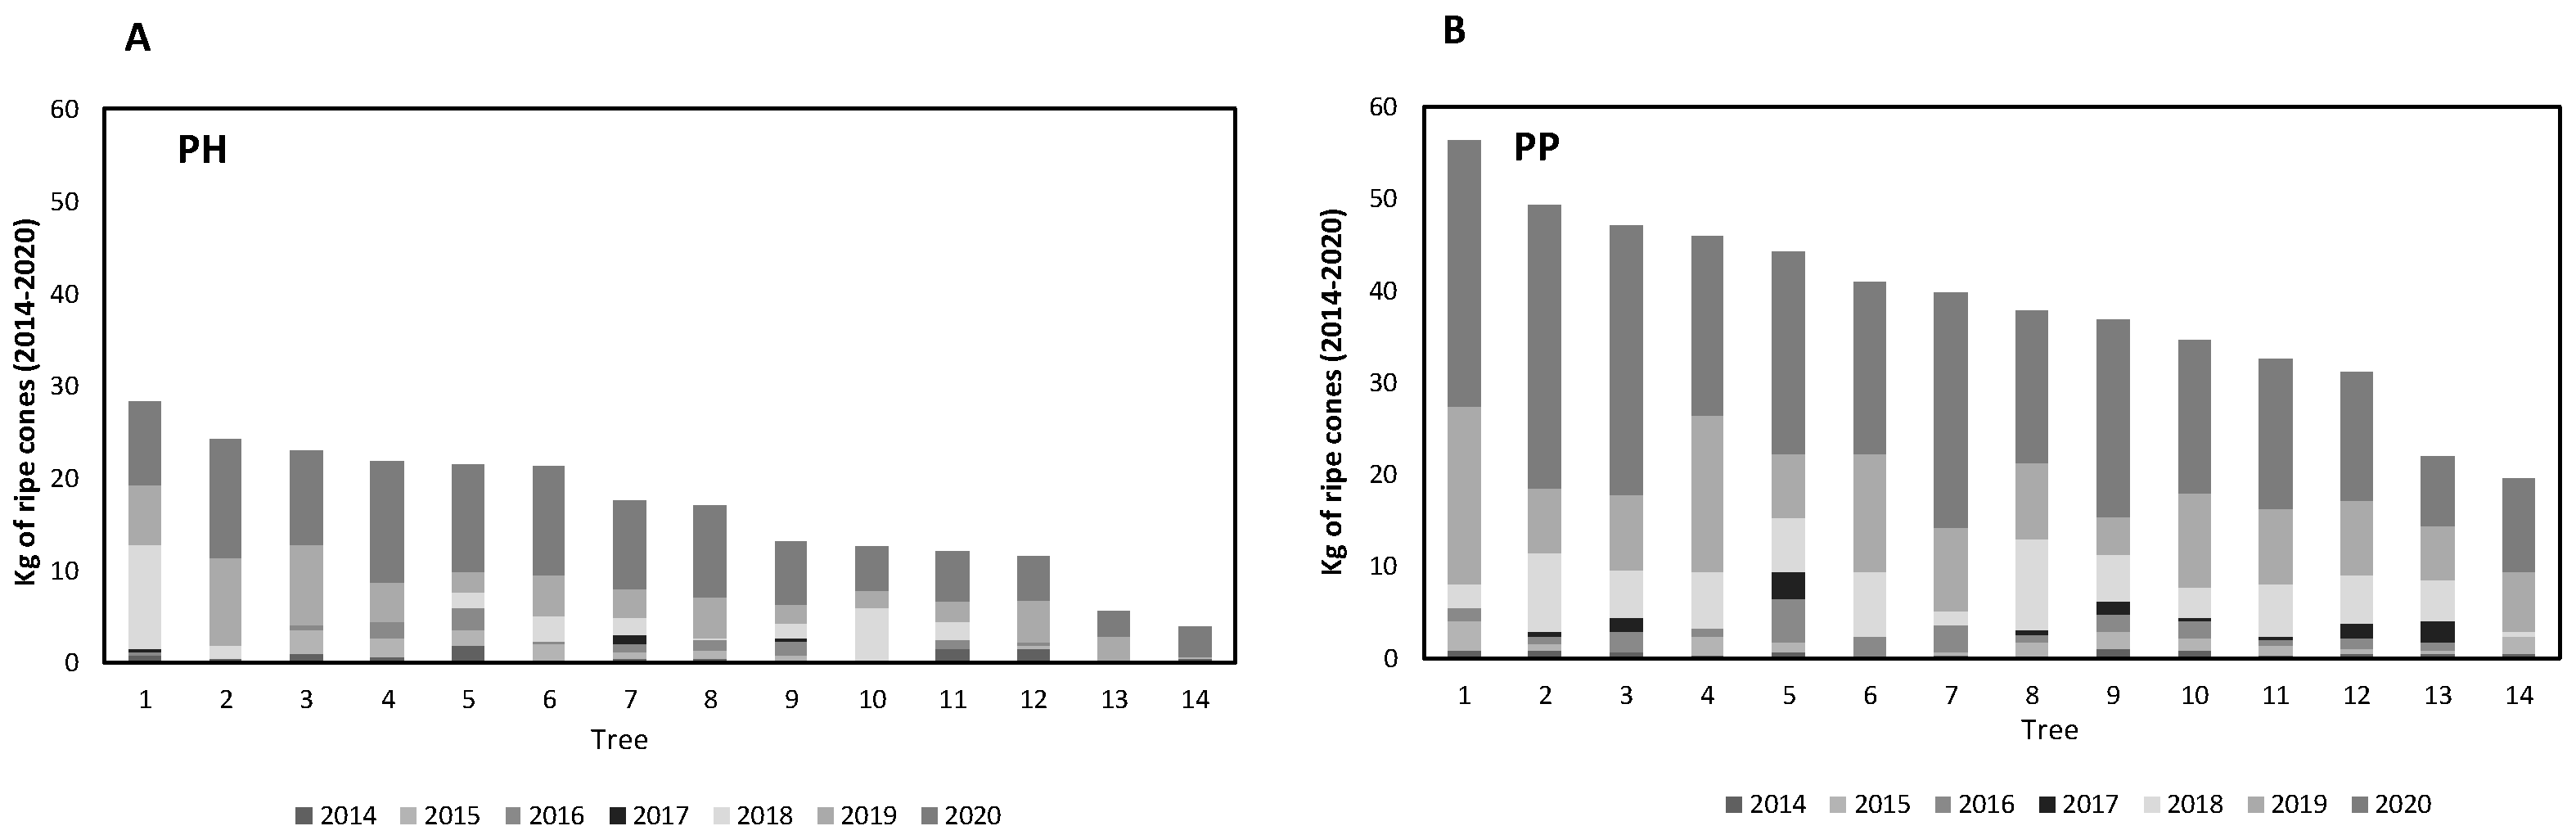
3.3. Heterogeneity of the Harvest

The evolution of the reproductive organs on trees, from P1 to P2 and to P3 (Table 2), were more affected by year than by the rootstocks. The percentage of P1 to reach P2 and P2 to reach P3 was similar for both rootstocks independently of the productive level of the year (e.g., 2015 and 2017, with low and high productivity, respectively).
Considering the production at the field level, all PP trees were productive at age 9, whereas for PH, it was necessary to wait for more one year (Table 2). Moreover, the percentage of non-productive trees during this period was higher in PH rootstocks than PP, indicating that maybe the heteroblastic graft caused more variability in the orchard or the seedlings used, as rootstocks of PH are more heterogeneous than those of PP (Figure 3). The most productive tree grafted on PH had an accumulated production (sum of 2014 to 2020) of 28.3 kg, while the lowest produced 3.8 kg of ripe cones. For PP rootstocks, that production ranged from 56.2 to 19.5 kg of ripe cones, respectively. In addition, as observed in Figure 3, the production regularly increased year by year in all trees.

3.4. Pine Nut Composition

Table 3 summarises the results of pine nut chemical composition for both rootstocks. The main components of pine nuts were proteins and fat, where no differences between rootstocks were observed in the content of protein (36.13 ± 0.37 % and 36.37 ± 0.37 % for PH and PP, respectively), total fat (44.33 ± 0.33 % and 44.23 ± 0.33 %, for PH and PP, respectively), and the minor fractions such sugars, fibre, or starch.
Considering the composition of fatty acids, more than 88% were unsaturated, with linoleic acid being the most relevant, followed by oleic. Significant differences between rootstocks were found in the content of monounsaturated fatty acids (mainly represented by oleic acid), being higher in PP pine nut samples rather than in PH (43.43% vs. 41.37%). Contrarily, levels of polyunsaturated fatty acids (mainly represented by linoleic acid) were higher in PH samples than in PP (47.96 % vs. 46.13%, respectively).

4. Discussion

4.1. Productivity and Growth

The number of strobili and cones of second and third year increased with age of trees in both rootstocks (Table 1). The unique decrease in P3 cones, corresponding to the 2017 harvest, could be attributed to the ruthless WCSB attack, as the sightings of bug adults that year in Catalonia were particularly striking in pine forests. The important peak of P1 in 2018, for both rootstocks, corresponded with a high spring rainfall in the Mediterranean area, where the experiment was located, with 173 mm during April–June, which favoured the development of all reproductive cones [25]. This fact also coincided with the first scheduled chemical spray to control WCSB attacks. The PP started to produce significantly more strobili than PH in the cohort of 2016 (7th year) and differences on total edible pine nuts (W-EPN) were also detected.
Differences between rootstocks on the production were positively linked with the growth parameters. It was observed that PP had higher trunk diameter and canopy projection and therefore a higher yield per tree than PH. This was the simple consequence of the higher vigour of PP vs. PH. Similar results were found by Gordo et al. [21], when they found that stone pine grafted on Aleppo pine had lower number of ripe cones and lower growth than the grafted-on P. pinea. In another study by Catalán [20], it was concluded that the production of stone pine grafted on PH was like that of an adult natural stand, not grafted, of P. pinea. On the other hand, Piqué et al. [22] found, in different juvenile assays of both rootstocks, that in favourable growth conditions the individuals grafted on PH rootstock had a higher number of cones (P3) and conelets (P2) than the individuals grafted on PP. In the present trial, the lower growth of PH could be the result of better climatic or/and edaphic conditions for PP development, as demonstrated by the natural stands of P. pinea surrounding the field plot [15,26]. Furthermore, it was observed by Cuesta el al. [27] that on small seedlings of Pinus halepensis the shoots and roots compete for the same resources, depressing each other, which leads to a reduction of growth ratio, as it was observed in the present study during the first years in PH (Figure 1).
In the present work, the productivity of trees (yield per square meters of canopy projection) for P2 and P3 was similar for both rootstocks, whereas in P1 it was higher in PH than in PP. The canopy grew more in PP than in PH while the cone production was analogous from 2013 to 2015. However, in the following years the amount of cones in PP was always the largest. Considering the ratio P3 production/basimetric area of trunk (a parameter commonly used in fruit production), the productivity was 25% higher for PH than that of PP in 2020. Shestakova et al. [28] found that P. pinea cone production (P3) was more dependent on the productive capacity of the stone pine, rather than linked to the secondary growth. In this sense, even with a smaller canopy and trunk diameter, and considering the same grafted material, the FW-C was similar between rootstocks, and it was slightly increased with age.
Moreover, inter-annual production was markedly different between years in number of P1. This value establishes the potential productivity of an orchard in the absence of WCSB attack and/or severe drought,. The peak observed in 2018 and the subsequent decrease in strobili during the two following years was present in both rootstocks. Then, the observed decrease could be a consequence of the physiological impact of the total fruit load, as has been reported during recent decades by several authors for P. pinea [29,30,31]. In fact, the amount of reproductive load seemed to show its potential productive ceiling in the last three years in both species (Figure 1). Neither of the mast seeding patterns of the species [19] seemed to be influenced by the rootstocks (Figure 3).
The intra-annual behaviour showed a high heterogeneity between trees in reaching a productive stability in the orchard. Both rootstocks had a similar response to achieve a regular yearly production, waiting for 10 years in PH and 9 years in PP (Table 2). It is known that P. pinea requires up to 42 months to produce a harvestable yield, and during this long period biotic and abiotic factors can affect the final production [1,25]. Despite this, in both rootstocks it was found that all the trees produced ripe cones, an outstanding point which differentiates the grafted plantations from the natural stands. Calama et al. [32] described that in the natural stands a high percentage of trees do not produce any cones, as was observed in a large P. pinea stand network over 14 years, where they found that over 54% of the trees in a given year did not have ripe cones.

4.2. Quality of the Harvest

4.2.1. Cone Production

The fresh weight of individual cones was similar in both rootstocks, indicating that the heteroblastic graft did not affect the final product. Furthermore, several heteroblastic grafts of Pinus species have been proved to even have a positive effect [5,33], although in our study those advantages were not evident. However, differences between years in the weight of the cones (with the same behaviour between rootstocks) were observed. However, even if differences in climatic factors existed along years [25] or the canopy size increased [34,35], in this study the growth of cone size varied only according to the change from juvenile to adult phase. However, if only the last three years are considered, which could be the beginning of the adult phase, the smaller PH canopy size did not cause small cone size (Table 1). Moreover, if only the productivity of cones/ m2 of canopy projection (Figure 2) was considered, the results are in line with those obtained by Shestakova et al. [28] in an old forest stone pine, where they concluded there was no positive trade-off between production and growth.
No differences between rootstocks on Sef and Yef were observed. Indeed, Sef and Yef can be highly affected by biotic and abiotic factors, as described by Bracalini et al. [36] and Loewe et al. [25]. Both rootstocks showed a similar behaviour against the WCSB attack (data not shown).

4.2.2. Pine Nut Composition

During recent decades, the chemical composition of the pine nut has been analysed in several experiments to evaluate the differences within Mediterranean populations [37], planting sites in the Iberian Peninsula [38], or even in different continents [13]. In such studies, significant changes in chemical composition were not observed. Accordingly, in this assay there were no differences between rootstocks in the chemicals contained, although some significant differences in the unsaturated fatty acid composition were detected. Oleic acid (the main monounsaturated acid) was more present in trees on PP rootstocks, while linoleic acid (the main polyunsaturated acid) was higher in those on PH. This finding highlights the influence of the rootstock on chemical nut composition, as pine nuts from P. halepensis have lower oleic and higher linoleic content than the pine nuts from P. pinea [6,39]. Results indicate that the content of Omega 6 acids was higher in the kernels from PH rootstock, which is a highly appreciated fatty acid in healthy diets.

4.3. New Stone Pine Orchards

It has been widely proved that precocious production is achieved with grafting [10,20,29], and it has also been observed that some wild stone pines are more productive than others [40]. As a result, some outstanding clones were selected for their high production in Spain [41] and used in new orchards. Both results shed some light on the semi-domestication of the species to establish pine nut plantations. However, the long reproductive period required by this species [25] hinders the possibility to achieve a stable annual production in orchards. Not only biotic and abiotic damages affect cone development, also an apparent productive top after the juvenile phase has been observed, suggesting that a balance might be established between cones of different ages in the same tree (Figure 1). If this factor is considered, a major homogeneity in annual production would probably be achieved, which could be interesting in an agronomic context. Cone thinning in spring could be studied in the next few years to favour the equilibrium between the different age cones in the tree, and could help to reduce the effect of the mast seeding characteristic of P. pinea.
The use of the most suitable rootstock depending on soil conditions of the area should be considered as a good agronomic measure, but also the use of the rootstock will determine the planting distance, being greater for P. pinea than for P. halepensis. In fact, 11 years after planting the trees, the PP rootstock had a canopy projection (4.5 m) which exceeded the planting row distance (3 m). This caused premature aging of the lower parts of the tree, and male flowering was favoured in relation to female strobili, as the orchard needs high lightening to progress. In the case of PH rootstocks, the trees did not completely cover the soil, allowing the vegetative canopy to grow under good light conditions. The results show that the distance between rows was not enough for PP, leading to a systematic thinning in 2021, where one tree per each two will be removed to solve the scarcity of light that reaches the canopy.
When considering the installation of a new P. pinea orchard, especially if there are no natural stands nearby, the age of emergence of the male cones is of great importance. The trees in our trial showed pollen at 7 years old. This breaks the taboo of not planting P. pinea in areas where there are none, since pollen takes longer to appear than the female cones. In our trial, the P1 production started to be important after seven years, with an average of 18 strobili in PP and 8 in PH.

5. Conclusions

The graft of stone pines, either in Pinus halepensis and Pinus pinea rootstocks, allowed the harvest of cones five years after planting. In this study, the main difference detected was the vigour, PP rootstocks being more vigorous than PH rootstocks. Therefore, the biggest canopies produced more cones. However, when productivity data (cones/canopy surface) were considered, PH rootstocks were similar or even higher in some cases than PP. These data suggest that planting distance for both rootstocks should not be the same and should be decided according to the canopy size. In this context, a multisite assay with different rootstocks would shed some light on the influence of soil characteristics on the growth pattern.
Under the edaphic and climatic conditions of this experiment, the average annual production extrapolated per ha during the last three years was 6.000 kg versus about 3.000 kg for PP and PH, respectively. It is only a crude comparison from 28 trees, but the results are certainly relevant. Even in the most unfavourable case, grafted stone pine plantations become an alternative to be considered for many rainfed areas. However, the heterogeneity in the number of harvestable cones at the tree level in the same year was the most relevant problem from the agronomic point of view. A greater rootstock homogeneity, based on seedling selection, would help to mitigate this problem.
This work is a new contribution along the way to achieving a greater domestication of stone pine as a nut tree by applying horticultural management techniques. The sum of different expertise may soon bring Pinus pinea closer to agricultural production status.

Author Contributions

N.A. conceived and designed the experimental plot, supervised the project and reviewed the final draft. A.T. collected the samples and the data from the field and created the data base. M.G. carried out the data curation and data analyses, provided the results and wrote the original draft. R.S.-B. reviewed the draft. All authors commented on the results and the manuscript. All authors have read and agreed to the published version of the manuscript.

Funding

This research was funded by the Regional Ministry of Agriculture from Catalonia, which permitted the management and data collection, while the MASPINENUT project of the Spanish Ministry of Science Innovation and Universities (PID2019-107483GB-100) helped to carry out the data analyses.

Acknowledgments

This work was possible thanks to the transfer of the grafted P. pinea material by Forestal Catalana SA in 2009.

Conflicts of Interest

The authors declare no conflict of interest. The funders had no role in the design of the study, in the collection, analyses, or interpretation of data, in the writing of the manuscript, or in the decision to publish the results.

References

  1. Mutke, S.; Calama, R.; González-Martínez, S.; Montero, G.; Gordo, F.J.; Bono, D.; Gil, L. Mediterranean Stone Pine: Botany and Horticulture. In Horticultural Reviews; Janick, J., Ed.; John Wiley & Sons Inc.: Hoboken, NJ, USA, 2012; Volume 39, pp. 153–201. [Google Scholar]
  2. Vendramin, G.G.; Fady, B.; González-Martínez, S.C.; Hu, F.S.; Scotti, I.; Sebastiani, F.; Soto, Á.; Petit, R.J. Genetically Depauperate but Widespread: The Case of an Emblematic Mediterranean Pine. Evolution 2008, 62, 680–688. [Google Scholar] [CrossRef]
  3. Mutke, S.; Vendramin, G.G.; Fady, B.; Bagnoli, F.; González-Martínez, S.C. Molecular and Quantitative Genetics of Stone Pine (Pinus pinea). In Genetic Diversity in Horticultural Plants; Springer: Cham, Switzerland, 2019; Volume 22. [Google Scholar]
  4. Mutke, S.; Gordo, J.; Chambel, M.R.; Prada, M.A.; Álvarez, D.; Iglesias, S.; Gil, L. Phenotypic plasticity is tronger than adaptative differentitation among Mediterranean stone pine provenances. For. Syst. 2010, 19, 354–366. [Google Scholar]
  5. Loewe-Muñoz, V.; Del Río, R.; Delard, C.; Balzarini, M. Enhancing Pinus pinea cone production by grafting in a non-native habitat. New For. 2021. [Google Scholar] [CrossRef]
  6. Evaristo, I.; Batista, D.; Correia, I.; Correia, P.; Costa, R. Chemical profiling of Portuguese Pinus pinea L. nuts and comparative analysis with Pinus koraiensis Sieb. & Zucc. comercial kernels. Options Mediterr. Mediterr. Stone Pine Agrofor. 2013, 105, 99–104. [Google Scholar]
  7. Nutfruit. Pine Nuts-Statistical Review. Nutfruit Magazine, March 2021; p. 1.
  8. Calama, R.; Gordo, J.; Mutke, S.; Conde, M.; Madrigal, G.; Garriga, E.; Arias, M.J.; Piqué, M.; Gandía, R.; Montero, G.; et al. Decline in commercial pine nut and kernel yield in Mediterranean stone pine (Pinus pinea L.) in Spain. iForest-Biogeosciences For. 2020, 13, 251–260. [Google Scholar] [CrossRef]
  9. Pimpão, M.; Valdiviesso, T.; Trindade, C.S.; Naves, P.; Sousa, E. Leptoglossus occidentalis damages on stone pine female reproductive structures. Options Mediterr. Mediterr. Stone Pine Agrofor. 2017, 122, 5. [Google Scholar]
  10. De la Mata, R.; Teixidó, A.; Aletà, N.; Torrell, A.; Ros, L.; Segarra, M. La producció de pinyons en plantacions empeltades. In XXXVI Jornades Tècniques Silvícoles Emili Garolera; Consorci Forestal de Catalunya: Girona, Spain, 2019; p. 86. [Google Scholar]
  11. Farinha, A.O.; Carvalho, C.; Correia, A.C.; Branco, M. Impact assessment of Leptoglossus occidentalis in Pinus pinea: Integrating population density and seed loss. For. Ecol. Manag. 2021, 496, 119422. [Google Scholar] [CrossRef]
  12. INC. Global statistical review. Crop progress report. Pine nuts. Nutfruit Magazine, March 2021; p. 4. [Google Scholar]
  13. Loewe-Muñoz, V.; Noel, D. Mediterranean Pinus pinea L. nuts from Southern Hemisphere provenances. Rend. Lincei Sci. Fis. Nat. 2021, 32, 181–189. [Google Scholar] [CrossRef]
  14. Gordo, F.J.; Calama, R.; Rojo, L.I.; Madrigal, G.; Álvarez, D.; Mutke, S.; Montero, G.; Finat, L. Experiencias de clareos en masas de Pinus pinea L. en la Mesta Norte. In Proceedings of the 5º Congreso Forestal Español, Ávila, Spain, 21–25 September 2009. [Google Scholar]
  15. Montero, G.; Calama, R.; Ruiz-Peinado, R. Selvicultura de Pinus pinea. In Compendio de Selvicultura Aplicada en España; Montero, G., Reque, J., Eds.; INIA-FUCOVASA: Serrada, Spain, 2008. [Google Scholar]
  16. Loewe, V.; Delard, C. Un Nuevo Cultivo Para Chile. El Pino Piñonero (Pinus pinea L.); Instituto Forestal-Chile: Santiago, Chile, 2012. [Google Scholar]
  17. Bono, D.; Aletà, N. Cone yield evaluation of a grafted Pinus pinea L. trial. Options Mediterr. A Mediterr. Stone Pine Agrofor. 2013, 105, 35–41. [Google Scholar]
  18. Guadaño, C.; Mutke, S. Establecimiento de Plantaciones Clonales de Pinus Pinea Para la Produccción de Piñón Mediterráneo; INIA: Madrid, Spain, 2016; Volume 28. [Google Scholar]
  19. Mutke, S.; Iglesias, S.; Gil, L. Selección de clones de pino piñonero sobresalientes en la producción de piña. Investig. Agrar. Sist. Recur. For. 2007, 16, 13. [Google Scholar]
  20. Catalán Bachiller, G. Plantaciones de Pinus pinea en zonas calizas para producción precoz de piñón. Ecología 1990, 4, 105–120. [Google Scholar]
  21. Gordo, F.J.; Mutke, S.; Gil, L. La relevancia de la especie de patrón portainjerto para el desarrollo de la copa y la producción de piña del pino piñonero injertado. In Proceedings of the 6º Congreso Forestal Español, Vitoria-Gasteiz, Spain, 10–14 June 2013. [Google Scholar]
  22. Piqué, M.; Coello, J.; Ammari, Y.; Aletà, N.; Sghaier, T.; Mutke, S. Grafted stone pine plantations for cone production: Trials on Pinus pinea and Pinus halepensis rootstocks from Tunisia and Spain. Options Mediterr. Ser. A Mediterr. Semin. 2017, 122, 17–23. [Google Scholar]
  23. García del Barrio, J.M.; de Miguel, J.; Alía, R.; Iglesias, S. Regiones de Identificación y Utilización del Material Forestal de Reproducción; Ministerio de Medio Ambiente: Madrid, Spain, 2001.
  24. Schneider, C.A.; Rasband, W.S.; Eliceiri, K.W. NIH Image to ImageJ: 25 years of image analysis. Nat. Methods 2012, 9, 671–675. [Google Scholar] [CrossRef] [PubMed]
  25. Loewe-Muñoz, V.; Balzarini, M.; Álvarez-Contreras, A.; Delard-Rodríguez, C.; Navarro-Cerrillo, R.M. Fruit productivity of Stone pine (Pinus pinea L.) along a climatic gradient in Chile. Agric. For. Meteorol. 2016, 223, 203–216. [Google Scholar] [CrossRef]
  26. Del Rio, M.; Montero, G.; Calama, R. Selvicultura de Pinus halepensis. In Compendio de Selvicultura Aplicada en España; Montero, G., Reque, J., Eds.; INIA-FUCOVASA: Serrada, Spain, 2008. [Google Scholar]
  27. Cuesta, B.; Vega, J.; Villar-Salvador, P.; Rey-Benayas, J.M. Root growth dynamics of Aleppo pine (Pinus halepensis Mill.) seedlings in relation to shoot elongation, plant size and tissue nitrogen concentration. Trees 2010, 24, 899–908. [Google Scholar] [CrossRef]
  28. Shestakova, T.A.; Mutke, S.; Gordo, J.; Camarero, J.J.; Sin, E.; Pemán, J.; Voltas, J. Weather as main driver for masting and stem growth variation in stone pine supports compatible timber and nut co-production. Agric. For. Meteorol. 2021, 298-299. [Google Scholar] [CrossRef]
  29. Mutke, S.; Gordo, J.; Climent, J.; Gil, L. Shoot growth and phenology modelling of grafted stone pine (Pinus pinea L.) in Inner Spain. Ann. For. Sci. 2003, 60, 527–537. [Google Scholar] [CrossRef] [Green Version]
  30. Calama, R.; Mutke, S.; Tomé, J.; Gordo, J.; Montero, G.; Tomé, M. Modelling spatial and temporal variability in a zero-inflated variable: The case of stone pine (Pinus pinea L.) cone production. Ecol. Model. 2011, 222, 606–618. [Google Scholar] [CrossRef]
  31. Loewe-Muñoz, V.; Balzarini, M.; Delard, C.; Del Río, R.; Álvarez, A. Inter-annual variability of Pinus pinea L. cone productivity in a non-native habitat. New For. 2020, 51, 1055–1068. [Google Scholar] [CrossRef]
  32. Calama, R.; Mutke, S.; Pardos, M.; Morales, L.; Gordo, F.J.; Montero, G.; Finat, L. La producción de piña y piñón de Pinus pinea L. en la Meseta Norte. In La regeneración Natural de los Pinares en los Arenales de la Meseta Castellana; Gordo, F.J., Calama, R., Pardos, M., Bravo, F., Montero, G., Eds.; Instituto Universitario de Investigación en Gestión Forestal Sostenible (Universidad de Valladolid-INIA): Valladolid, Spain, 2012; p. 254. [Google Scholar]
  33. Climent, J.; Prada, M.A.; Gil, L.; Pardos, M. Increase of flowering in Pinus nigra Arn subsp salzamannii (Dunal) Franco by means of heteroplastic grafts. Ann. For. Sci. 1997, 54, 145–153. [Google Scholar] [CrossRef] [Green Version]
  34. Afonso, A.; Gonçalves, A.C.; Pereira, D.G. Pinus pinea (L.) nut and kernel productivity in relation to cone, tree and stand characteristics. Agrofor. Syst. 2020, 94, 2065–2079. [Google Scholar] [CrossRef]
  35. Mutke, S.; Gordo, J.; Gil, L. Variability of Mediterranean Stone pine cone production: Yield loss as response to climate change. Agric. For. Meteorol. 2005, 132, 263–272. [Google Scholar] [CrossRef]
  36. Bracalini, M.; Benedettelli, S.; Croci, F.; Terreni, P.; Tiberi, R.; Panzavolta, T. Cone and Seed Pests of Pinus pinea: Assessment and Characterization of Damage. J. Econ. Entomol. 2013, 106, 229–234. [Google Scholar] [CrossRef] [PubMed]
  37. Nasri, N.; Khaldi, A.; Fady, B.; Triki, S. Fatty acids from seeds of Pinus pinea L.: Composition and population profiling. Phytochemistry 2005, 66, 1729–1735. [Google Scholar] [CrossRef] [PubMed]
  38. González, M.; Loewe, V.; Delard, C. El piñón de Pinus pinea producido en Chile: Características nutricionales y organolépticas. Vitae 2012, 19, S317–S319. [Google Scholar]
  39. Tukan, S.K.; Al-Ismail, K.; Ajo, R.Y.; Al-Dabbas, M.M. Seeds and seed oil compositions of Aleppo Pine (Pinus halepensis Mill.) grown in Jordan. Riv. Ital. Sostanze Grasse 2013, 90, 87–93. [Google Scholar]
  40. Piqué, M. Modelos de Producción Para las Masas de Pinus pinea L. en Catalunya; Universitat de Lleida: Lleida, Spain, 2003. [Google Scholar]
  41. Mutke, S.; Guadaño, C.; Iglesias, S.; León, D.; Arribas, S.; Gordo, F.J.; Gil, L.; Montero, G. Mediterranean pine nuts from forests and plantations. Selection and identification of Spanish elite clones for Mediterranean pine nut as orchard crop. Options Mediterr. 2017, 122, 71–75. [Google Scholar]
Figure 1. Average of the number of cones per tree (sum of P1, P2 and P3)—columns—and average of the canopy projection (m2)—dotted line—from 2013 to 2020. (A) P. halepensis rootstock (PH); (B) P. pinea rootstock (PP).
Agriculture 11 01034 g001
Figure 2. Average and standard error of the number of cones (P1, P2 and P3) divided by the m2 of canopy separated by year and by rootstock. Dotted lines are the PP individuals and solid lines are the PH individuals. (A) Number of P1 divided by m2 of canopy projection, (B) number of P2 divided by the m2 of canopy projection, and (C) number of P3 divided by the m2 of canopy projection.
Agriculture 11 01034 g002
Figure 3. Accumulated kg of ripe cones for each tree of the assay, during the period of 2014 to 2020 (6 years). The trees are ordered from most to least productive. (A) Corresponds to PH rootstock; (B) corresponds to PP rootstock.
Agriculture 11 01034 g003
Table 1. Average and standard error of number of strobili (P1), 2nd year cones (P2), and mature cones (P3); individual fresh weight of cones (FW-C), weight of edible pine nut by cone (W-EPN), fresh weight production by tree (FW-P), seed efficiency (Sef: number of EPN per cone/total number of PN per cone), and yield efficiency (Yef: EPN weight per cone/FW-C) Data are exposed separately by rootstocks, P. halepensis (PH) and P. pinea (PP), and year (2014 to 2020).
Tree Age (Year)RootstockTotal Number Per TreeWeight Per Tree (g)Weight Per Cone (g)Ratios
P1P2P3FW-PW-EPNFW-CSefYef
5 (2014)PP5.1 ± 2.93.9 ± 21.4 ± 0.8577 ± 245107 ± 59.6377 ± 70.182 ± 14.717.6 ± 3.9
PH3.5 ± 0.93.0 ± 1.01.7 ± 0.3790 ± 138135 ± 31.8423 ± 22.776.6 ± 4.715.2 ± 1.5
6 (2015)PP7.6 ± 2.74.6 ± 2.33.3 ± 2.41343 ± 849272 ± 165350 ± 10292.7 ± 7.520.5 ± 2.4 A
PH7.9 ± 1.92.9 ± 0.62.9 ± 0.91209 ± 223217.5 ± 48.9277 ± 20.987.1 ± 2.916.8 ± 1 B
7 (2016)PP18.4 ± 7 A4.1 ± 43.6 ± 2.61728 ± 1128286 ± 209 A435 ± 77.485.5 ± 8.816.1 ± 2.1
PH7.9 ± 1.8 B2.5 ± 0.92.1 ± 0.61020 ± 181120.1 ± 31.6 B375 ± 22.271 ± 3.711.4 ± 1
8 (2017) 1PP28 ± 12.1 A12.4 ± 4.8A1.9 ± 2.2 A1311 ± 984224 ± 199 A415 ± 11189 ± 6.915.2 ± 3.3
PH13.4 ± 1.9 B4.5 ± 1.0 B0.3 ± 0.2 B500 ± 97.266.9 ± 13.7 B346 ± 26.484.5 ± 1.813.3 ± 0.8
9 (2018)PP46.1 ± 17.6 A25.2 ± 6.4 A12.3 ± 6.2 A5077 ± 25171024 ± 566 A428 ± 67.493.1 ± 7.219.4 ± 2.6 A
PH20.4 ± 2.9 B13.5 ± 1.2 B4.5 ± 1.7 B2861 ± 884337 ± 103 B465 ± 28.380.2 ± 7.814.6 ± 1.4 B
10 (2019) 2PP19.8 ± 5.4 A40.3 ± 11.6 A24.6 ± 12.9 A9384 ± 4264 A1377 ± 489 A426 ± 59.174.9 ± 11.315.2 ± 2.3
PH11.1 ± 1.3 B18.7 ± 2.3 B12.4 ± 2 B4041 ± 717 B354.1 ± 42 B418 ± 21.7
11 (2020)PP18.1 ± 7.4 A12.2 ± 5.2 A39.7 ± 12 A19840 ± 7015 A3669 ± 1335 A505 ± 84.689.2 ± 8.518.5 ± 2.1
PH11.8 ± 1.7 B8.6 ± 1.7 A18.4 ± 2.4 B8292. 8 ± 956 B1531 ± 186 B532. ± 39.592.92 ± 0.918.4 ± 0.6
Year × Rootstock********
Different letters per year mean significant differences between values (p < 0.05). Significance (*) p < 0.05. 1 Low values in harvest due the WCSB attack. 2 Low values in Sef and Yef due to incorrect storage affecting the production.
Table 2. Evolution of strobili to conelets and ripe cones. Heterogeneity in the production of the grafted trees evaluated in P. halepensis (PH) or in P. pinea (PP).
Cohort ofRootstockRatios (%)Age of TreesRipe Cones Production
P1/P2P2/P3YearsMin to Max Number/TreeNon-Productive Trees (%)
2013PP84.683.640–314.3
PH68.895.2 0–421.4
2014PP91.578.450–37.1
PH81.672.5 0–47.1
2015PP53.247.360–714.3
PH31.511.4 0–935.8
2016PP67.798.870–117.1
PH57.2100 0–728.6
2017PP90.097.780–635.7
PH10091.0 0–278.6
2018PP87.4498.592–240
PH91.298.0 0–2421.4
2019PP61.7 1012–550
PH77.5 4–290
2020PP 1114–580
PH 6–310
Year of cohort corresponds to the year when strobili appeared. P1: number of strobili; P2: number of 2nd year conelets; P3: number of ripe cones. The number of trees per rootstocks was 14.
Table 3. Chemical composition of pine nuts from grafted stone pine onto P. pinea (PP) and P. halepensis (PH). Mean ± standard error and results of statistical analysis (p < 0.05).
Percentage of:PHPPSignificance
Protein36.1 ± 0.3736.3 ± 0.37ns
Total Sugars2.63 ± 0.112.43 ± 0.11ns
Crude Fibre4.30 ± 0.144.47 ± 0.14ns
Starch1.67 ± 0.051.73 ± 0.05ns
Fat44.33 ± 0.3344.2 ± 0.33ns
Saturated fatty acids10.6 ± 0.1110.4 ± 0.11ns
Palmitic (C16:0)6.0 ± 0.045.9 ± 0.04ns
Stearic (C18:03.4 ± 0.063.2 ± 0.06ns
Arachidic (C20:0)0.59 ± 00.54 ± 0*
Monounsaturated fatty acids41.3 ± 0.4343.4 ± 0.43*
Palmitoleic (C16:1)0.23 ± 0.010.23 ± 0.01ns
Oleic (C18:2 n-9)38.3 ± 0.4240.2 ± 0.42*
Gadoleic (C20:1 n = 11)0.70 ± 0.010.77 ± 0.01*
Polyunsaturated fatty acids47.9 ± 0.446.1 ± 0.4*
Linoleic (C18:2 n = 6)47.2 ± 0.445.3 ± 0.4*
Linolenic (C18:3)0.97 ± 0.020.97 ± 0.02ns
* means significant differences between PP and PH (p < 0.05) in each parameter.
Publisher’s Note: MDPI stays neutral with regard to jurisdictional claims in published maps and institutional affiliations.

