Article

Effects of Fertilisation Using Organic Waste Products with Mineral Complementation on Sugarcane Yields and Soil Properties in a 4 Year Field Experiment

by
Frédéric Feder
1,2
1
CIRAD, UPR Recyclage et Risque, F-34398 Montpellier, France
2
Recyclage et Risque, Univ Montpellier, CIRAD, F-34090 Montpellier, France
Agriculture 2021, 11(10), 985; https://doi.org/10.3390/agriculture11100985
Submission received: 17 August 2021 / Revised: 5 October 2021 / Accepted: 6 October 2021 / Published: 9 October 2021
(This article belongs to the Special Issue Fertilizer Use, Soil Health and Agricultural Sustainability)

Abstract

:
Sugarcane cultivation is suitable for the exploitation of organic waste products. However, minimum complementary mineral input is necessary for optimal fertilisation. Control mineral fertilisation treatments with mulch (MCM) or without mulch (MC) were compared with two organic waste treatments, a pig slurry with mulch (PSM) and without mulch (PS), and a sugarcane vinasse with mulch (SVM) and without mulch (SV) on a Nitisol in French Reunion Island. The sugarcane yields obtained with the different treatments differed each year. However, no trend was observed and no significant and recurrent effect of the presence of mulch or of the different treatments was identified over the course of the 4 year experiment. Soil pHw and pH KCl measured in the different treatments increased from year 3 in with the treatments including organic waste products (PS, PSM, SV and SVM) but remained constant with the treatments including only mineral fertilisation (MC and MCM). With the exception of PS and PSM, which were significantly higher in year 4, soil organic carbon content was not modified by the treatments. Soil cation exchange capacity increased only slightly with the PS and PSM treatments from year 3 on. The differences in yields and soil properties can be explained by the nature of the organic waste products, the accumulation of nutrients after several applications, and the specific characteristics of the sugarcane crop. The improvement in soil properties from the third year on was not reflected in the yield of sugarcane because it was too weak, and the crop explores a much larger volume of soil.

1. Introduction

For thousands of years, the use of organic waste products in agriculture mainly aimed at providing nutrients to crops, in addition to transforming and recycling these resources. From the 19th century onwards, industrially produced mineral fertilisers gradually replaced organic waste products, sometimes completely, resulting in undeniable increases in crop yields in all agronomic conditions. However, the need to recycle organic waste products has continued to increase along with the quantities of waste produced; urbanisation is intensifying, and these waste products are accumulating increasingly farther from agricultural land [1]. In recent decades, the search for a means to optimise the recycling of organic waste products has intensified due to the rising costs of producing fertiliser and the need to limit resource wastage [2]. Knowledge of long-term ecosystem benefits, e.g., improvement of physical, chemical, and biological soil properties, and of the negative impacts of the production and use of fertilisers on global climate change [3,4] is renewing interest in recycling organic waste products. In some island contexts, such as in French Reunion Island, geographical, demographic, and environmental constraints combined with societal concerns, call for the urgent development and/or optimisation of soil ecosystem services and the recycling of such products.
The use of organic waste products is constraining in many ways [5]. Each type of organic waste usually shows some variability in its chemical composition, water content, and physical properties. These wastes exist in liquid form (slurry, digestate from methanisation, vinasse, etc.), or in solid form with different water content (manure and litter, green waste, sewage sludge, etc.). They can be transformed (methanisation, composting) and mixed. Their chemical characteristics, for example, their nitrogen, phosphorus and potassium concentrations, do not necessarily correspond to crop needs [6]. Finally, unlike chemical fertilisers, their availability may fluctuate over time and depends on the production system, and, their storage at their production site and application are specific and linked to their characteristics [1]. All these factors mean information is difficult to extrapolate and limit optimisation of their use. Finally, bad agronomic practices, even unintentional, are widespread and likely introduce the risk of polluting soil and water resources [7]. Optimal fertilisation of crops with organic waste products is therefore a major challenge. It is necessary to account for the type of soil, and for the presence of mulch on the soil surface, because, depending on the soil characteristics, a mulch provides some mineral elements to the crops and interacts with the organic waste products, thereby facilitating or inhibiting their mineralisation [8]. Each crop has specific mineral element requirements, linked to its physiological development, the length of its cycle, the establishment of its root system, etc. The organic waste products applied to the soil have direct effects i.e., the immediate supply of easily assimilable forms of nitrogen, phosphorus, and potassium [9]. However, nitrogen can be immobilised in the soil for a variable period of time; some elements are not immediately available for crops because they are in organic forms in organic waste products, and the mineralisation rate differs with each type of product [10]. Finally, organic waste products interact with possible crop residues (mulch), thereby increasing the exchange and interaction surfaces and favouring their mineralisation. Minimal mineral supplementation is used to partially overcome these constraints and achieve optimal crop fertilisation using organic waste products. However, supplementation depends on the above-mentioned factors and requires adjustments to the specific context.
Sugarcane mulch may be left on the soil after harvest, mainly to protect the soil from erosion, reduce the quantity of weeds, conserve soil moisture, and provide nutrients during its mineralisation [11]. Quantities of sugarcane mulch often reach several tens of tons of dry matter per hectare [8,12], and immediately after harvest, its thickness may reach ten to twenty centimetres [13,14]. Under tropical climatic conditions with high temperatures and with rainfall or irrigation water inputs of 2000–3000 mm·year−1, visual observations showed that sugarcane mulch is almost completely degraded after one year, and this was confirmed by mulch mineralisation studies [8,14]. Thus, the chemical elements released by the mineralisation of this mulch mainly contribute to the current crop cycle [14]. The contribution mainly depends on the amount of mulch. Isotope measurements made under similar soil and climatic conditions showed that 6% of the nitrogen in the mulch contributed to the current year’s crop [12].
The aim of the present study was to evaluate whether mineral fertilisation can be replaced for four consecutive years by organic fertilisation using pig manure supplemented with minimal K or distillery vinasse supplemented with minimal N, with no negative impacts on sugarcane yields or on the main soil characteristics (pH, organic carbon, CEC).

2. Materials and Methods

2.1. Study Site in Reunion Island

Reunion Island is located 800 km east of Madagascar in the southwest Indian Ocean. The main peak of this recently formed volcanic island (Piton des Neiges, 3070 m a.s.l.) emerged three million years ago. The study site at the CIRAD research station is located on the northern slope of Piton des Neiges, 60 m a.s.l. (55°53 E; 20°89 S). Mean annual rainfall at the study site is 2000 mm and mean annual temperature is 25 °C. The soil has been classified as a Nitisol [15], with: (i) a surface A horizon (0–30/40 cm), and (ii) a nitic B horizon (30/40–150 cm). As defined by [16], Nitisols are deep, well-drained, red tropical soils with diffuse horizon boundaries and a subsurface horizon with at least 30% clay. A clayey nitic horizon has a typical moderate to strong angular blocky structure broken into polyhedral elements.

2.2. Field Experiment

The experimental plot was 120 m long and 60 m wide (corresponding to 40 rows of sugarcane spaced 1.5 m apart). It was divided lengthwise into two subplots, each 120 m long and 30 m wide (3600 m2). In one subplot, each year, after sugarcane harvest, the sugarcane mulch was left in place while in the other subplot, it was completely removed with a hay rake. After the first planting, each of the two subplots was divided into 6 identical parcels 20 m in length and 30 m in width (600 m2), giving a total of 12 parcels of identical size (20 m × 30 m). The R579 sugarcane variety was cultivated for four years. Four annual sugarcane crops were grown consecutively (2006–2009). To ensure the first year of cultivation was similar to the three following years, sugarcane mulch was removed from an immediately adjacent plot and redeposited on the six “mulch” parcels. Total crop water requirements are about 2500 mm [17,18]. Drip irrigation was controlled by a solenoid valve to enable volumetric measurement. Drip irrigation was used due to its higher efficiency compared to sprinkler irrigation under high wind conditions in the study area. Two organic waste treatments, a pig slurry with mulch (PSM) and without mulch (PS), and a sugarcane vinasse with mulch (SVM) and without mulch (SV) were compared with control treatments, mineral fertilisation with mulch (MCM) or without mulch (MC). Each treatment was repeated once. The organic wastes were liquid and applied to the soil surface with a slurry tank. The pig slurry came from a small farrow-to-finish swine production farm with a herd of around 10 sows located in the municipality of Sainte-Marie (Reunion Island). The sugarcane vinasse came from the Bois-Rouge sugar factory (Saint-André, Reunion Island). Under Reunion Island conditions, to obtain a yield of 100 Mg·ha1, the N, P, and K requirements for sugar cane cultivation are, respectively, 120, 70 and 200 kg·ha1; these values are similar to those recommended at other locations [19]. Each year, at the beginning of the growing cycle, plots under the organic treatment with synthetic mineral complementation received equivalent N and P nutrients to that provided in the control treatments. Plots under PS and PSM treatments received KCl and plots under SV and SVM treatment received ammonium nitrate. The K content of the SV and SVM treatments is higher due to the K concentrations in the sugarcane vinasse. No correction was made for the presence or absence of mulch. The quantities and characteristics of the organic waste products and mineral fertiliser added are listed in Table 1.

2.3. Sugarcane Yield Analysis

Harvesting was carried out at the same time each year using a commercial mechanical harvester. In each parcel, the yield was measured in three parts, each comprising 5 rows. The yield of sugarcane was measured by weighing the tipper trucks that collected the cane.

2.4. Soil Analysis

Soil analyses were performed on samples collected in situ from the 0–10, 20–30, and 40–60 cm layers (Table 2) before the experiment. In order to properly understand the surface horizon, we took two soil samples: at a depth of 0–10 cm (upper part of the A horizon) and at a depth of 20–30 cm (lower part of the A horizon). In each experimental year, three soil samples were taken from each parcel and analysed separately. To avoid border effects, these three sampling points were located in the three central rows of the sugarcane and at least 5 metres from the borders. The sampling points were shifted one metre each year. At the end of each experimental year, the results for the 0–10 cm layer are presented. The pHw (water) and pH KCl (which measures the exchange acidity) of the soils were measured according to the NF ISO 10390:2005 standard at a ratio of 1:5 soil/water (or KCl solution 1M) volume. Total carbon and total nitrogen in the soil samples were analysed by dry combustion with an element analyser (ThermoQuest NC2100, LECO Corporation, St. Joseph, MI, USA). Soil nitrate (N-NO3) and ammonium (N-NH4) contents were measured by 1 M KCl extraction at a 1:5 soil/water volume ratio (under shaking for 1 h), assayed by continuous flow colorimetry (Alliance Instruments). Exchangeable phosphorus (PO-D) was determined with a continuous flow colorimeter (Proxima, Alliance Instruments Italy) according to the Olsen–Dabin method using the ammonium molybdate spectrometric method (ISO 6878:2004). Cation exchange capacity (CEC) was measured using the ammonium acetate method at pH 7. The anion exchange capacity (AEC) of the original soil was measured on samples collected in the 10–20 cm layer (surface horizon) and 40–60 cm layer (nitic horizon) using the method described in [20]. We used the recommended analytical procedures [16] to measure Al, Si, and Fe elements extracted with dithionite-citrate-bicarbonate (DCB) and oxalate [21]. Extractable Al, Si, and Fe were assayed by inductively coupled plasma-atomic emission spectrometry (ICP-AES, Varian Vista spectrometer equipped with a coupled-charge detector device). The particle-size distribution of all the samples was analysed using the pipette method on an automated analyser (Texsol 24B, ISITEC-LAB, France) according to the standard procedure applied to all soils, i.e., samples were treated with H2O2 to remove organic matter, dispersed with a sodium hexametaphosphate solution, and mechanically shaken [22]. Coarse sand and fine sand fractions were obtained by sieving; clay, fine silt and coarse silt fractions were obtained by pipetting. The mineralogy of this soil was similar in the two horizons. The presence of four iron oxides (magnetite, hematite, maghemite, and goethite), titanium–iron oxides (ilmenite), aluminium oxyhydroxide (gibbsite), and silicates (halloysite, kaolinite, quartz and feldspar) is reported in [7].

2.5. Statistical Analysis

Origin 2018 (version b9.5.0.193, Northampton, MA, USA) software [23] was used for the descriptive statistics and to draw box and whisker plots. For each analytical parameter, the mean and standard deviation of the measurements were calculated. The normality of the residues and homoscedasticity were verified using Shapiro–Wilk’s normality and Bartlett’s tests, respectively. When those conditions were met, we performed a 2-way ANOVA followed by a Tukey pairwise comparison at the 95% confidence level, to assess significant differences of treatments and mulch over the whole study period.

3. Results

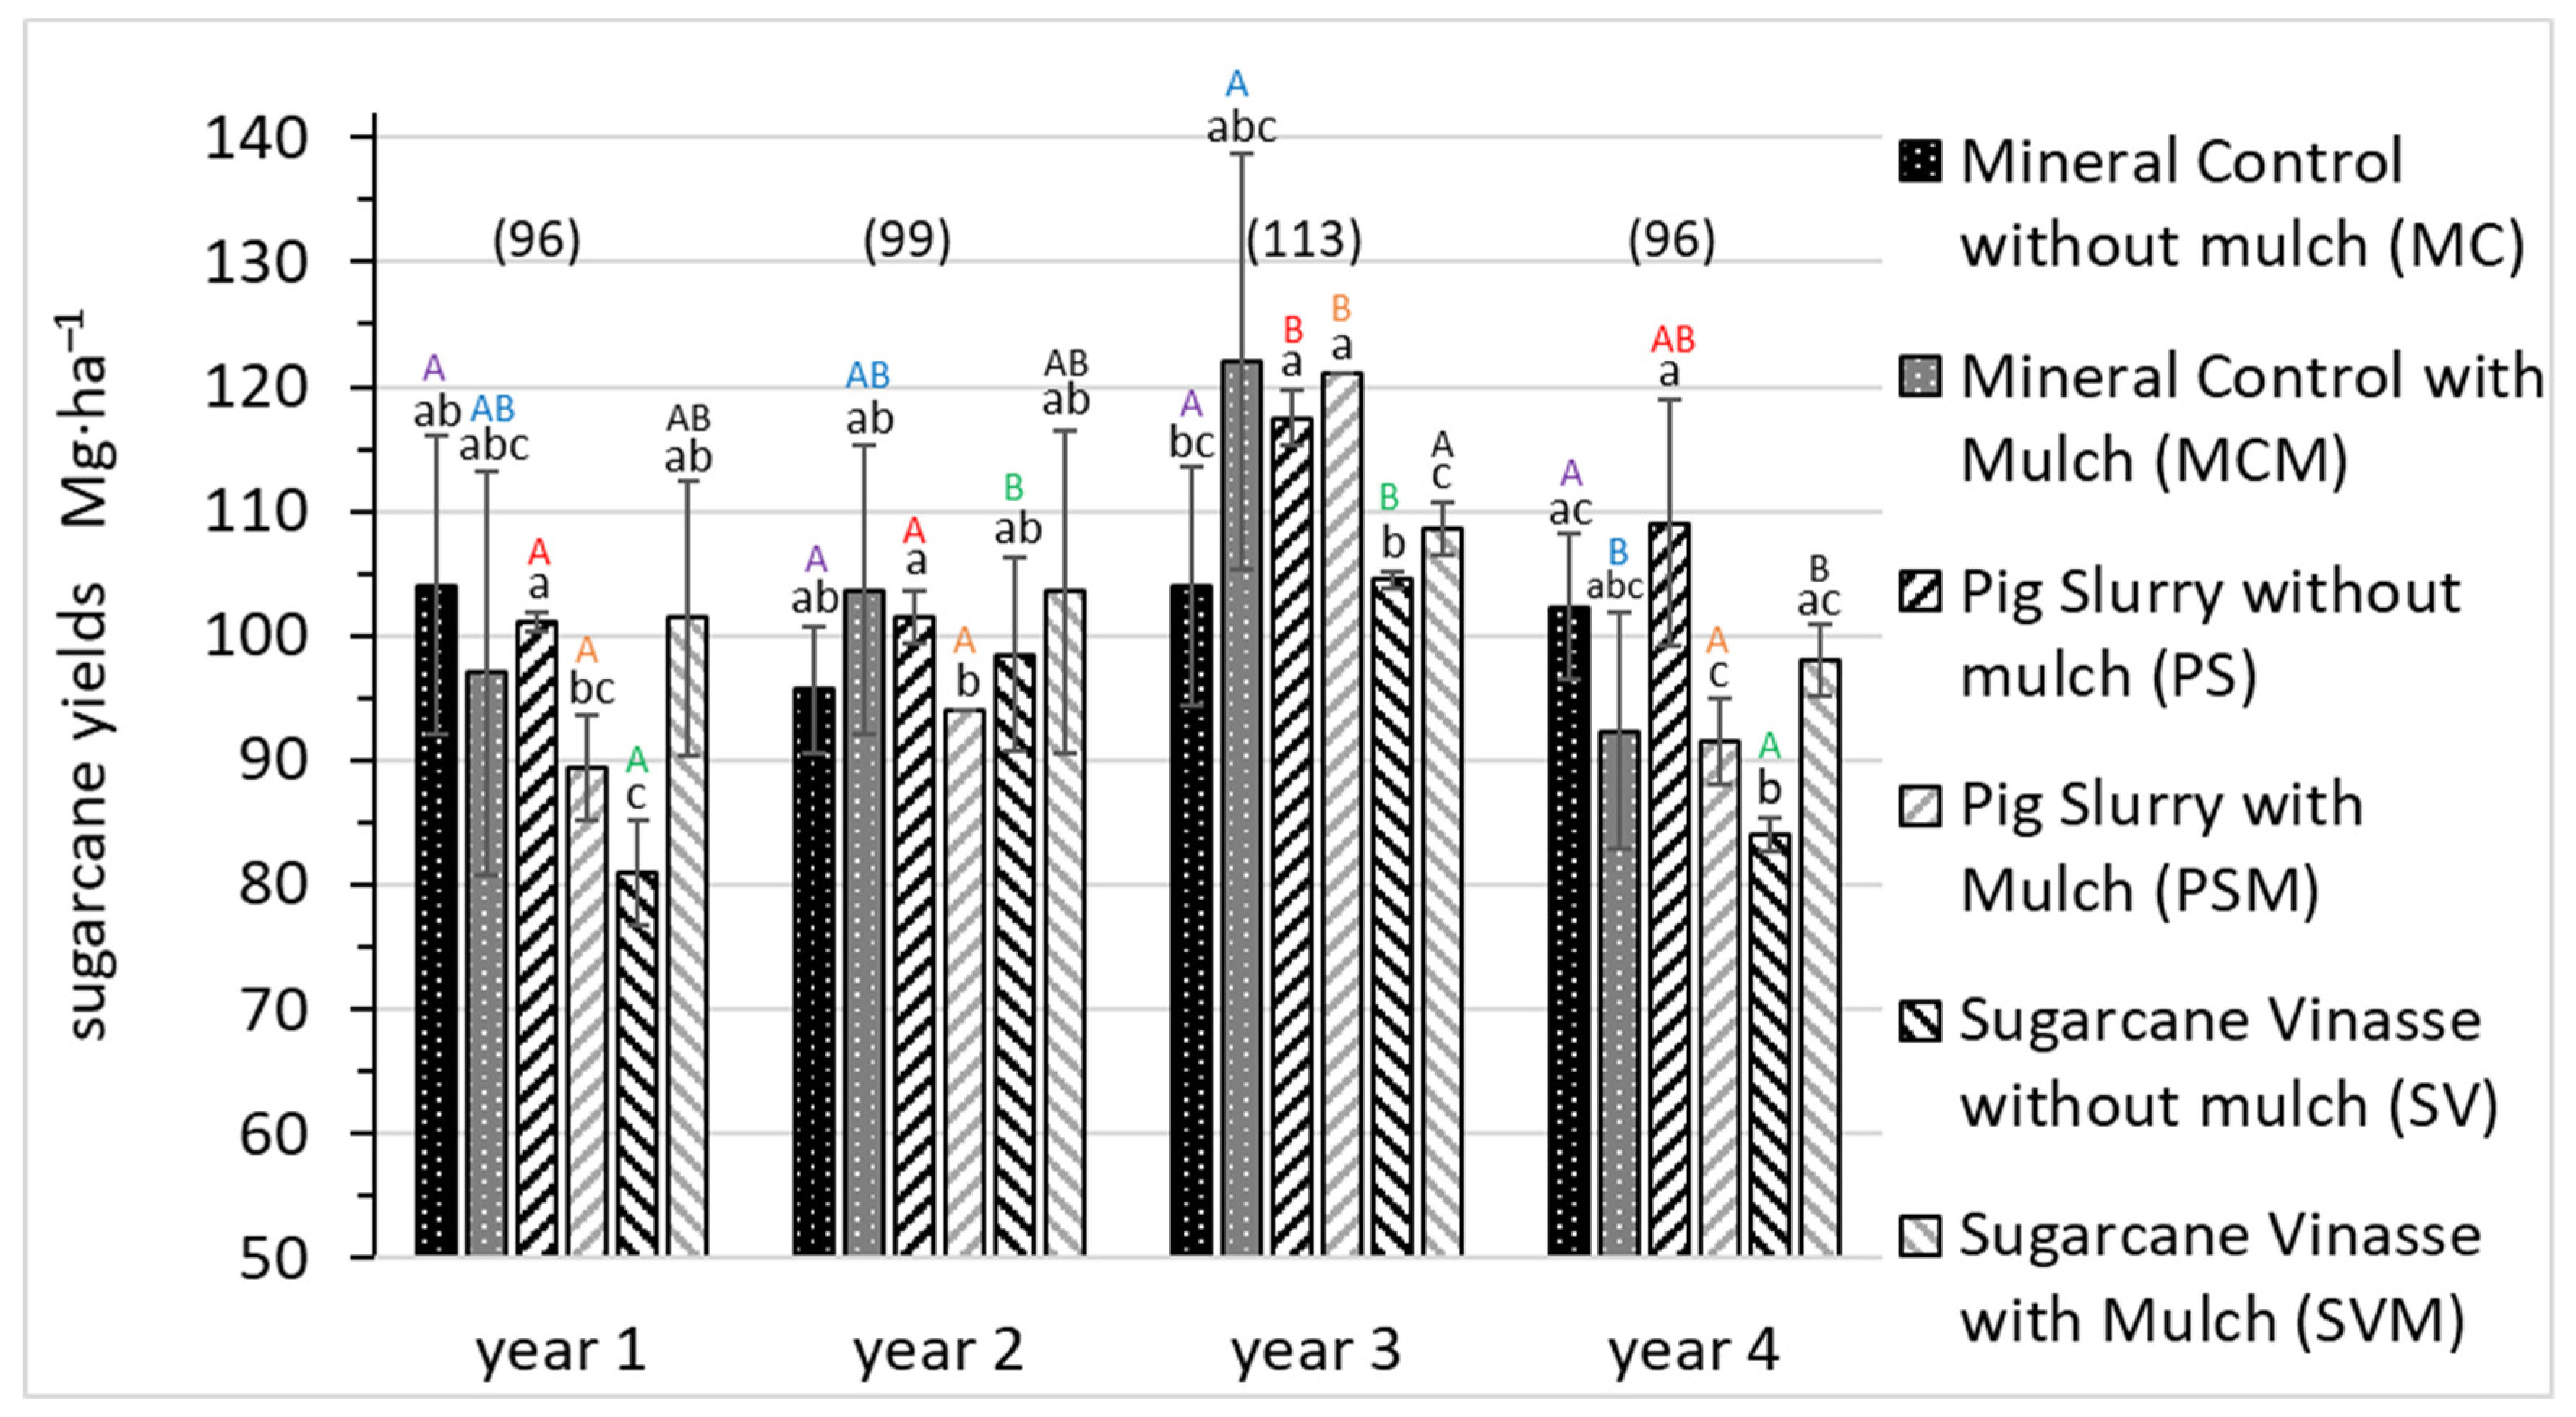
3.1. Sugarcane Yields

The sugarcane yields measured under the different treatments differed each year (Figure 1). In year 1, the yields of the MC and MCM treatments did not differ significantly from the yields of the other treatments, PS, PSM, and SVM. Only the SV treatment produced significantly lower yields than the SVM and PS treatments. In year 2, only the PSM treatment produced statistically significantly lower yields than the PS treatment. In year 3, the PS and PSM treatments produced statistically higher yields than MC, SV, and SVM. In year 4, the PS and PSM treatments produced statistically higher yields than the SV treatment, and the SVM treatment produced statistically higher yields than the SV treatment. However, the sugarcane yields measured under the different treatments differed between years: the sugarcane yields measured under the MC treatments were statistically identical in all four years; the sugarcane yields measured under the MCM treatments were statistically identical in the first three years, whereas in year 4, the yield produced by the MCM treatment was lower than in year 3. The yields produced by the PS and PSM treatments were identical except in year 3 when they were significantly higher. The yields produced by the SV treatment were identical in years 1 and 4 but were significantly higher in years 2 and 3. Under the SVM treatment, the yields were statistically significantly higher in year 3 than in year 4.
Sugarcane yields under the different treatments were affected differently by the presence or absence of mulch (Figure 1). Sugarcane yields measured under the MC and MCM treatments did not differ significantly in the four years with or without mulch. The yields produced by the PS treatment were significantly higher than those produced by the PSM in years 1, 2, and 4 and similar in year 3. The yields produced by the SVM treatment were significantly higher than those produced by the SV treatment in years 1, 3, and 4 and similar in year 2.

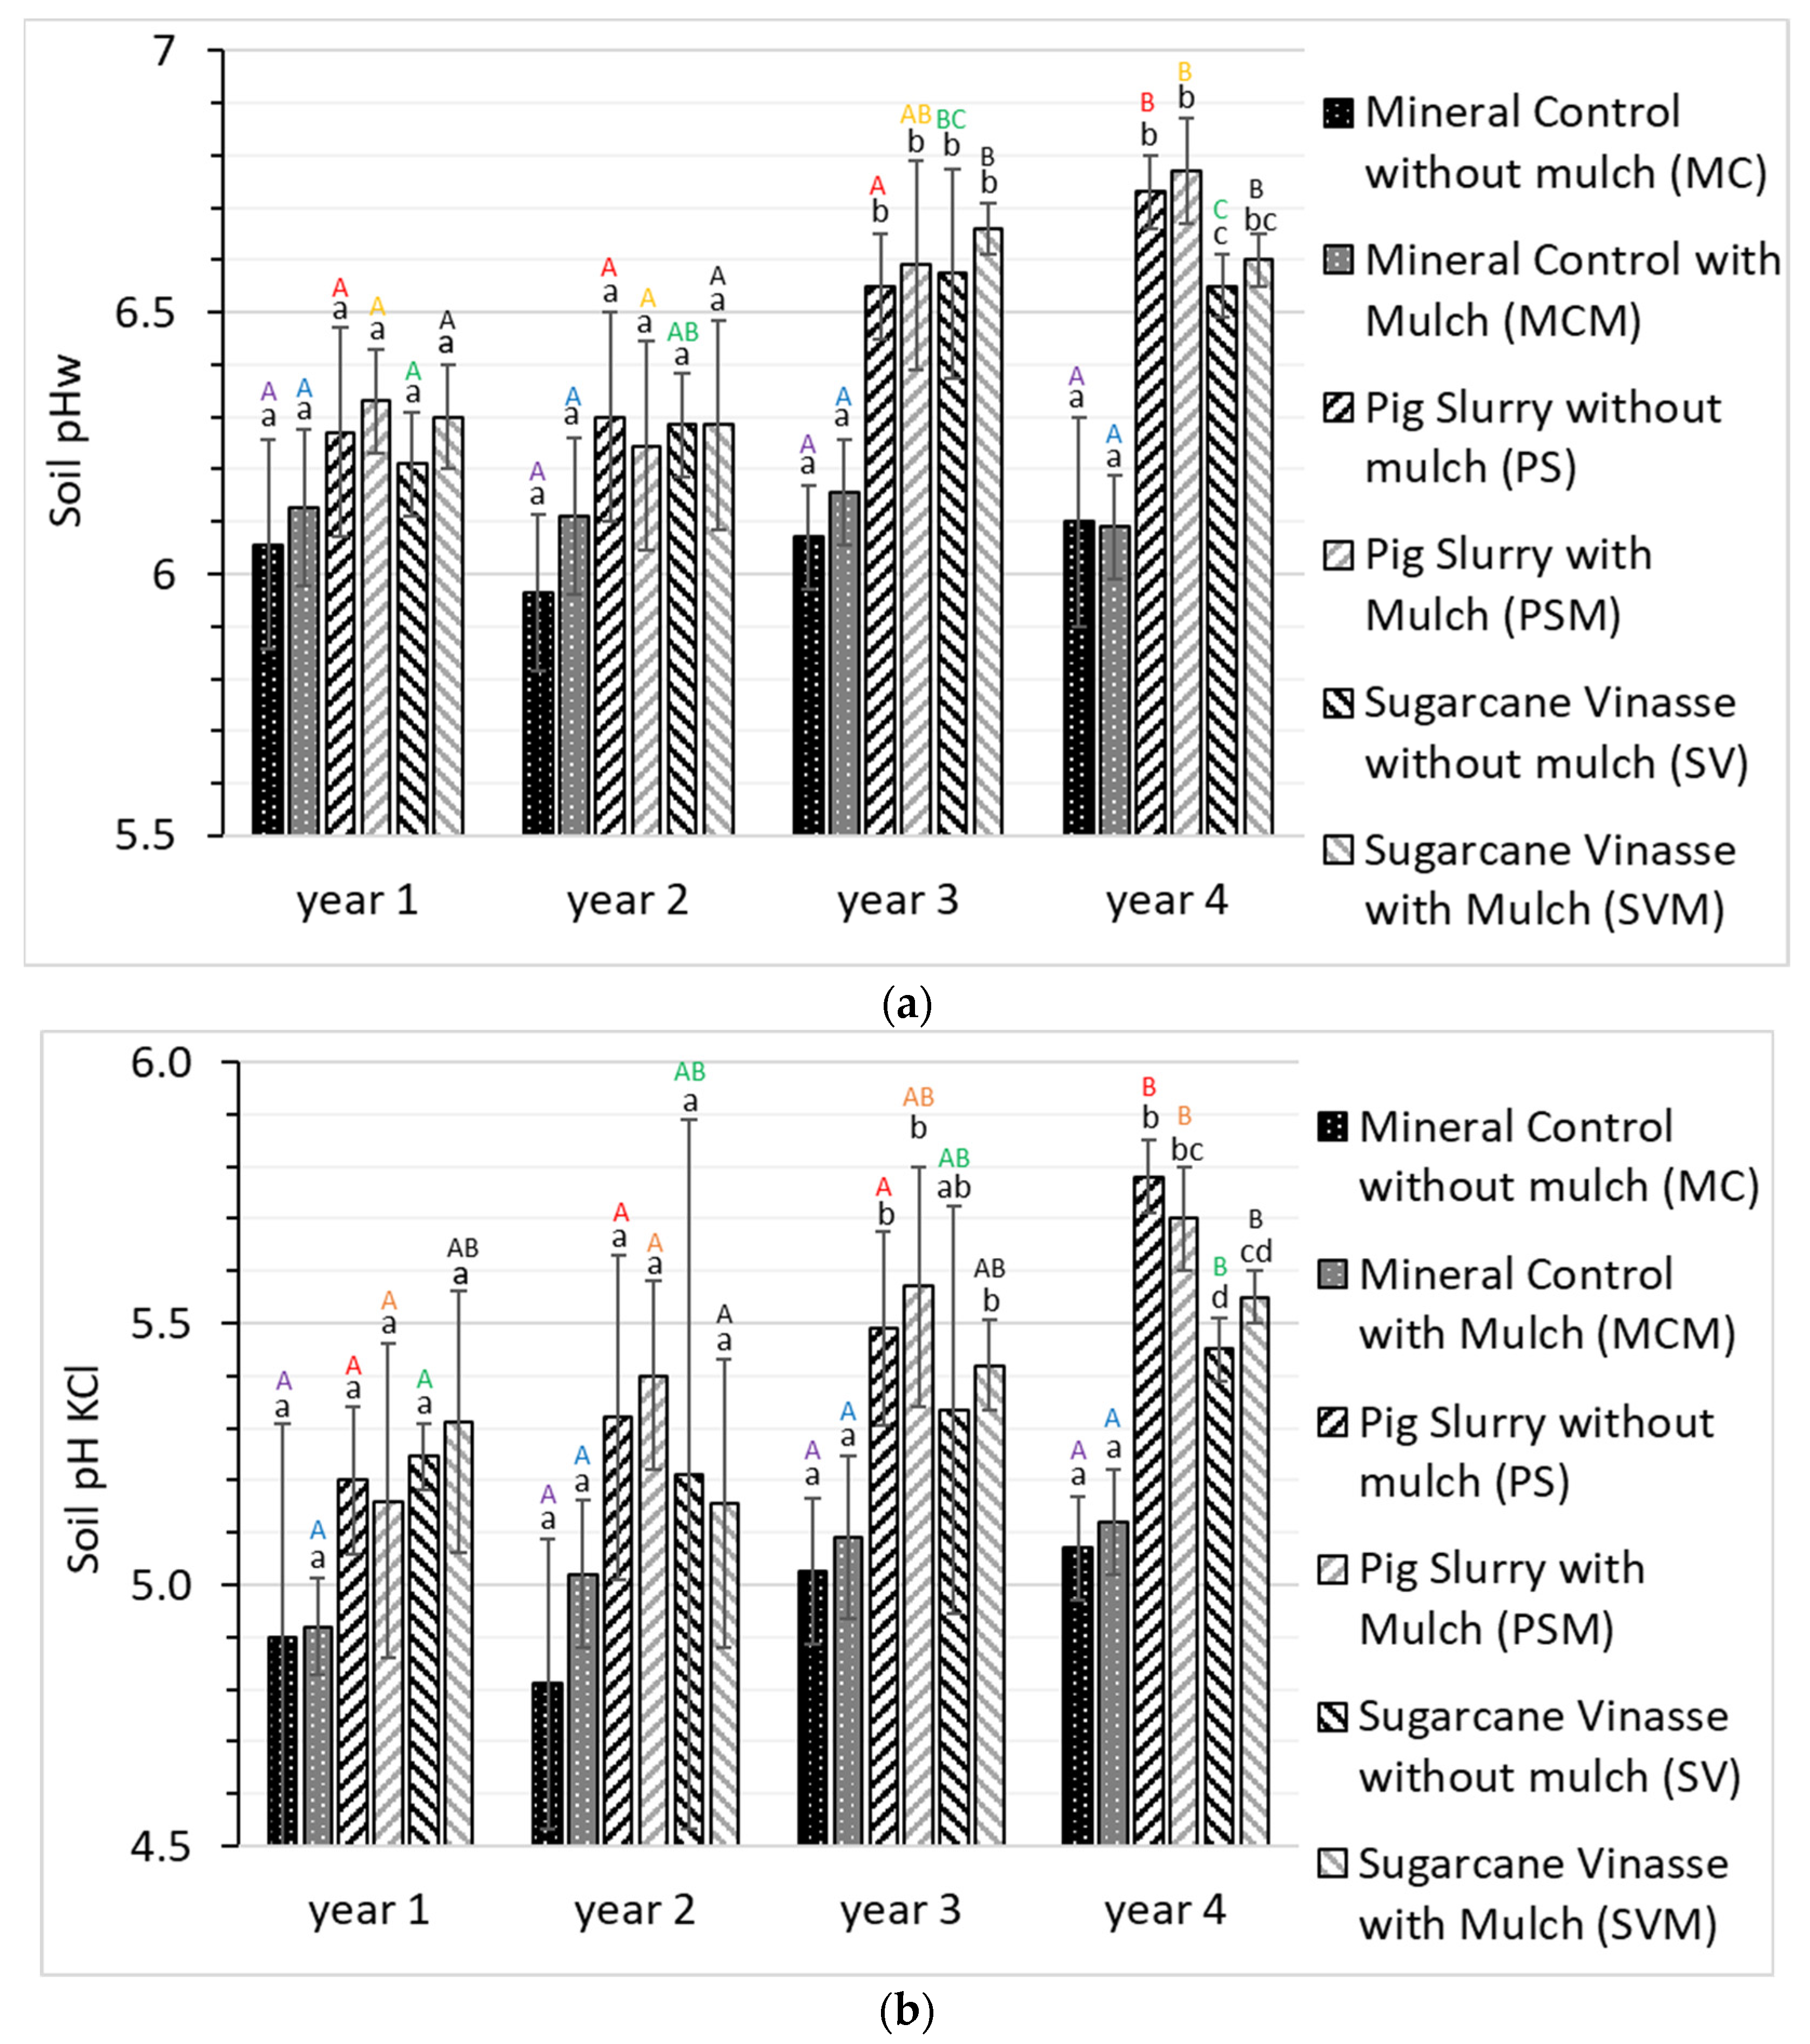
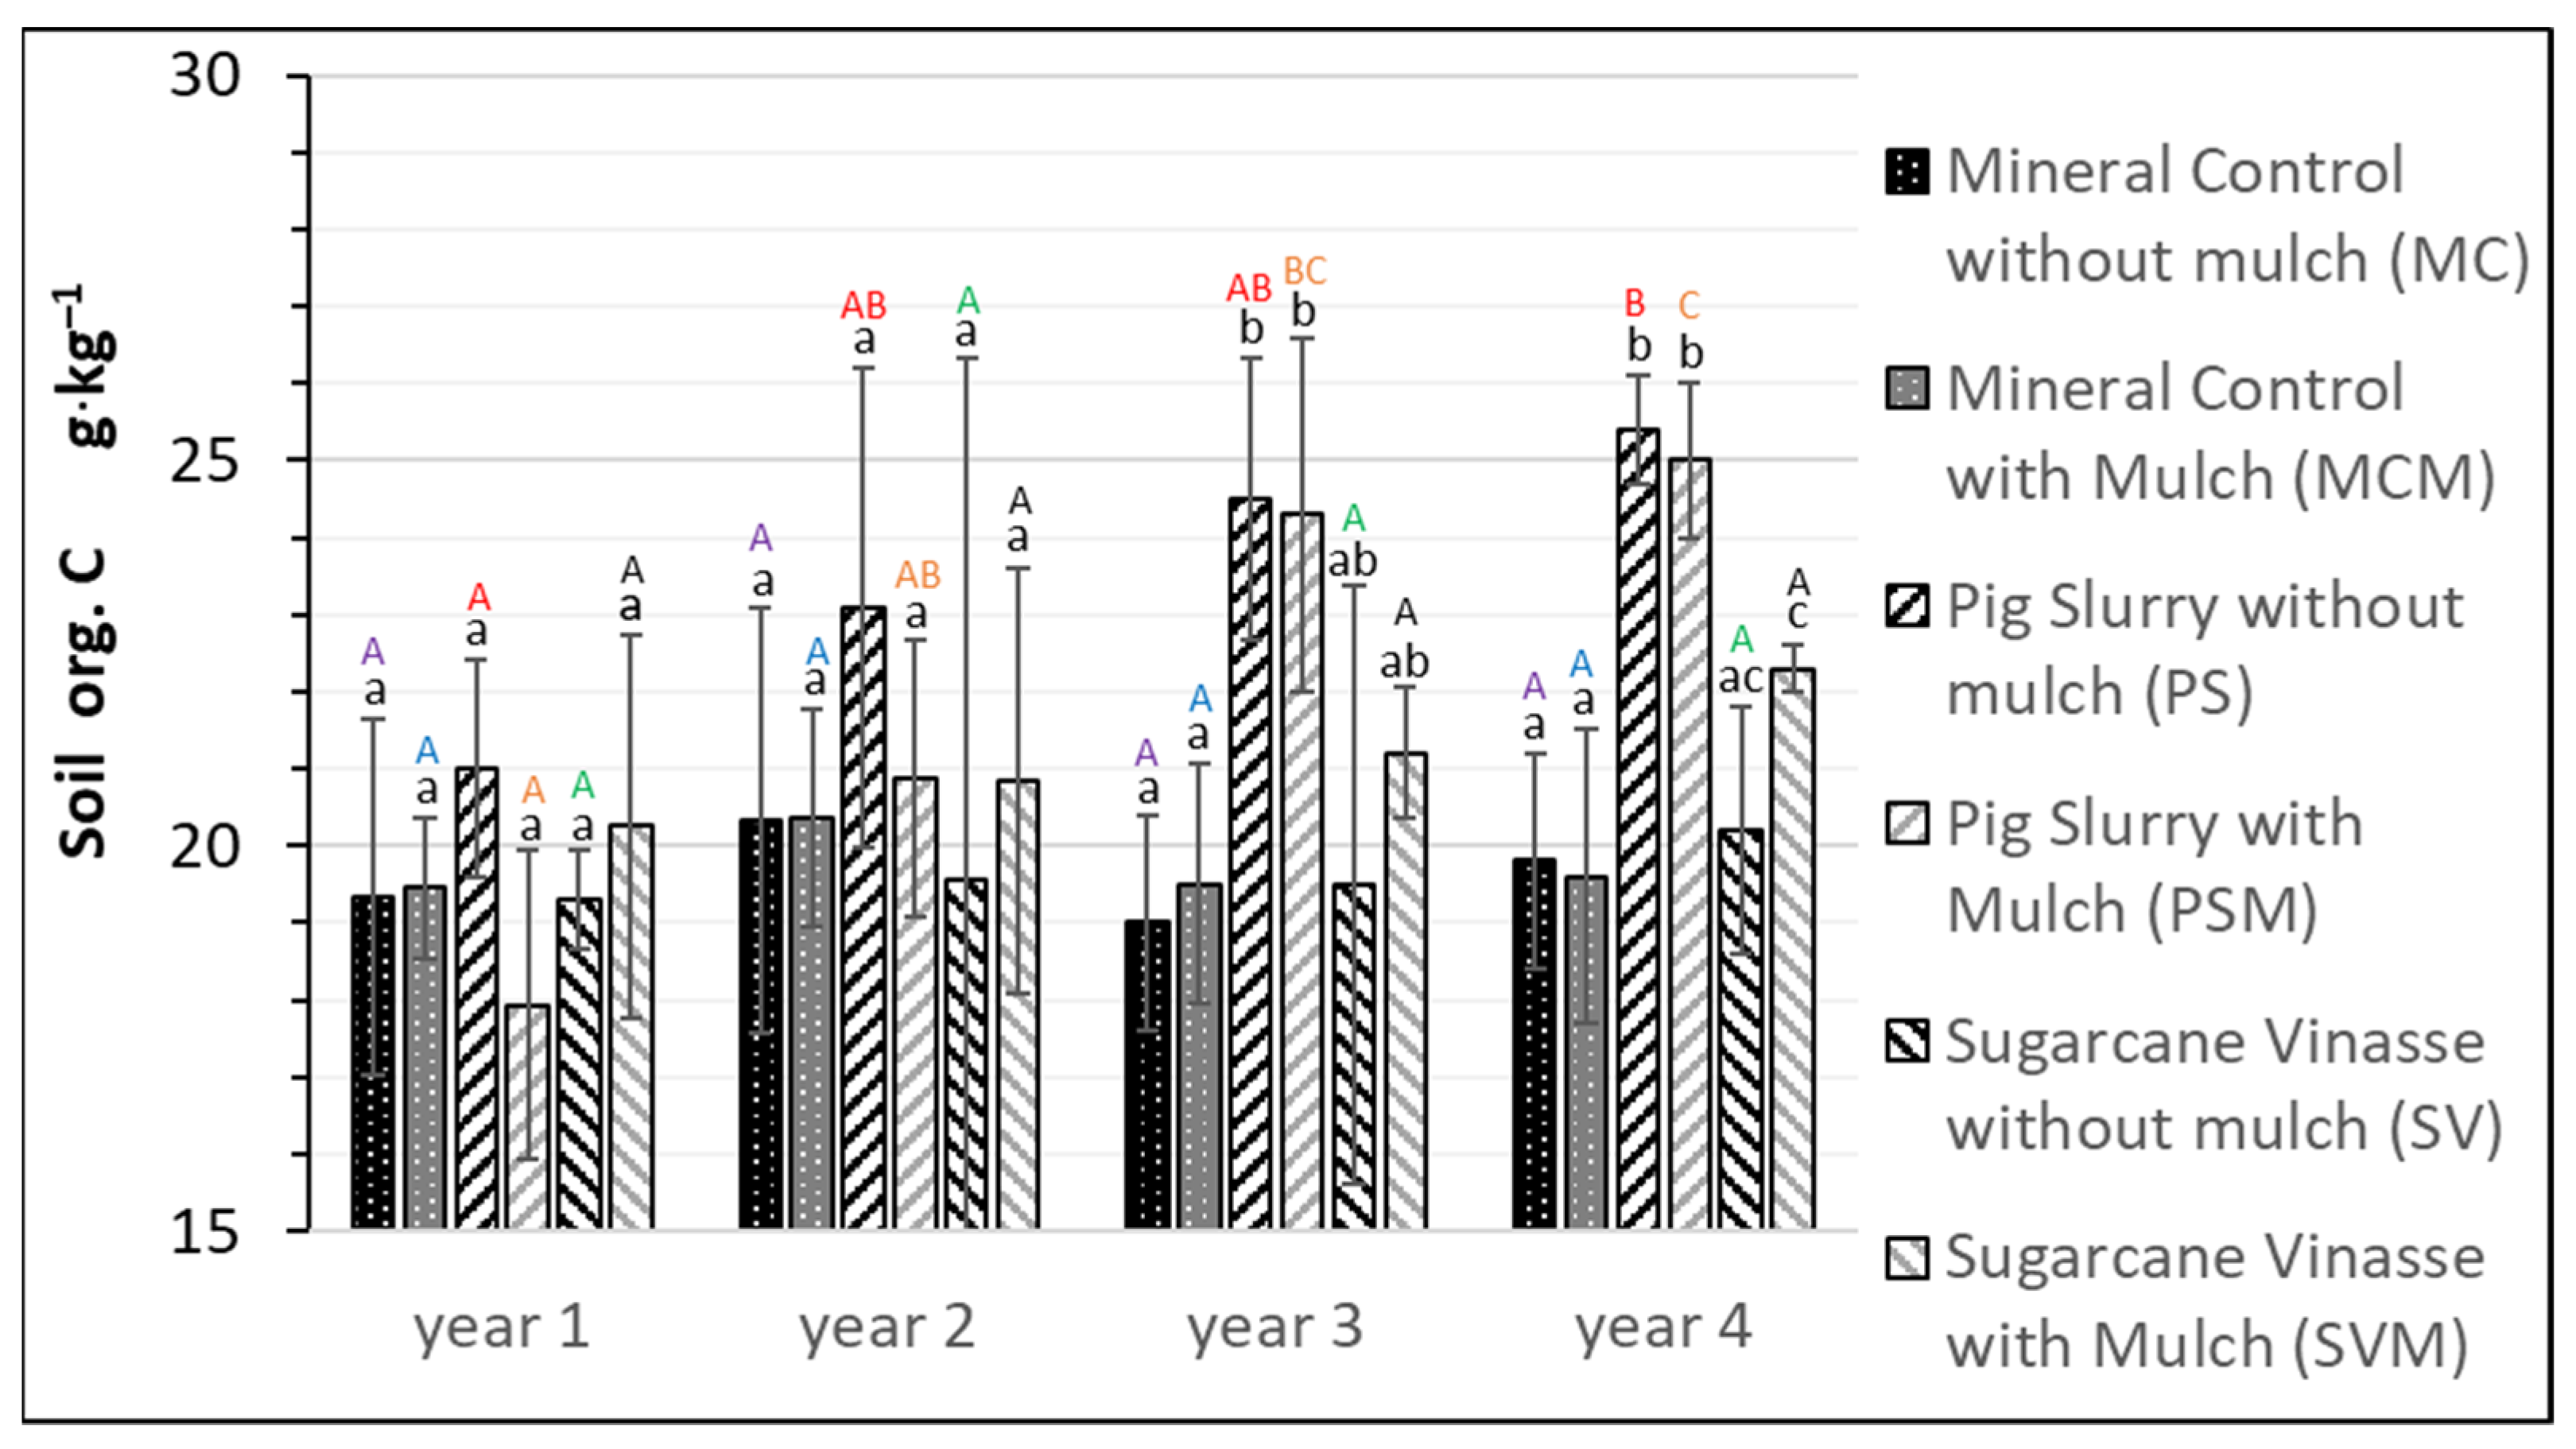
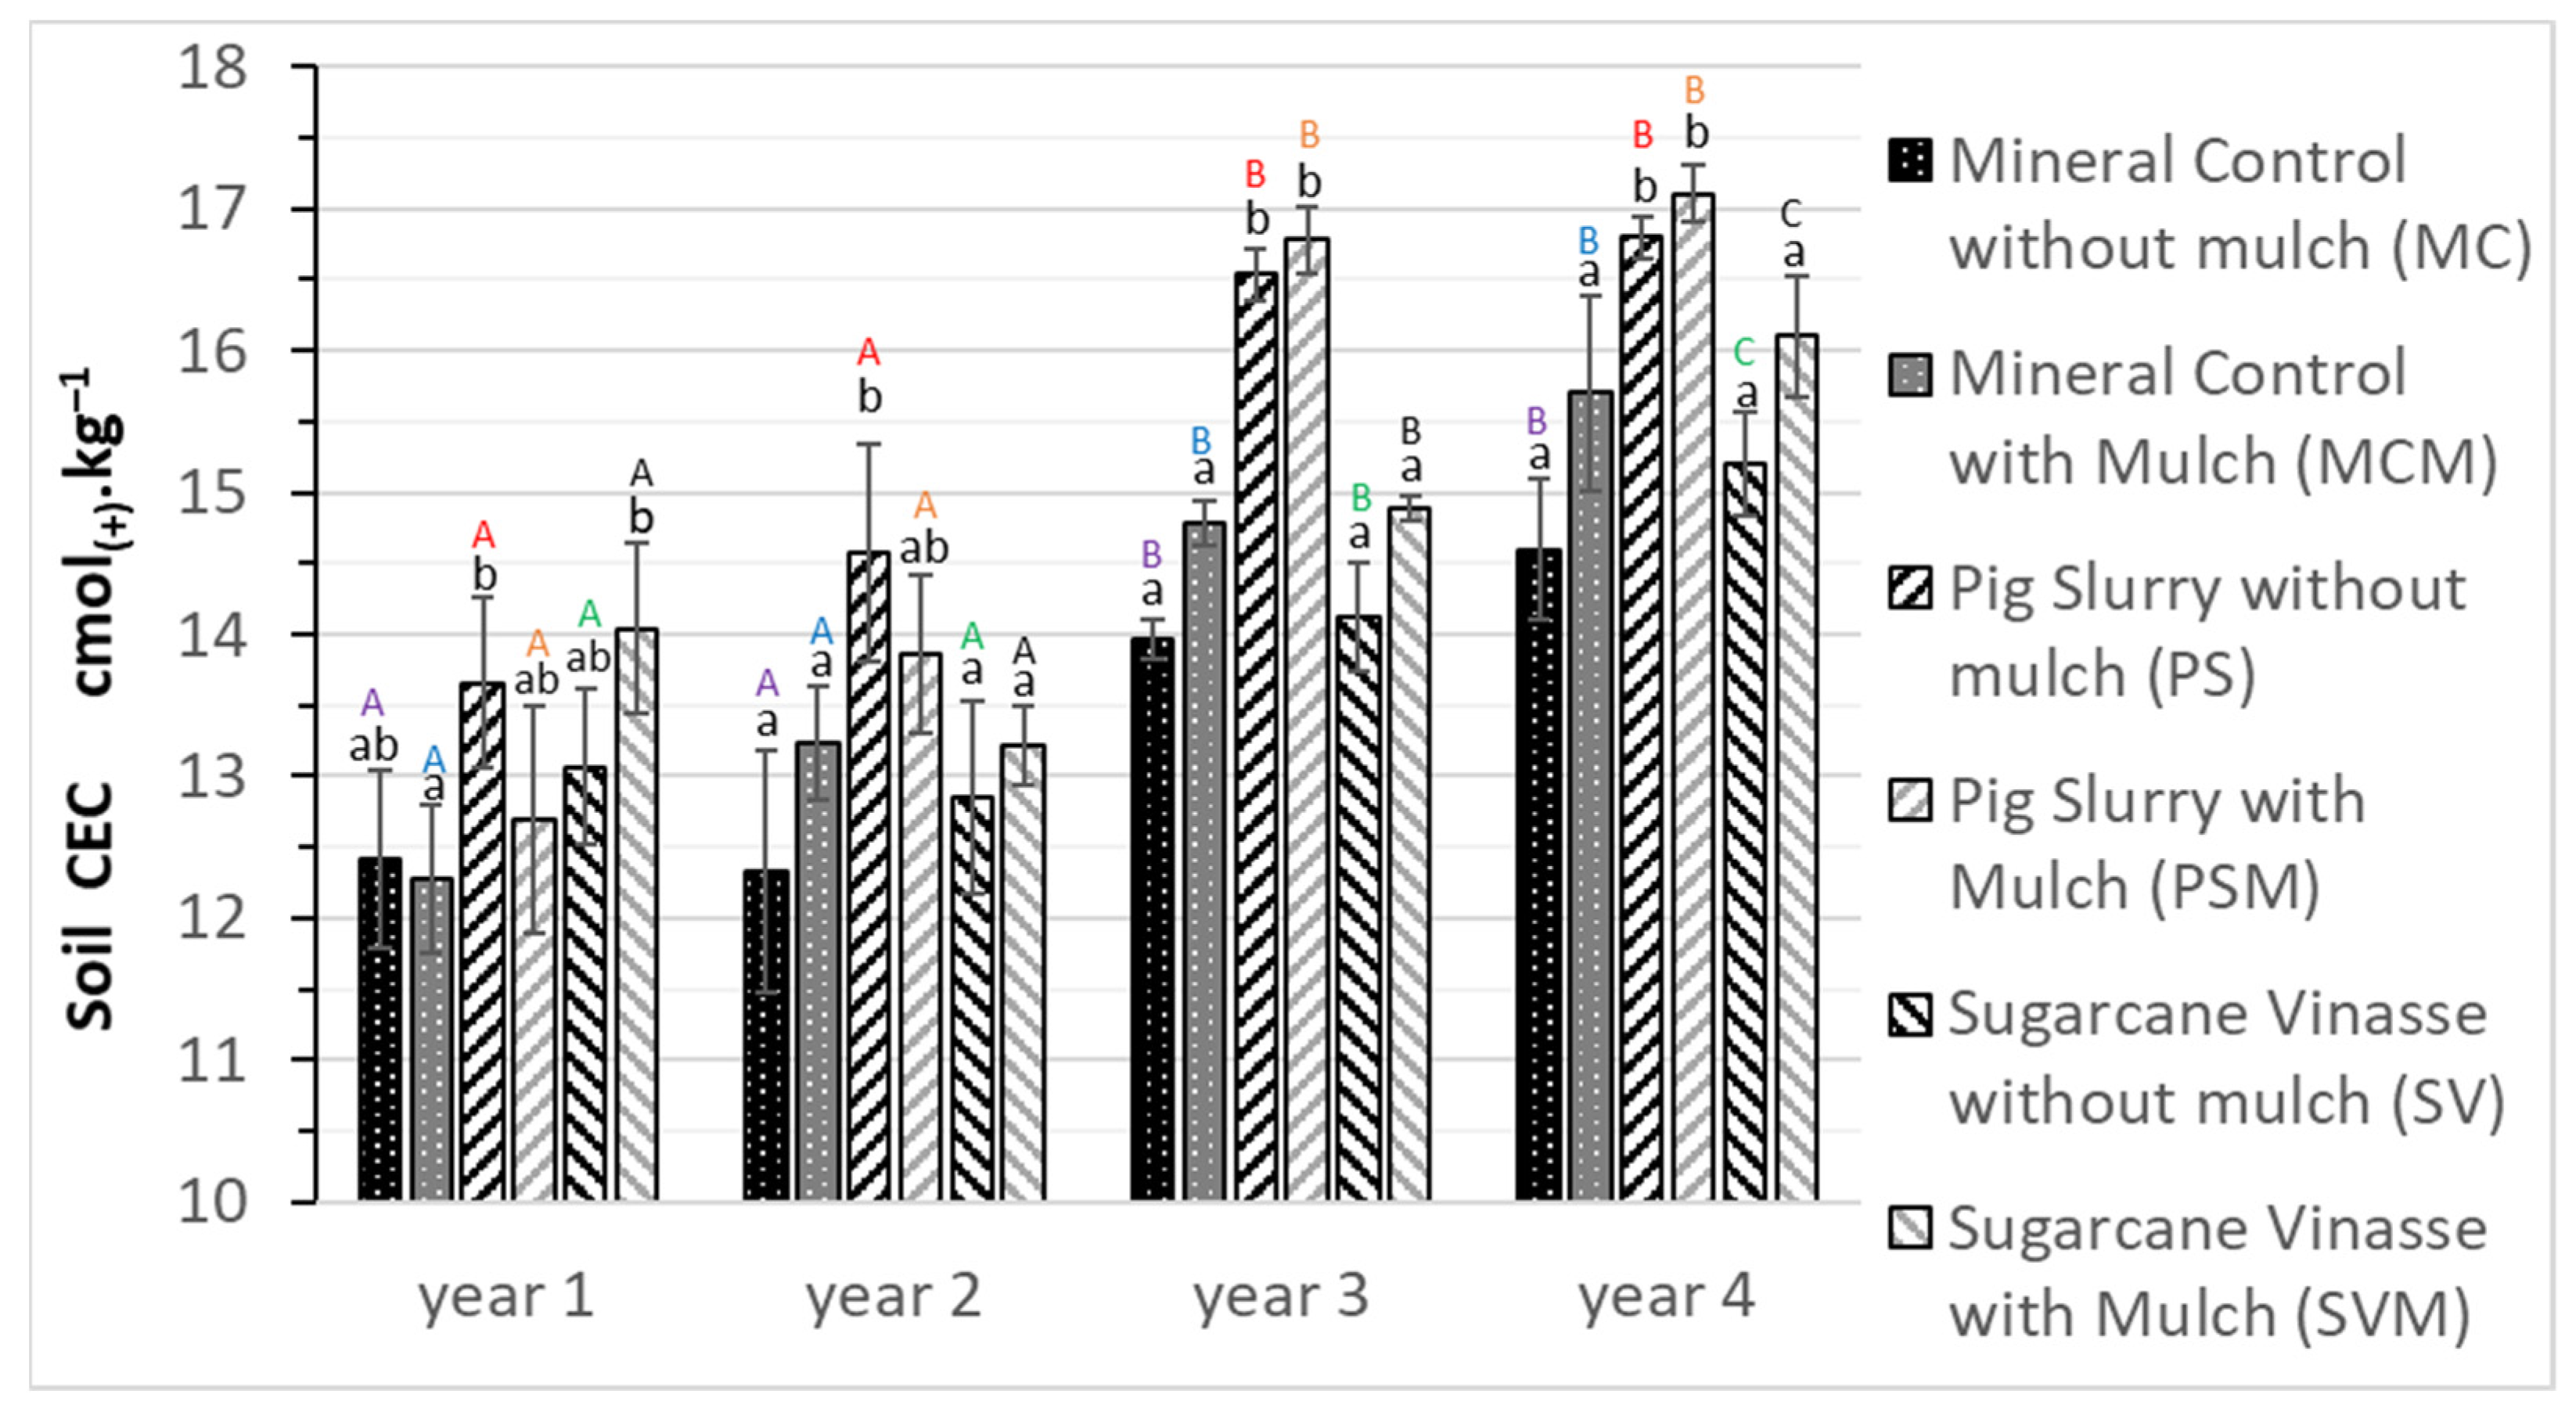
3.2. Organic Carbon Content, pH and Cation Exchange Capacity

The soil pHw measured in the different treatments differed from year 3 onward (Figure 2). In years 1 and 2, the soil pHw was statistically identical in all treatments, ranging between 5.96 and 6.31. In year 3, the soil pHw of the PS, PSM, SV and SVM treatments was statistically similar, ranging between 6.55 and 6.66, but was significantly higher than in the MC and MCM treatments, which ranged between 6.08 and 6.18. In year 4, the soil pHw of the PS and PSM treatments ranged from 6.71 to 6.77 and was statistically higher than in the SV treatments, which ranged from 6.55 to 6.60. In years 3 and 4, the soil pHw of the PS, PSM, SV, and SVM treatments was significantly higher than that of the MC and MCM treatments, ranging from 6.09 to 6.10, whereas the soil pHw of the MC and MCM treatments was statistically similar in all four years. The soil pHw of the PS and PSM treatments increased significantly between years 1 and 2, ranging from 6.27 to 6.31, and years 3 and 4, ranging from 6.55 to 6.77. The soil pHw of the SV and SVM treatments increased significantly between years 1 and ranging from 6.20 to 6.30, and years 3 and 4, ranging from 6.55 to 6.67.
The soil pH KCl measured under the different treatments differed from year 3 onward (Figure 2). In years 1 and 2, the soil pH KCl was statistically identical under all treatments and ranged between 4.81 and 5.40. In year 3, the soil pH KCl under the PS, PSM, SV, and SVM treatments was statistically similar and ranged from 5.32 to 5.58 but, except for the SV treatment, it was significantly higher than under the MC and MCM treatments, which ranged from 5.08 to 5.11. In year 4, the soil pH KCl under the PS and PSM treatments, which ranged from 5.70 to 5.79, was statistically higher than that of the SV treatments, which ranged from 5.45 to 5.55. The soil pH KCl of the PS, PSM, SV, and SVM treatments was significantly higher than that of the MC and MCM treatments, ranging from 5.08 to 5.11. The soil pH KCl of the MC and MCM treatments was statistically similar in all four years. The soil pH KCl of the PS and PSM treatments increased significantly between years 1 and 2, ranging from 5.28 to 5.40, and year 4, ranging from 5.70 to 5.79; whereas that in year 3 did not significantly differ from that in year 4. The soil pH KCl of the SV and SVM treatments did not significantly differ between the four years and ranged from 5.25 to 5.55, except in the SV treatment in year 1 and year 4 and in the SVM treatment in year 2 and year 4.
Except for the PS and PSM treatments, soil organic carbon content was only slightly affected by the treatments (Figure 3). Soil organic carbon levels did not differ significantly in years 1 and 2 in all treatments and ranged from 17.8 to 23.1 g·kg−1. The soil organic carbon contents under the PS and PSM treatments were statistically significantly higher than under the MC and MCM treatments in years 3 and 4 and ranged from 24.2 to 25.3 g·kg−1, and were also higher under SVM in year 4. In year 4, the soil organic carbon contents of the PS and PSM treatments ranged from 25.0 to 25.3 g·kg−1 and were also significantly higher than those of the SV and SVM treatments, which ranged from 20.1 to 22.2 g·kg−1. The soil organic carbon contents of the SV and SVM treatments were always statistically similar to those under the MC and MCM treatments except under the SVM treatment, which were higher in year 4. No statistically significant difference was observed between the soil organic carbon contents under the treatments with or without mulch in all four years. The soil organic carbon contents of the MC and MCM treatments were similar in all four years and ranged between 19.0 and 20.3 g·kg−1. In year 4, the soil organic carbon contents under the PS and PSM treatments were significantly higher than in year 1. The soil organic carbon contents under the SV and SVM treatments did not statistically differ in any of the four years.
Soil cation exchange capacity (CEC) only increased from year 3 onward in the PS and PSM treatments (Figure 4). Soil CEC did not differ significantly between treatments with or without mulch in the four years. In year 1, only the CEC of the PS and SVM treatments, which ranged from 13.7 to 14.05 cmol(+)·kg−1, was higher than that of the MCM treatment. In year 2, only the CEC of the PS treatment was significantly higher than that of the MC, MCM, SV, and SVM treatments, which ranged between 12.3 and 13.22 cmol(+)·kg−1. In years 3 and 4, the CEC of the PS and PSM treatments, which ranged between 16.57 and 17.15 cmol(+)·kg−1, was statistically higher than that of the MC, MCM, SV, and SVM treatments, between 13.96 and 16.09 cmol(+)·kg−1. In years 3 and 4, the CEC of the all treatments was significantly higher than in years 1 and 2. In year 4, the CEC of the SV and SVM treatments was significantly higher than in year 3.

3.3. Mineral Nitrogen, Available Phosphorus and Exchangeable Potassium

The forms of mineral nitrogen (N-NO3 and N-NH4), available phosphorus (PO-D) and exchangeable potassium (exchangeable K) in the soils were analysed and showed no significant differences (Supplementary Figures S2–S5 respectively). Nitric and ammonium nitrogen contents ranged respectively from 1 to 8 g·kg−1 and from 0.5 to 7.2 g·kg−1 over the four years under the different treatments. PO-D contents ranged from 29 to 54 mg·kg−1. However, the standard deviations were always high and significant differences could thus not to be determined.

4. Discussion

4.1. Effect of Leaving Sugarcane Mulch on the Surface of the Soil

In the present study, no significant and recurrent effect of the presence of mulch on soil properties was identified over the course of the 4 year experiment. The mineral fertilisers applied were solid, millimetre-sized granules that dissolve slowly. These fertilisers cross the mulch layer with little interaction and mainly dissolve once in contact with the soil [24]. Consequently, the mulch does not directly modify the availability of all the elements provided by the chemical fertilisers. These results have been confirmed in many studies which showed no short-term effect of mulch on sugarcane yields in a tropical context, e.g., [25,26]. In contrast, in years 1, 2, and 4, the sugarcane yields obtained with the PS treatment were significantly higher than the yields obtained with the PSM treatment. Organic wastes, such as pig slurry and sugarcane vinasses, are in liquid form. Thus, pig slurry and sugarcane vinasses are partially absorbed by the mulch after application and do not come into immediate contact with the soil. In contrast, under the PS and SV treatments, pig slurry and sugarcane vinasses interact immediately with the soil following their application. However, pig slurry is rich in ammonia nitrogen and, depending on the wind, temperature, and humidity, a significant fraction of this nitrogen may be lost due to ammonia volatilisation [18,24]. In similar situations, mulch increases the efficiency of volatilisation, whereas when in contact with the soil, nitrogen from organic waste is more rapidly immobilised in the soil [11]. Thus, in our study, the quantities of nitrogen incorporated into the soil and then available to the plants are lower in the presence of a mulch. Potassium supplementation in these treatments may not be a reason for yield alteration because there was no loss of this element. Conversely, in years 1, 3, and 4, the SVM treatments led to significantly higher sugarcane yields than the SV treatments. These organic waste products are also in liquid form, but their chemical composition is very different from that of pig slurry. The amounts of nitrogen are low and losses through ammonia volatilisation mainly, but also in other forms (N2O, NOX), in similar situations can be relatively low [27]. In addition, nitrogen supplementation was probably not lost in the form of ammonia because it was supplied in the form of ammonium-nitrate, and our results showed that the mulch did not affect this type of input. Potassium inputs are not modified and were not influenced by the presence or absence of mulch. This confirms the results of [28] who reported better sugarcane yields under similar soil and climatic conditions when vinasse was incorporated directly in the surface soil. Finally, under all treatments, the main chemical properties of the soils, pHw and pH KCl, cation exchange capacity, and organic carbon did not differ significantly in any of the four years with and without mulch. Indeed, as mulch is almost completely mineralised after one year, only the associated mineral elements are incorporated into the soil but do not modify these properties. Thus, in each year and after four years, regardless of the treatments, the mineral elements provided by the mulch did not significantly improve the soil properties or yields of the sugarcane crop.

4.2. Effects of Fertilisation Strategies on Yield or Soil Properties

Generally, the PS, PSM, SV, and SVM treatments did not produce better yields than the MC and MCM treatments. The chemical compositions of these organic waste products are very different. However, the objective of the mineral supplementations was to maximise the quantities of organic waste products supplied, without significantly exceeding the total reference quantities supplied by MC and MCM. Thus, in each year, optimisation of the mineral supplementations allowed similar yields to be obtained. Under the same soil and climatic conditions, and using doses close to those used in the present study, better yields with high doses of vinasse have been reported [28]. However, their mineral supplementation was higher and their total nutrient inputs were not comparable with their control, which was the case in our study. Similar results have been reported for inputs of pig slurry for other crops in both tropical and temperate contexts [3]. Conversely, other authors observed no changes in yield when mineral inputs were comparable to those used in controls [12,29]. The reliability of calculations of the necessary supplementary fertilisation is mainly constrained by the availability of mineral elements provided by the organic waste products. Indeed, each organic waste product has its own mineralisation kinetics which depend on soil and climatic parameters. The reported effects of organic waste products on soil productivity and associated yields are clearly only observed with large amounts of such products [10,28] and vary with the context and type of crop. Crops were reported to respond more positively to organic waste products when the input of N was relatively high, but the response was relatively low in the first three years [6]. On an Oxisol in Brazil, sewage sludge was shown to be able to partially replace N fertilisation and to be able to completely replace phosphorus and micronutrient fertilisation [30]. Some crops can better synchronise their nutrient demands with the slow release of nutrients from organic waste products [6]. Sugarcane requires high nutrient inputs because it exports large amounts of biomass annually [8,11]. For this purpose, it develops a root system that partially renews itself each year and explores large volumes of soil since rooting depths can exceed one metre when soil thickness makes this possible [17]. Thus, after four years, it is possible to reduce mineral fertiliser inputs to the sugarcane crop by judiciously combining organic wastes with minimal mineral supplementation. However, this does not improve yields.
The SV and SVM treatments supplied significantly more potassium than the other treatments, but there was no significant difference in the concentration of exchangeable potassium in the soil between the treatments. Furthermore, the yields of the SV and SVM treatments were no higher than the yields of other treatments. Several studies have shown that soil potassium analyses are not well correlated with sugarcane yields [19,31,32]. In very clayey soils, such as the Nitisol in our study, potassium inputs above 225 kg·ha−1 did not increase yields [32]. In contrast, yields correlated well with the amount of nitrogen applied [33]. In our study, the yields produced by SV and SVM were therefore limited by nitrogen and phosphorus inputs. Soil properties (pH, CEC, org. C) were not modified after four years of the MC and MCM treatments. These results are in line with those reported under similar agronomic and pedoclimatic conditions [12,29,30]. Indeed, under many contrasting soil and climatic conditions, the use of mineral fertilisers for periods of less than five years has been shown to have no impact on soil properties [3,10,34].
The PS and PSM treatments resulted in significant increases in pHw and pH KCl, organic carbon content, and CEC after four years. The SV and SVM treatments also increased pHw and pH KCl after four years, but the increase was less pronounced than for PS and PSM. These results are consistent with those observed in most agronomic and pedoclimatic situations [5,9,10]. Furthermore, increases in CEC are often associated with increases in organic carbon content [5]. The increase in soil organic carbon content is the result of the amount of organic carbon supplied by the organic waste and its characteristics (stability, mineralisation rate, C/N) [2,3]. The mineralisation of organic carbon also increases pH and the subsequent production of OH- ions by ligand exchange. The addition of basic cations (Ca2+, Mg2+, K+) also increases the soil pH [35]. Nevertheless, changes in pHw and pH KCl depend to a much greater extent on the initial soil characteristics, especially mineralogy [36], in addition to the characteristics of the organic waste product. However, these impacts are often observed after longer periods of time and also at greater soil depths. Indeed, the impacts on soil properties measured in our study were limited to the surface layer (0–10 cm). In longer-term studies, the observed effects were more pronounced and the doses of organic wastes applied exceeded crop needs in all years [3,5].

5. Conclusions

We measured improvements in several essential soil properties (pH, organic carbon content, and CEC) after four years of organic waste application to a sugarcane crop. In addition, leaving mulch in the field increased sugarcane yields when sugarcane vinasse was applied. Conversely, yields were lower when pig manure was applied in the presence of mulch. Replacing part of the optimal mineral fertilisation with two types of judiciously supplemented organic wastes should thus allow sugarcane yields to be maintained for four years and probably longer. This practice reduces the use of mineral fertilisers and recycles organic waste products. These scientific facts are generally known, but their application is rendered difficult by the lack of knowledge of (i) the characteristics of organic waste products, particularly their mineralisation; (ii) interactions with mulch; and (iii) precise calculation of mineral complementation to balance nutrient inputs. Advancing our knowledge in these three directions will facilitate the development and/or optimisation of soil ecosystem services and the recycling of organic wastes.

Supplementary Materials

The following are available online at www.mdpi.com/article/10.3390/agriculture11100985/s1, Figure S1: Average monthly rainfall (mm) and temperature (°C), Figure S2: KCl extraction of soil nitrate (N-NO3), for each treatment in all four years. Error bars correspond to the standard deviation between replicates for each treatment. The same letters indicate no significant differences between two treatments in a given year. Lower case letters compare treatment in the same year and upper case letters compare treatments between years, Figure S3: KCl extraction of soil ammonium (N-NH4) under each treatment in all four years. Error bars correspond to the standard deviation between replicates for each treatment. Identical letters indicate no significant differences between two treatments in a given year. Small letters compare treatment in the same year and capital letters compare treatments between years, Figure S4: soil exchangeable phosphorus (PO-D) determined using the Olsen–Dabin method, for each treatment in all four years. Error bars correspond to the standard deviation between replicates for each treatment. Identical letters indicate no significant differences between two treatments in a given year. Small letters compare treatment in a given year and capital letters compare treatments between years, Figure S5: Soil exchangeable potassium (ex. K), under each treatment in all four years. Error bars correspond to the standard deviation between replicates for each treatment. Identical letters indicate no significant differences between two treatments in a given year. Small letters compare treatment in a given year and capital letters compare treatments between years.

Funding

This research was funded by the Reunion Region and the European Agricultural Guidance and Guarantee Fund (EAGGF, Fonds européen d’orientation et de garantie agricole, French acronym FEOGA).

Institutional Review Board Statement

Not applicable.

Informed Consent Statement

Not applicable.

Acknowledgments

The author thanks Alix Rassaby, and Didier Baret for their help in collecting field data, Pierre François Chabalier for help monitoring the experiment and for technical support, and the three anonymous reviewers for their meaningful contribution to the paper. The author also thanks the plant, soil and water analysis laboratory staff (CIRAD, UPR Recyclage et Risque, Saint-Denis, Reunion Island) for analyses and efficient assistance.

Conflicts of Interest

The author declares no known competing financial interests or personal relationships that could have influenced the work reported in this paper.

References

  1. Wassenaar, T.; Doelsch, E.; Feder, F.; Guerrin, F.; Paillat, J.-M.; Thuriès, L.; Macary, H.S. Returning organic residues to agricultural land (RORAL)—Fuelling the follow-the-technology approach. Agric. Syst. 2014, 124, 60–69. [Google Scholar] [CrossRef]
  2. Feder, F. Irrigation with treated wastewater in humid regions: Effects on Nitisols, sugarcane yield and quality. Agric. Water Manag. 2021, 11, 106733. [Google Scholar] [CrossRef]
  3. Diacono, M.; Montemurro, F. Long-term effects of organic amendments on soil fertility. A review. Agron. Sustain. Dev. 2010, 30, 401–422. [Google Scholar] [CrossRef] [Green Version]
  4. Avadí, A.; Hodomihou, N.R.; Amadji, G.L.; Feder, F. LCA and nutritional assessment of southern Benin market vegetable gardening across the production continuum. Int. J. Life Cycle Assess. 2021, 1–21. [Google Scholar] [CrossRef]
  5. Goss, M.J.; Tubeileh, A.; Goorahoo, D. A review of the use of organic amendments and the risk to human health. Adv. Agron. 2013, 120, 275–379. [Google Scholar] [CrossRef]
  6. Luo, G.; Li, L.; Friman, V.-P.; Guo, J.; Guo, S.; Shen, Q.; Ling, N. Organic amendments increase crop yields by improving microbe-mediated soil functioning of agroecosystems: A meta-analysis. Soil Biol. Biochem. 2018, 124, 105–115. [Google Scholar] [CrossRef]
  7. Feder, F.; Bochu, V.; Findeling, A.; Doelsch, E. Repeated pig manure applications modify nitrate and chloride competition and fluxes in a Nitisol. Sci. Total Environ. 2015, 511, 238–248. [Google Scholar] [CrossRef] [PubMed]
  8. Sousa, J.G.D.A.; Cherubin, M.R.; Cerri, C.E.P.; Cerri, C.C.; Feigl, B.J. Sugar cane straw left in the field during harvest: Decomposition dynamics and composition changes. Soil Res. 2017, 55, 758. [Google Scholar] [CrossRef]
  9. Oueriemmi, H.; Kidd, P.; Trasar-Cepeda, C.; Rodríguez-Garrido, B.; Zoghlami, R.; Ardhaoui, K.; Prieto-Fernández, Á.; Moussa, M. Evaluation of Composted organic wastes and farmyard manure for improving fertility of poor sandy soils in arid regions. Agriculture 2021, 11, 415. [Google Scholar] [CrossRef]
  10. Edmeades, D.C. The long-term effects of manures and fertilisers on soil productivity and quality: A review. Nutr. Cycl. Agroecosyst. 2003, 66, 165–180. [Google Scholar] [CrossRef]
  11. Fracetto, F.; Fracetto, G.; Bertini, S.C.; Cerri, C.C.; Feigl, B.J.; Neto, M.S. Effect of agricultural management on N2O emissions in the Brazilian sugarcane yield. Soil Biol. Biochem. 2017, 109, 205–213. [Google Scholar] [CrossRef]
  12. Meier, E.A.; Thorburn, P.J.; Wegener, M.K.; Basford, K.E. The availability of nitrogen from sugarcane trash on contrasting soils in the wet tropics of North Queensland. Nutr. Cycl. Agroecosyst. 2006, 75, 101–114. [Google Scholar] [CrossRef]
  13. Melo, P.L.A.; Cherubin, M.R.; Gomes, T.C.A.; Lisboa, I.P.; Satiro, L.S.; Cerri, C.E.P.; Siqueira-Neto, M. Straw removal effects on sugarcane root system and stalk yield. Agrononmy 2020, 10, 1048. [Google Scholar] [CrossRef]
  14. Dietrich, G.; Recous, S.; Pinheiro, P.L.; Weiler, D.A.; Schú, A.L.; Rambo, M.R.L.; Giacomini, S.J. Gradient of decomposition in sugarcane mulches of various thicknesses. Soil Tillage Res. 2019, 192, 66–75. [Google Scholar] [CrossRef]
  15. Feder, F. Soil map update: Procedure and problems encountered for the island of Réunion. Catena 2013, 110, 215–224. [Google Scholar] [CrossRef]
  16. IUSS Working Group WRB. World reference base for soil resources 2014, update international soil classification system for naming soils and creating legends for soil maps. In World Soil Resources Reports No. 106; FAO: Rome, Italy, 2015. [Google Scholar]
  17. Leal, R.M.P.; Herpin, U.; da Fonseca, A.F.; Firme, L.P.; Montes, C.R.; Melfi, A. Sodicity and salinity in a Brazilian Oxisol cultivated with sugarcane irrigated with wastewater. Agric. Water Manag. 2009, 96, 307–316. [Google Scholar] [CrossRef]
  18. Pinheiro, P.L.; Recous, S.; Dietrich, G.; Weiler, D.A.; Giovelli, R.L.; Mezzalira, A.P.; Giacomini, S.J. Straw removal reduces the mulch physical barrier and ammonia volatilization after urea application in sugarcane. Atmos. Environ. 2018, 194, 179–187. [Google Scholar] [CrossRef]
  19. Ghube, N.B.; Kadlag, A.D.; Kamble, B.M. Impact of different levels of organic and inorganic fertilizers on growth, yield and quality of preseasonal sugarcane ratoon in Inceptisols. J. Appl. Nat. Sci. 2017, 9, 812–820. [Google Scholar] [CrossRef] [Green Version]
  20. Gillman, G.; Sumpter, E. Modification to the compulsive exchange method for measuring exchange characteristics of soils. Soil Res. 1986, 24, 61. [Google Scholar] [CrossRef]
  21. Feder, F.; Trolard, F.; Bourrié, G.; Klingelhöfer, G. Quantitative Estimation of fougerite green rust in soils and sediments by citrate—Bicarbonate kinetic extractions. Soil Syst. 2018, 2, 54. [Google Scholar] [CrossRef] [Green Version]
  22. Alary, K.; Babre, D.; Caner, L.; Feder, F.; Szwarc, M.; Naudan, M.; Bourgeon, G. Pretreatment of soil samples rich in short-range-order minerals before particle-size analysis by the pipette method. Pedosphere 2013, 23, 20–28. [Google Scholar] [CrossRef]
  23. OriginLab Corporation. OriginPro. Version b9.5.0; OriginLab Corporation: Northampton, MA, USA, 2018. [Google Scholar]
  24. Pan, B.; Lam, S.K.; Mosier, A.; Luo, Y.; Chen, D. Ammonia volatilization from synthetic fertilizers and its mitigation strategies: A global synthesis. Agric. Ecosyst. Environ. 2016, 232, 283–289. [Google Scholar] [CrossRef]
  25. Kumar, V.; Sharma, J.C.; Kumar, M.; Singh, S.K.; Kumar, A. Mulches and nutrients affect the soil environment, crop performance and profitability of cauliflower. J. Anim. Plant Sci. 2019, 29, 194–204. [Google Scholar]
  26. Danga, B.O.; Wakindiki, I.I.C. Effect of placement of straw mulch on soil conservation, nutrient accumulation, and wheat yield in a humid Kenyan highland. J. Trop. Agric. 2009, 47, 30–36. [Google Scholar]
  27. Christofoletti, C.A.; Escher, J.P.; Correia, J.E.; Marinho, J.F.U.; Fontanetti, C.S. Sugarcane vinasse: Environmental implications of its use. Waste Manag. 2013, 33, 2752–2761. [Google Scholar] [CrossRef]
  28. Soobadar, A.; Ng Kee Kwong, K.R. Impact of high rates of vinasse on some pertinent soil characteristics and on sugarcane yield in mauritius. J. Sustain. Agric. 2012, 36, 36–53. [Google Scholar] [CrossRef]
  29. Jiang, Z.-P.; Li, Y.-R.; Wei, G.-P.; Liao, Q.; Su, T.-M.; Meng, Y.-C.; Zhang, H.-Y.; Lu, C.-Y. Effect of long-term vinasse application on physico-chemical properties of sugarcane field soils. Sugar Tech 2012, 14, 412–417. [Google Scholar] [CrossRef]
  30. Melo, W.; Delarica, D.; Guedes, A.; Lavezzo, L.F.; Donha, R.; de Araújo, A.; de Melo, G.M.P.; Macedo, F. Ten years of application of sewage sludge on tropical soil. A balance sheet on agricultural crops and environmental quality. Sci. Total Environ. 2018, 643, 1493–1501. [Google Scholar] [CrossRef] [Green Version]
  31. Filho, J.O. Potassium nutrition of sugarcane. In Potassium in Agriculture; Munson, R.D., Ed.; American Society of Agronomy, Crop Science Society of America, Soil Science Society of America: Madison, WI, USA, 1985; pp. 1045–1062. [Google Scholar] [CrossRef]
  32. Wood, R.A. The roles of nitrogen, phosphorus and Potassium in the production of sugarcane in South Africa. Nutr. Cycl. Agroecosyst. 1990, 26, 89–98. [Google Scholar] [CrossRef]
  33. Zeng, X.-P.; Zhu, K.; Lu, J.-M.; Jiang, Y.; Yang, L.-T.; Xing, Y.-X.; Li, Y.-R. Long-Term effects of different nitrogen levels on growth, yield, and quality in sugarcane. Agronomy 2020, 10, 353. [Google Scholar] [CrossRef] [Green Version]
  34. Diallo, F.; Masse, D.; Diarra, K.; Feder, F. Impact of organic fertilisation on lettuce biomass production according to the cultivation duration in tropical soils. Acta Agric. Scand. Sect. B Plant Soil Sci. 2019, 70, 215–223. [Google Scholar] [CrossRef]
  35. Hargreaves, J.; Adl, M.; Warman, P. A review of the use of composted municipal solid waste in agriculture. Agric. Ecosyst. Environ. 2008, 123, 1–14. [Google Scholar] [CrossRef]
  36. Feder, F.; Oliver, R.; Rakotoarisoa, J.; Muller, B.; Scopel, E. Geochemical Properties of variable charge soil explain the low nitrogen bioavailability. Commun. Soil Sci. Plant Anal. 2020, 51, 2022–2037. [Google Scholar] [CrossRef]
Figure 1. Sugarcane yields obtained with each treatment in the four experimental years. The average yields produced by all the treatments in each year are shown in brackets. Error bars correspond to standard deviations between replications for each treatment (n = 6). Identical letters indicate no significant differences between two treatments. Small letters compare treatments in a given year and capital letters compare treatments between the years.
Agriculture 11 00985 g001
Figure 2. Soil pHw (a) and soil pH KCl (b) under each treatment in the four years. Error bars correspond to the standard deviation between replicates for each treatment. Identical letters indicate no significant differences between two modalities in a given year. Lower case letters compare treatments for the given year and capital letters compare treatments between the years.
Agriculture 11 00985 g002
Figure 3. Soil organic carbon under each treatment in the four years. Error bars correspond to the standard deviation between replicates for each treatment. Identical letters indicate no significant differences between two modalities in a given year. Small letters compare treatment in a given year and capital letters compare treatments between years.
Agriculture 11 00985 g003
Figure 4. Cation exchange capacity (CEC) under each treatment in the four years. Error bars correspond to the standard deviation between replicates for each treatment. Identical letters indicate no significant differences between two modalities in a given year. Small letters compare treatments in a given year and capital letters compare treatments between years.
Agriculture 11 00985 g004
Table 1. Composition and average annual supplies of pig manure, sugarcane vinasse, supplements and mineral fertilisers.
Type of Organic Wastes Pig Slurry (PS)Sugarcane
Vinasse (SV)
Mineral Control (MC)
Major ComponentsNPKNPKNPKCalculation
Concentration (g·kg−1 DM)3417429.62.44317052232(1)
Amount of raw materials applied (t·ha−1)1401400.7(2)
Dry matter contents (g·kg−1)27621000(3)
N-P-K provided (kg·ha−1)12964159832137311936162(4) = (1) × (2) × (3)/1000
Mineral complementation (kg·ha−1)00404040004040(5)
Treatments PS, SV, MC (kg·ha−1)129641991236137311976202(6) = (4) + (5)
Table 2. Physical and chemical characteristics of the studied soil before the experiment; standard deviations (n = 6) are in brackets. PO-D: exchangeable phosphorus (Olsen–Dabin method); AEC: anionic exchange capacity; CEC: cationic exchange capacity; DCB: dithionite-citrate-bicarbonate; ox.: oxalate.
0–10 cm20–30 cm40–60 cm
pHw 6.13(0.11)6.14(0.24)6.35(0.23)
pHKCl 5.03(0.08)5.10(0.15)5.51(0.12)
Org. Cg·kg−119.5(1.9)15.6 (2.0)8.7(1.1)
N totalg·kg−11.77(0.21)1.44(0.26)0.86(0.10)
C/N 11.0(0.2)10.8(0.23)10.1(0.12)
PO−Dmg·kg−141(14.1)34(5.8)23(7.3)
AECcmol(c)·kg−10.54(0.1)0.55(0.1)0.9(0.1)
CECcmol(c)·kg−112.3(0.44)10.7(0.9)9.6(1.6)
Caex.cmol(c)·kg−16.0(0.29)5.5(0.7)5.3(1.0)
Mgex.cmol(c)·kg−12.6(0.11)2.5(0.1)2.2 (0.7)
Kex.cmol(c)·kg−10.5(0.12)0.3(0.1)0.0(0.01)
Naex.cmol(c)·kg−10.3(0.03)0.2(0.06)0.3(0.08)
Clayg·kg−1427(13)449(68.4)374(70.7)
Fine siltsg·kg−1375(4)336(44.5)315(26.1)
Coarse silts g·kg−190(6)90(7.1)128(28.7)
Fine sands g·kg−151(1)52(9.4)71(22.5)
Coarse sand g·kg−157(2)73(11)113(9.5)
Fe(DCB) g·kg−195.2(2.4)95.3(2.5)82.7(4.7)
Al(DCB)g·kg−191.8(2.9)91.9(2.7)92.3(5.7)
Si(DCB)g·kg−13.4(0.3)3.6(0.6)3.8(0.9)
Fe(ox.)g·kg−13.8(0.4)3.9(0.6)3.8(1.0)
Al(ox.)g·kg−18.4(0.3)8.5(0.2)8.5(0.8)
Si(ox.)g·kg−10.9(0.04)0.9(0.08)1.1(0.5)
Publisher’s Note: MDPI stays neutral with regard to jurisdictional claims in published maps and institutional affiliations.

