Article

The Value Chain of Locally Grown Japonica Rice in Mwea, Kenya

1
Japan International Research Center for Agricultural Sciences, Tsukuba 305-8686, Japan
2
The United Graduate School of Agricultural Sciences, Gifu University, Gifu 501-1193, Japan
3
Takenaka Civil Engineering & Construction Co., Ltd., Koto 136-8570, Japan
4
Faculty of Applied Biological Sciences, Gifu University, Gifu 501-1193, Japan
*
Author to whom correspondence should be addressed.
Agriculture 2021, 11(10), 974; https://doi.org/10.3390/agriculture11100974
Submission received: 1 September 2021 / Revised: 4 October 2021 / Accepted: 4 October 2021 / Published: 8 October 2021

Abstract

:
In Kenya, there is an urgent need to strengthen domestic rice production to improve food security. To achieve this, it is necessary to develop a value chain of competitive rice varieties that creates new value over and above that of conventional varieties. In this study, we focused on locally grown japonica rice produced in the Mwea area, which has recently begun to be distributed in Nairobi. Through interviews with Japanese restaurants, Japanese food stores, and consumers as well as interviews with stakeholders in the value chain the market price, consumer acceptability, and profitability of locally grown japonica rice were determined. We evaluated the value chain of locally grown japonica rice based on the interaction between the potential demand and a value chain analysis and examined improvement measures to establish the value chain. The results showed that 76% of consumers who eat staple foods other than rice rated locally grown japonica rice as “very good” or “good”, indicating that it may be acceptable to those who do not usually eat rice. The net profits for locally grown japonica rice were higher than those of conventional rice at the production, processing, and distribution stages, which is an advantage for producers and demonstrates that the elimination of middlemen is effective and highly profitable for each stakeholder. In contrast, the consumer price of locally grown japonica rice was higher than that of conventional rice, indicating that some challenges remain to be overcome. Our estimation approach will allow further study of target values such as selling price in other desired value chains. Together, our findings suggest the potential of the locally grown japonica rice value chain to contribute to the strengthening of domestic rice production.

1. Introduction

Food security is one of the biggest challenges facing Africa, where population growth and economic development have increased in recent years. In the East Africa region, which experiences recurrent droughts, floods, pest infestations, diseases, and food insecurity, ensuring food security is a major challenge, even in Kenya, the leading economy in the region. After maize and wheat, rice is Kenya’s most important grain. It has become an important staple food in urban areas, and in 2008, the year-on-year rate of increase in annual rice consumption was 12%, against 4% for wheat and 1% for maize, the nationwide staple food [1,2,3]. While crop acreage, unit yield, and total volume of rice production have trended sideways since 2012, the volume of rice imports increased by nearly 40% between 2012 and 2020, which was in line with increased consumption. The quantity of rice grown locally in 2020 was 80,000 tons against a consumption of 650,000 tons [4]. Rice consumption in Kenya is therefore over-reliant on the international market, which has significant implications for national food security [2]. Following the 2017 presidential re-election, the Kenyan government made food security one of its four most important policies (Big 4) [5].
The 2008 food price crisis reaffirmed the importance of domestic food value chains in strengthening food security in developing countries [6]. In West Africa, attention has turned towards rice value chains because rice is the most important source of calories in the region [7,8]. In Kenya, the target country of this study, it is expected that the enhancement of domestic rice production will bridge the gap between production and consumption and will improve the country’s food security [9]. According to Atera et al. [2], a rice value chain that benefits all stakeholders must strengthen Kenyan domestic rice production and must improve food security, and the awareness of high-quality competitive varieties must be promoted to strengthen domestic rice production.
In recent years, locally grown japonica rice has become available in Nairobi, the capital city of Kenya. The conventional variety, BW 390, is high-yielding but has a low market price, whereas Basmati 370 is low-yielding with a high market price, and the new variety NERICA is not suitable for cultivation in irrigated areas and has a low market price. Currently, japonica rice is eaten by the Asian community in Nairobi; it has a higher market price than basmati rice despite its non-aromatic quality and low yield and therefore is an attractive variety for producers seeking to increase their production volume [10]. Thus, locally grown japonica rice is highly profitable and competitive, making it a promising crop for small-scale farmers.
A cultivation experiment that compared the production costs of locally grown japonica rice and the conventional rice variety Basmati 370 found that the high-yield, locally grown japonica rice yielded a higher net profit than conventional rice [11]. However, because locally grown japonica rice has been available on the market for only a short time, the market price, marketing benefits, competitiveness, and expansion potential of locally grown japonica rice remain to be clarified.
The main factors influencing the domestic rice value chain in Kenya are high production costs due to inefficient manual farming practices and high material costs. Challenges such as the lack of agricultural machinery and predation by birds have also increased production costs [2,9]. Ndirangu et al. [3] examined the processing stage of the conventional rice value chain in Kenya and analyzed the utilization rate, production capacity, and technology of rice mills; they concluded that the current production capacity of rice mills is sufficient to cope with increasing rice production and noted the importance of improving the utilization rate of rice mills and post-harvesting processes. Nkuba et al. [12] reported that in the neighboring country of Tanzania, inadequate information regarding the rice distribution price, production costs, benefits of marketing, competitiveness, and expansion potential complicated improvements to the rice value chain. Demont [13] described local basmati rice as the dominant rice preferred by Kenyan consumers. Sekiya et al. [14] reported the rejection of most of new rice varieties by Tanzanian farmers due to consumer preference and poor quality.
The Kenyan rice value chain faces two major issues: high production costs and marketing difficulties. Consumer acceptability is important to the successful introduction of new varieties. The production cost has already been discussed and clarified by Watanabe [11]. This study clarified the potential demand for locally grown japonica rice, examined the potential profitability through an analysis of the profit and added value along the value chain, and determined the gap between the potential demand for locally grown japonica rice and the current value chain.
A value chain is a concept that analyzes and compares how all of the activities of a company contribute to the final value of a product [15]. The value chain refers to the extent of the new and added value in a single chain as a result of the main activity being linked to supporting activities, such as technological development and human resources, to enhance main activities, i.e., the procurement of raw materials for manufacturing products (purchasing logistics), the manufacturing and processing of products, the shipping and delivery of products (shipping logistic), the marketing and sale of products to consumers (distribution and sales), and the after-sale service for consumption (service) [15,16].
Based on Porter’s value chain concept, Kaplinsky [17] defined the value chain as “the full range of activities required to bring a product or service from conception, through the intermediary phases of production, delivery to the final consumers, and final disposal after use”. Anandajayasekeram et al. [18] reported that the value chain in the agricultural sector includes all companies and activities engaged in the supply of inputs, production, transportation, processing, and marketing of a particular final agricultural product or closely related agricultural products. Miah [19] reported that the rice value chain concentrates on the linkages among relevant stakeholders from material inputs to processing, distribution, and final consumers in the sequence of production, processing, distribution, and consumption. It is very important to analyze the value chain to identify the related activities of various stakeholders because the value chain focuses on the breakdown of the costs and benefits of the value chain, the major constraints at each stage of the chain, and their relationships.
A value chain analysis is a method of decomposing corporate activities into the individual stakeholder activities at various points in the value chain and clarifying how these activities contribute to the final value by quantitatively understanding the added value and cost of each activity [20]. The main components of a value chain analysis are the mapping and characterizing of stakeholders in the value chain, the evaluation of the relationships and coordination mechanisms that exist among the stakeholders, the calculation of the distribution of stakeholder benefits, and the analysis of further improvements with different stakeholders [21]. A value chain analysis can assess the structural aspects of the value chain, such as the structure of benefits and costs, the flow of products, and their end points [18,19]. The profitability of the value chain was evaluated by comparing the value chain of locally grown japonica rice with that of conventional rice.
The objective of the study was to identify the market price, marketing benefits, competitiveness, and expansion potential of locally grown japonica rice. We clarified business consumer demand, the acceptability of locally grown varieties to general consumers, and the profitability of the value chain of locally grown japonica rice. Then, we discussed the desirable establishment of a locally grown japonica rice value chain and the potential for locally grown japonica rice production to contribute to strengthening domestic rice production.

2. Materials and Methods

2.1. Study Area

Nairobi, the capital city of Kenya, with a population of 4.39 million and an area of 704 km2 [22], is the central city of East Africa. It is the location of the headquarters of the United Nations Environment Programme (UNEP) and the United Nations Human Settlements Programme (UN-HABITAT), and the United Nations Secretariat also has one of its main offices in the city. Due to the presence of many UN centers, the city has become an international city where many international organizations meet and where international conferences are held.
The Mwea region is located 100 km north of Nairobi and is a flat area extending to the south of Mount Kenya, the nation’s highest mountain (5199 m). With an altitude of around 1159 m, the average annual temperature in the Mwea region is ~22 °C, and the average annual rainfall is ~930 mm [23]. The local climate is tropical with two rainy seasons: a long rainy season from March to May and a short one from October to November [24]. Most of the fields in the Mwea region are covered by Vertisols [25]. The soil is a black heavy clay popularly known as “black cotton soil” [26]. Figure 1 shows the location of the capital, Nairobi, and the Mwea region.
The Mwea Irrigation Scheme is the largest irrigation zone in Kenya in terms of area. However, the aging irrigation facilities and outward expansion of paddy fields through the voluntary cultivation of farmers have resulted in serious shortages of irrigation water. A new Yen loan project was established in 2017 to improve facilities and to promote irrigation, with the intention of increasing the total crop acreage from 7860 to 16,920 ha [27]. The main growing season for rice in the Mwea region is July to December, but the absolute shortage of irrigation water has resulted in three cropping periods: from July to December, September to February, and November to April. A total of 86% of all domestically grown rice is produced in the Mwea Irrigation Scheme, including 95% of all domestically grown basmati rice [8]. Basmati 370 is the most popular variety in the Mwea region [28], and 87.7% of the harvested Basmati 370 is made available for sale [29]. Henceforth, the term “conventional rice” refers to Basmati 370. In addition to rice, some farmers produce tomatoes, mung beans, and kale as a double crop.

2.2. Understanding the Market Size and Price of Japonica Rice

The business consumers of japonica rice are Japanese restaurants (including take-out food) and Japanese food stores. We interviewed store owners in Nairobi in December 2016 to obtain information on the market size and price of japonica rice. A total of 12 Japanese restaurants and Japanese food stores were included in the survey. The information collected included the source, quantity, and price of japonica rice as well as the desired quantity, and price, and conditions required for purchasing locally grown japonica rice. The questionnaire is presented in Supplementary Figures, as Figure S1.

2.3. Consumer Acceptability of Locally Grown Japonica Rice

In November 2016, we conducted a face-to-face questionnaire and tasting survey of 171 randomly selected customers at a shopping mall in Nairobi to examine the consumer acceptability of locally grown japonica rice. For tasting, we cooked locally grown japonica rice in a rice cooker and served it as white rice. The target shopping mall was one of the ten shopping malls (10,000–60,000 m2 in size) in the city that attracts large numbers of customers. The shopping mall was located in an area where many middle class and affluent Kenyans and foreigners reside, enabling us to reach a typical target population living in the cosmopolitan city of Nairobi. The questionnaire determined sex, age, ethnicity, staple food items, rice eating frequency, type of rice, rice production area, source of the rice purchased, important points to consider when purchasing rice, experience of eating Japanese food, frequency of eating Japanese food, favorite aspects of Japanese food, and favorite Japanese food. An evaluation was requested after the participants tasted locally grown japonica rice. The interviewees were also asked to state a desired purchase price of the japonica rice and to provide any other necessary information regarding japonica rice. The questionnaire is presented as Figure S2.

2.4. Understanding the Profitability of the Value Chain of Locally Grown Japonica Rice

To understand the profitability of the value chain of locally grown japonica rice, we conducted interviews with stakeholders in the value chain. As a comparison, we also surveyed the conventional rice value chain in the Mwea region.
Because locally grown japonica rice was produced at the Mwea Irrigation Agricultural Development Center (MIAD) in the Mwea region and was sold at Japanese food store A in Nairobi, which is a major stakeholder, we interviewed MIAD and the owners of Japanese food store A to identify the purchase and selling prices in June and July 2017.
For the conventional rice value chain in the Mwea region, interviews were conducted with stakeholders, including private rice mills, the Mwea Rice Mills (MRM), and the Mwea Rice Growers Multi-Purpose Co-operative Society (MRGM). The MRM is a state -owned corporation under the jurisdiction of the National Irrigation Board (NIB). The MRGM is the largest rice growers’ cooperative in the Mwea region and provides services related to rice production, processing, and marketing to its members. In recent years, the number of private rice mills has increased in the Mwea region, and in addition to the MRM and MRGM, there were six other rice mills with a relatively large processing capacity of 1.5 tons per hour or more. We interviewed two of the private rice mills, the MRM and MRGM, in April and June–July 2017, to determine their methods of milling, drying, storage, transportation, sales, purchase prices, and selling prices.
We conducted a questionnaire survey of six farmers on 19–20 October 2016. Questions were asked to determine the cultivar, selling price, and selling method. In addition, we also recorded the sale prices at retail stores in Mwea and Nairobi.
The production costs of locally grown japonica rice and conventional rice were taken from Watanabe et al. [11].
The analysis method used in this study was a value chain analysis. We used value chain analysis to identify the relevant stakeholders along the value chain and hierarchically divided the value chain into production, processing, distribution, and consumption stages based on the roles of each stakeholder and the relationships among them. Then, we systematically illustrated each of these flows separately for unprocessed rice and milled rice. We also calculated the benefits, costs, and the added value generated by each stakeholder at each stage of the value chain and evaluated the value chain of locally grown japonica rice compared to that of conventional rice, including the distribution and structure of benefits and costs. Based on Miah [19], Pavithra et al. [30], and Linn et al. [31], we calculated the net profit and value-added for each stakeholder in the main value chain using the equations discussed below. The Kenyan shilling (KSh) is the local currency, where KSh 1 is roughly equivalent to USD 0.00966.
Net profit = Gross profitCost
Gross profit = SalesCost of goods sold
Value-added ratio (%) = Gross profit/Purchase price × 100
where cost of goods sold adopts the purchase price according to the wholesale and retail markets, and Sales is the selling price.

3. Results and Discussion

3.1. Market Size and Price of Japonica Rice

Valid responses were obtained from 10 of the 12 stores. Table 1 shows the sourcing country and procurement volume. The sourcing countries were China, Korea, Uganda, Italy, and Kenya. The japonica rice procured in Kenya is locally grown and is produced at MIAD. Japanese restaurants and food store J was also engaged in wholesale business and handled imports from Korea in containers. Excluding this store, the monthly procurement volume per store was 331 kg. Because the monthly procurement of locally grown japonica rice was only 200 kg at two stores, more than 90% of the rice was imported.
Figure 2 shows the price of japonica rice purchased by each store from each souring country. The prices were 150–200 KSh/kg (1.4–1.9 USD/kg), 200–300 KSh/kg (1.9–2.9 USD/kg), and 250–300 KSh/kg (2.4–2.9 USD/kg) for Uganda, Korea, and China, respectively, and the procurement prices varied from store to store and even within the same store. Imported rice from the neighboring country of Uganda was occasionally cheaper than locally grown japonica rice. One respondent answered that the procurement price was 150 KSh/kg (1.4 USD/kg), whereas others answered that it was 200 KSh/kg (1.9 USD/kg). Ugandan rice was the cheapest at 150 KSh/kg (1.4 USD/kg), followed by locally grown japonica rice.

3.2. Consumer Acceptabiltiy of Locally Grown Japonica Rice

There were 122 valid responses (males: 33 (27%) and females: 89 (73%)). Among the respondents, 45% were in their 20s, 33% were in their 30s, and 12% were in their 40s. In terms of ethnicity, 49% were Kenyan, 10% were from other African countries, 16% were European, and 12% were both Asian and Indian.
Figure 3 lists the staple foods eaten by the respondents (multiple responses). Of the 122 respondents, 71% (87) cited rice as a staple food (hereafter, rice group), indicating that it is widely consumed by Kenyans, non-Kenyan Africans, Europeans, Asians, Indians, and Arabs. The number of respondents who answered “rice” greatly exceeded those who answered “Ugali” (corn flour kneaded with hot water) [32], which is a traditional staple food, as well as Chapati and Githeri, which are eaten in East Africa. This suggests that the custom of eating rice is widespread among the middle and affluent classes in Nairobi. Among the 87 respondents in the rice group, 32 were Kenyans, about 1.4 times as many as the 23 who ate Ugali as a staple food. This indicates that middle-class and affluent Kenyans are shifting from traditional staple foods to rice.
Figure 4 summarizes the results of the tasting evaluation of locally grown japonica rice by consumers from different staple food groups. Overall, 57% of those whose staple food was rice had ratings of “very good” or “good”, whereas the value for those whose staple food was something other than rice (hereafter, the non-rice group) was 76%, and 10% of the respondents in the rice group and 11% in the non-rice group rated it as “dislike”. Overall, about 90% of all respondents rated the food as acceptable. This shows that even those who do not normally eat rice may eat locally grown japonica rice, which indicates that this rice could become a good staple food for those who do not normally eat rice. 
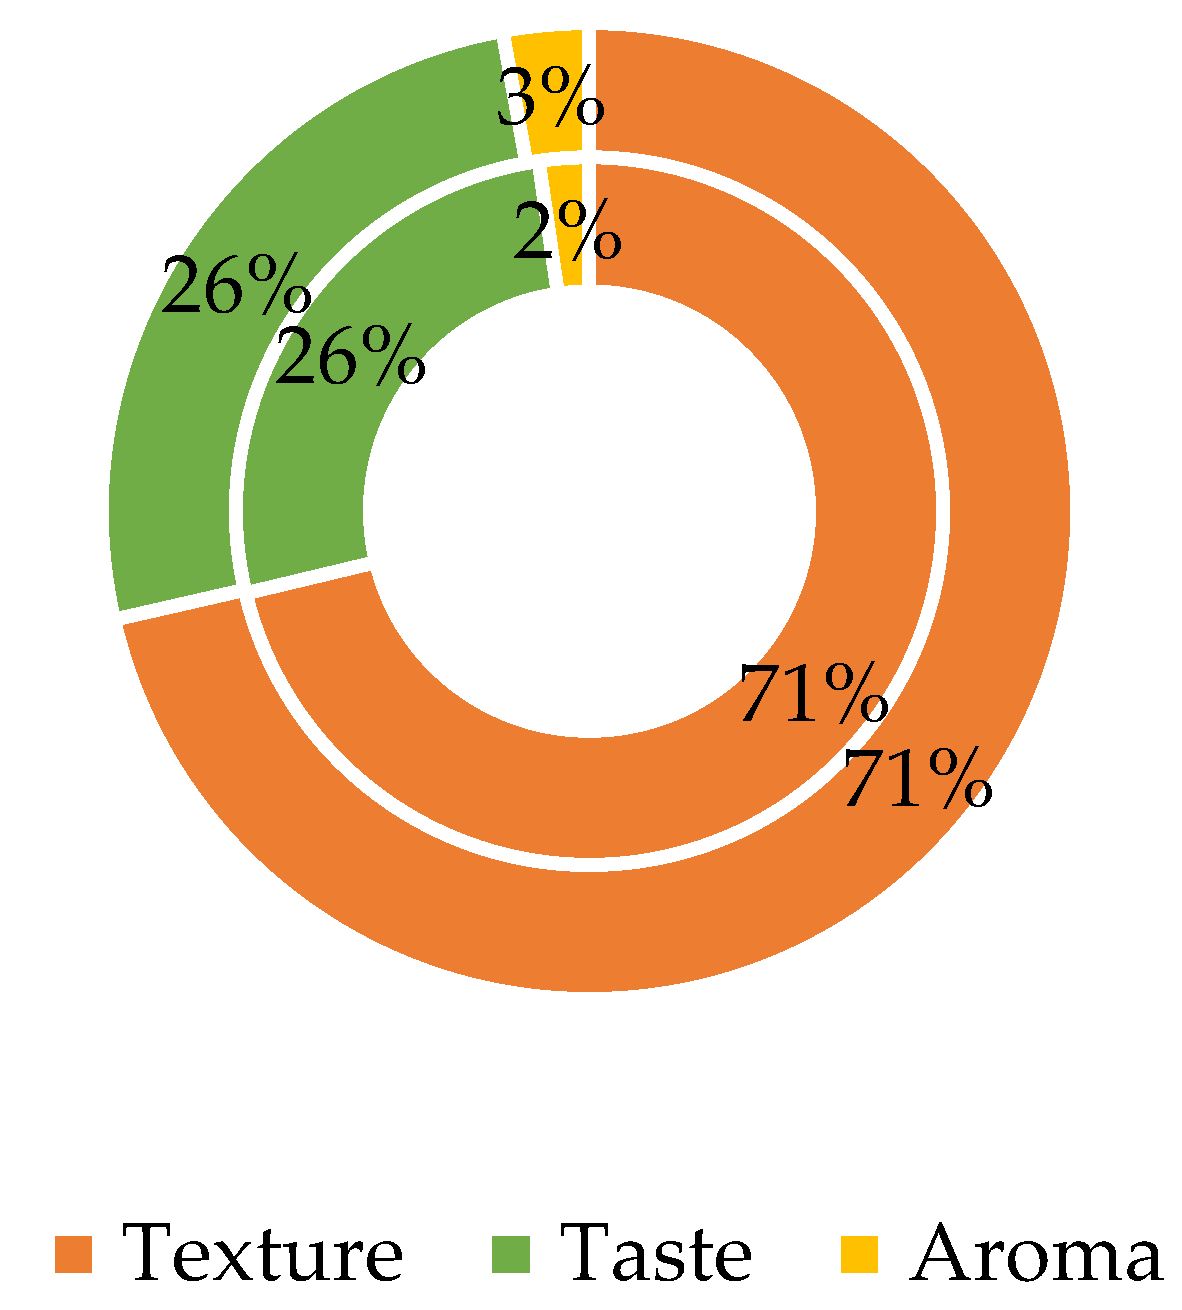
Figure 5 shows the positive aspects of locally grown japonica rice that were identified through tasting. Regardless of group, 71% of respondents answered “texture”, 26% answered “taste”, and 3% answered “aroma”. Notably, “texture” received a high rating because this rice has a slightly sticky texture.
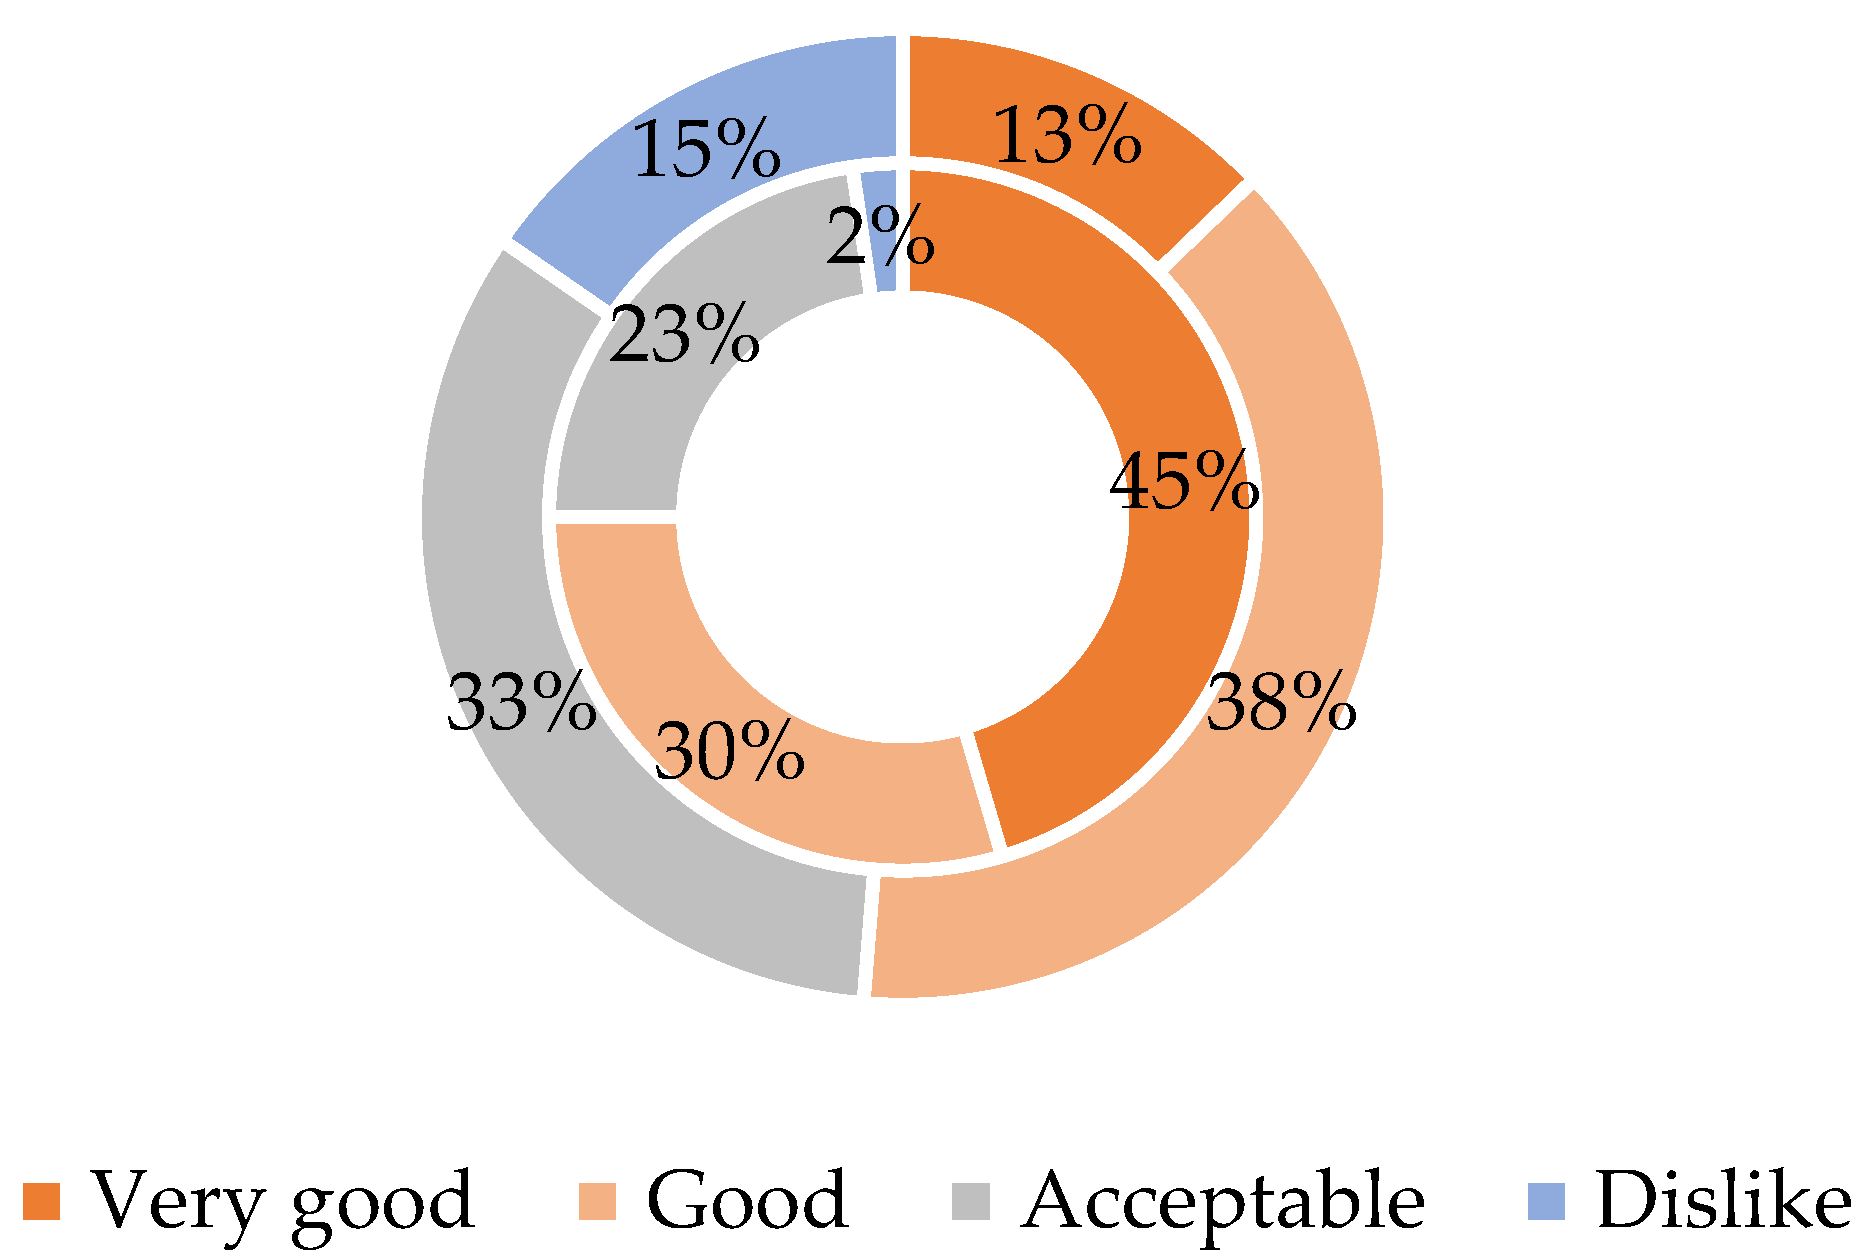
Figure 6 summarizes the tasting evaluation of this rice according to the differences in the experience of eating Japanese food. The “very good” rating was selected by 45% of those who had eaten Japanese food, while only 13% of those who had not eaten Japanese food rated it as “very good”, a difference of 32%. The former group was more likely to have a high opinion of this rice. In terms of the favorable evaluations of “very good” and “good”, 75% of those in the first group and only 51% of those in the latter group had a favorable evaluation. Even among those in the second group, about half of them gave a favorable evaluation of this rice.
Sekiya et al. [14] reported that farmers reject most new varieties because they are not yet widely accepted by consumers; however, we found that locally grown japonica rice in Nairobi was acceptable by consumers to some extent.
Atera et al. [2] noted that to strengthen domestic rice production, it is necessary to brand and recommend competitive and high-quality rice varieties. Our results indicate that locally grown japonica rice may be widely accepted by consumers. Because the market price of this rice is higher than that of conventional rice and because its procurement price is lower than that of imported japonica rice, it can be considered to be a new competitive variety.

3.3. Profitability of the Rice Value Chain

The results of a value chain analysis are shown in Figure 7. The main stakeholders in the locally grown japonica rice value chain were identified as MIAD, Japanese food store A in Nairobi, and consumers. The rice was cultivated by MIAD, and the harvested rice, after threshing, sorting, and bagging, was transported to a warehouse located at MIAD. After drying the rice in the sun near the warehouse, it was bagged, stored in the warehouse, and sold to Japanese food store A in Nairobi. The rice was sometimes purchased directly from MIAD by Japanese restaurants in Nairobi and by Japanese residents in Kenya who purchase either milled or unprocessed rice. At MIAD, rice was refined to order for Japanese food store A and was then delivered to them in Nairobi. The store ordered 400 kg milled rice a month, placing its order every few months. Because it was a bulk order, transport costs were included in the cost of the purchase. Japanese food store A decanted the rice into 1 kg bags for sale in its store in Nairobi. Most customers were ordinary Kenyan citizens, with some brokers also making purchases to sell to hotels.
As reported by Muhuyu [9], 99% of the farmers in the Mwea region grow basmati rice. All six farmers interviewed also grew basmati rice, with an average yield of 6.0 tons/ha (unprocessed basis). The purpose of cultivation was to sell it to earn money. The harvested unprocessed rice was purchased by middlemen and was transported to private rice mills. Farmers did not have storage facilities, road conditions were very poor with only a few main roads being paved, and transportation was very scare. The involvement of middlemen made it difficult for farmers to avoid an unprofitable period immediately after harvest, when rice is valued at lower prices, and for farmers to transport their own rice to the mills. For this reason, the middlemen visited the farmers immediately after the harvest, purchased the unprocessed rice for cash, and transported it to private rice mills. This was a major incentive to grow rice for cash-poor farmers. Because the farmers had limited means of transportation, either by commercial transporters (donkey, oxen, tractors, or motorcycles) or by themselves on motorcycles or bicycles, the amount of rice brought to private rice mills directly by farmers was small. In the Mwea region, there were many small-scale private rice mills along the main roads, but most did not have a drying yard. Therefore, rice was dried in the sun in the small spaces between the mills and in the roads beside the main road. Because of this, dirt and debris could be mixed in with the rice during the drying process, and the moisture content of the dried rice was uneven. In addition, the percentage of broken rice was high, and the efficiency and quality of rice milling was poor due to use of old machinery for milling.
Retailers in Nairobi and Mwea purchased milled rice from private rice mills and sold it at 120–150 KSh/kg (1.2–1.4 USD/kg) in Mwea and 150–200 KSh/kg (1.4–1.9 USD/kg) in Nairobi. When the rice was sold in bags, the price was higher than when it was sold by volume. Products with a lower percentage of broken rice were sold at even higher prices. The MRGM has 4000 members in the Mwea region (about 3000 active members) and provides services related to rice production, processing, and marketing, including the transportation of unprocessed rice and the provision of seed, fertilizers, pesticides, for its members. The MRGM had their own storage facilities, drying yards, rice milling and drying facilities, direct sales outlets, and agricultural machinery, such as tractors and combine harvesters. The share of milled rice volume by the MRGM in this region was around 30%. The member farmers did not need to transport it, because the MRGM purchased unprocessed rice from the farmers and transported it to their own storage facility. This rice was sundried to 14% moisture content in a large drying yard owned by the MRGM, and then stored. The rice was dried to 11% moisture content in two dryers before being sold, and then milled using two rice milling machines (processing capacity of 3 and 2 tons/h, respectively) and sold as a bagged product at 170 KSh/kg (1.6 USD/kg), mainly at the directly managed retail store in Mwea. Sometimes buyers from the supermarkets in Nairobi would come to Mwea to purchase rice. Farmers mainly brought unprocessed rice to the MRM using transporters because the MRM themselves did not transport the rice. This rice was purchased by the MRM, dried in two dryers owned by the MRM, and milled in two rice milling machines (both 2.5 tons/h). After milling, the rice was sold to retailers in Nairobi. Some farmers only milled rice at the MRM and sold it to retailers by themselves in Mwea. The cost of milling rice was 2.5 KSh/kg (0.02 USD/kg). The MRM accounted for 100% of the rice milling volume in the Mwea region until 1999, but its share has decreased to around 15% in recent years due to the increase in the number of private rice mills. Ndurangu et al. [3] assessed the production capacity of rice mills, focusing on the processing stage of the conventional rice value chain. Their results showed that the production capacity of the MRM and MRGM, the representative rice mills in the Mwea region, and the rice mills in the region with a processing capacity of more than 1.5 tons/h were almost the same as those reported by Ndirangu et al. [3].
In summary, the main value chain of locally grown japonica rice from production to final consumer was as follows:
(1)
MIAD → Japanese food store A in Nairobi → consumer
The main value chain of conventional rice was as follows:
(2)
Farmer → middlemen → private rice mill → retail store in Mwea → consumer
(3)
Farmer → middlemen → private rice mill → retail store in Nairobi → consumer
(4)
Farmer → MRM → retail store in Nairobi → consumer
(5)
Farmer → MRGM → MRGM direct sales store → consumer
Next, we determined the net profit (KSh/kg) and value-added ratio (%) of each stakeholder in the above value chains (1) to (5), which were calculated using the value chain analysis shown in Figure 7. In cases where there were multiple selling prices, such as with or without bagging, the average value was used. Costs for middlemen, millers, and retailers were taken from Ndirangu et al. [3]. The cost of the direct sales outlet at the MRGM was determined as the sum of the costs of the miller and the retailer. The selling price of unprocessed rice at MIAD for locally grown japonica rice was 90 KSh/kg (0.9 USD/kg), and the selling price of milled rice was 170 KSh/kg (1.6 USD/kg). The milled rice sale price included the transportation cost from MIAD to Japanese food store A in Nairobi. The selling price of conventional rice by farmers to middlemen was 55 KSh/kg (0.5 USD/kg), while it was 65 KSh/kg (0.6 USD/kg) for sales by middlemen to private millers and 115 KSh/kg (1.1 USD/kg) for sales by private millers to retailers. The production cost of locally grown japonica rice (S1 type) at MIAD was 28.75 KSh/kg (0.3 USD/kg), while the production cost of conventional rice for farmers was 22.63 KSh/kg (0.2 USD/kg) [11]. The average unit yield of conventional rice was 6.07 tons/ha in Kenya in 2017 [4]. In value chain (4), we added 1 KSh/kg (0.01 USD/kg) to the production cost of farmers because the farmers paid 1 KSh/kg (0.01 USD/kg) to transporters as a transportation cost for delivery to the MRM.
The stakeholders and the flow of rice for locally grown japonica rice were different from those for conventional rice. The only producer was MIAD, who also milled the rice (and transported it to the retailers), and the retailers were limited to Japanese food store A.
When comparing value chains (1) to (5), the net profit was the largest in the value chain of locally grown japonica rice in the production, processing, and distribution stages. In the processing stage, the value-added ratio was the highest for this chain. At the distribution stage, the value-added ratio was the greatest when the rice was sold at a retail store in Nairobi in the conventional rice value chain (except for [5] MRGM, which was not included in the comparison because it conducted both the processing and distribution stages). The net profit of this value chain was larger than that of conventional rice at all stages, indicating that it was more profitable. In both value chains, the value-added ratio was the highest in the processing stage; therefore, those who were responsible for the rice milling process played a very important role in both chains. In the Mwea region, private rice mills accounted for more than 50% of the total volume of rice handled. Therefore, resolving the issues faced by private rice mills will contribute to the establishment of an efficient value chain.
Mwangi [10] found that locally grown japonica rice is an attractive variety with a higher market price than basmati rice. The consumer purchase prices of such rice and basmati rice in Nairobi were 300 KSh/kg (2.9 USD/kg) and 175 KSh/kg (1.7 USD/kg), respectively, and therefore, the former had a higher market price. Nkuba et al. [17] also noted that it is difficult to make improvements in the rice value chain due to the lack of information regarding price, marketing benefits, competitiveness, and expansion potential. The results of our value chain analysis confirm that, in the production stage, the net profit of locally grown japonica rice is higher than that of any conventional rice value chain. In addition, this rice had a profitability advantage over conventional rice, which indicates the competitiveness and expansion potential of this rice.
We analyzed the market price and consumer acceptability of locally grown japonica rice from the perspective of its potential for market expansion as well as the profit and added value in marketing along the value chain, with the aim of contributing to the strengthening of domestic rice production in Kenya. The former was an analysis of the potential demand for this rice, and the latter was an analysis of the current value chains of this rice and conventional rice. Based on the results, the establishment of a suitable future value chain for locally grown japonica rice was considered from the perspective of an interaction between the potential demand for such rice and the current value chain in terms of both advantages and disadvantages. Taking account of the disadvantages, measures to improve the situation were also discussed.
First, we considered the advantages. We found that the procurement price of locally grown japonica rice was around 40% cheaper than that of imported japonica rice at stores selling japonica rice in Nairobi (190 KSh/kg (1.8 USD/kg) for locally grown japonica rice compared to 200–350 KSh/kg (1.9–3.4 USD/kg) for imported japonica rice excluding some Ugandan rice). In addition, the consumer purchase price of locally grown japonica rice in Nairobi was higher than that of conventional rice (250 KS/kg (2.4 USD/kg) for locally grown japonica rice compared to 175 KSh/kg (1.7 USD/kg) for conventional rice). Moreover, general consumers were more likely to accept the locally grown japonica rice even among those who did not eat rice as a staple food. In addition, using a value chain analysis to compare the net profit and value-added ratio of the value chain of the two rice types, we found that the net profit of locally grown japonica rice was higher in the production, processing, and distribution stages. These findings indicate that this rice is more profitable than conventional rice and is likely be accepted by consumers; thus, it has the potential to become a competitive new value-added variety for the market to expand.
Next, we considered the disadvantages. The results showed that the value chain of locally grown japonica rice was more profitable for the producers than that of conventional rice. Locally grown japonica rice was the second cheapest after Ugandan rice, which cost 150 KSh/kg (1.4 USD/kg). As the demand for locally grown japonica rice increases, the market is expected to expand and the number of relevant stakeholders in each stage will grow. An increase in the number of stakeholders in the process from the producer to the consumer is one factor that ultimately contributes to higher prices for consumers [14,33,34,35]. According to our value chain analysis, the smaller the number of related stakeholders, the larger the net profit of each, and the greater the tendency for the value-added ratio to increase is. In the Mwea region, the desired value chain for locally grown japonica rice was concluded to be a flow from the producer in the production stage, to the miller in the processing stage, to the retailer in the distribution stage, and then to the consumer, without the need for middlemen. This phenomenon is not limited to the locally grown japonica rice value chain but can also be applied to the conventional rice value chain. The consumer price of locally grown japonica rice was higher than that of conventional rice (250 KSh/kg (2.4 USD/kg) for locally grown japonica rice vs. 170–175 KSh/kg (1.6–1.7 USD/kg) for conventional rice in Nairobi). To increase the availability of locally grown japonica rice for general consumers, the consumer price should be made more affordable. Based on the results of Watanabe et al. [11], the production cost can be reduced by 5 KSh/kg (2% of the consumer price). Such a price reduction would require improvements in the production stage as well as other stages, such as processing and distribution.
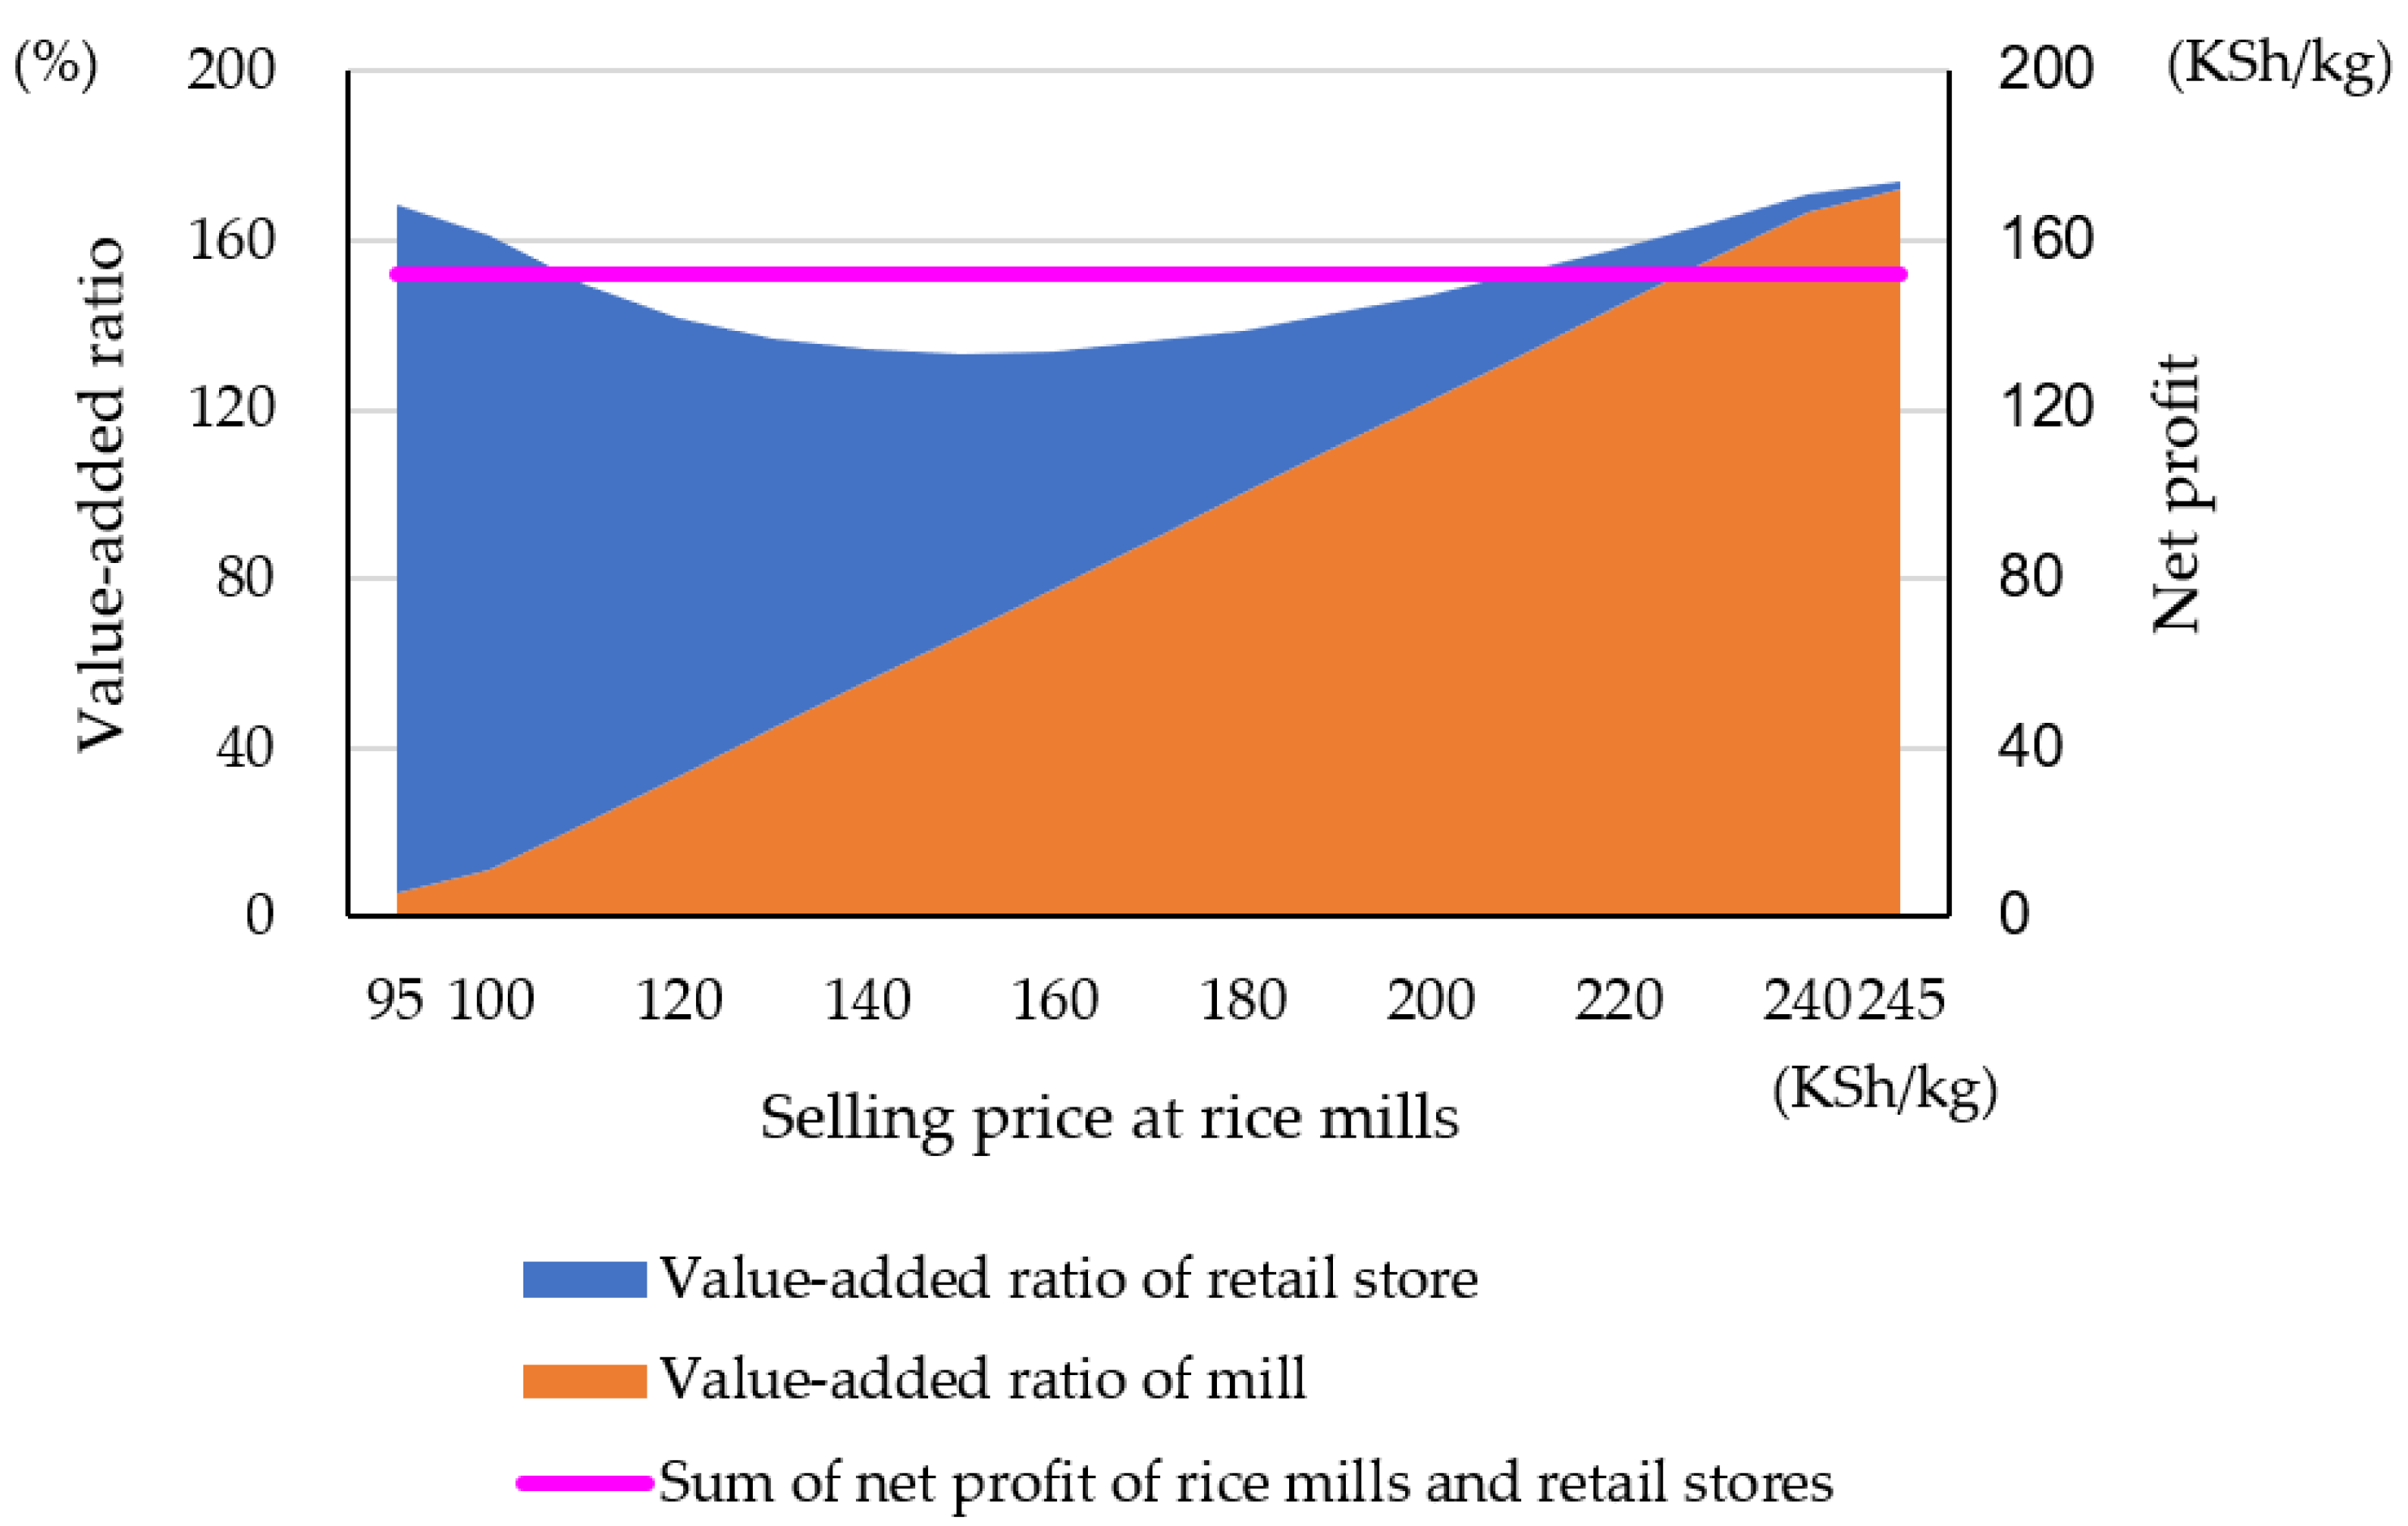
Assuming that locally grown japonica rice is handled in this desirable value chain, the respective value-added ratios of the rice mill and retailer as a function of the change in the selling price of the rice mill are shown in Figure 8, where the producer sells at 90 KSh/kg (0.9 USD/kg) and the retailer sells at 250 KSh/kg (2.4 USD/kg). Although the sum of the net profit of a value chain is constant, the sum of the value-added ratio changes. The value-added ratio is maximized when the net profit of the rice mill is maximized. However, this is not a desirable situation for retailers because the maximum net profit of the miller is equivalent to the minimum net profit of the retailer. A balance between the net profits of the retail store and the net profit of the rice mill is important. Therefore, a well-balanced value chain is in place when the net profit of the rice mill is as large as possible and is acceptable to the retail store. Thus, it is possible to establish a value chain without the intervention of middlemen. Farmers sold their unprocessed rice to middlemen immediately after harvesting because they had no storage facilities and could not transport it themselves due to a lack of transportation. During our field survey in the Mwea area, we heard that many famers require cash promptly because the main harvest season in December occurs immediately before the school year starts in January. In the conventional rice value chain, the only cases that did not involve middlemen were those where the rice was milled by the MRM and MRGM. As shown in Figure 7, the price at which MRM purchased from farmers was 7 KSh/kg (0.07 USD/kg) higher than that of the middlemen, and the price at which MRGM purchased from farmers was 20 KSh/kg (0.2 USD/kg) higher than that of the middlemen. However, it took some time for MRM to pay the farmers. In the case of the MRGM, farmers could not obtain cash immediately after harvesting because the MRGM only paid farmers after deducting the cost they charged the farmers for seeds, fertilizers, and other inputs. The farmers need to obtain cash as soon as possible after harvesting; therefore, they often sold their unprocessed rice to middlemen who purchase it for cash immediately after harvesting. Given this background, it was apparent that the difficulty of accessing rice mills needs to be overcome to improve the value chain of conventional rice.
In the Mwea region, private rice mills accounted for more than half of the total volume of the conventional rice handled. It can therefore be assumed that these private rice mills will start milling locally grown japonica rice as the demand for such rice increases. Therefore, in the processing stage, improving the challenges experienced by private rice mills should be the priority. The improvement of drying sites and methods and the renewal of rice milling machines are required. Public rice mills such as the MRM and MRGM have been installing dryers, but it is difficult for small-scale private rice mills to install them. Accordingly, it would be effective to develop a site for sun drying (dry yard) that can be used jointly by small-scale private rice mills. In addition, as a measure to improve farmer access to rice mills, it would be effective to develop roads for farmers to easily transport unprocessed rice.
We used the rice amounts purchased by each stakeholder (Figure 7) to estimate the reduction targets that would be required for each stakeholder in the locally grown japonica rice value chain to reduce the consumer price to that of conventional rice. According to the results of Watanabe et al. [11], a labor cost reduction of 5 KSh/kg (0.05 USD/kg) could be obtained by addressing bird damage at the locally grown japonica rice production stage. Because the value chain involving MRGM (5) has the largest net profit (52.37 KSh/kg (0.5 USD/kg)) among producers in the conventional rice value chain, we set the net profit to equal or to exceed this net profit and set the producer selling price at 77 KSh/kg (0.7 USD/kg). The value-added ratios of the rice mill and retail store as functions of the change in the rice mill selling price are shown for a producer selling price of 77 KSh/kg (0.7 USD/kg) and a retail price of 175 KSh/kg (1.7 USD/kg) in Figure 9. The net profit reduction rates of the rice mill and retail store were similar, at 42% and 40%, respectively, and that of the producer was 13%. As producer prices continue to decline, the prices of the rice mills and retail stores can be mitigated. Thus, when reductions are made by each stakeholder, the consumer price will become more affordable.
The results shown in Figure 8 were calculated using the real selling price of locally grown japonica rice in the value chain, which was 170 KSh/kg (1.6 USD/kg) at the rice mill (MIAD). The estimated selling price at the rice mill reached 125 KSh/kg (1.2 USD/kg) (Figure 9). The X-axis ranges of Figure 8 and Figure 9 indicate positive net profits for both the rice mill and retail store. The median value of the X-axis of Figure 8 is 170 KSh/kg (1.6 USD/kg), whereas that of Figure 9 is 127 KSh/kg (1.2 USD/kg). Thus, the median value obtained through calculation was similar to the actual selling price. When this estimation was applied to value chain (4), which is associated with MRM, the median value of the estimation was 119 KSh/kg (1.1 USD/kg), compared to the actual MRM selling price of 115 KSh/kg (1.1 USD/kg). It is important to maintain a balance between the net profits of the rice mills and retail stores. Further examination of the actual rice value chain is necessary; however, our results may provide a guide for determining that balance. In contrast, the value-added ratio tended to be low, around the median value of the X-axes of Figure in 8 and 9, suggesting that higher value-added ratios are the less influential in estimating the selling price of rice mills.

4. Conclusions

More than 70% of the respondents answered that rice was their staple food, which confirms that Kenyans are shifting from traditional staple foods to rice. We also found that locally grown japonica rice is acceptable to those who eat other staple foods. As rice becomes more popular as a staple food, the demand for locally grown japonica rice is expected to increase among business consumers such as Japanese restaurants. As the demand for such rice increases, the market is expected to expand, and the number of relevant stakeholders in the production, processing, and distribution stages will grow. However, regardless of rice type, a value chain consisting of a minimum number of stakeholders without middlemen, such as producers in the production stage, mills in the processing stage, retailers in the distribution stage, and finally consumers is more efficient and more profitable for each stakeholder. It is desirable to ensure that the value chain remains close to this form.
The procurement price of locally grown japonica rice (190 KSh/kg (1.8 USD/kg)) was the second cheapest, after Ugandan rice at (150 KSh/kg (1.4 USD/kg)) and was 40% cheaper than that of other imported japonica rice (200–350 KSh/kg (1.9–3.4 USD/kg)). The consumer purchase price of locally grown japonica rice in Nairobi (250 KSh/kg (2.4 USD/kg)) was higher than that of conventional rice (175 KSh/kg (1.7 USD/kg)), indicating its advantage for producers and disadvantage for consumers compared to conventional varieties. Thus, lowering the consumer price of locally grown japonica rice is a critical challenge. It will be necessary to improve each stage of the value chain, such as reducing the production costs at the production stage. Furthermore, the establishment of a desired value chain by eliminating middlemen may be an effective measure for lowering the consumer price. In a desired value chain, it is possible to estimate the selling price, regardless of the rice type, by setting conditions such as the net profit for each stakeholder; these estimates can be used to calculate target reduction rates for net profit. Together, the results of this study will provide a guide for examining potential improvements in the rice value chain. To establish a value chain that does not involve middlemen, it is necessary to overcome the difficulty that farmers face in terms of having access to rice mills.
It is clear that the miller plays a very important role in the value chain and that overcoming the difficulties in the processing stage is essential to improve the quality and efficiency of the value chains. To resolve the challenges of private rice mills, which account for a large share of the volume processed in the Mwea region, there is also a need for support and coordination by local governments and supporting organizations to improve infrastructure and to renew rice milling machines.
The buyers of locally grown japonica rice are Kenyans and Japanese residents as well as middlemen. Although the current market for locally grown japonica rice is presently small, its production will improve the range of choices for purchase and support food crop diversity, which will bring stability to domestic food production [36].
In 2017, the Kenyan government made food security one of its most important policies. Strengthening domestic rice production is an important issue for food security and will secure stable food supplies for the country. The value chain of locally grown japonica rice will need to be restructured to meet the demand, taking our findings into account. This strategy could overcome some of the current difficulties in the rice value chain and will provide a good starting point for improving the conventional rice value chain. The establishment of such a value chain is expected to improve the level of domestic rice production as a whole, which, in turn, will strengthen domestic rice production and will contribute to food security in Kenya.

Supplementary Materials

The following are available online at https://www.mdpi.com/article/10.3390/agriculture11100974/s1, Figure S1: Questionnaire for Japanese restaurant and Japanese food store, Figure S2: Questionnaire for customers at shopping mall.

Author Contributions

Conceptualization, M.W.; methodology, M.W. and Y.S.; formal analysis, M.W.; investigation, M.W., Y.S.; resources, M.W. and Y.S.; writing—original draft preparation, M.W.; writing—review and editing, K.N., I.A., and K.I.; visualization, M.W.; supervision, K.N.; project administration, M.W. and Y.S. All authors have read and agreed to the published version of the manuscript.

Funding

This study was funded by the Ministry of Agriculture, Fisheries and Forestry, Japan, “Study on Rural and Agricultural Development considering Establishment of Food Value Chain (Africa Region)”.

Institutional Review Board Statement

Not applicable.

Informed Consent Statement

Not applicable.

Data Availability Statement

The data presented in this study are available on request from the corresponding author.

Acknowledgments

The authors would like to thank the farmers of Mwea and the representatives of Japanese food store A in Nairobi for their interviews, and to the staff of MIAD for their cooperation in the experimental cultivation of japonica rice. This study commissioned by the Ministry of Agriculture, Forestry and Fisheries, Japan (MAFF) and was conducted by the Japanese Institute of Irrigation and Drainage (JIID), to which one of the authors belongs. We would also like to express our gratitude to JIID and MAFF.

Conflicts of Interest

The authors declare no conflict of interest.

References

  1. Ministry of Agriculture, Livestock and Fisheries, Government of Kenya. National Rice Development Strategy (2008–2013) Revised Edition 2014; Ministry of Agriculture, Livestock and Fisheries, Government of Kenya: Nairobi, Kenya, 2014; pp. 1–44.
  2. Atera, E.A.; Onyancha, F.N.; Majiwa, E.B.O. Production and marketing of rice in Kenya: Challenges and opportunities. J. Dev. Agric. Econ. 2018, 10, 64–70. [Google Scholar]
  3. Ndirangu, S.N.; Oyange, W.A. Analaysis of Millers in Kenya’s Rice Value Chain. IOSR J. Agric. Vet. Sci. 2019, 12, 38–47. [Google Scholar]
  4. USDA_PS&D Online. PSD Data Sets. Available online: https://apps.fas.usda.gov/psdonline/app/index.html#/app/downloads (accessed on 21 August 2021).
  5. Ito, N. [Africa (Kenya) -Focusing on policies related to agriculture and food consumption-] Afurika (Keniya) -Nougyou to syokuryoshouhi ni kansuru seisaku ni tyumoku shite- [Project research report, Agricultural and trade policies of major countries, Agriculture, Forestry and Fisheries Policy Research Institute] Nougyouseisaku Kenkyusho, Syuyoukoku nougyou-bouseki seisaku project kenkyu shiryo. 2020; 2, 1–17. (In Japanese) [Google Scholar]
  6. World Bank. World Development Report 2008: Agriculture for Development; World Bank: Washington, DC, USA, 2008. [Google Scholar]
  7. Macualey, H.; Ramadjita, T. Creal Crops: Rice, Maize, Millet, Sorghum, Wheat. Background Paper. In In Proceedings of the International Conference “Feeding Africa”, Dakar, Senegal, 21–23 October 2015. [Google Scholar]
  8. Soullier, G.; Demont, M.; Aroua, A.; Lancon, F.; Mendez del Villar, P. The state of rice value chain upgrading in West Africe. Glob. Food Secur. 2020, 25, 100365. [Google Scholar] [CrossRef] [PubMed]
  9. Muhunyu, J.G. Is Doubling Rice Production in Kenya by 2018 achievable? J. Dev. Sustain. Agric. 2012, 7, 46–54. [Google Scholar]
  10. Mwangi, M.K. Transformation in Mwea Rice Sector. Available online: https://www.maff.go.jp/primaff/koho/seminar/2017/attach/pdf/171030_03.pdf (accessed on 1 November 2017).
  11. Watanabe, M.; Sumita, Y.; Azechi, I.; Ito, K.; Noda, K. Production costs and benefits of japonica rice in Mwea, Kenya. Agriculture 2021, 11, 629. [Google Scholar] [CrossRef]
  12. Nkuba, J.; Ndunguru, A.; Madulu, R.; Lwezaura, D.; Kajiru, G.; Babu, A.; Chalamila, B.; Ley, G. Rice value chain Analysis in Tanzania: Identification of constraints, opportunities and upgrading strategies. Afr. Crop. Sci. J. 2016, 24, 73–87. [Google Scholar] [CrossRef] [Green Version]
  13. Demont, M. Reversing urban bias in Africa rice markets: A review of 19 National Rice Development Strategies. Glob. Food Secur. 2013, 2, 172–181. [Google Scholar] [CrossRef]
  14. Sekiya, N.; Oizumi, N.; Kessy, T.T.; Fimbo, K.M.J.; Tomitaka, M.; Katsura, K.; Araki, H. Importance of market-oriented research for rice production in Tanzania. A review. Agron. Sustain. Dev. 2020, 40, 7. [Google Scholar] [CrossRef]
  15. Porter, M.E. Competitive Advantage; The Free Press: New York, NY, USA, 1985. [Google Scholar]
  16. Kurihara, S. [A study on a look at the value chain and workers—Tea plantation worker add value and poverty in Sri Lanka-] Baryuchen to roudousya wo meguru ichikosatsu -Suriranka kocha puranteshon nouen roudousya no hukakachi to hinkon. [Collection of Research Treatises, Factory of International Studies, Utsunomiya University] Utsunomiya Daidaku Kokusai Gakubu Kenkyu-Ronsyu. 2015; 40, 1–12. (In Japanese) [Google Scholar]
  17. Kaplinsky, R. Globalisation and unequalisation: What can be learned from value chain analysis? J. Dev. Stud. 2000, 37, 117–147. [Google Scholar] [CrossRef]
  18. Anandajayasekeram, P.; Gebremedhin, B. Integrating Innovation Systems Perspective and Value Chain Analysis in Agricultural Research for Development: Implications and Challenges. Improving Productivity and Market Success of Ethiopia Farmers; Working Paper No. 16; ILRI: Nairobi, Kenya, 2009. [Google Scholar]
  19. Miah, S. Value Chain Analysis of Rice Marketing in Selected Areas of Jamalpur District. Unpublished Master’s Thesis, Agricultural Economics, Bangladesh Agricultural University, Mymensingh, Bangladesh, 2013. [Google Scholar]
  20. Shibuya, I. [Business model of entering companies in agriculture] nougyou ni okeru kigyosannyu no bijinesu moderu. [Agricultural Management Research] Nougyou Keiei Kenkyu. 2010; 47, 29–38. (In Japanese) [Google Scholar]
  21. Rich, K.M.; Ross, R.B.; Baker, A.D.; Negassa, A. Quantifying value chain analysis in the context of livestock systems. Food Policy 2010, 36, 214–222. [Google Scholar] [CrossRef]
  22. Kenyan National Bureau of Statistics, Government of Kenya. Volume II: Distribution of Population by Administrative Units, 2019 Kenya Population and Housing Census; Kenyan National Bureau of Statistics, Government of Kenya: Nairobi, Kenya, 2019.
  23. Oyange, W.A.; Chemining’wa, G.N.; Kanya, J.I.; Njiruh, P.N. Azolla Fern in Mwea irrigation scheme and its potential nitrogen contribution in paddy rice production. J. Agric. Sci. 2019, 11, 30–44. [Google Scholar] [CrossRef] [Green Version]
  24. Narita, D.; Sato, I.; Ogawada, D.; Matsumura, A. Integrating economic measures of adaption effectiveness into climate change interventions: A case study of irrigation development in Mwea, Kenya. PLoS ONE 2020, 15, e0243779. [Google Scholar] [CrossRef] [PubMed]
  25. Kondo, M.; Ota, T.; Wanjogu, R. Physical and chemical properties of Vertisols and soil nutrient management for intensive rice cultivation in the Mwea area in Kenya. Jpn. J. Trop. Agr. 2001, 45, 126–132. [Google Scholar]
  26. Tomizuka, T.; Mwithia, D.; Koskei, V. Secondary horticultural cropping in a paddy field in the Mwea irrigation scheme, Kenya: Different drainage techniques and effect on selected crop yields. Trop. Agr. Develop. 2019, 63, 61–68. [Google Scholar]
  27. Japan International Cooperation Agency. [Singing of a Yen Loan Agreement for the Republic of Kenya] Kenya Kyowakoku Muke Ensyakkan Kashitsuke No Choin. Available online: https://www.jica.go.jp/press/2010/20100817_01.html (accessed on 8 April 2020). (In Japanese)
  28. Samejima, H.; Katsura, K.; Kikuta, M.; Njinju, S.M.; Kimani, J.M.; Yamaguchi, A.; Makihara, D. Analysis of rice yield response to various cropping seasons to develop optimal cropping calendars in Mwea, Kenya. Plant Prod. Sci. 2020, 23, 297–305. [Google Scholar] [CrossRef] [Green Version]
  29. Kihoro, J.; Bosco, N.J.; Murage, H.; Ateka, E.; Makihara, D. Investigating the impact of rice blast disease on the livelihood of the local farmers in greater Mwea region of Kenya. SpringerPlus 2013, 2, 308. [Google Scholar] [CrossRef] [PubMed] [Green Version]
  30. Pavithra, A.S.; Singh, K.M.; Ahmad, N.; Sinha, D.K.; Mishra, R.R. Economic analysis of rice value chain in Bihar and Karunataka states of India. Int. J. Curr. Microbiol. Appl. Sci. 2018, 7, 2738–2747. [Google Scholar] [CrossRef] [Green Version]
  31. Linn, T.; Maenhout, B. Analysis of the operational constraints of the rice value chain in Ayeyarwaddy region, Myanmar. Asian J. Agric. Dev. 2019, 16, 53–76. [Google Scholar]
  32. Sasaki, S. [The impact of multi-national company on agriculture and food system in Kenya] Takokuseki-kigyo no shinsyutsu ga Keniya no nougyou-shoku bunka ni oyobosu eikyou. [Article Series, Meiji University] Meiji Dai Shogaku Ronsou 2015, 97, 197–212. (In Japanese) [Google Scholar]
  33. Nkonya, N.; Barreiro-Hurle, J. Analysis of Incentives and Disincentives for Rice in the United Republic of Tanzania; Technical Notes Series; FAO: Roma, Italy, 2012; pp. 1–50. [Google Scholar]
  34. Eskola, E. Agricultural Marketing and Supply Chain Management in Tanzania: A Case of Study. ESRF Study on Globalization and East Africa Economies; Working Paper Series No. 16; Economic and Social Research Foundation: Dodoma, Tanzania, 2005; pp. 1–67. [Google Scholar]
  35. Nzomoi, J.; Anderson, I. The rice market in East Africa. In Proceedings of the 4th International Conference of the Africa Association of Agricultural Economists, Hammamet, Tunisia, 22–25 September 2013; pp. 1–46. [Google Scholar]
  36. Renard, D.; Tiiman, D. National food production stabilized by crop diversity. Nature 2019, 571, 257–274. [Google Scholar] [CrossRef] [PubMed]
Figure 1. Map of Nairobi and the Mwea region. Source: UN Geospatial (2011).
Agriculture 11 00974 g001
Figure 2. Purchase price of japonica rice paid by Japanese restaurants.
Agriculture 11 00974 g002
Figure 3. Staple foods consumed by questionnaire respondents (n = 144). Multiple responses were allowed.
Agriculture 11 00974 g003
Figure 4. Evaluation of the taste of locally grown japonica rice accounting for staple food type. The inner and outer circles indicate that the staple food is rice (n = 87) or non-rice (n = 35), respectively.
Agriculture 11 00974 g004
Figure 5. Positive aspect of the tasting locally grown japonica rice. The inner and outer circles indicate that the staple food is rice (n = 87) or non-rice (n = 35), respectively.
Agriculture 11 00974 g005
Figure 6. Evaluation of the taste of locally grown japonica rice according to experience of eating Japanese food. The inner and outer circles indicate experience (n = 44) and lack of experience (n = 78) with Japanese food, respectively.
Agriculture 11 00974 g006
Figure 7. Main distribution pathways for locally grown japonica rice and conventional rice. Note: The cost to the farmer includes 1 KSh for transformation for Mwea Rice Mills (MRM).
Agriculture 11 00974 g007
Figure 8. Changes in the sum of the value-added ratio for rice mills and retail stores. The selling prices of the producer and retail store are 90 and 250 KSh/kg, respectively.
Agriculture 11 00974 g008
Figure 9. Changes in the sum of the value-added ratios of rice mills and retail stores. The selling prices of the producer and retail stores were 77 and 175 KSh/kg, respectively.
Agriculture 11 00974 g009
Table 1. Procurement source and amount of unprocessed japonica rice by Japanese restaurants.
RespondentSource CountryProcurement Volume
(kg/month)
Remarks
1Japanese restaurant BUganda300
2Japanese restaurant CChina or Korea300
Uganda150–200
3Japanese restaurant DItaly200
4Japanese restaurant EKorea or Uganda300
5Japanese restaurant FKorea500
Uganda200
6Japanese restaurant GKenya100
7Japanese restaurant HUganda500
8Japanese restaurant IChina300
9Japanese restaurant and food store JKorea333340 tons/year
Uganda80020 kg/week
10Japanese restaurant KKenya100
Publisher’s Note: MDPI stays neutral with regard to jurisdictional claims in published maps and institutional affiliations.

